
Integrating Straw Management and Seeding to Improve Seed Yield and Reduce Environmental Impacts in Soybean Production

 , , and
Abstract
1. Introduction
2. Materials and Methods
2.1. Experimental Site
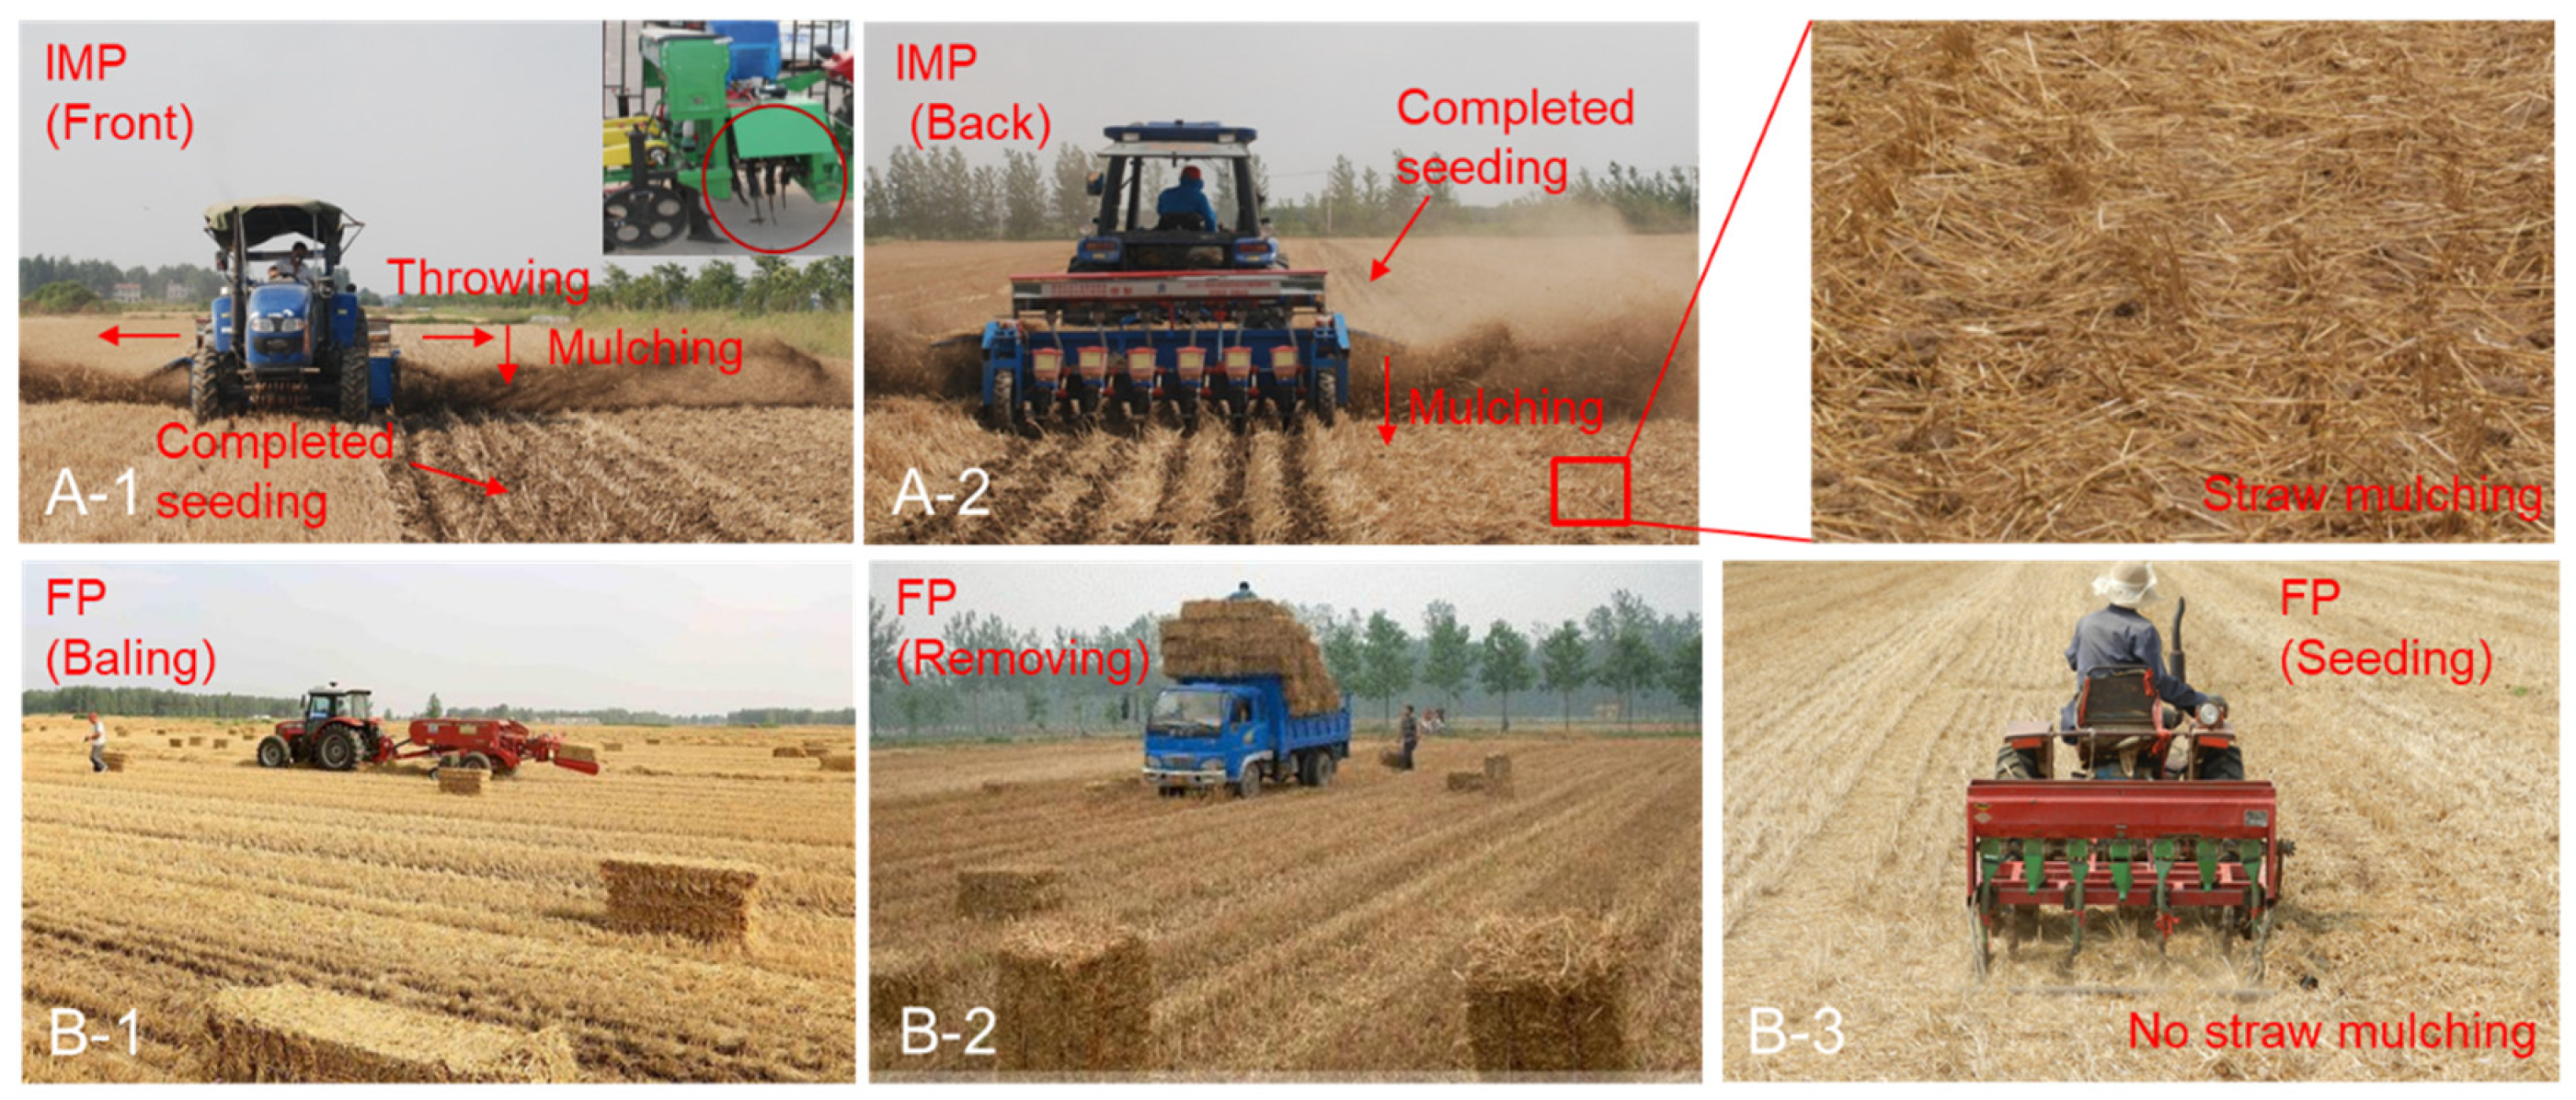
2.2. Experimental Design
2.3. Sampling and Measurements
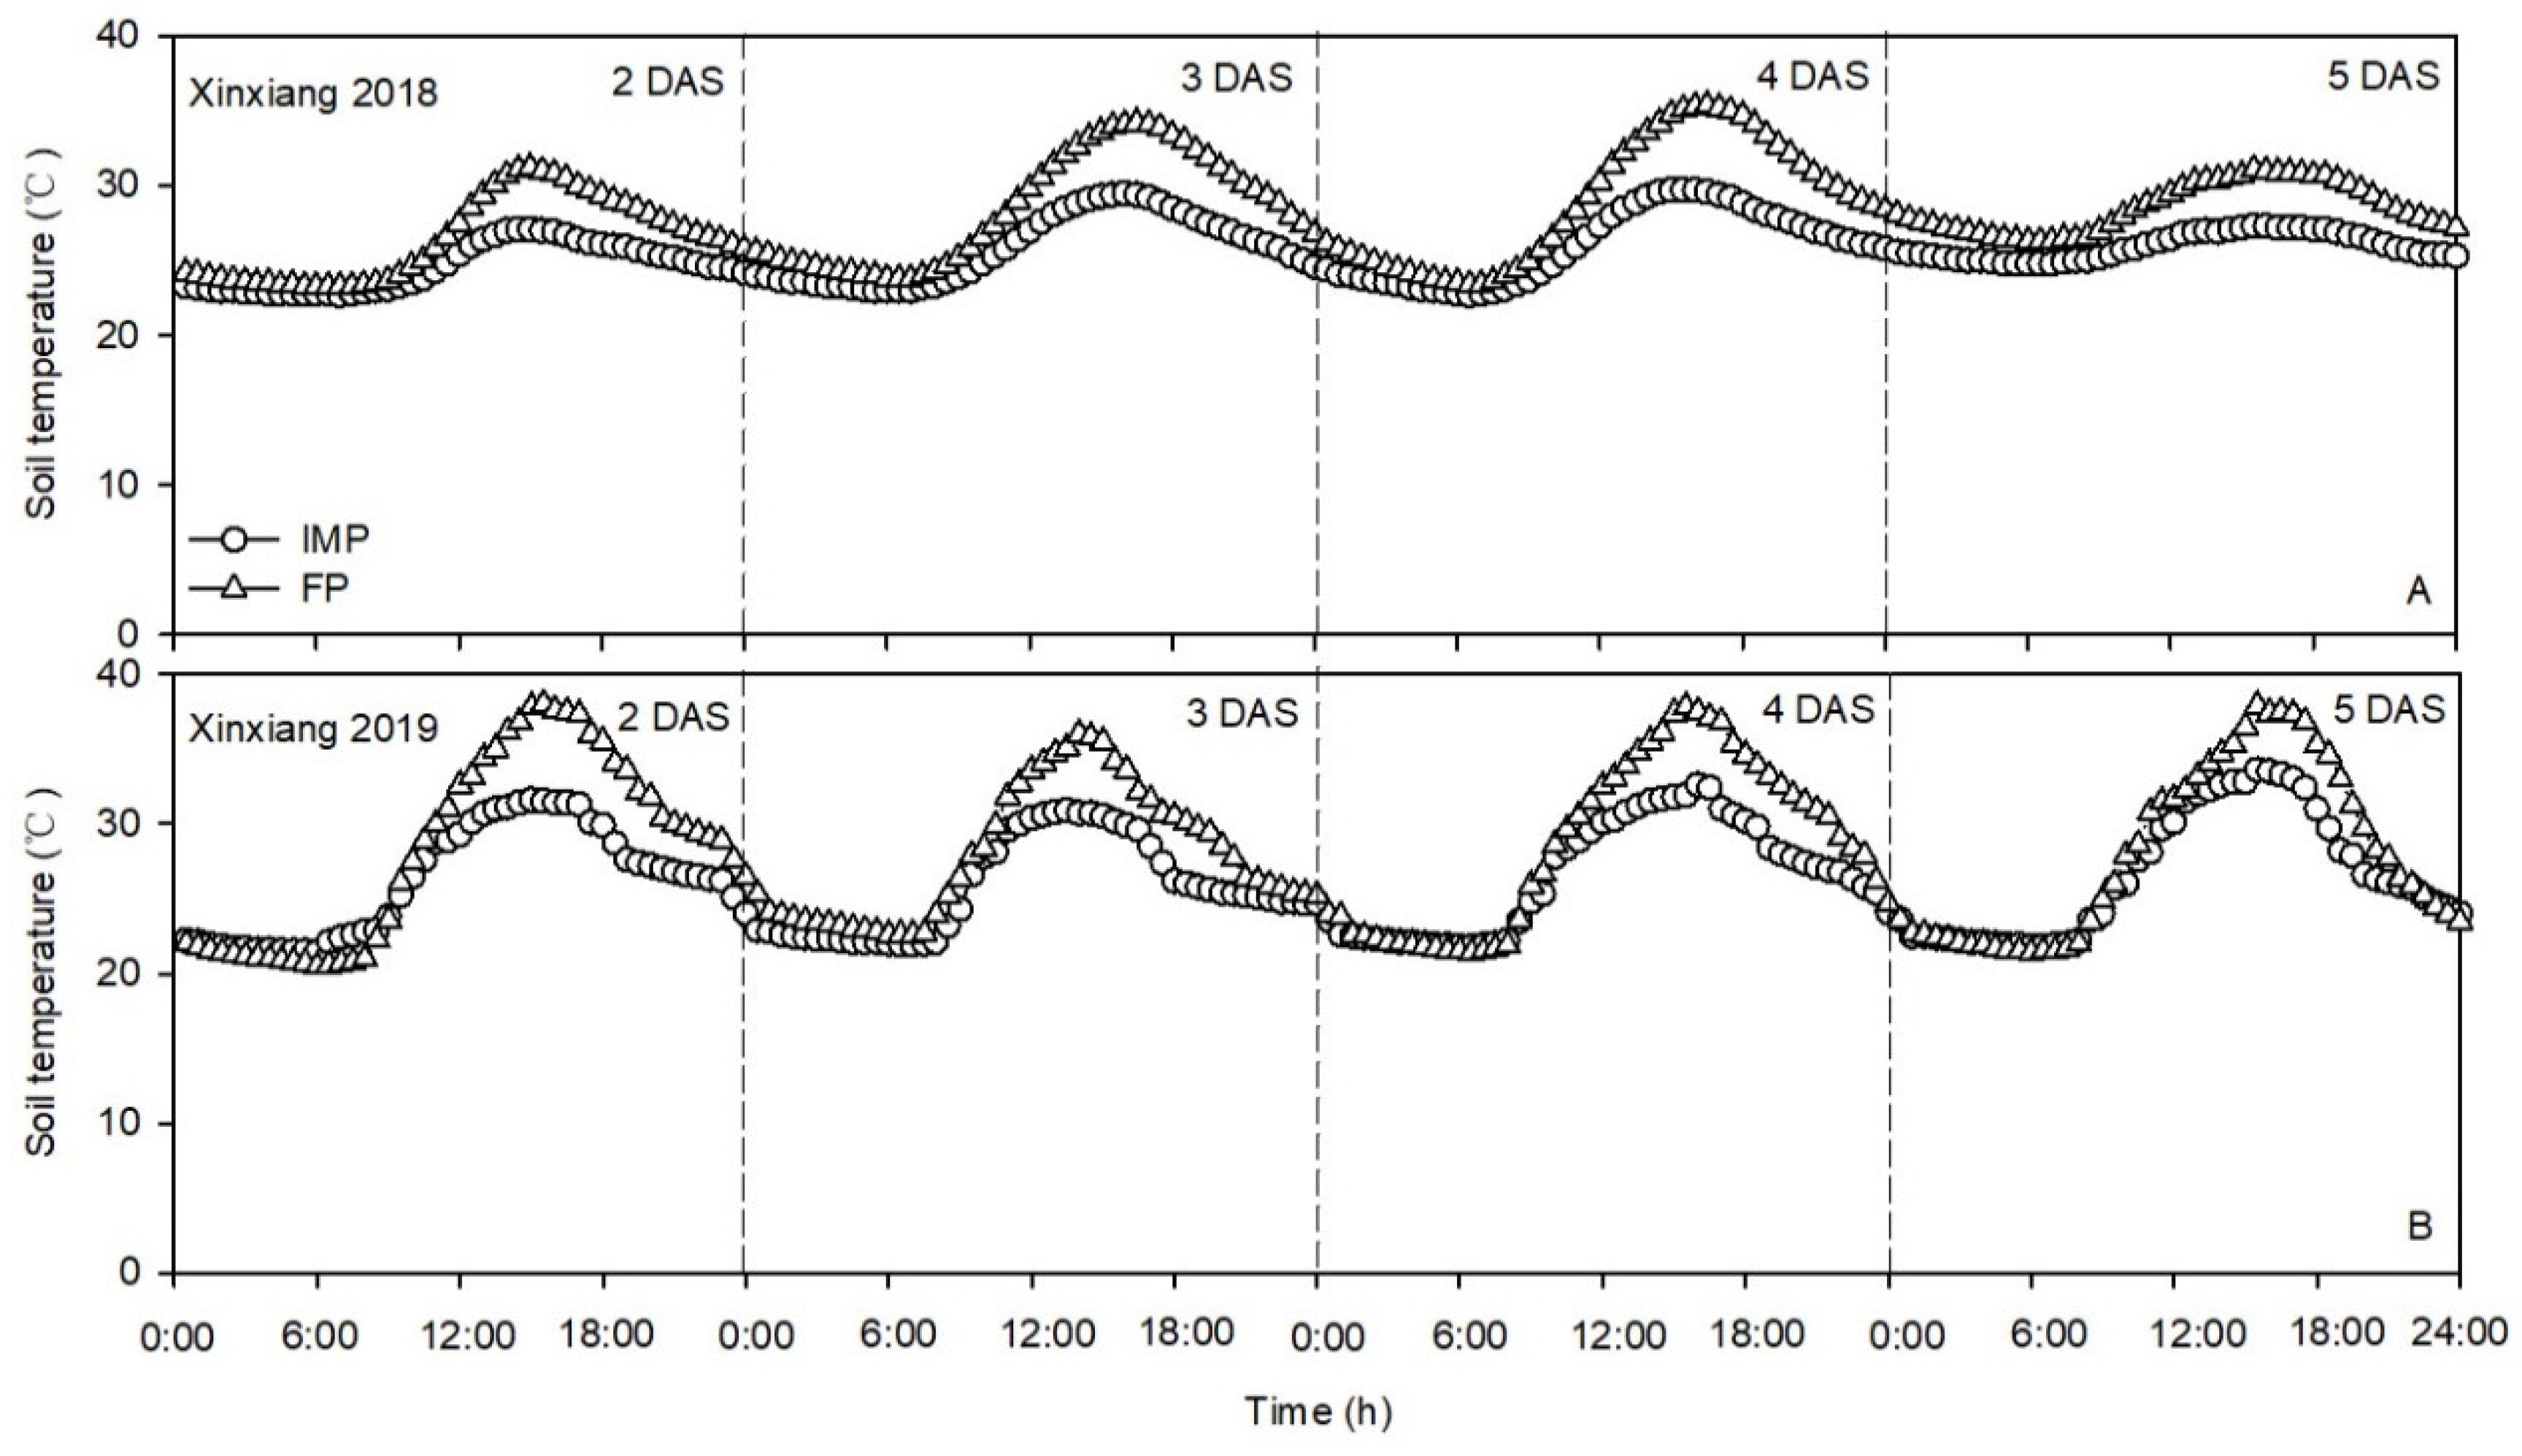
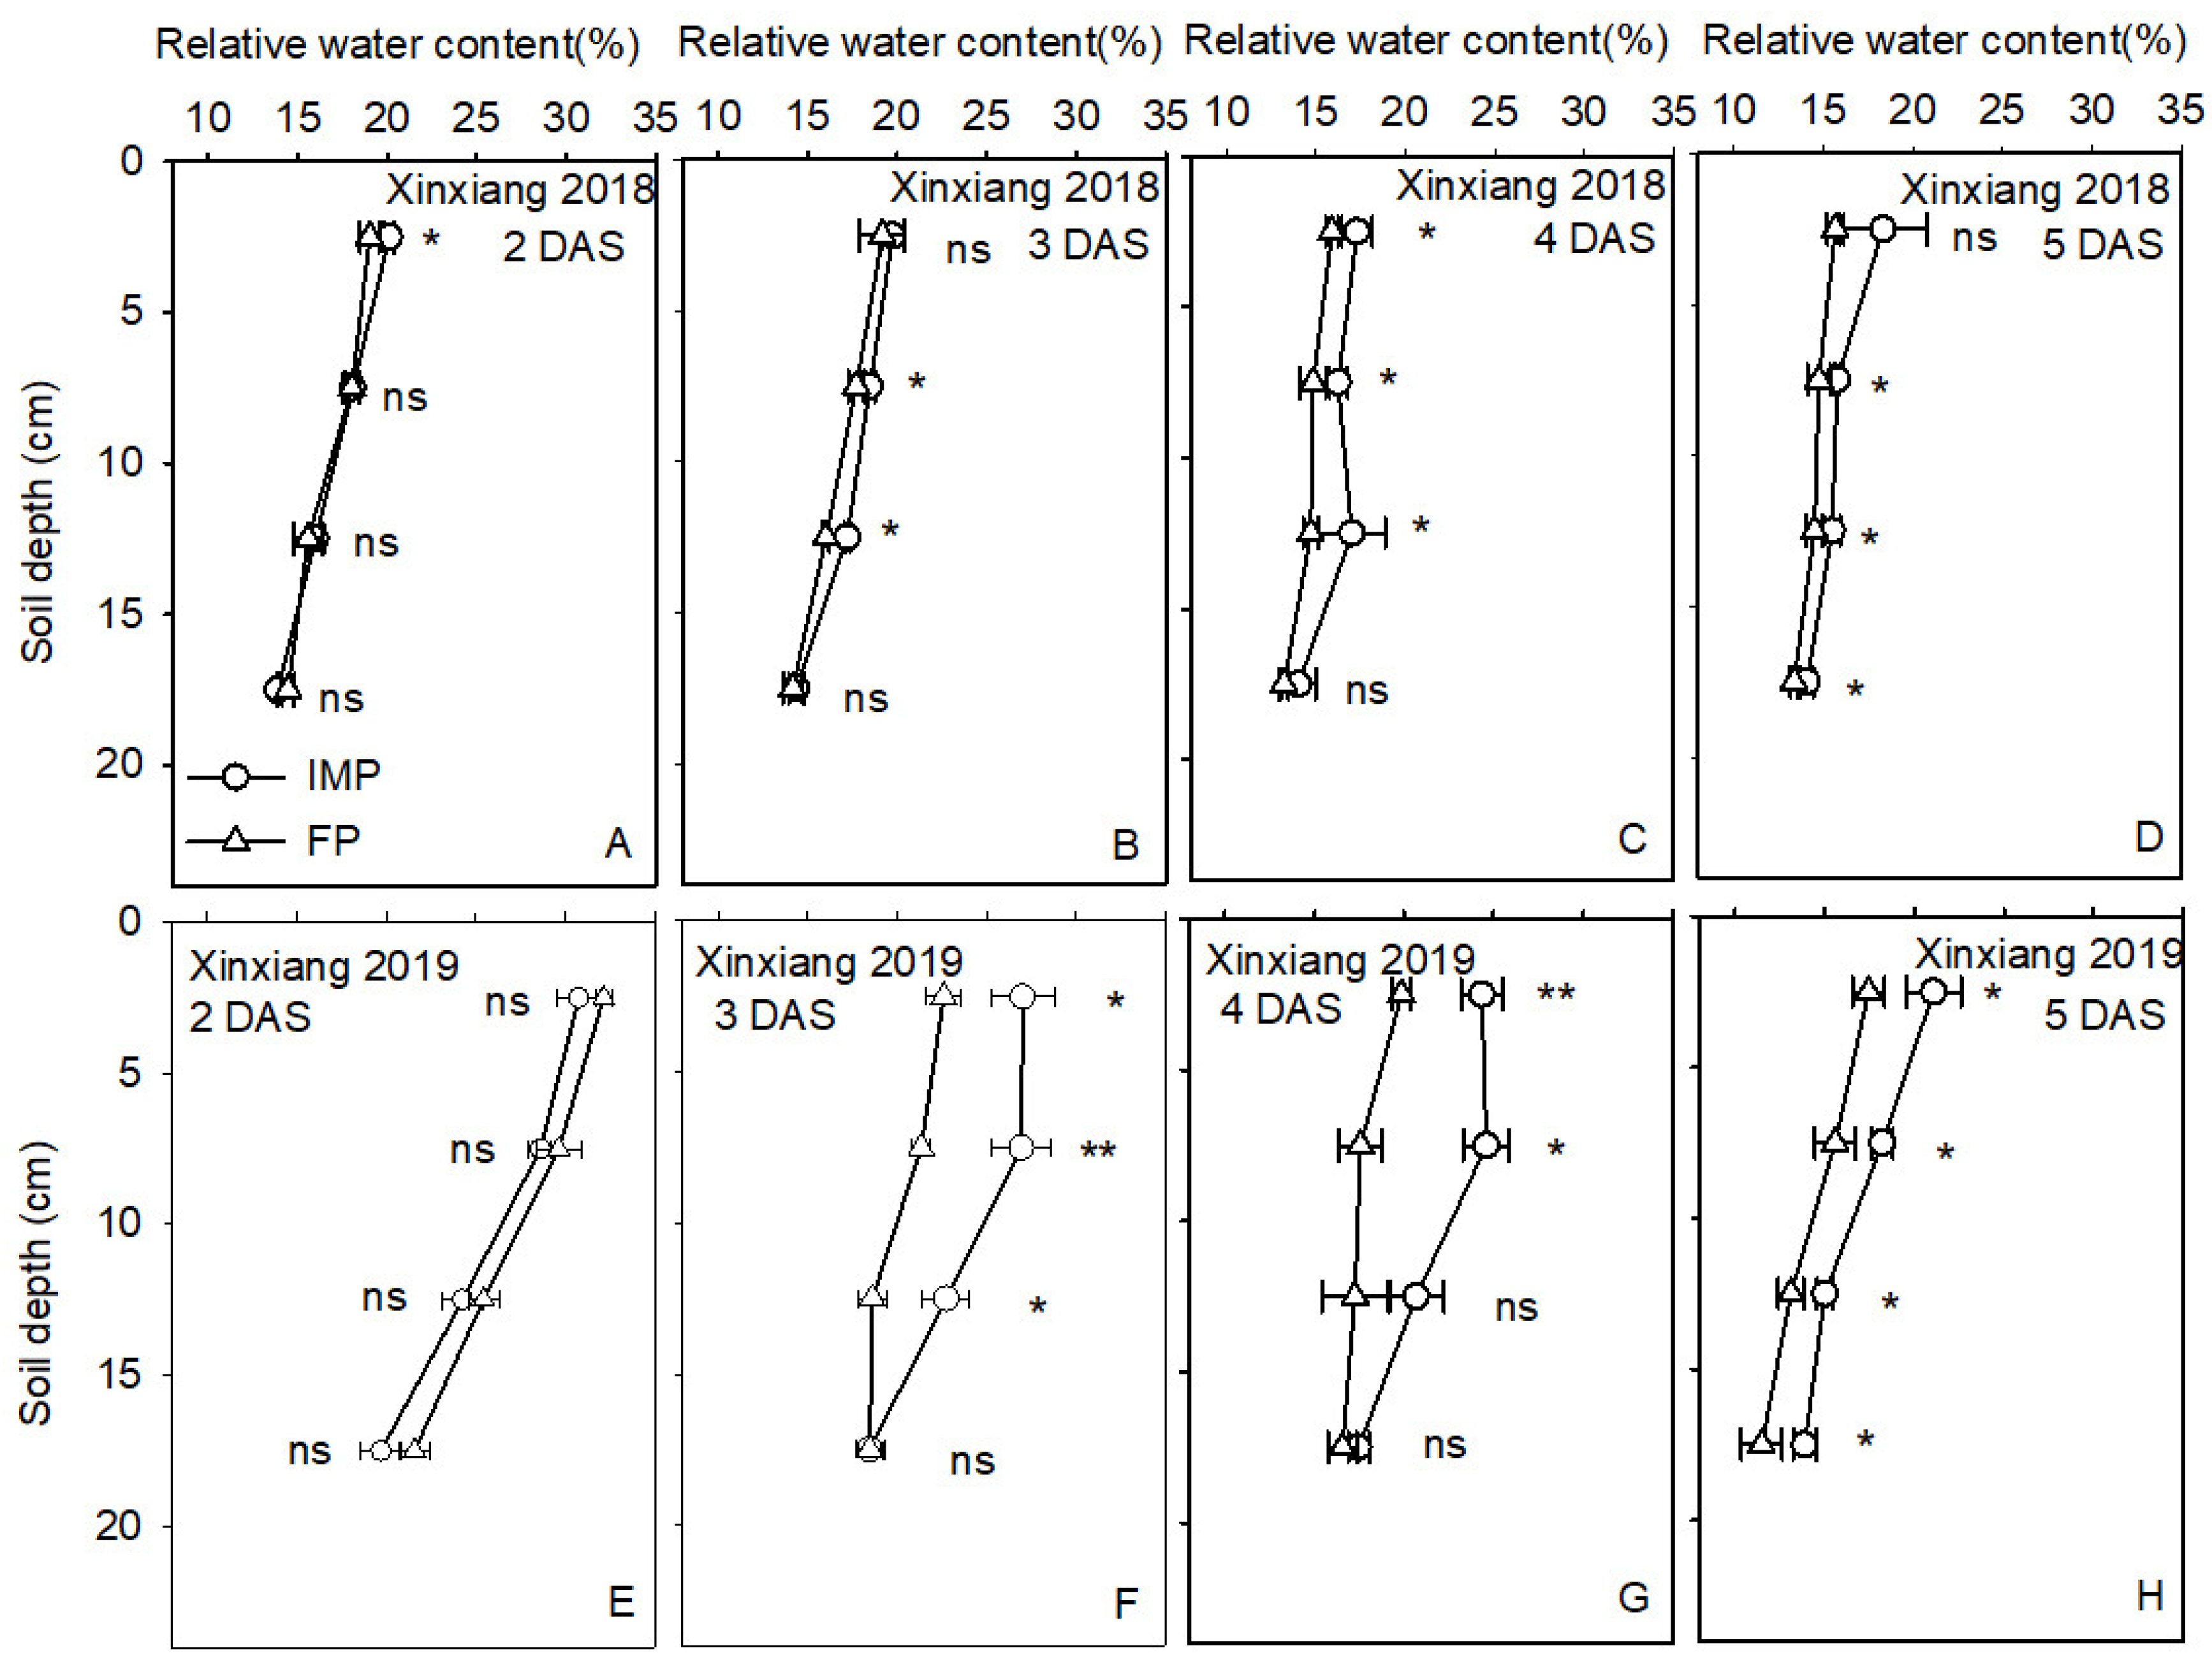
2.3.1. Soil Temperature and Moisture
2.3.2. Rate of Emergence
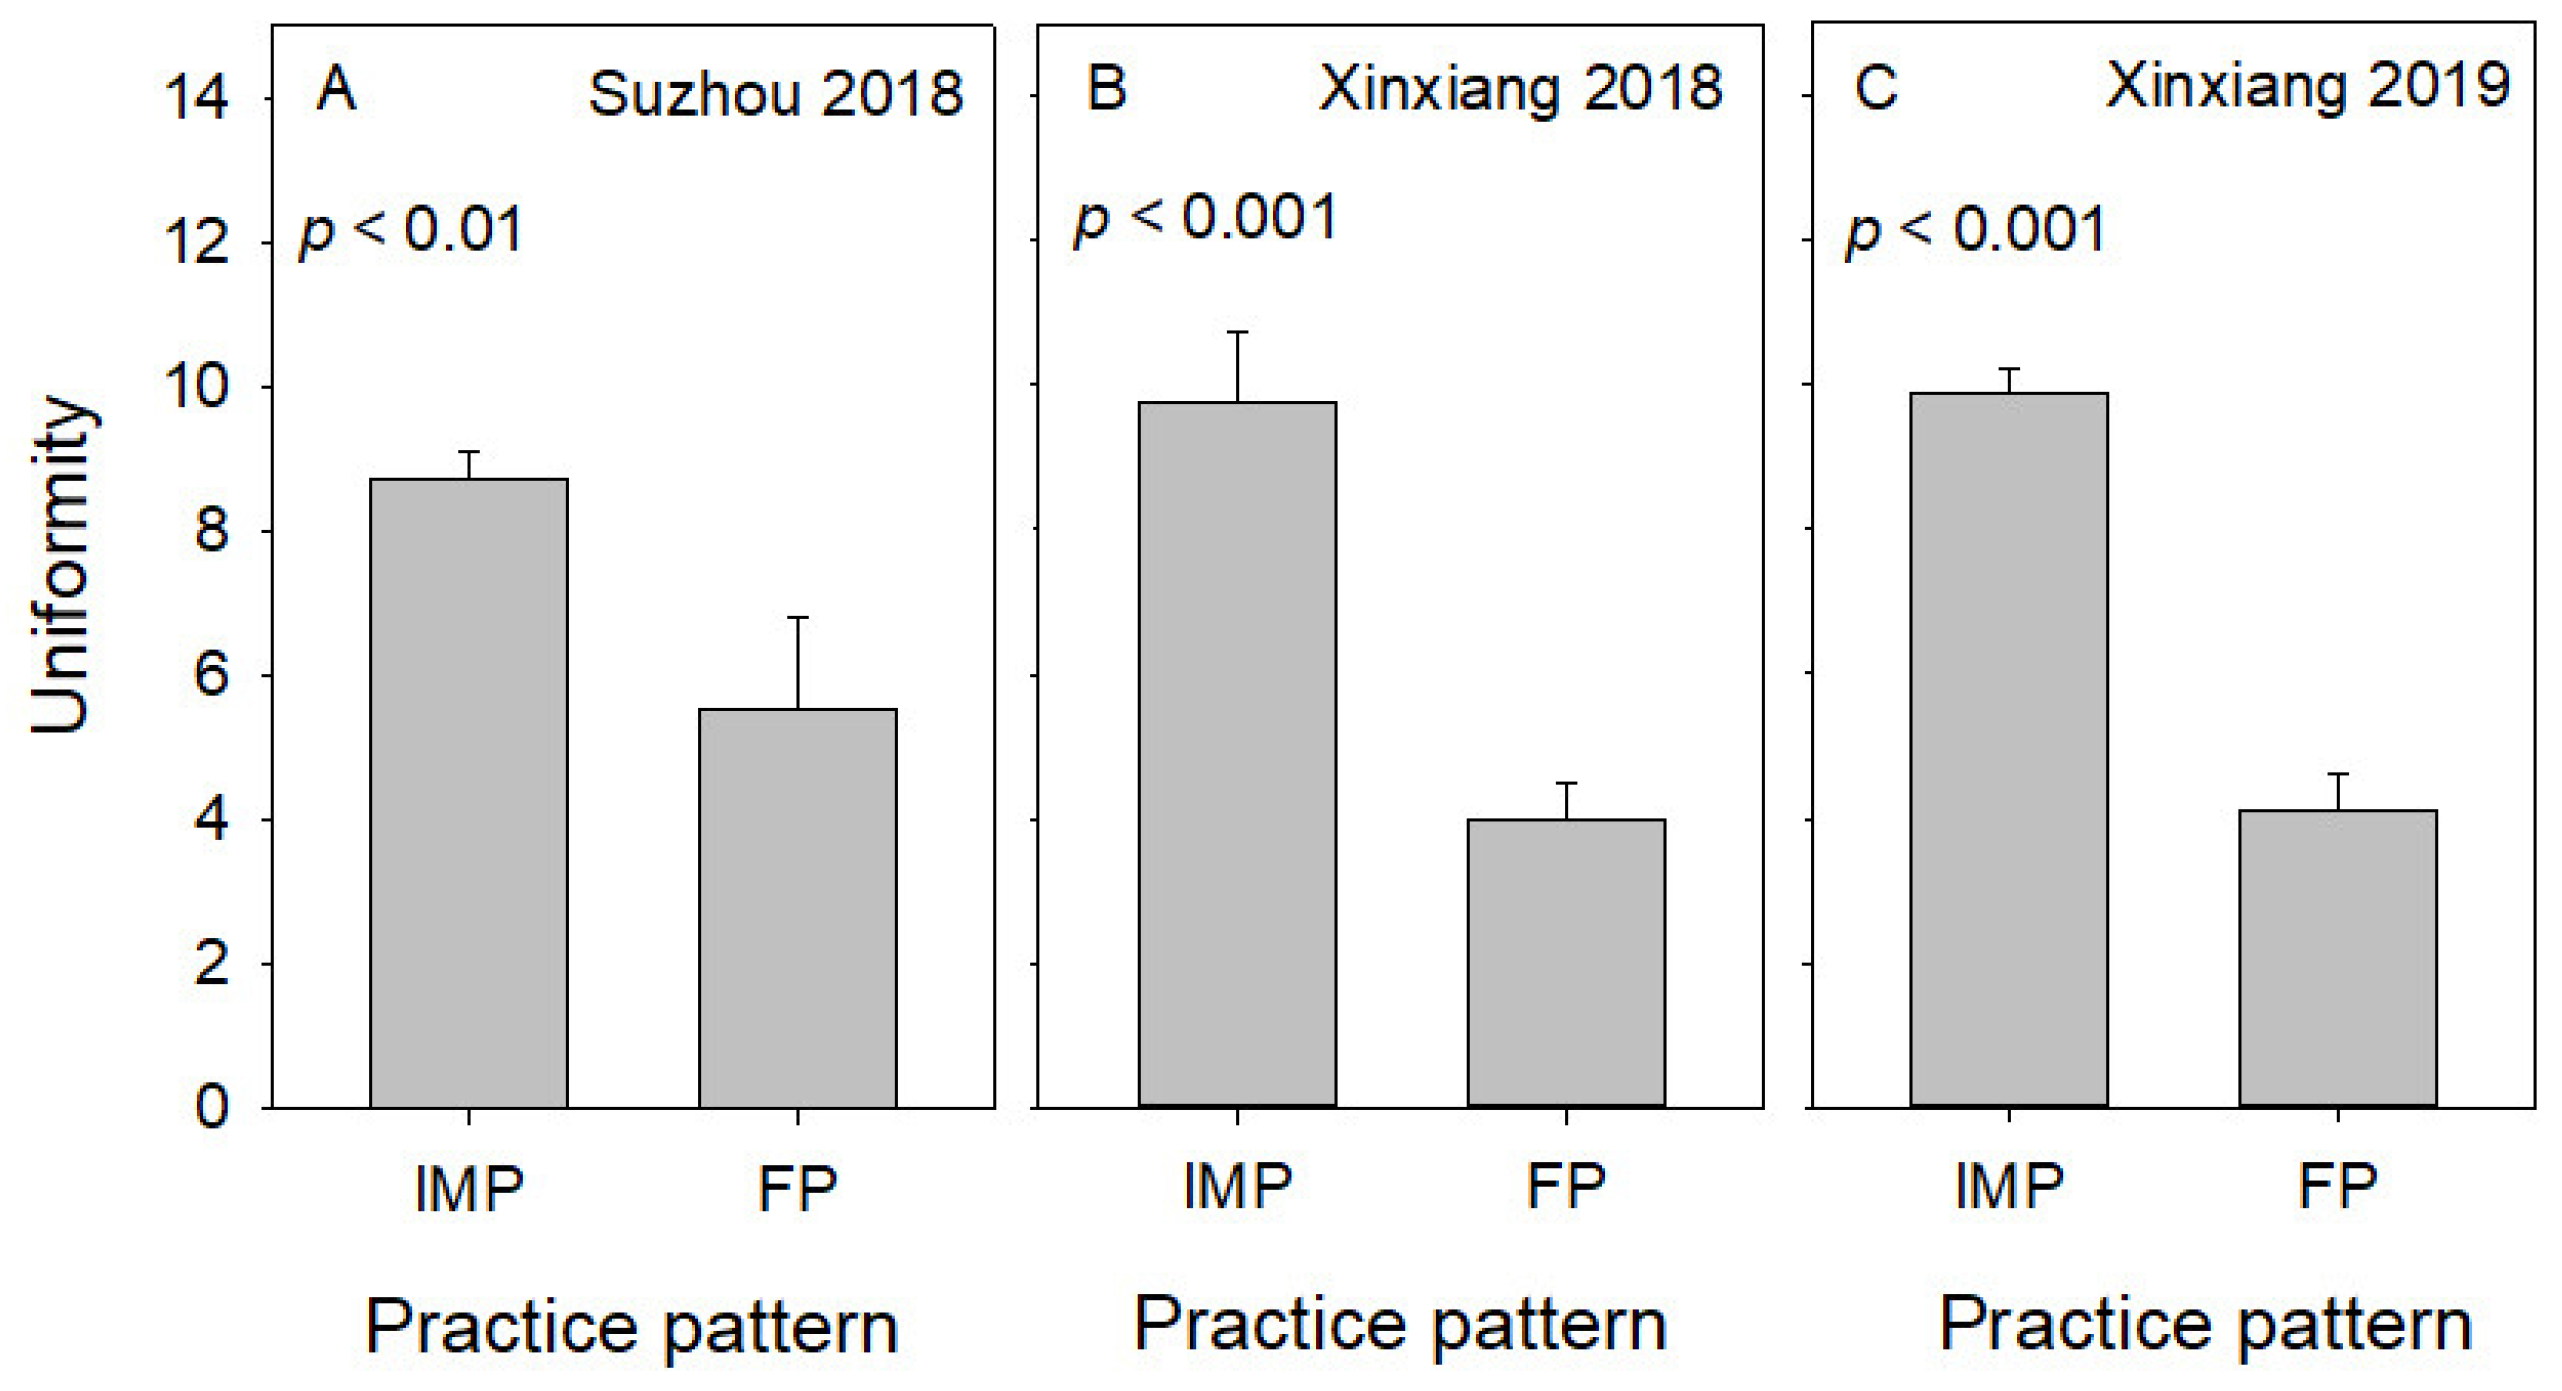
2.3.3. Developmental Uniformity
2.3.4. Leaf Area Index and Dry Matter Weight
2.3.5. Photosynthetic Rate
2.3.6. Yield and Yield Components
2.3.7. Intensities of N2O and Greenhouse Gas Emission
2.3.8. Statistical Analyses
3. Results
3.1. Soil Temperature and Moisture
3.2. Rate of Emergence
3.3. Developmental Uniformity
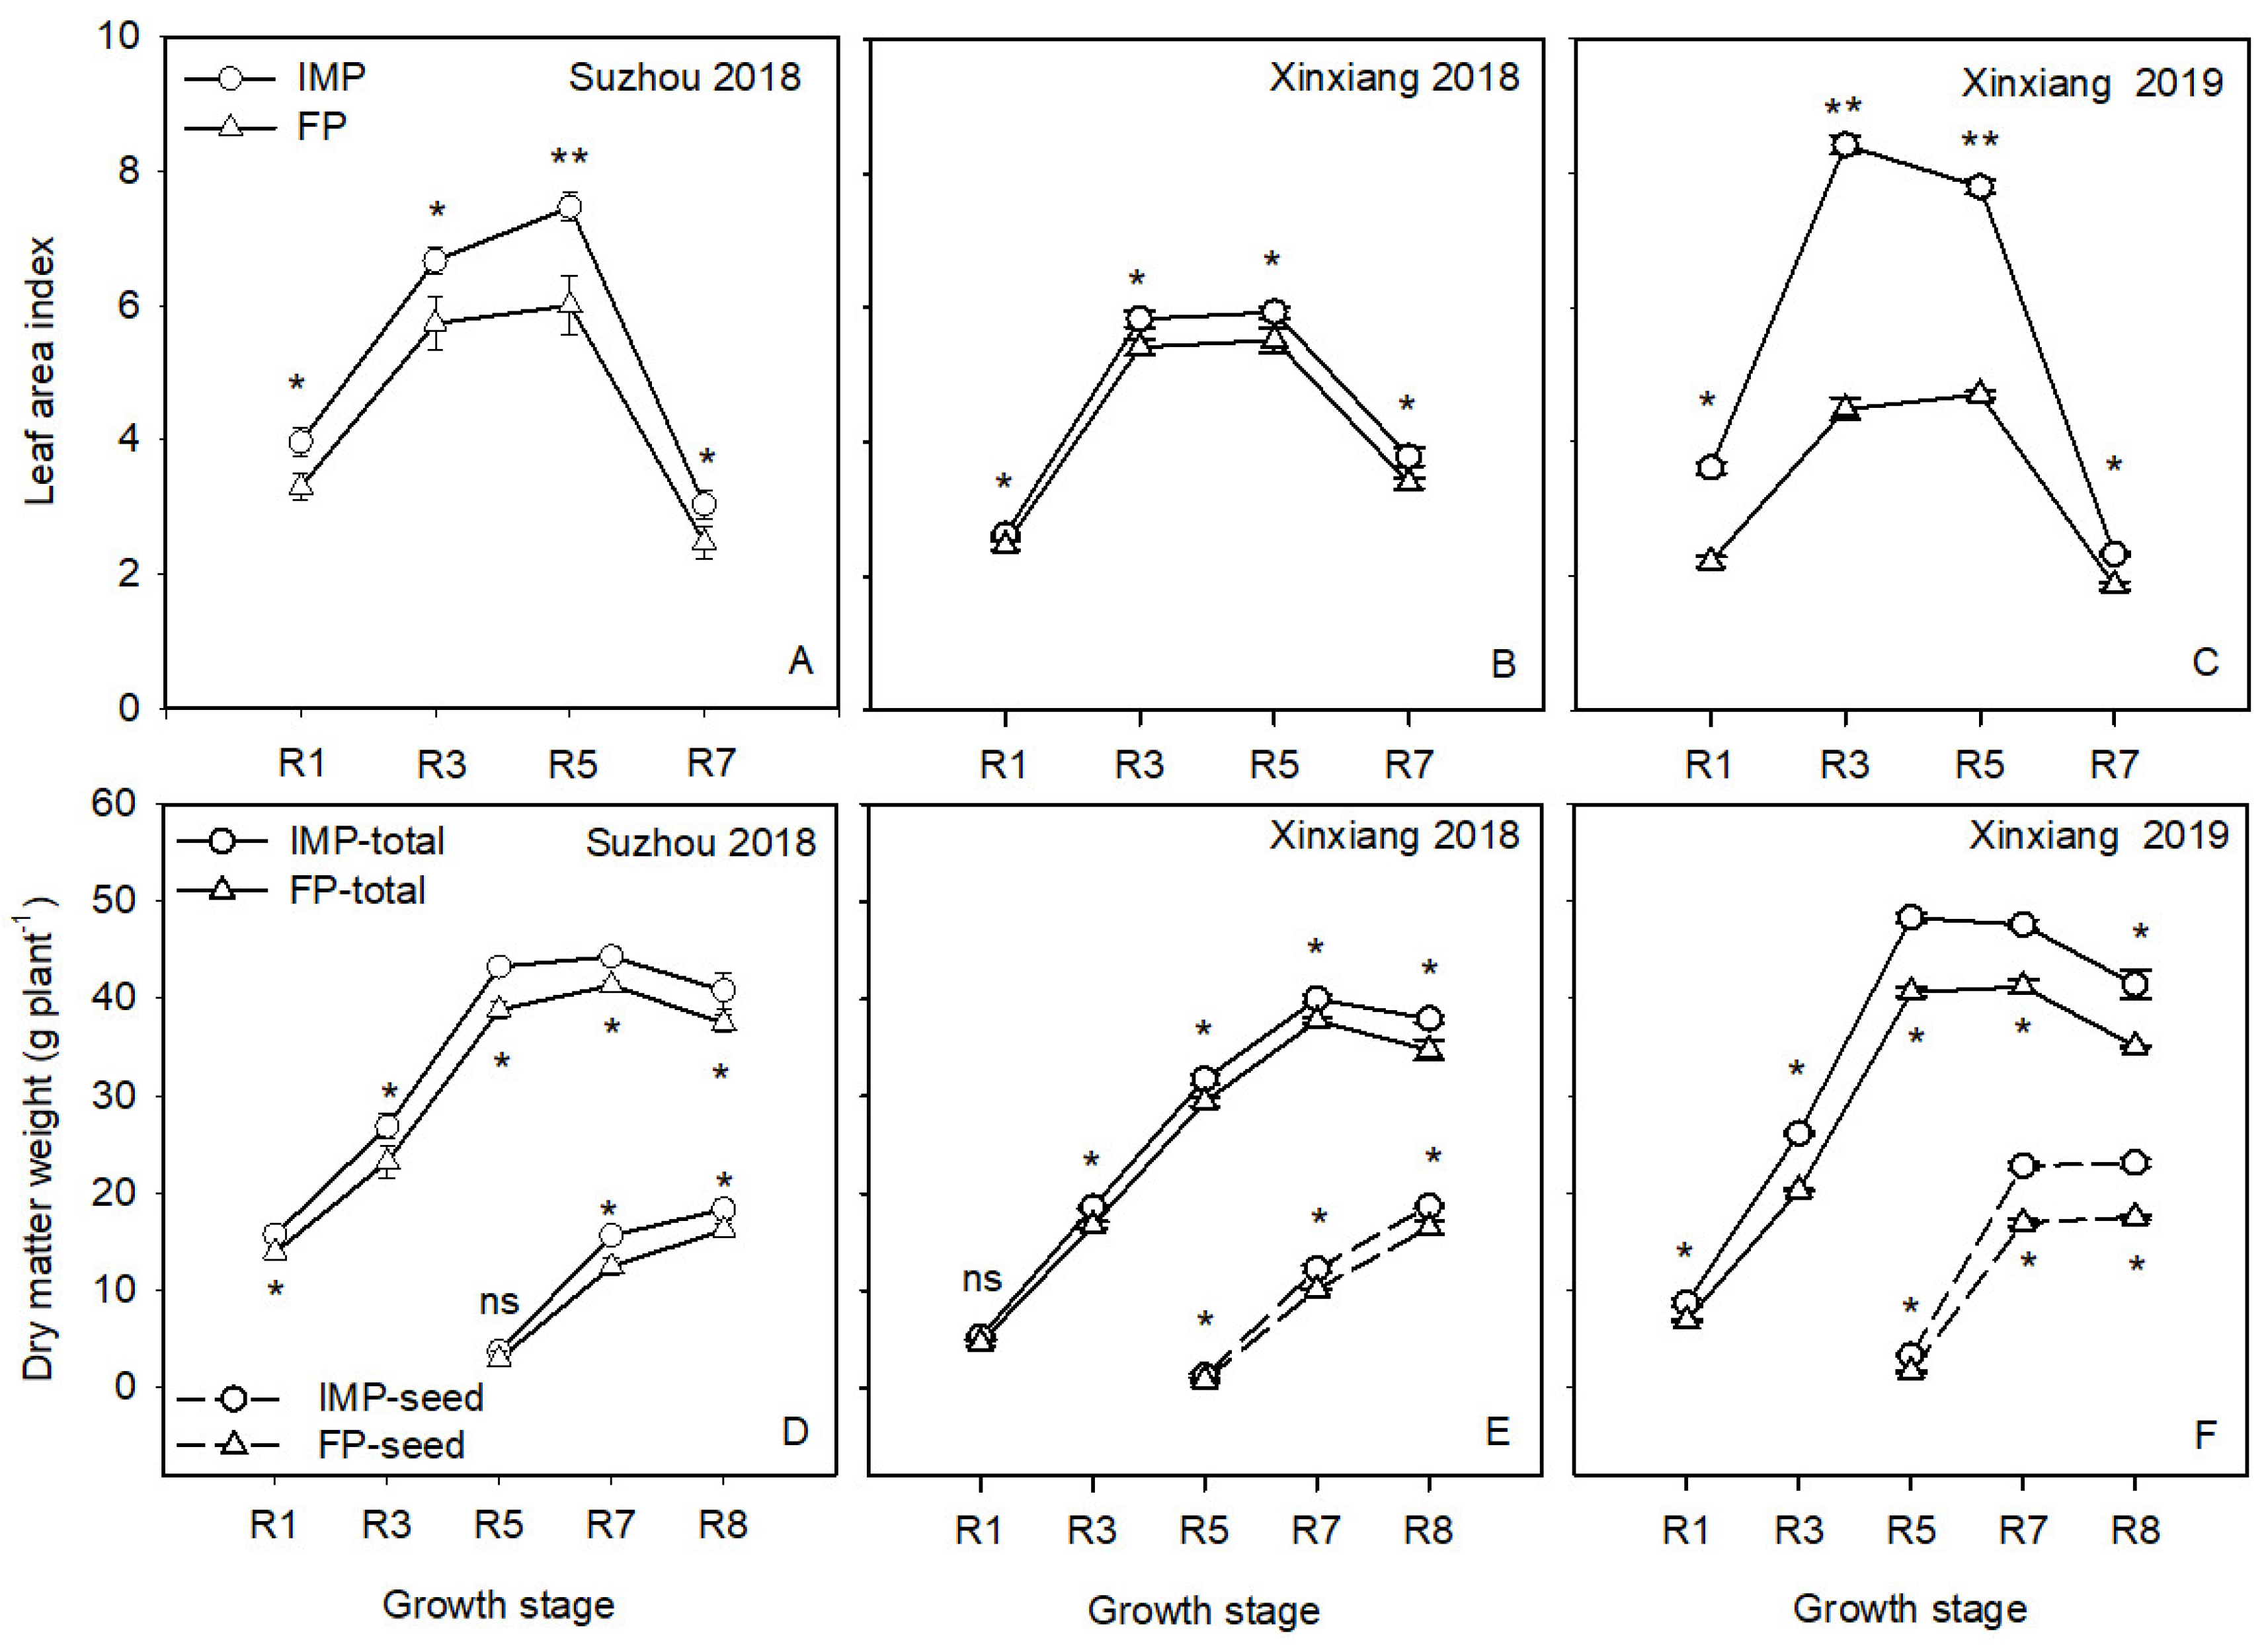
3.4. Leaf Area Index and Dry Matter Weight
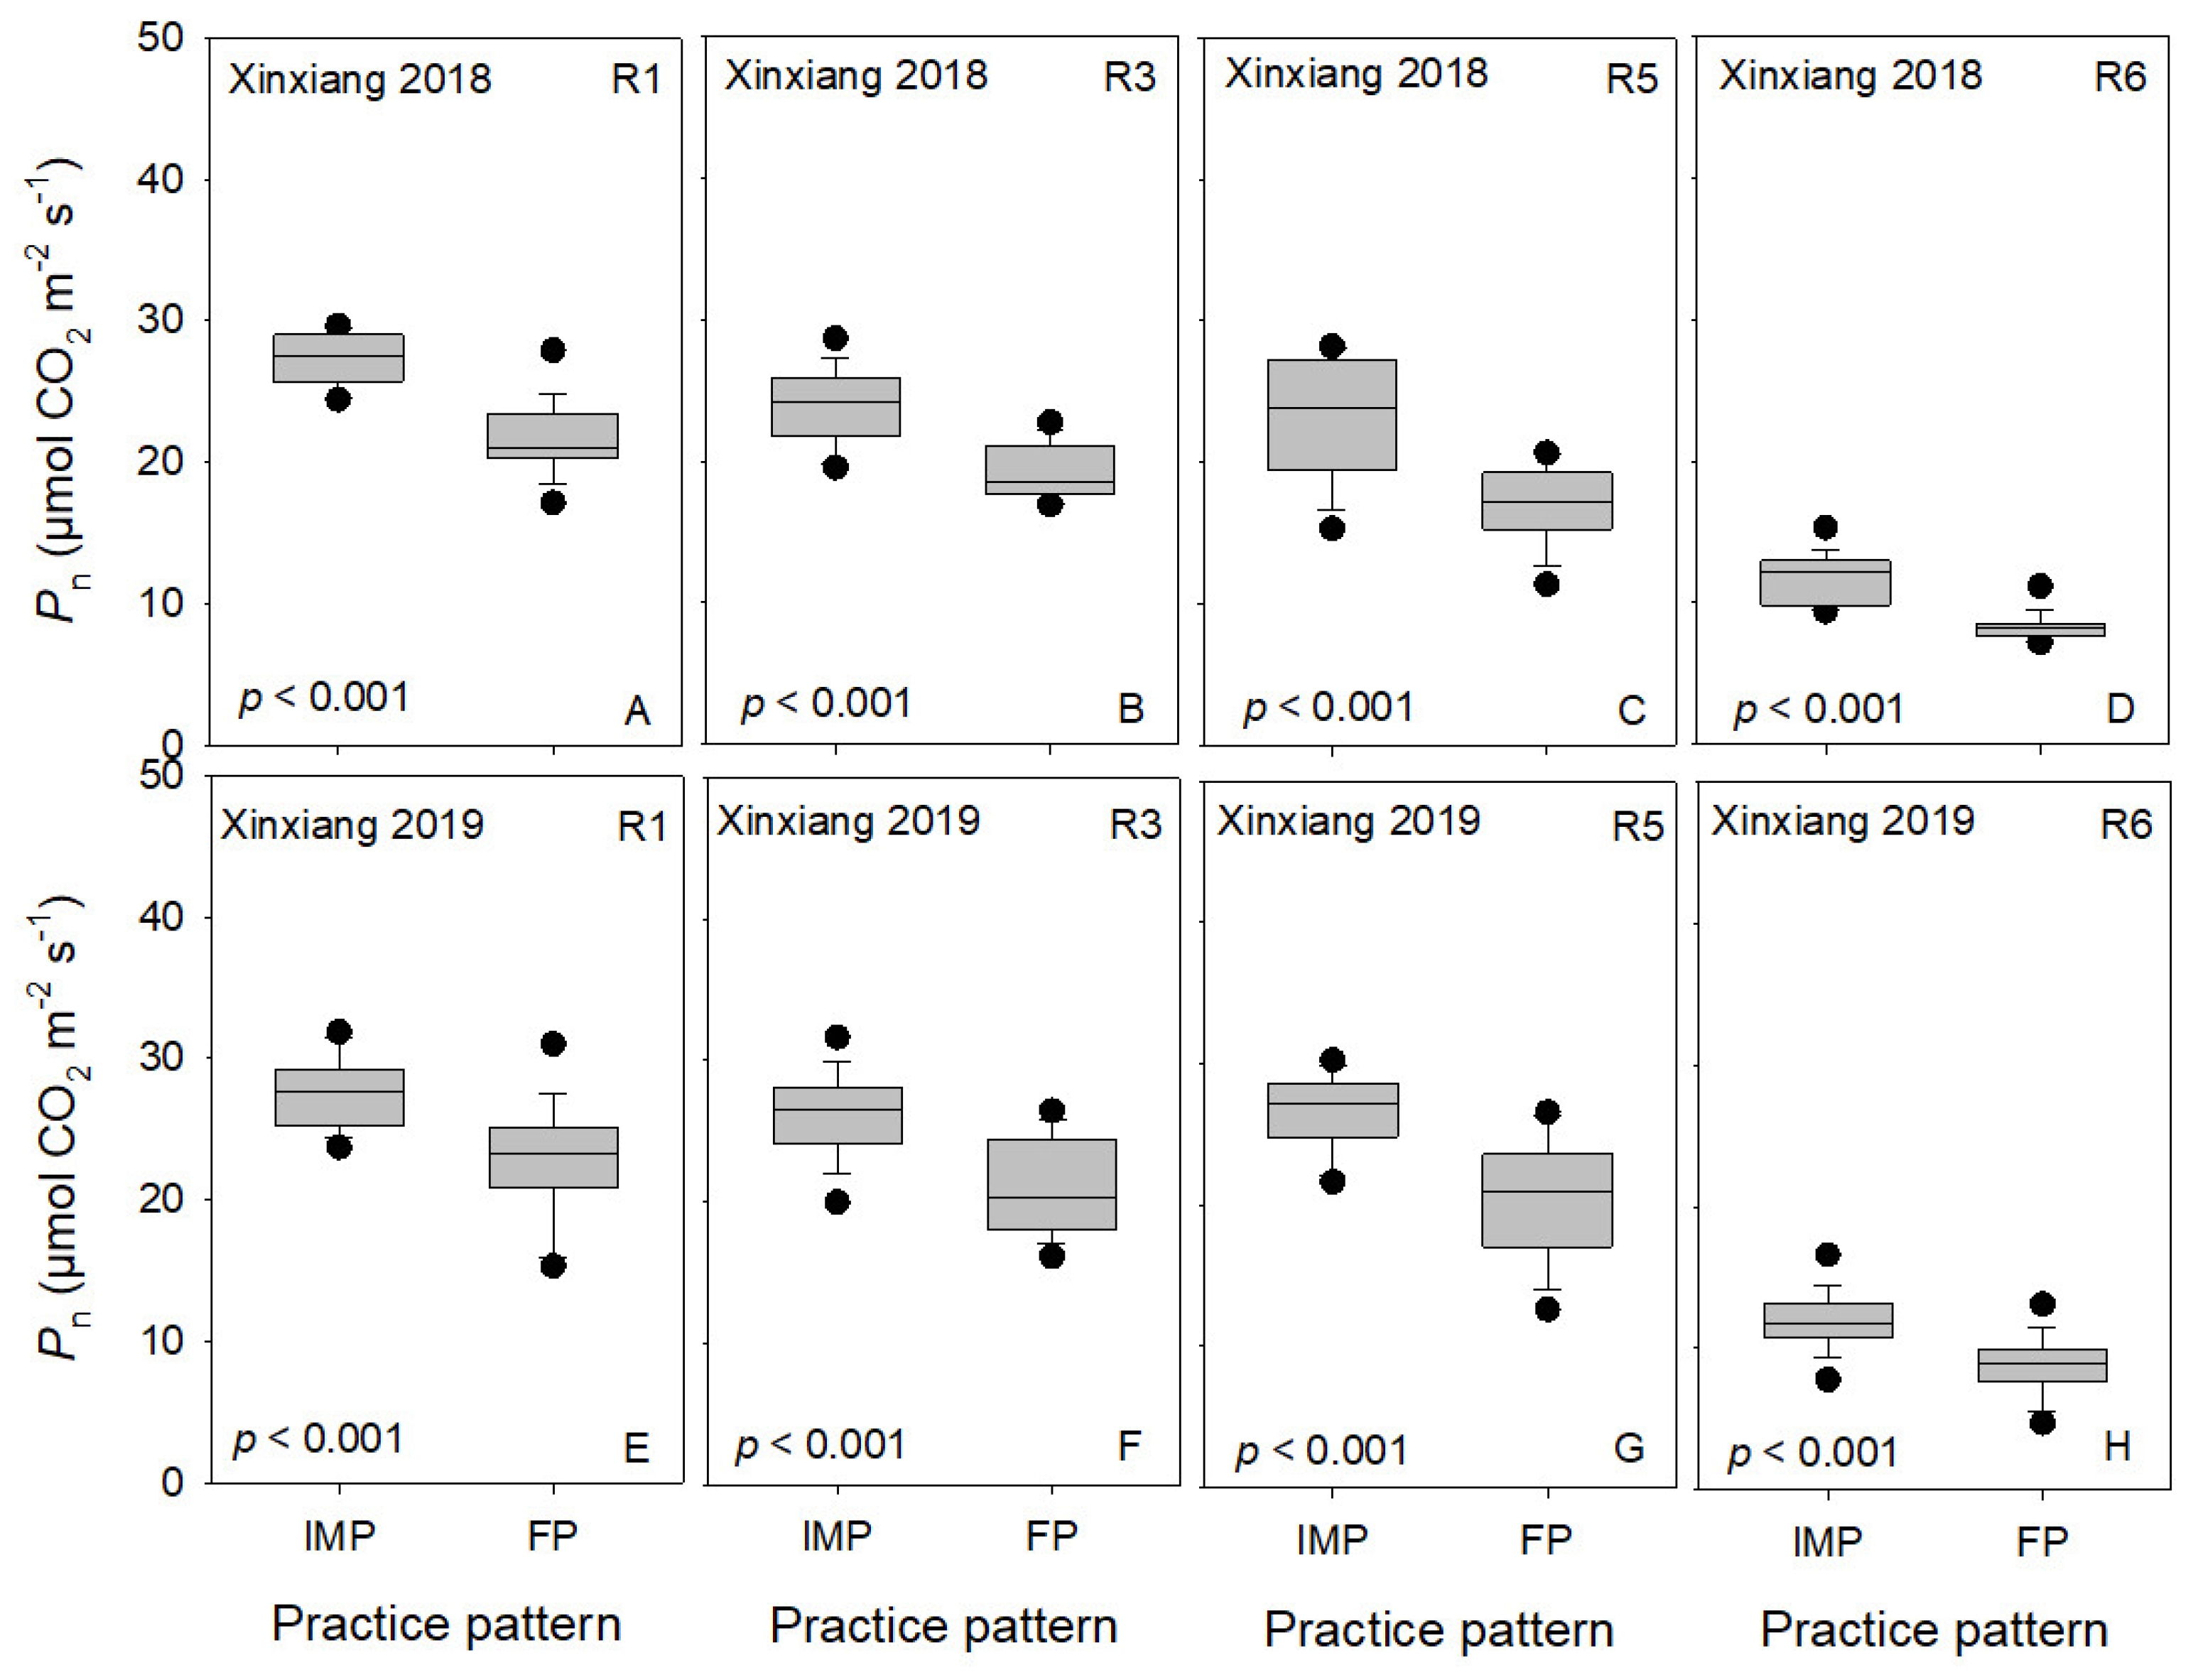
3.5. Photosynthetic Rate
3.6. Yield and Yield Components
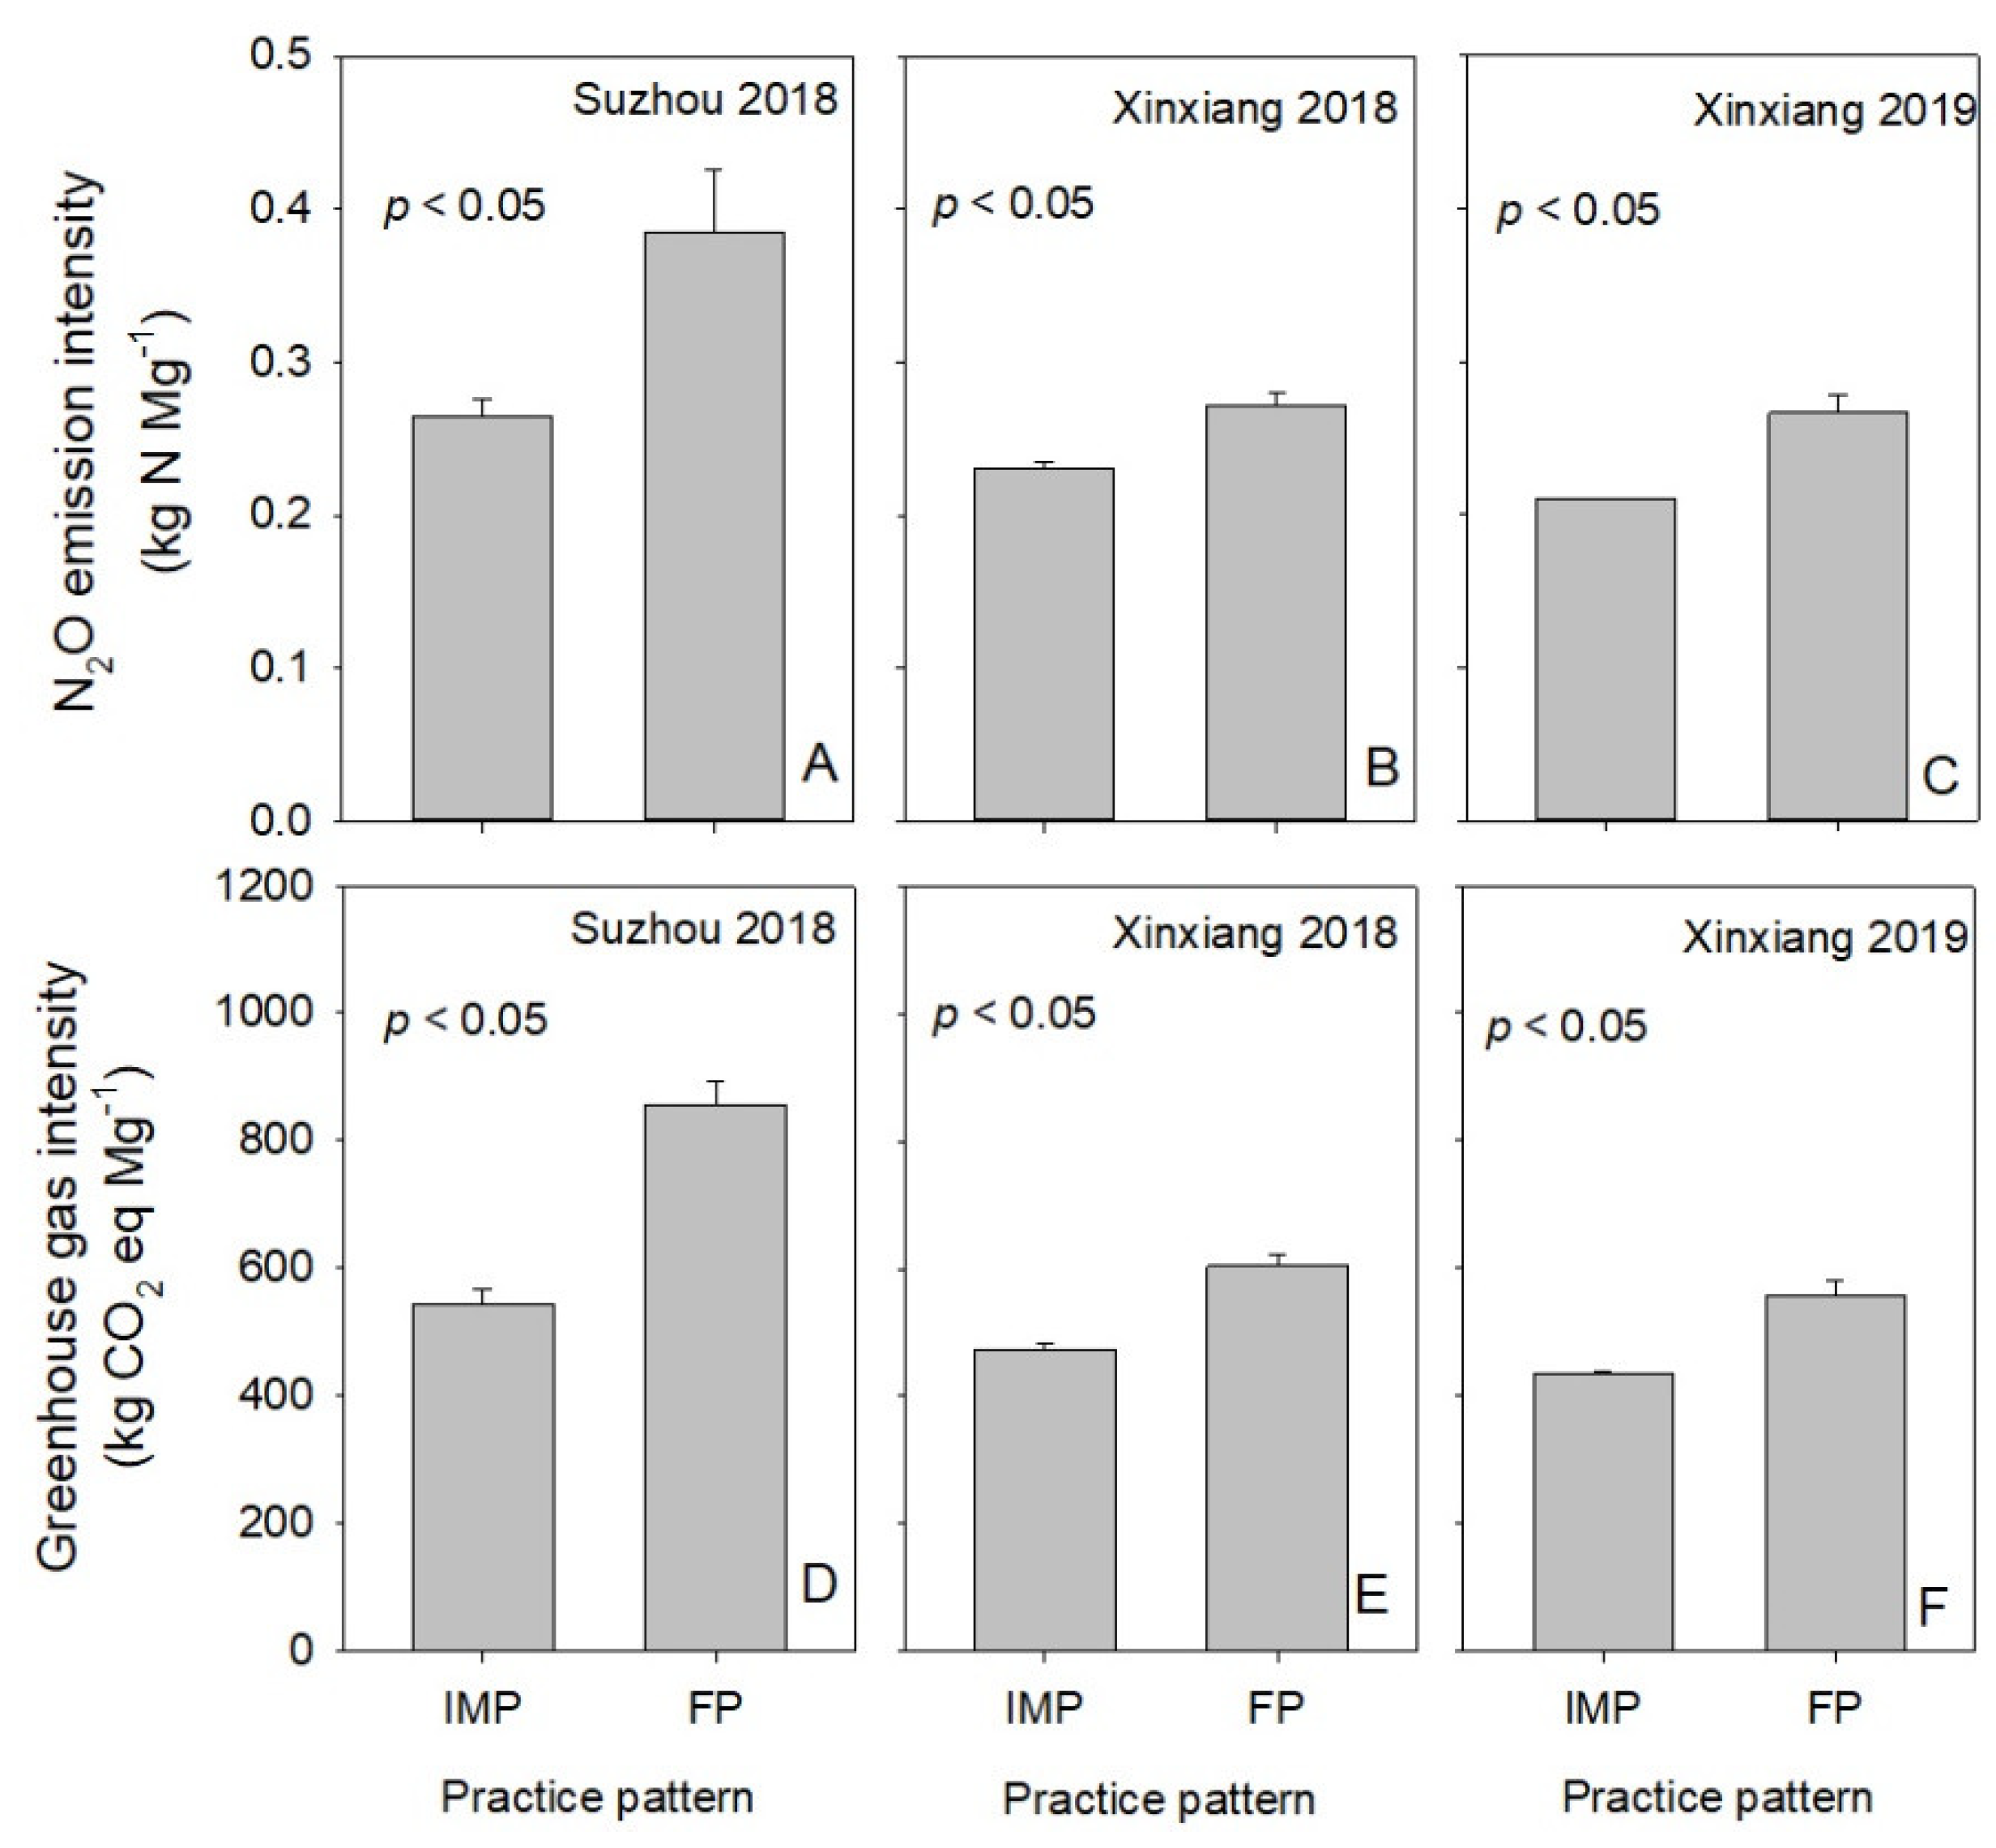
3.7. Greenhouse Gas Emissions
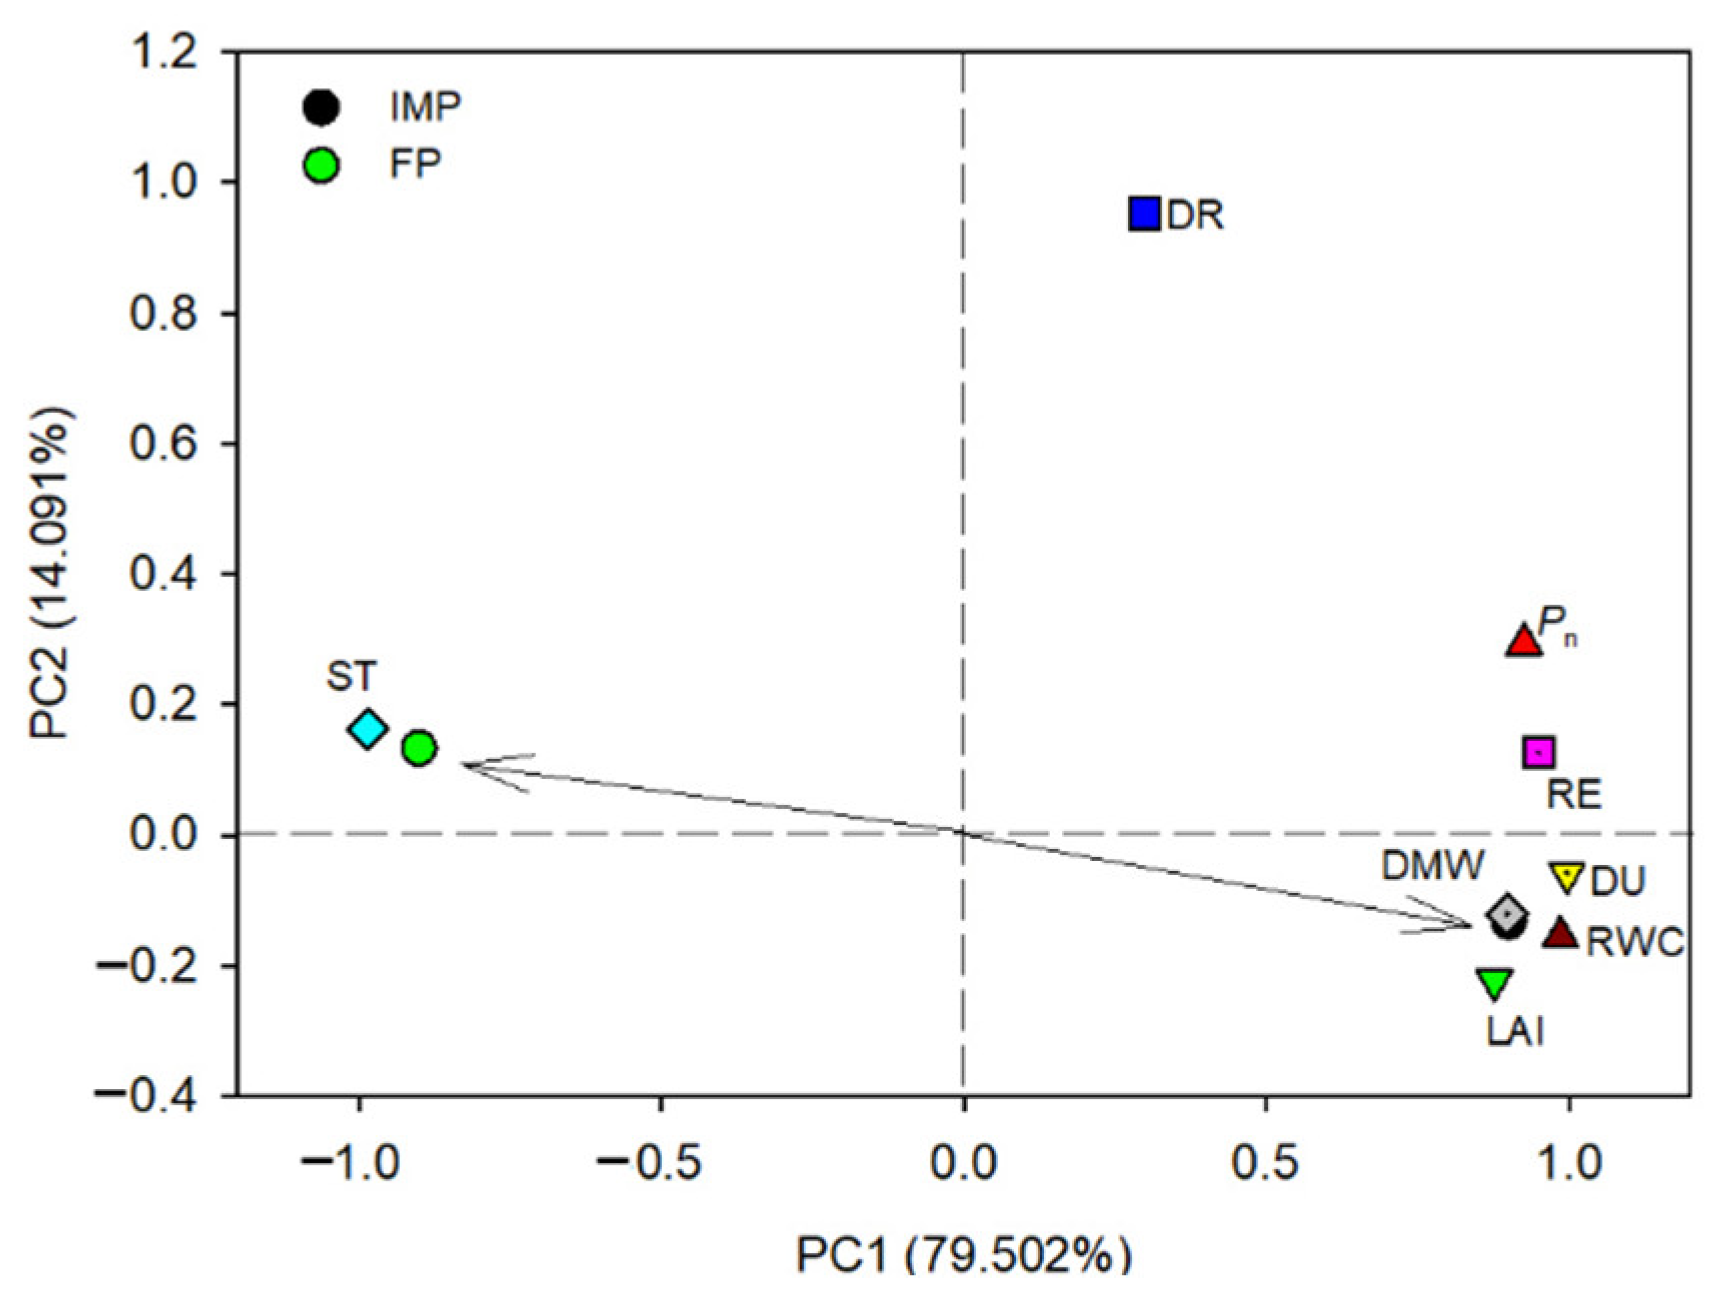
3.8. Principal Component Analysis
4. Discussion
4.1. Integrated Management Practice Optimized Soil Temperature and Soil Water Content
4.2. Integrated Management Practice Promoted Soybean Growth and Yield
4.3. Integrated Management Practice Can Reduce Greenhouse Gas Emissions
5. Conclusions
Supplementary Materials
Author Contributions
Funding
Institutional Review Board Statement
Informed Consent Statement
Data Availability Statement
Conflicts of Interest
References
- Tester, M.; Langridge, P. Breeding Technologies to Increase Crop Production in a Changing World. Science 2010, 327, 818–822. [Google Scholar] [CrossRef]
- Tilman, D.; Balzer, C.; Hill, J.; Befort, B.L. Global food demand and the sustainable intensification of agriculture. Proc. Natl. Acad. Sci. USA 2011, 108, 20260–20264. [Google Scholar] [CrossRef] [PubMed]
- Zhang, J. China’s success in increasing per capita food production. J. Exp. Bot. 2011, 62, 3707–3711. [Google Scholar] [CrossRef] [PubMed]
- Food and Agriculture Organization of the United Nations. 2021. Available online: http://www.fao.org/faostat/en/#data/QC (accessed on 20 May 2021).
- USAD-FAS, China: Oilseeds and Products Annual. Foreign Agricultural Service. 2021. Available online: https://www.fas.usda.gov/data/china-oilseeds-and-products-annual-6 (accessed on 18 March 2021).
- Shan, L.; Wu, P.; Kang, S.; Feng, H.; Zhang, S. Study on agricultural water-saving countermeasures and feasibility of imple-menting semi-dry land farming in the Huang-Huai-Hai Region. Eng. Sci. 2011, 13, 37–41. [Google Scholar]
- Xu, C.; Zhao, H.; Zhang, P.; Wang, Y.; Huang, S.; Meng, Q.; Wang, P. Delaying wheat seeding time and maize harvest improved water use efficiency in a warm temperature continental monsoon climate. Agron. J. 2018, 110, 1420–1429. [Google Scholar] [CrossRef]
- Li, L.; Tilman, D.; Lambers, H.; Zhang, F. Plant diversity and overyielding: Insights from belowground facilitation of inter-cropping in agriculture. New Phytol. 2014, 203, 63–69. [Google Scholar] [CrossRef] [PubMed]
- Wei, W.; Li, Q.-T.; Chu, Y.-N.; Reiter, R.J.; Yu, X.-M.; Zhu, D.-H.; Zhang, W.-K.; Ma, B.; Lin, Q.; Zhang, J.-S.; et al. Melatonin enhances plant growth and abiotic stress tolerance in soybean plants. J. Exp. Bot. 2015, 66, 695–707. [Google Scholar] [CrossRef]
- Zou, J.; Jin, X.; Zhang, Y.; Ren, C.; Zhang, M.; Wang, M. Effects of melatonin on photosynthesis and soybean seed growth during grain filling under drought stress. Photosynthetica 2019, 57, 512–520. [Google Scholar] [CrossRef]
- Zhang, M.; He, S.; Zhan, Y.; Qin, B.; Jin, X.; Wang, M.; Zhang, Y.; Hu, G.; Teng, Z.; Wu, Y. Exogenous melatonin reduces the inhibitory effect of osmotic stress on photosynthesis in soybean. PLoS ONE 2019, 14, e0226542. [Google Scholar] [CrossRef]
- Cao, L.; Jin, X.; Zhang, Y. Melatonin confers drought stress tolerance in soybean (Glycine max L.) by modulating photosynthesis, osmolytes, and reactive oxygen metabolism. Photosynthetica 2019, 57, 812–819. [Google Scholar] [CrossRef]
- Wu, T.; Wu, C. The influence of soil crusting on emergence of soybean and its key solution in Huang-Huai-Hai River Valley. Soybean Sci. 2017, 36, 813–817. [Google Scholar]
- Hong, J.; Ren, L.; Hong, J.; Xu, C. Environmental impact assessment of corn straw utilization in China. J. Clean. Prod. 2016, 112, 1700–1708. [Google Scholar] [CrossRef]
- Li, F.; Wang, J. Estimation of carbon emission from burning and carbon sequestration from biochar producing using crop straw in China. Trans. CSAE 2013, 29, 1–7. [Google Scholar]
- Awadhwal, N.; Thierstein, G. Soil crust and its impact on crop establishment: A review. Soil Tillage Res. 1985, 5, 289–302. [Google Scholar] [CrossRef]
- Vladimir, S.; Nora, P.; Halmo, S. Soil crust in agricultural land. Acta Fytotech. Zootech. 2014, 17, 109–114. [Google Scholar]
- Wang, L.; Coulter, J.A.; Palta, J.A.; Xie, J.; Luo, Z.; Li, L.; Carberry, P.; Li, Q.; Deng, X. Mulching-Induced Changes in Tuber Yield and Nitrogen Use Efficiency in Potato in China: A Meta-Analysis. Agronomy 2019, 9, 793. [Google Scholar] [CrossRef]
- Michelon, N.; Pennisi, G.; Myint, N.O.; Orsini, F.; Gianquinto, G. Strategies for Improved Water Use Efficiency (WUE) of Field-Grown Lettuce (Lactuca sativa L.) under a Semi-Arid Climate. Agronomy 2020, 10, 668. [Google Scholar] [CrossRef]
- Wu, C.; Lu, W.; Chen, H.; Han, T.; Zhao, J.; Zhang, M.; Jiang, C.; Li, S.; Xu, R.; Zhang, L.; et al. A No-Tillage Seeding Practice of Summer Crop after Wheat. China Patent ZL201110378379.6, 1 April 2015. [Google Scholar]
- National Bureau of Statistic of China. China Statistical Yearbook; China Statistics Press: Beijing, China, 2018.
- Fehr, W.; Caviness, C. Stages of Soybean Development: Special Report 80, Iowa Agricultural Experiment Station, Iowa Cooperative External Series; Iowa State University: Ames, IA, USA, 1977. [Google Scholar]
- Cui, Z.; Yue, S.; Wang, G.; Meng, Q.; Wu, L.; Yang, Z.; Zhang, Q.; Li, S.; Zhang, F.; Chen, X. Closing the yield gap could reduce projected greenhouse gas emissions: A case study of maize production in China. Glob. Chang. Biol. 2013, 19, 2467–2477. [Google Scholar] [CrossRef]
- Xu, C.; Huang, S.; Tian, B.; Ren, J.; Meng, Q.; Wang, P. Manipulating Planting Density and Nitrogen Fertilizer Application to Improve Yield and Reduce Environmental Impact in Chinese Maize Production. Front. Plant Sci. 2017, 8, 1234. [Google Scholar] [CrossRef]
- Kyei-Boahen, S.; Zhang, L. Early-Maturing Soybean in a Wheat-Soybean Double-Crop System Yield and Net Returns. Agron. J. 2006, 98, 295–301. [Google Scholar] [CrossRef]
- Caviglia, O.P.; Sadras, V.O.; Andrade, F.H. Yield and Quality of Wheat and Soybean in Sole- and Double-Cropping. Agron. J. 2011, 103, 1081–1089. [Google Scholar] [CrossRef]
- Seifert, C.; Lobell, D. Response of double cropping suitability to climate change in the United States. Environ. Res. Lett. 2015, 10, 024002. [Google Scholar] [CrossRef]
- Wang, X.; Wu, C.; Qi, Y.; Xu, Z.; Wang, Z.; Han, T. Effects of straw management and sowing methods on soybean agronomic traits and soil physical properties. Sci. Agric. Sin. 2016, 49, 1453–1465. [Google Scholar]
- Hansel, D.S.S.; Schwalbert, R.A.; Shoup, D.E.; Holshouser, D.L.; Parvej, R.; Prasad, P.V.; Ciampitti, I.A. A Review of Soybean Yield when Double-Cropped after Wheat. Agron. J. 2019, 111, 677–685. [Google Scholar] [CrossRef]
- Roper, M.; Ward, P.; Keulen, A.; Hill, J. Under no-tillage and stubble retention, soil water content and crop growth are poorly related to soil water repellency. Soil Tillage Res. 2013, 126, 143–150. [Google Scholar] [CrossRef]
- Peirone, L.S.; Irujo, G.A.P.; Bolton, A.; Erreguerena, I.; Aguirrezábal, L.A.N. Assessing the Efficiency of Phenotyping Early Traits in a Greenhouse Automated Platform for Predicting Drought Tolerance of Soybean in the Field. Front. Plant Sci. 2018, 9, 587. [Google Scholar] [CrossRef]
- Zhao, Y.; Xu, C.; Yang, X.; Li, S.; Zhou, J.; Li, J.; Han, T.; Wu, C. Effects of sowing methods on seedling stand and production profit of summer soybean under wheat-soybean system. Crops 2018, 4, 114–120. [Google Scholar]
- Karayel, D. Performance of a modified precision vacuum seeder for no-till sowing of maize and soybean. Soil Tillage Res. 2009, 104, 121–125. [Google Scholar] [CrossRef]
- Zhao, H.; Wang, R.-Y.; Ma, B.-L.; Xiong, Y.-C.; Qiang, S.-C.; Wang, C.-L.; Liu, C.-A.; Li, F.-M. Ridge-furrow with full plastic film mulching improves water use efficiency and tuber yields of potato in a semiarid rainfed ecosystem. Field Crop Res. 2014, 161, 137–148. [Google Scholar] [CrossRef]
- Wang, L.; Li, X.G.; Guan, Z.-H.; Jia, B.; Turner, N.C.; Li, F.-M. The effects of plastic-film mulch on the grain yield and root biomass of maize vary with cultivar in a cold semiarid environment. Field Crop Res. 2018, 216, 89–99. [Google Scholar] [CrossRef]
- Chang, L.; Han, F.; Chai, S.; Cheng, H.; Yang, D.; Chen, Y. Straw strip mulching affects soil moisture and temperature for potato yield in semiarid regions. Agron. J. 2020, 112, 1126–1139. [Google Scholar] [CrossRef]
- Deng, H.; Zhang, H.; Xiao, R.; Zhang, Y.; Tian, J.; Li, F.; Wang, Y.; Zhou, H.; Li, X. Effects of different covering planting patterns on soil moisture, temperature characteristics and maize yield in semi-arid region of the Loess Plateau. Sci. Agric. Sin. 2020, 53, 273–287. [Google Scholar]
- Singh, C.B.; Singh, S.; Arora, V.K.; Sekhon, N.K. Residue Mulch Effects on Potato Productivity and Irrigation and Nitrogen Economy in a Subtropical Environment. Potato Res. 2015, 58, 245–260. [Google Scholar] [CrossRef]
- Tuo, Y.; Fei, L.; Yang, L.; Zhang, Y. Simulation study on influence of straw mulch on soil moisture and heat of summer corn farmland. Trans. CSAE 2007, 23, 27–32. [Google Scholar]
- Zribi, W.; Aragüés, R.; Medina, E.; Faci, J. Efficiency of inorganic and organic mulching materials for soil evaporation control. Soil Tillage Res. 2015, 148, 40–45. [Google Scholar] [CrossRef]
- Yang, W.; Zhu, J.; Wu, Q.; Wang, Z.; Du, S. Growth and physiological metabolism characteristic of cotton seedlings under combination of waterlogging and heat stress. Trans. CSAE 2015, 31, 98–104. [Google Scholar]
- Gao, Y.; Tao, H.; Zhu, J.; Huang, S.; Xu, C.; Sheng, Y.; Wang, P. Effects of wheat stubble height on growth and water use efficiency of mechanized sowing summer maize. Sci. Agric. Sin. 2015, 48, 3803–3810. [Google Scholar]
- Cai, T.; Xu, H.; Peng, D.; Yin, Y.; Yang, W.; Ni, Y.; Chen, X.; Xu, C.; Yang, D.; Cui, Z.; et al. Exogenous hormonal application improves grain yield of wheat by optimizing tiller productivity. Field Crop Res. 2014, 155, 172–183. [Google Scholar] [CrossRef]
- Sekhon, N.; Hira, G.; Sidhu, A.; Thind, S. Response of soyabean (Glycine max Mer.) to wheat straw mulching in different cropping seasons. Soil Use Manag. 2005, 21, 422–426. [Google Scholar] [CrossRef]
- Dong, B.; Zheng, X.; Liu, H.; Able, J.A.; Yang, H.; Zhao, H.; Zhang, M.; Qiao, Y.; Wang, Y.; Liu, M. Effects of Drought Stress on Pollen Sterility, Grain Yield, Abscisic Acid and Protective Enzymes in Two Winter Wheat Cultivars. Front. Plant Sci. 2017, 8, 1008. [Google Scholar] [CrossRef]
- Akhtar, K.; Wang, W.; Khan, A.; Ren, G.; Afridi, M.Z.; Feng, Y.; Yang, G. Wheat straw mulching offset soil moisture deficient for improving physiological and growth performance of summer sown soybean. Agric. Water Manag. 2019, 211, 16–25. [Google Scholar] [CrossRef]
- Dam, R.; Mehdi, B.; Burgess, M.; Madramootoo, C.; Mehuys, G.; Callum, I. Soil bulk density and crop yield under eleven consecutive years of corn with different tillage and residue practices in a sandy loam soil in central Canada. Soil Tillage Res. 2005, 84, 41–53. [Google Scholar] [CrossRef]
- Liu, X.; Zhang, X.; Chen, S.; Sun, H.; Shao, L. Subsoil compaction and irrigation regimes affect the root-shoot relation and grain yield of winter wheat. Agric. Water Manag. 2015, 154, 59–67. [Google Scholar] [CrossRef]
- Li, S.; Li, Q.-Q.; Wang, C.-Q.; Li, B.; Gao, X.-S.; Li, Y.-D.; Wu, D.-Y. Spatial variability of soil bulk density and its controlling factors in an agricultural intensive area of Chengdu Plain, Southwest China. J. Integr. Agric. 2019, 18, 290–300. [Google Scholar] [CrossRef]
- Liu, Y.; Liu, Y.; Liu, H.; Shang, J.; Yu, C.; Lin, Q. Effects of straw returning amount on soil physical and chemical properties and yield of wheat. Chin. Sci. Bull. 2013, 29, 131–135. [Google Scholar]
- Hu, C.; Zheng, C.; Sadras, V.O.; Ding, M.; Yang, X.; Zhang, S. Effect of straw mulch and seeding rate on the harvest index, yield and water use efficiency of winter wheat. Sci. Rep. 2018, 8, 8167. [Google Scholar] [CrossRef] [PubMed]
- Kader, M.; Senge, M.; Mojid, M.; Ito, K. Recent advances in mulching materials and methods for modifying soil environment. Soil Tillage Res. 2017, 168, 155–166. [Google Scholar] [CrossRef]
- Li, Q.; Li, H.; Zhang, L.; Zhang, S.; Chen, Y. Mulching improves yield and water-use efficiency of potato cropping in China: A meta-analysis. Field Crop Res. 2018, 221, 50–60. [Google Scholar] [CrossRef]
- Kong, X.; Li, X.; Lu, H.; Li, Z.; Xu, S.; Li, W.; Zhang, Y.; Zhang, H.; Dong, H. Monoseeding improves stand establishment through regulation of apical hook formation and hypocotyl elongation in cotton. Field Crop Res. 2018, 222, 50–58. [Google Scholar] [CrossRef]
- Bunna, S.; Sinath, P.; Makara, O.; Mitchell, J.; Fukai, S. Effects of straw mulch on mungbean yield in rice fields with strongly compacted soils. Field Crop Res. 2011, 124, 295–301. [Google Scholar] [CrossRef]
- Cui, Y.-F.; Meng, J.; Wang, Q.-X.; Zhang, W.-M.; Cheng, X.-Y.; Chen, W.-F. Effects of straw and biochar addition on soil nitrogen, carbon, and super rice yield in cold waterlogged paddy soils of North China. J. Integr. Agric. 2017, 16, 1064–1074. [Google Scholar] [CrossRef]
- He, L.-L.; Zhong, Z.-K.; Yang, H.-M. Effects on soil quality of biochar and straw amendment in conjunction with chemical fertilizers. J. Integr. Agric. 2017, 16, 704–712. [Google Scholar] [CrossRef]
- Wang, Y.; Li, Z.; Han, B.; Shi, Z.; Ning, T.; Jiang, X.; Zheng, Y.; Bai, M.; Zhao, J. Effects of conservation tillage on soil microbial biomass and activity. Acta Ecol. Sin. 2007, 27, 3384–3390. [Google Scholar]
- Zhang, S.-H.; Huang, J.; Luo, Z.-R.; Dong, S.; Wang, Y.-K.; Zhu, Q.-G.; Zhang, L.; Jin, A.-W. Effect of adding different amounts of wheat straw and phosphorus on soil microorganism community. J. Appl. Ecol. 2014, 25, 797–802. [Google Scholar]
- Kuang, E.; Li, Z.; Chi, F.; Zhang, J.; Su, Q.; Zhu, B. Effect of different plough and organic fertilizer on characteristics of soybean yield and soil nutrients. Soybean Sci. 2020, 39, 108–115. [Google Scholar]
- Smith, D.M.; Cusack, S.; Colman, A.W.; Folland, C.K.; Harris, G.R.; Murphy, J.M. Improved Surface Temperature Prediction for the Coming Decade from a Global Climate Model. Science 2007, 317, 796–799. [Google Scholar] [CrossRef] [PubMed]
- Zhang, W.; Cao, G.; Li, X.; Zhang, H.; Wang, C.; Liu, Q.; Chen, X.; Cui, Z.; Shen, J.; Jiang, R.; et al. Closing yield gaps in China by em-powering smallholder farmers. Nature 2016, 537, 671–674. [Google Scholar] [CrossRef]
- Chen, X.; Cui, Z.; Fan, M.; Vitousek, P.; Zhao, M.; Ma, W.; Wang, Z.; Zhang, W.; Yan, X.; Yang, J.; et al. Producing more grain with lower environmental costs. Nature 2014, 514, 486–489. [Google Scholar] [CrossRef]
- Dai, J.; Dong, H. Intensive cotton farming technologies in China: Achievements, challenges and countermeasures. Field Crop Res. 2014, 155, 99–110. [Google Scholar] [CrossRef]
- Dai, J.; Kong, X.; Zhang, D.; Li, W.; Dong, H. Technologies and theoretical basis of light and simplified cotton cultivation in China. Field Crop Res. 2017, 214, 142–148. [Google Scholar] [CrossRef]


| Location | Growing Month | Air Temperature (°C) | Rainfall (mm) | ||
|---|---|---|---|---|---|
| 2018 | 2019 | 2018 | 2019 | ||
| Xinxiang, Henan Province | June | 22.6 | 29.1 | 75.4 | 59.9 |
| July | 27.8 | 29.7 | 78.5 | 30.8 | |
| August | 29.5 | 27.1 | 72.7 | 114.6 | |
| September | 29.0 | 23.0 | 35.3 | 73.5 | |
| October | 16.3 | 16.4 | 0.2 | 64.5 | |
| Suzhou, Anhui Province | June | 26.3 | - | 69.6 | - |
| July | 28.3 | - | 129.3 | - | |
| August | 27.8 | - | 452.4 | - | |
| September | 22.3 | - | 16.7 | - | |
| October | 15.9 | - | 0.6 | - | |
| Treatment | Agricultural Inputs | |||||||
|---|---|---|---|---|---|---|---|---|
| Chemical Fertilizer (kg ha−1) | Pesticides (kg ha−1) | Fuel Consumption for the Machinery(kg ha−1) | Power Consumption for Irrigation (Kw h ha−1) | |||||
| N | P2O5 | K2O | Seeding | Straw Treatment | Harvesting | |||
| IMP | 75 | 100 | 75 | 5 | 36 | 0 | 40 | 552 |
| FP | 75 | 100 | 75 | 5 | 30 | 50 | 40 | 552 |
| Year | Exp. Site | Practice Pattern | Plant Density (104 plant ha−1) | Seeds Per Plant (No.) | 100-Seed Weight (g) | Yield (kg ha−1) | |
|---|---|---|---|---|---|---|---|
| Seeding | Harvesting | ||||||
| 2018 | Suzhou, Anhui Province | IMP | 24.0 | 22.4 a | 65.8 a | 23.7 a | 3800.9 a |
| FP | 24.0 | 18.6 b | 48.8 b | 22.8 a | 2671.0 b | ||
| 2018 | Xinxiang, Henan Province | IMP | 27.0 | 22.7 a | 124.8 a | 15.8 a | 4356.6 a |
| FP | 27.0 | 20.6 b | 114.1 b | 15.3 b | 3694.3 b | ||
| 2019 | Xinxiang, Henan Province | IMP | 29.4 | 26.0 a | 107.8 a | 21.6 a | 4735.9 a |
| FP | 29.4 | 20.4 b | 88.3 b | 20.3 b | 3973.8 b | ||
| Analysis of variance | F value | ||||||
| Exp. site (E) | 303.6 *** | 1133.9 *** | 537.8 * | 208.8 *** | |||
| Treatment(T) | 26.0 *** | 85.1 *** | 54.9 * | 55.5 *** | |||
| E×T | 8.8 ** | 5.5 * | 1.8 ns | 6.2 * | |||
| Parameters | PCA | Communality | |
|---|---|---|---|
| PC1 | PC2 | ||
| Photosynthetic rate (μmol CO2 m−2 s−1) | 0.926 | 0.293 | 0.943 |
| Leaf area index | 0.877 | −0.223 | 0.818 |
| Developmental uniformity | 0.997 | −0.059 | 0.998 |
| Development rate | 0.299 | 0.953 | 0.996 |
| Emergence rate | 0.950 | 0.126 | 0.918 |
| Surface temperature (°C) | −0.985 | 0.162 | 0.996 |
| Dry matter weight (g) | 0.898 | −0.121 | 0.820 |
| Relative water content (%) | 0.986 | −0.156 | 0.997 |
| Principal component eigenvalue | 6.360 | 1.127 | |
| Variance explained (%) | 79.502 | 14.091 | |
| Cumulative variance explained (%) | 79.502 | 93.593 | |
Publisher’s Note: MDPI stays neutral with regard to jurisdictional claims in published maps and institutional affiliations. |
© 2021 by the authors. Licensee MDPI, Basel, Switzerland. This article is an open access article distributed under the terms and conditions of the Creative Commons Attribution (CC BY) license (https://creativecommons.org/licenses/by/4.0/).
Share and Cite
Xu, C.; Li, R.; Song, W.; Wu, T.; Sun, S.; Shen, W.; Hu, S.; Han, T.; Wu, C. Integrating Straw Management and Seeding to Improve Seed Yield and Reduce Environmental Impacts in Soybean Production. Agronomy 2021, 11, 1033. https://doi.org/10.3390/agronomy11061033
Xu C, Li R, Song W, Wu T, Sun S, Shen W, Hu S, Han T, Wu C. Integrating Straw Management and Seeding to Improve Seed Yield and Reduce Environmental Impacts in Soybean Production. Agronomy. 2021; 11(6):1033. https://doi.org/10.3390/agronomy11061033
Chicago/Turabian StyleXu, Cailong, Ruidong Li, Wenwen Song, Tingting Wu, Shi Sun, Weiliang Shen, Shuixiu Hu, Tianfu Han, and Cunxiang Wu. 2021. "Integrating Straw Management and Seeding to Improve Seed Yield and Reduce Environmental Impacts in Soybean Production" Agronomy 11, no. 6: 1033. https://doi.org/10.3390/agronomy11061033
APA StyleXu, C., Li, R., Song, W., Wu, T., Sun, S., Shen, W., Hu, S., Han, T., & Wu, C. (2021). Integrating Straw Management and Seeding to Improve Seed Yield and Reduce Environmental Impacts in Soybean Production. Agronomy, 11(6), 1033. https://doi.org/10.3390/agronomy11061033