Article

Nonadditive Effects on Decomposition of a Mixture of Rice Straw and Groundnut Stover Applied to a Sandy Soil

by
Wimonsiri Pingthaisong
1,2 and
Patma Vityakon
1,2,*
1
Soil Organic Matter Management Research Group, Khon Kaen University, Khon Kaen 40002, Thailand
2
Department of Soil Science and Environment, Faculty of Agriculture, Khon Kaen University, Khon Kaen 40002, Thailand
*
Author to whom correspondence should be addressed.
Agronomy 2021, 11(6), 1030; https://doi.org/10.3390/agronomy11061030
Submission received: 20 April 2021 / Revised: 18 May 2021 / Accepted: 19 May 2021 / Published: 21 May 2021
(This article belongs to the Section Soil and Plant Nutrition)

Abstract

:
Rice straw is an abundant resource, but its use as a sandy soil amendment does not increase soil organic matter (SOM) accumulation. Our study aimed to determine the altered decomposition processes that result from mixing rice straw (RS) (low N, high cellulose) with groundnut stover (GN) (high N) relative to applying these residues singly to a sandy soil to identify the mechanisms underlying decomposition of the mixed residues. A microcosm experiment using the litter bag technique showed synergistic, nonadditive effects (observed < predicted values) of residue mass remaining (31.1% < 40.3% initial) that were concomitant with chemical constituent loss, including C (cellulose, lignin) and N. The nonadditive effects of soil microbiological parameters in response to the applied residues were synergistic (observed > predicted values) for microbial biomass C (MBC) (92.1 > 58.4 mg C kg−1 soil) and antagonistic (observed < predicted values) for microbial metabolic quotient (i.e., the inverse of microbial C use efficiency (CUE)) (0.03 < 0.06 mmol CO2-C • mmol MBC−1 • hr−1) and N mineralization (14.8 < 16.0 mg N kg−1 soil). In the early stage of decomposition (0–14 days), mixed residues increased MBC relative to the single residues, while they decreased N mineralization relative to single GN (p ≤ 0.05). These results indicate an increase in microbial substrate CUE and N use efficiency (NUE) in the mixed residues relative to the single residues. This increased efficiency provides a basis for the synthesis of microbial products that contribute to the formation of the stable SOM pool. The SOM stabilization could bring about the SOM accumulation that is lacking under the single-RS application.

1. Introduction

Degraded tropical sandy soils have low fertility, which can be partly attributed to their low soil organic matter (SOM) or soil organic carbon (SOC) content. Land-use change from forest to agriculture has accelerated loss of SOM due to burning of vegetation in land clearing and plowing, which increase the rate of SOM decomposition [1]. The addition of organic residues to degraded soil can improve soil properties by increasing SOC accumulation [2]. However, the effectiveness of organic residues in restoring SOC depends on their biochemical composition or quality [2,3], which is the primary controller of their decomposition [3,4]. The chemical composition parameters of organic residues that profoundly influence their decomposition include cellulose (CL), nitrogen (N), polyphenols (PP), and lignin (L) [3,4]. Various carbonaceous (C) compounds, constituents of these residues, are classified as labile or resistant based on their decomposability. These two different types of C compounds differ in the extent to which they can restore soil fertility and have profound implications for SOC accumulation and stabilization [2]. In addition to C, the N compound constituents of organic residues interact with C and influence decomposition and SOM accumulation [5]. In the current model of SOC accumulation resulting from plant litter decomposition, a more significant role in SOC stabilization is assigned to the labile constituents of litters than their recalcitrant counterparts. These labile constituents undergo microbial-mediated decomposition during the early stage of decomposition, which produces microbial products that are stabilized in the soil matrix, while the recalcitrant constituents that are mainly decomposed in the later stage produce particulate organic matter that is physically transferred into the soil matrix [6,7].
Rice straw (RS) is a residue that is available in large quantities (50–60 million tons year−1) in agricultural systems in Thailand [8]. Unfortunately, the use of rice straw as a soil amendment does not promote SOC accumulation because it has high CL but low N and L, resulting in rapid decomposition that leads to C loss as CO2 [3,9]. In addition, the dissolved organic carbon (DOC) produced by decomposing RS is easily leached from topsoil because of its low molecular weight, which further limits SOC accumulation [10]. Moreover, because RS has low N content, it does not improve soil N status. Groundnut stover (GN) is also available to some farming systems in Thailand and is a high-quality residue (high N, low L, and PP) that not only enhances soil N status but also results in high SOC accumulation due to interactions between L and PP with N [3].
Mixing RS with GN would likely change the pattern of decomposition and lead to higher SOC accumulation than what would result from RS alone. In an experiment in Northeast Thailand, Keawpradit et al. [11] found that mixing RS with GN stover at a ratio of 1:1 (w/w) produced significantly higher SOM than a mixture that contained a lower proportion of groundnut stover (1:0.5 w/w). Moreover, a 1:1 mixture of RS with GN not only decreased the amount of mineral N but also slowed the release of N into the soil relative to GN alone [12]. The decrease in N release was associated with N immobilization in the microbial biomass in the mixture. There are also studies in various global ecosystems that have shown the positive effects of litter mixtures on SOC accumulation and N conservation. A recent study on tree–shrub agroforestry systems in Bangladesh found that higher plant diversity brought about higher SOC and soil N than lower diversity counterparts [13]. A meta-analysis study showed that plant mixtures globally enhanced SOC accumulation compared with their monoculture counterparts [14]. Another study on the decomposition of litter mixtures of grass (Stipa baicalensis) and legumes (Melissitus ruthenica) in a natural meadow steppe ecosystem in Mongolia showed that legumes significantly promoted the decomposition of the grass component in the litter mixture. The legume had a greater initial N concentration than the grass, which promoted the increase in N availability in the mixture compared with the grass litter decomposition alone [15]. Similarly, Redin et al. [16] found in subtropical agroecosystems an increased availability of N when stems (low N) and leaves (high N) of representative agricultural crops (main and cover crops) were mixed relative to when they were decomposed singly due to increased microbial N immobilization and decreased soil N mineralization. The use of a mixture of labile and N-rich shoots and recalcitrant roots of green manure species, vetch (Vicia sativa) and oats (Avena sativa), has been found to lead to higher C and N contents in microaggregates than applying shoots and roots alone. The higher soil C and N accumulation was attributed to decreases in C loss through respiration despite increases in microbial enzyme activities [17]. Despite this body of research, the mechanisms of microbial decomposition underlying SOC accumulation and soil N conservation in an RS and GN mixture have not been elucidated.
Microbial decomposition is the process by which microbial decomposers use substrates to obtain energy (catabolism) and build up their mass (anabolism). The efficiency of microbial decomposers in using substrates is termed substrate use efficiency (SUE) and is a measure of the amount of ATP released through catabolism compared with the anabolic production of biomolecules [6]. A high SUE indicates that microbial decomposers have a higher rate of anabolic processing than catabolic processing, and vice versa for low SUE. The SUE is controlled by various factors pertaining to the substrate and the physiological state of the microorganisms, while the controlling factors of the substrates are associated with the chemical composition and stoichiometry of the chemical composition. With particular attention to C and N nutrients, microbial C (CUE) and N (NUE) use efficiencies are the fractions of C or N in substrates that are lost relative to those incorporated into the microbial biomass [18,19]. In other words, the CUE indicates the amount of C incorporated into the microbial biomass used for biomass production. Microbial CUE is represented by the ratio of C in microbial respiration to that assimilated as microbial biomass, which is termed microbial metabolic quotient (qCO2) [20]. qCO2 was originally used to study microbial C requirements for the maintenance of its eco-physiological status [21,22], but was later used to study the metabolic status of forest soils with different vegetation types (e.g., simple Fagus vs. simple Picea vs. mixed FagusQuercus) [23]. The different chemical qualities of the different vegetation types were reflected in qCO2, which indicated that the mixed vegetation forest soil had lower qCO2 than the simple forest soils [23], meaning that mixed vegetation soil had a higher rate of anabolic metabolism than simple vegetation soils. Generally, qCO2 is negatively correlated with microbial CUE [20], indicating that qCO2 represents the inefficiency of microbial biomass [24]. High qCO2 values have been used as a proxy for low microbial CUE, since more substrate C loss in microbial respiration results in less substrate C available for microbial biomass [25].
Similar to CUE, NUE indicates the physiological function of microorganisms [26]. Microbial NUE is represented by the ratio of the mineralized N per unit of soil microbial biomass N, which is termed microbial N metabolic quotient (qN) [27]. qN is influenced by microbial biomass and its elemental stoichiometry [28]. Limited N conditions commonly found in terrestrial ecosystems drive the elemental stoichiometry of heterotrophs in decomposing organic materials to meet their physiological requirements [29,30]. Microbial stoichiometry plays a critical role in soil N cycling in various terrestrial ecosystems on a global scale [28], and the metabolic quotients of C (qCO2) and N (qN) have been used as effective indicators of microbial resource use efficiency in the chronosequence of turfgrass and native pines [27]. Increases in CUE and NUE (i.e., reduced qCO2 and qN) were found in old turfgrass systems relative to their younger counterparts, indicating that the former had a greater capacity to conserve soil C and N compared with the latter systems [27]. Thus, we hypothesized that microbial SUE during residue decomposition is altered when RS and GN residues are mixed as compared with when they decompose alone.
Decomposition of mixed plant residues produces nonadditive effects, which describe the decomposition of plant residue mixtures that can be faster or slower than the average decomposition rate of single-component species [31]. Nonadditive effects can be divided into two types: the synergistic effect describes the decomposition of plant residue mixtures that are faster, while the antagonistic effects indicate slower decomposition relative to the average decomposition rates of the single-component species [31]. Several studies on the mixing of residues have found both types of nonadditive effects. Bonanomi et al. [32] reported synergistic-type nonadditive effects in studying the decomposition of a mixture between plant residues (Hedera helix and Quercus ilex) with high quality (high N concentration) with cellulose strips (high CL) and wood sticks (high L). Nitrogen transfer mechanisms were found to control these synergistic nonadditive effects, indicated by N transfer from the high-quality (H. helix and Q. ilex) to the low-quality residues (cellulose strips and wood sticks), leading to faster decomposition (synergistic effect) of the mixed residues than the cellulose strips and wood sticks alone. Similarly, Mao and Zeng [33] studied the decomposition dynamics and nutrient release of mixed tree and crop residues in temperate agroforestry systems and found that increasing the proportion of crop residues with high N concentrations (soybean leaves) resulted in a synergistic effect due to N transfer. However, antagonistic effects in a mixture were found to be due to inhibited microbial growth and activities [34], which were largely associated with the presence of recalcitrant compounds, such as resistant substance–protein complexes [35]. We further hypothesized that the N transfer process took place when N-rich GN was mixed with N-poor RS, which altered the decomposition of the RS + GN mixture relative to each residue alone. The objectives of our study were to determine the altered decomposition processes resulting from the mixing of RS (low N, high CL) with GN stover (high N) as compared with the decomposition of these residues when applied singly and to identify the mechanisms underlying altered decomposition of the mixed residues relative to the single residues that affect SOC accumulation.

2. Materials and Methods

2.1. Soil and Plant Residues

The studied soil was a coarse-textured Khorat (isohyperthermic Typic Oxyaquic Kandiustults) [36], an Ultisol, collected at a depth of 0–20 cm from the Fruit Tree Research Section of Khon Kaen University, Thailand (16°27′52″ N; 102°48′17″ E). The soil was air-dried and passed through a 2 mm sieve. The initial properties of the Khorat soil were as follows: sand, 79.9%; silt, 17.6%; clay, 2.5% [37]; bulk density, 1.47 g cm−3; pH (soil/H2O = 1:2.5) 5.2; cation exchange capacity (CEC), 3.5 cmolc kg−1; organic C, 4.9 g kg−1; total N, 0.3 g kg−1; and extractable cations (mg kg−1), 156.2 for K+, 66.2 for Na+, 19.8 for Ca2+, and 30.8 for Mg2+.
Two types of locally available plant residues, rice straw (Oryza sativa) (RS) and groundnut stover (Arachis hypogaea) (GN), were assessed for their soil amendment values in their single and mixed forms. Rice straw was procured from cultivated fields of a nearby farm, while GN depodded aerial and root parts were collected from experimental fields. Both residues were of different quality or chemical composition; RS (low N, high C/N ratio) was classified as low quality, while GN (high N and low C/N ratio) was high quality (Table 1). The RS and GN residues were air-dried and cut into pieces 1 cm in length, and the leaves of GN were processed into 1 × 1 cm pieces. To prepare the residue mixture, the two residues were mixed in equal proportions by weight (RS/GN = 1:1 w/w). The chemical compositions of the single and mixed residues are listed in Table 1.

2.2. Incubation Experiment

A microcosm incubation experiment was set up in the dark in the laboratory with an average temperature of 30 °C. There were four treatments: (1) unamended soil (CT), (2) soil amended with RS alone (RS), (3) soil amended with GN alone (GN), and (4) soil amended with mixed RS/GN (1:1 w/w) (RS + GN). These treatments were arranged in a randomized complete block design with three replicates. An experimental unit consisted of a 1 L jar (approximately 11 cm in diameter and 13 cm in height) containing 500 g (air-dried weight) soil in a 3.5 cm thick soil layer measured from the bottom of the jar. Air-dried soil contained in each jar was rewetted to a moisture content of 12.5% (w/w), equivalent to 70% of the water holding capacity of the soil. The units were preincubated for 7 d before residue treatment. The moisture was maintained throughout the experiment, including the preincubation period, by weighing the experimental units and adding distilled water to a specified precalculated weight.
The litter bag technique was used to study the residue decomposition. Residue materials were placed into 7 cm × 7 cm polyethylene litter bags (2 mm mesh) at a rate of 3.32 g kg−1 soil dry weight. This rate was equivalent to 10 Mg ha−1 based on the average amounts of RS and GN residues remaining after harvest in the fields and a plow soil depth of 20 cm. After the 7-day preincubation, the litter bag was buried in the soil in the jar at 1.5 cm soil depth from the soil surface. Nondestructive soil sampling was performed. Soil sampling and litter bag retrieval were conducted before litter bag burial (time 0) and 3, 7, 14, 28, and 56 days after burial or after residue incorporation (DAI). Litter remaining in the litter bag was removed from the bag, and soil materials were removed using a brush. The remaining cleaned litter was oven-dried at 60 °C until the weight did not change to determine the remaining dry mass.

2.3. Analyses of Soil and Plant Residues

Soil particle size distribution was determined using the pipette method, and the bulk density was determined using the core method [38]. Soil cation exchange capacity (CEC) was determined with 1 M NH4OAc extraction at pH 7 [39], and the NH4+ concentration was determined using the micro-Kjeldahl method to calculate the CEC. Soil organic C was determined by Walkley and Black wet digestion method, and total N by micro-Kjeldahl method. Soil exchangeable basic cations (Ca2+, Mg2+, K+, and Na+) were extracted by ammonium saturation using the 1 M NH4OAc extraction method at pH 7.0 [39]. The levels of Ca2+, Mg2+, K+, and Na+ were determined in the soil extract using a flame atomic absorption spectrophotometer (Flame AAS novAA® 350, Analytik Jena, Jena, Germany) for Ca2+ and Mg2+ (in atomic absorption mode) and for K+ and Na+ (in flame photometry mode). Soil respiration was determined using the alkaline trap method [40]. Evolved CO2 was trapped in a small glass bottle (4 cm diameter and 6.5 cm height) containing 1 M NaOH solution, which was placed in the microcosms and left for 24 h. Carbon dioxide was determined by back titration with 0.5 M HCl after carbonate precipitation with excess 0.5 M BaCl2 [40]. Microbial biomass C (MBC) and N (MBN) were determined in fresh soil samples using the chloroform fumigation–extraction method [41]. The soil was fumigated with ethanol-free chloroform for 24 h at room temperature in a desiccator. Fumigated and unfumigated samples (20 g) were extracted with 100 mL 0.5 M K2SO4 for MBC and 1 M KCl for MBN. The MBC was determined after soil oxidation with K2Cr2O7 and calculated as the difference in values between the fumigated and unfumigated samples using a kEC factor of 0.33 [42]. The MBN was determined by ninhydrin-reactive N method and calculated as the difference in values between the fumigated and unfumigated samples using a kEN factor of 3.1 [41]. Soil mineral N (ammonium, NH4+-N, and nitrate; NO3-N) was extracted from 10 g fresh soil samples with 50 mL 2 M KCl, and an aliquot was analyzed for NH4+-N colorimetrically using a flow injection analyzer (FIAstar® 5000, Foss, Höganäs, Sweden). Nitrate-N was determined with the cadmium reduction method [43] using a UV–VIS spectrophotometer (Agilent® 5061-3387, Agilent Technologies, Waldbronn, Germany).
For residue analysis, subsamples of 0.5–1.0 g ground residue materials were dry-ashed at 550 °C for 6 h [44] to determine the ash content, which signifies the mineral or inorganic matter. The weight of the ash was subtracted from the litter dry weight to obtain an ash-free dry weight that reflected a condition free of mineral contamination. Analyses of the chemical composition of plant residues included the following: total C and N in plant residues by dry combustion at 950 °C using a TOC/TNb analyzer (multi N/C® 2100S, Analytik Jena, Jena, Germany); lignin, cellulose, and acid detergent fiber (ADF) or lignocellulose were extracted with an acid detergent using a Fibretherm analyzer (Fibretherm FT12, Königswinter, Germany), followed by their measurement using the sequential digestion of fiber method [45].

2.4. Calculations and Statistical Analysis

Soil respiration (i.e., evolved CO2-C) was computed with Equation (1) [40]:
CO2-C = (B − V) NE
where B is the volume (mL) of acid (HCl) used to titrate the alkali (NaOH) of the blank (no soil and residue), V is the volume (mL) of acid used to titrate the soil sample, N is the normality of acid (HCl), and E is the equivalent weight of CO2-C.
The microbial metabolic quotient (qCO2) was calculated using Equation (2) [20]:
qCO2 = CO2-C/MBC
where CO2-C (mmol C kg−1 soil h−1) is the soil respiration and MBC (mmol C kg−1 soil) is the microbial biomass C.
The microbial N metabolic quotient (qN) was calculated using Equation (3) [27]:
qN = Min N/MBN
where Min N (mg N kg−1 soil) is the soil mineral N (NH4+-N + NO3-N) and MBN (mg N kg−1 soil) is the microbial biomass N.
The predicted values of the different parameters of the decomposing plant residues included the remaining ash-free dry weight (AFDW), remaining C, remaining N, ADF, L, and CL, while those for the soil parameters included CO2 evolution, MBC, soil mineral N, MBN, qCO2, and qN. The predicted values of these residue and soil parameters were calculated from the measured changes in these parameters for each component of the single residues. Calculations of “predicted” changes used Equation (4):
Rp (predicted value) = (RA + RB + …Rn)/N
where R is the remaining quantity of mass or remaining chemical constituents of the residue or soil response, RA is the value of residue A, RB is the value of residue B, and N is the number of residue types in the mixture.
To determine the nonadditive effects, the dynamics of plant residue decomposition presented by “measured” or “observed value” in the mixtures were related to the “predicted value” employing regression equations. The nonadditive effects of the soil parameters were determined using a paired t-test between the observed and predicted values.
A two-way analysis of variance under a randomized complete block design in a factorial arrangement was conducted to determine the effects of different plant residues, day after residue incorporation (time), and their interactions on soil parameters, including CO2 evolution, MBC, soil mineral N, MBN, qCO2, and qN, as well as on plant residue parameters, which included remaining ash-free dry weight (AFDW), remaining C, remaining N, ADF, L, and CL. Mean comparisons between residue treatments and time were assessed by the least significant difference (LSD) and standard error of the mean. All statistical analyses were performed using the Statistix version 10.0 software (Analytical Software, Tallahassee, FL, USA 2013). Statistical significance was set at p ≤ 0.05.

3. Results

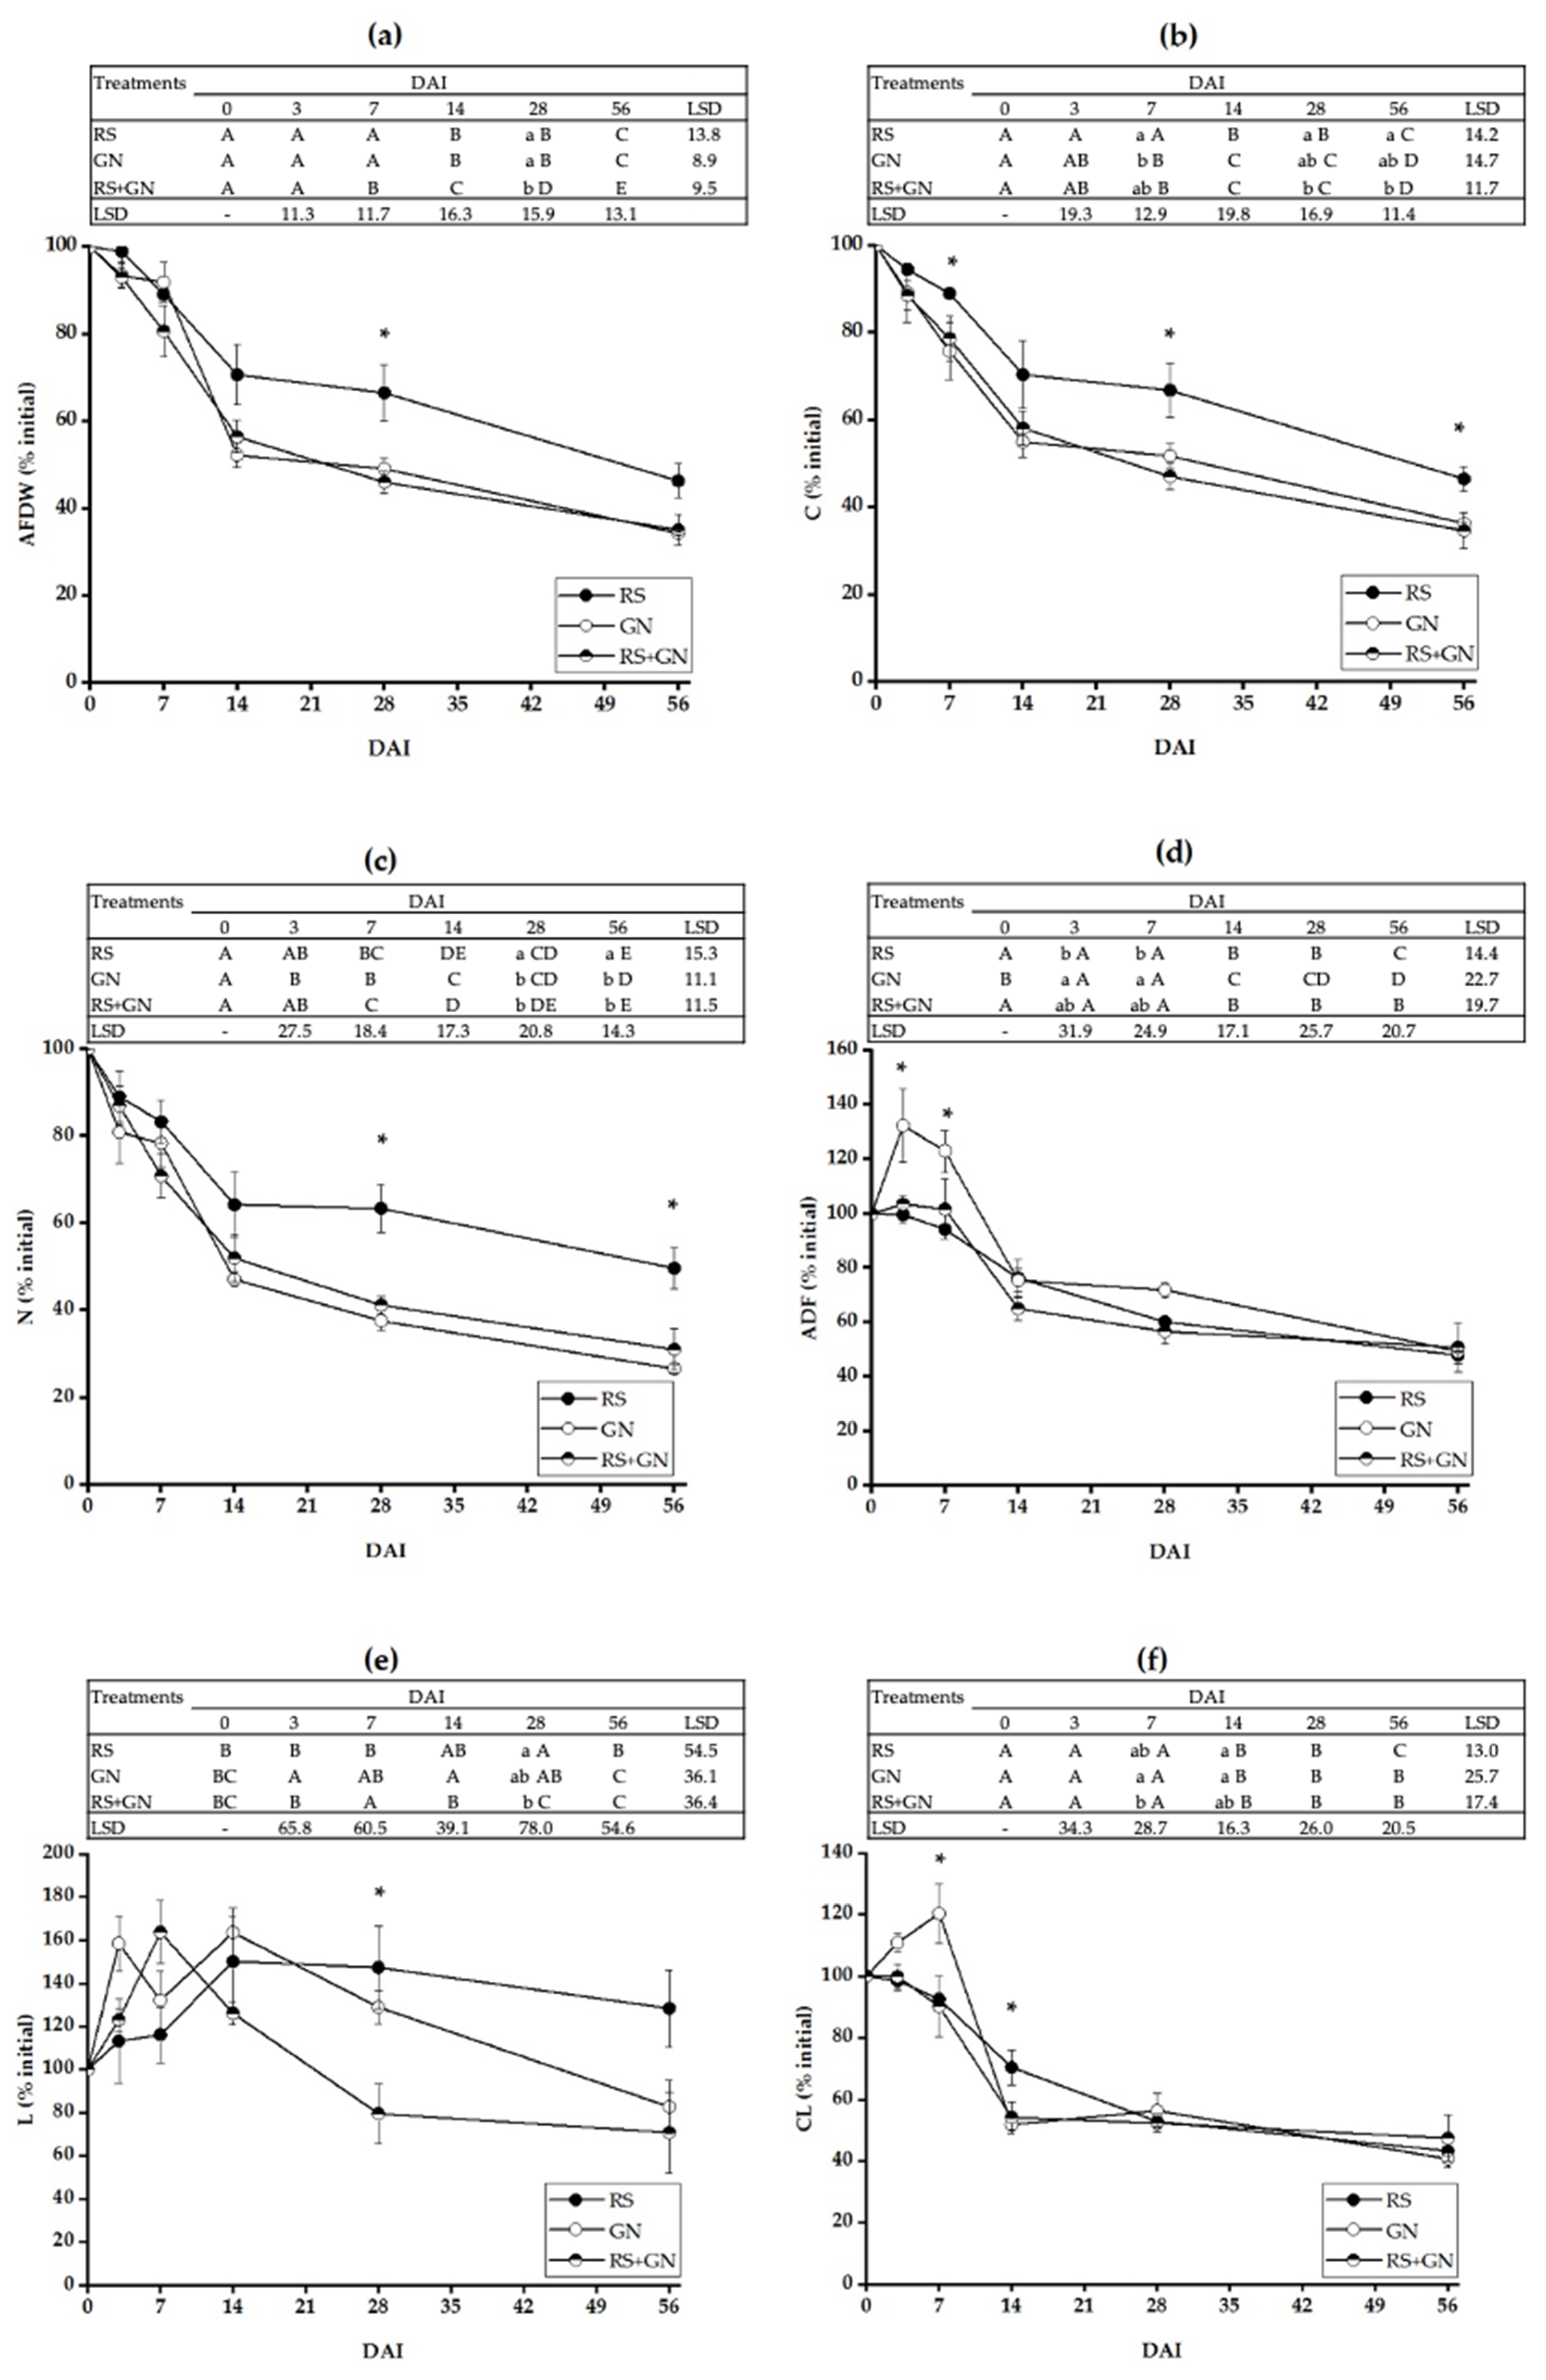
3.1. Decomposition Dynamics of Single versus Mixed Residues

During the first 14 d after residue incorporation (0–14 DAI), all residues showed a rapid decline in mass, and the mass remaining was lower at the end of this stage than at the beginning (Figure 1a) (p ≤ 0.05). During the initial early stage (0–7 DAI), only the mixed (RS + GN) treatment showed a significant decline from day 3 to day 7, indicating enhanced decomposition in the mixed residues relative to the single residues. At the end of this stage, RS had the highest remaining mass (70.6% of the initial remaining weight), while GN showed the lowest remaining mass (52.2%) and the mixed residue was intermediate (56.5%). Mixing RS with GN enhanced the decomposition of RS at the end of the first 14 DAI period. The initial rapid mass losses in all residue treatments were accompanied by the loss of C and N (% initial) (Figure 1b,c). The N loss was particularly significant in the mixed treatment during periods 3–7 (DAI) (p ≤ 0.05). The remaining N in mixed residues was intermediate between the single residues, in which GN had the lowest and RS the highest remaining N in the periods from 14 DAI onwards. The trend of a higher % remaining N in the mixed residues relative to GN alone indicated that the mixed residues deterred N loss compared with the single-GN application. The ADF (% initial) content, which represents lignocellulose, increased in GN relative to the initial content (day 0) during 3–7 DAI (p ≤ 0.05). However, that of RS and the mixed residues remained relatively unchanged during this period (Figure 1d). As decomposition continued during 7–14 DAI, ADF significantly decreased in all treatments (p ≤ 0.05); at the end of the first 14 DAI, ADF was lower in the mixed-residue treatment than in the single-residue treatments. The mixed residues tended to lower the ADF content below that of the single residues, especially when compared with GN.
The L content (% initial) in all residue treatments increased and was higher than the initial relative content during the first 14 DAI (Figure 1e). The increase in L in the mixed treatment (RS + GN) peaked at 7 DAI, while in the single residues, it peaked at 14 DAI (Figure 1e). Cellulose (% initial) in GN increased and peaked during 0–7 DAI, while that of single-RS and mixed (RS + GN) treatments did not change during this period (Figure 1f). However, during 7–14 DAI, CL decreased in all residue treatments (p ≤ 0.05), and at the end of the early stage (14 DAI), CL was lower in the mixed residues than in the single-RS treatment.
During the later period of decomposition (14–56 DAI), mass losses in all residue treatments were not as rapid as those measured in the earlier period (0–14 DAI). During 14–28 DAI, only the mixed residues showed a significant decrease in mass, indicating enhanced decomposition relative to both single-residue treatments alone. At 28 DAI, the remaining mass in the mixed residues (46%) was lower than that in RS (66.5%) (p ≤ 0.05), indicating that through mixing, RS decomposition was significantly enhanced (Figure 1a). After 28 DAI, the mass continued to decline to 56 DAI in all treatments (p ≤ 0.05). At 56 DAI, the mixed residues had the lowest remaining mass, while single RS had the highest, further indicating that the enhanced decomposition of RS was due to its mixing with GN. The gradual mass losses in all residue treatments in the later period (14–56 DAI) were accompanied by the loss of C and N (% initial) (p ≤ 0.05), except for N in the single-RS treatment (Figure 1b,c). The ADF during the later stage (14–56 DAI) decreased only in the single-residue (GN and RS) treatments (p ≤ 0.05) (Figure 1d). Lignin (% initial) in the mixed treatment decreased during 14–28 DAI (p ≤ 0.05) and was lowest at 28 DAI (Figure 1e). After 28 DAI, the L contents of the single residues (GN and RS) decreased (p ≤ 0.05), while the mixture did not; however, the L content of the mixed-residue treatment remained lowest. The relative CL content during the later period (14–56 DAI) in all residue treatments was stable except for RS, which showed a decrease in CL during 28–56 DAI (p ≤ 0.05) (Figure 1f).

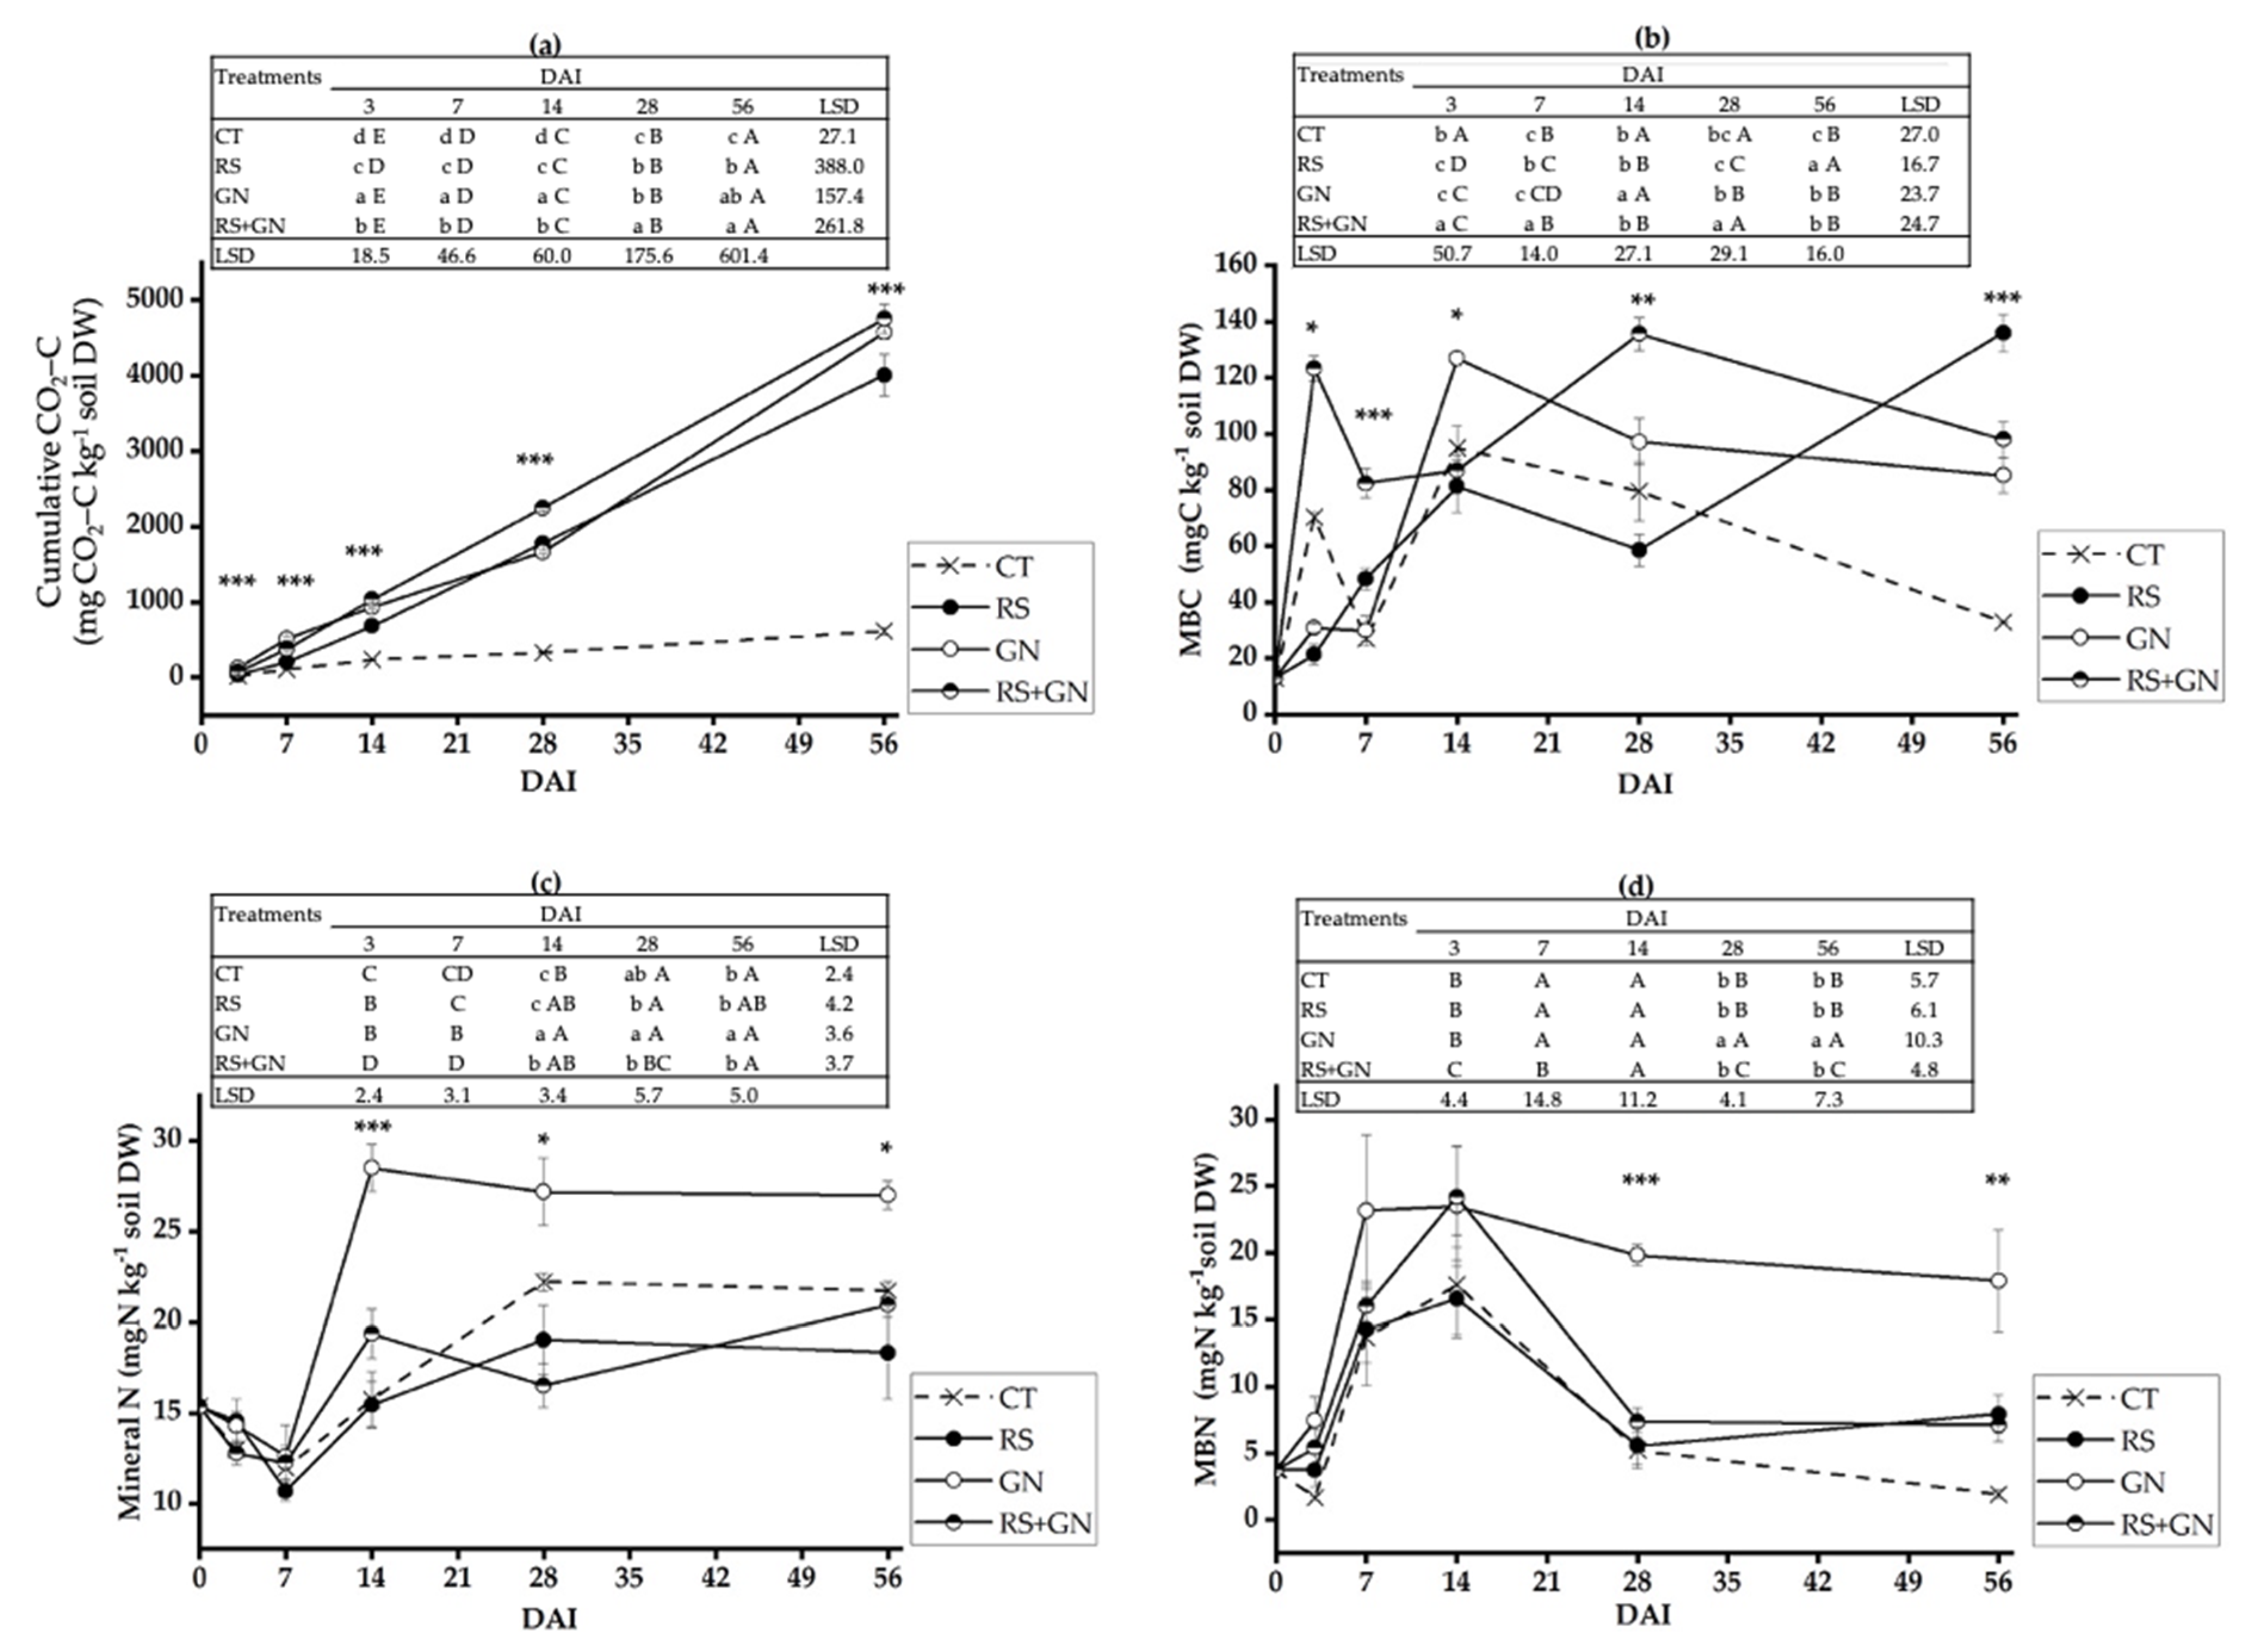
3.2. Dynamics of Soil Microbiological Processes with the Application of Single versus Mixed Residues

The mixed treatment (RS + GN) had a higher cumulative CO2-C evolution than RS (p ≤ 0.05) during the entire decomposition period. In contrast, the mixed treatment had a lower cumulative CO2-C evolution than GN during 3–7 DAI (p ≤ 0.05) (Figure 2a). During the later period (14–56 DAI), the mixed treatment had the highest cumulative CO2-C evolution (p ≤ 0.05). Microbial biomass C and N, as well as mineral N, of all treatments peaked at 14 DAI, after which they steadily decreased. The mixed treatment had the highest MBC during 3–7 DAI and later at 28 DAI (p ≤ 0.05) (Figure 2b). In contrast, RS had the lowest MBC in most decomposition periods except at 7 and 56 DAI. Additionally, GN showed the highest MBC at 14 DAI (p ≤ 0.05). The MBN of the mixed treatment was intermediate between GN (higher MBN than the mixed treatment) and RS (lower MBN than the mixed treatment) during the entire decomposition period, except at 14 and 56 DAI, which was comparable to both GN and RS (Figure 2d). Therefore, the mixed treatment decreased MBN below that of the single-GN treatment but increased it over that of the single-RS treatment. Soil mineral N in the mixed treatment showed intermediate values between GN and RS; it was lower than GN but higher than RS during the entire decomposition period except 28 DAI, in which it had the lowest mineral N (Figure 2c). In addition, the mixed treatment had a lower soil mineral N than GN during 14–56 DAI (p ≤ 0.05). In contrast, the mixed treatment had a higher mineral N than RS at 14 DAI (p ≤ 0.05). Moreover, during 28–56 DAI, the mixed treatment had lower soil mineral N than the unamended treatment (CT).

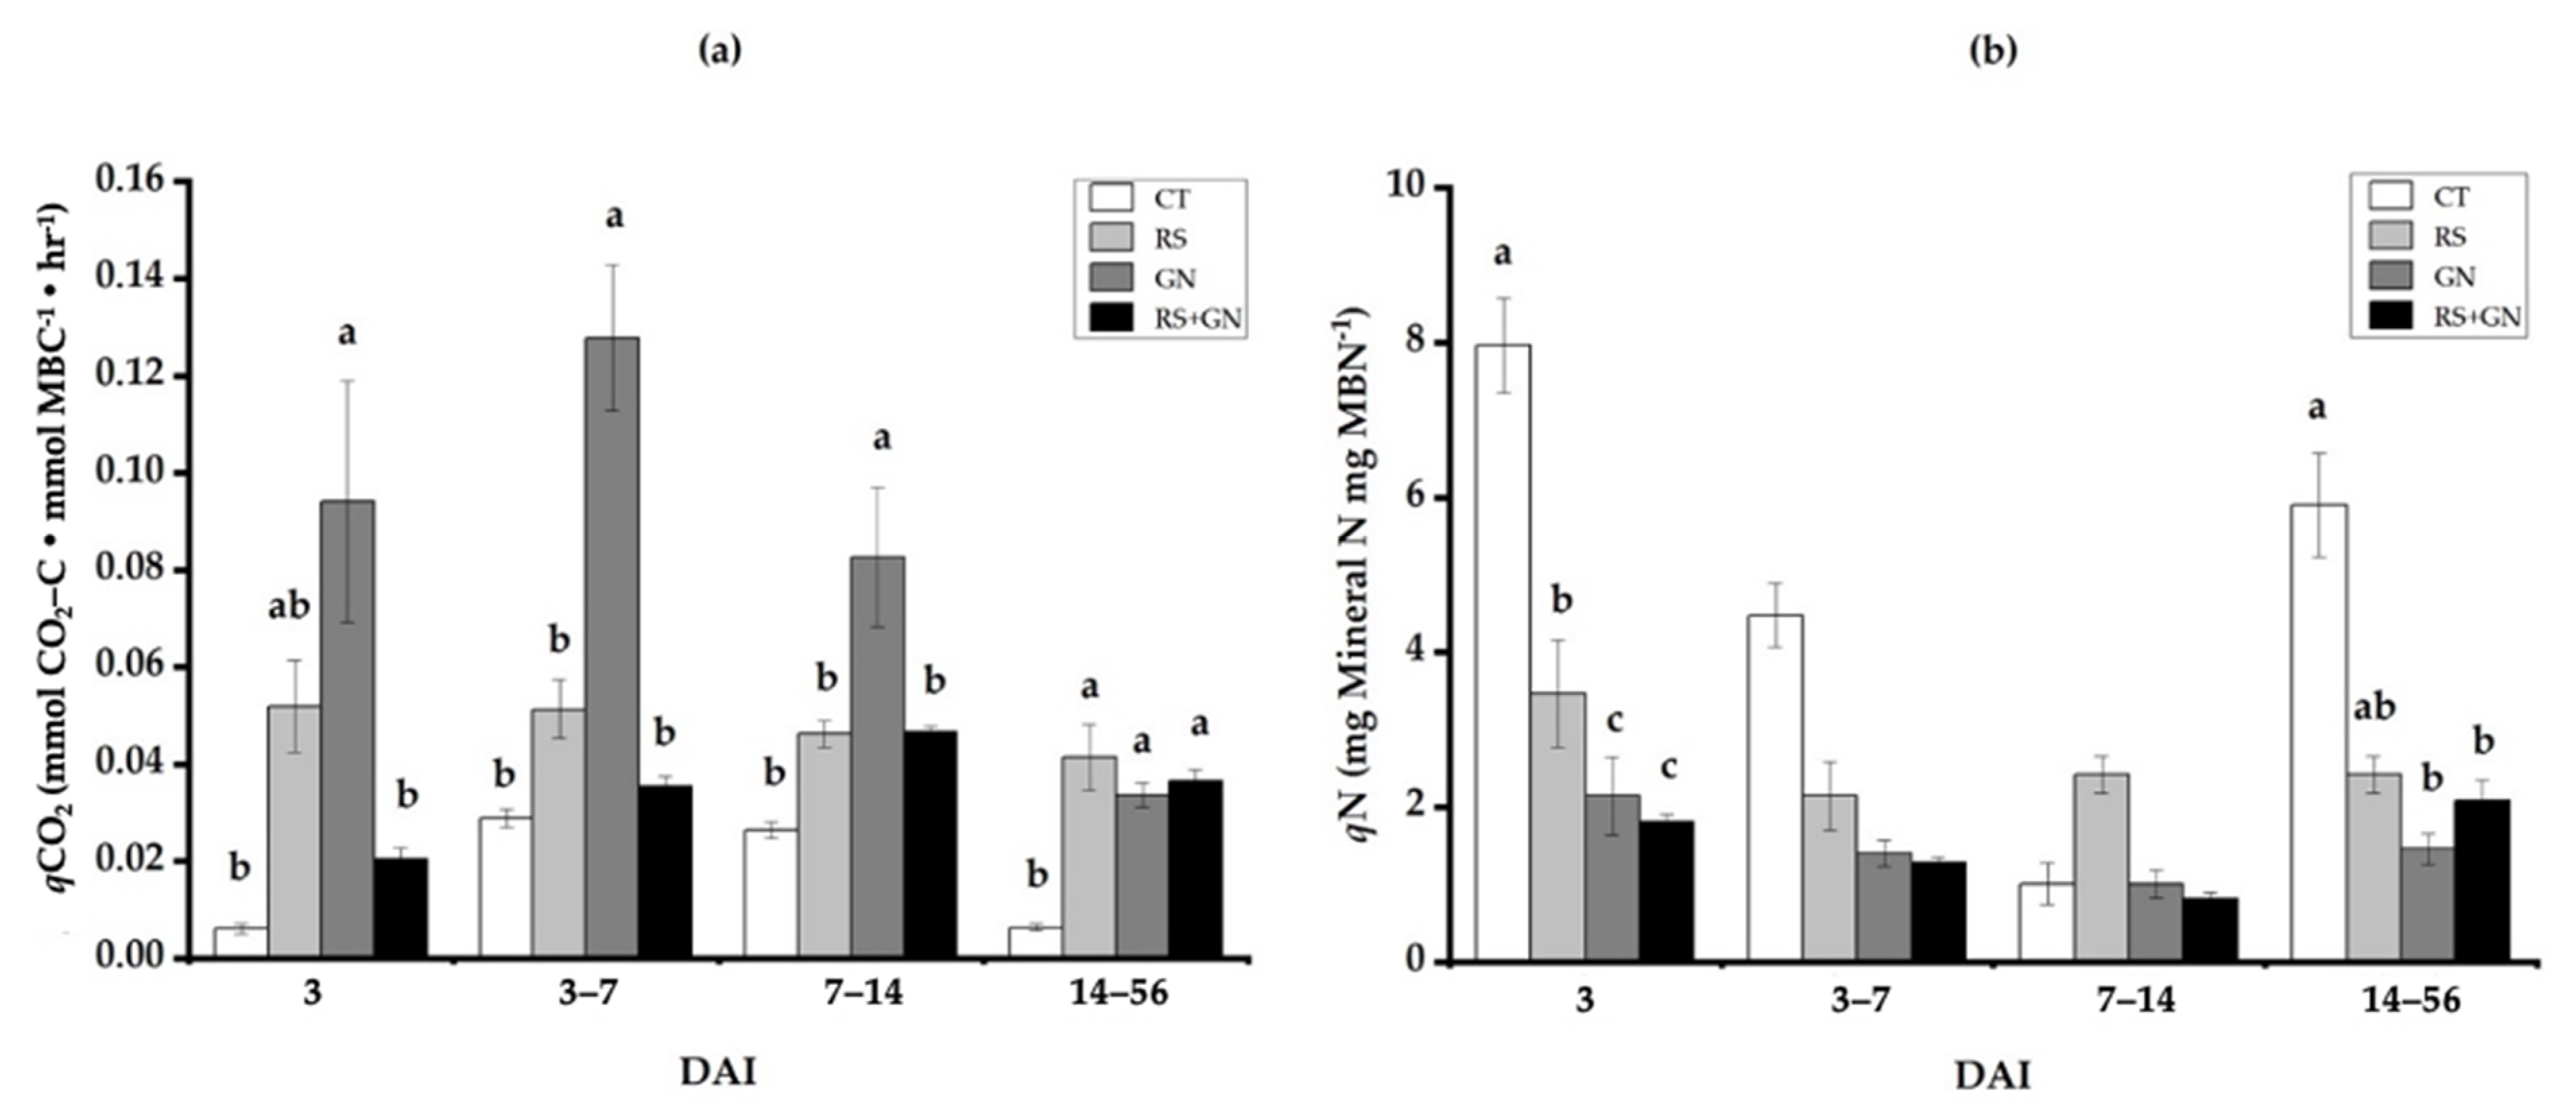
3.3. Dynamics of Microbial Metabolic and Microbial N Quotients under Single versus Mixed Residues

Microbial CUE and NUE are the inverse of the microbial metabolic (qCO2) and microbial N (qN) quotients. Each of these parameters is the ratio of the respective nutrients (C or N) lost from the microbial decomposition subsystem to that retained within the microbial biomass subsystem. During the first 14 DAI of decomposition, the mixed treatment reduced qCO2 below that of the single residues, particularly GN (p ≤ 0.05) (Figure 3a). The mixed treatment also showed a reduced qN below that of the single residues, particularly with RS during the initial period (3 DAI) (p ≤ 0.05) (Figure 3b). After the first 14 DAI, the qCO2 and qN of the mixed treatment did not differ from the single residues (p ≥ 0.05).

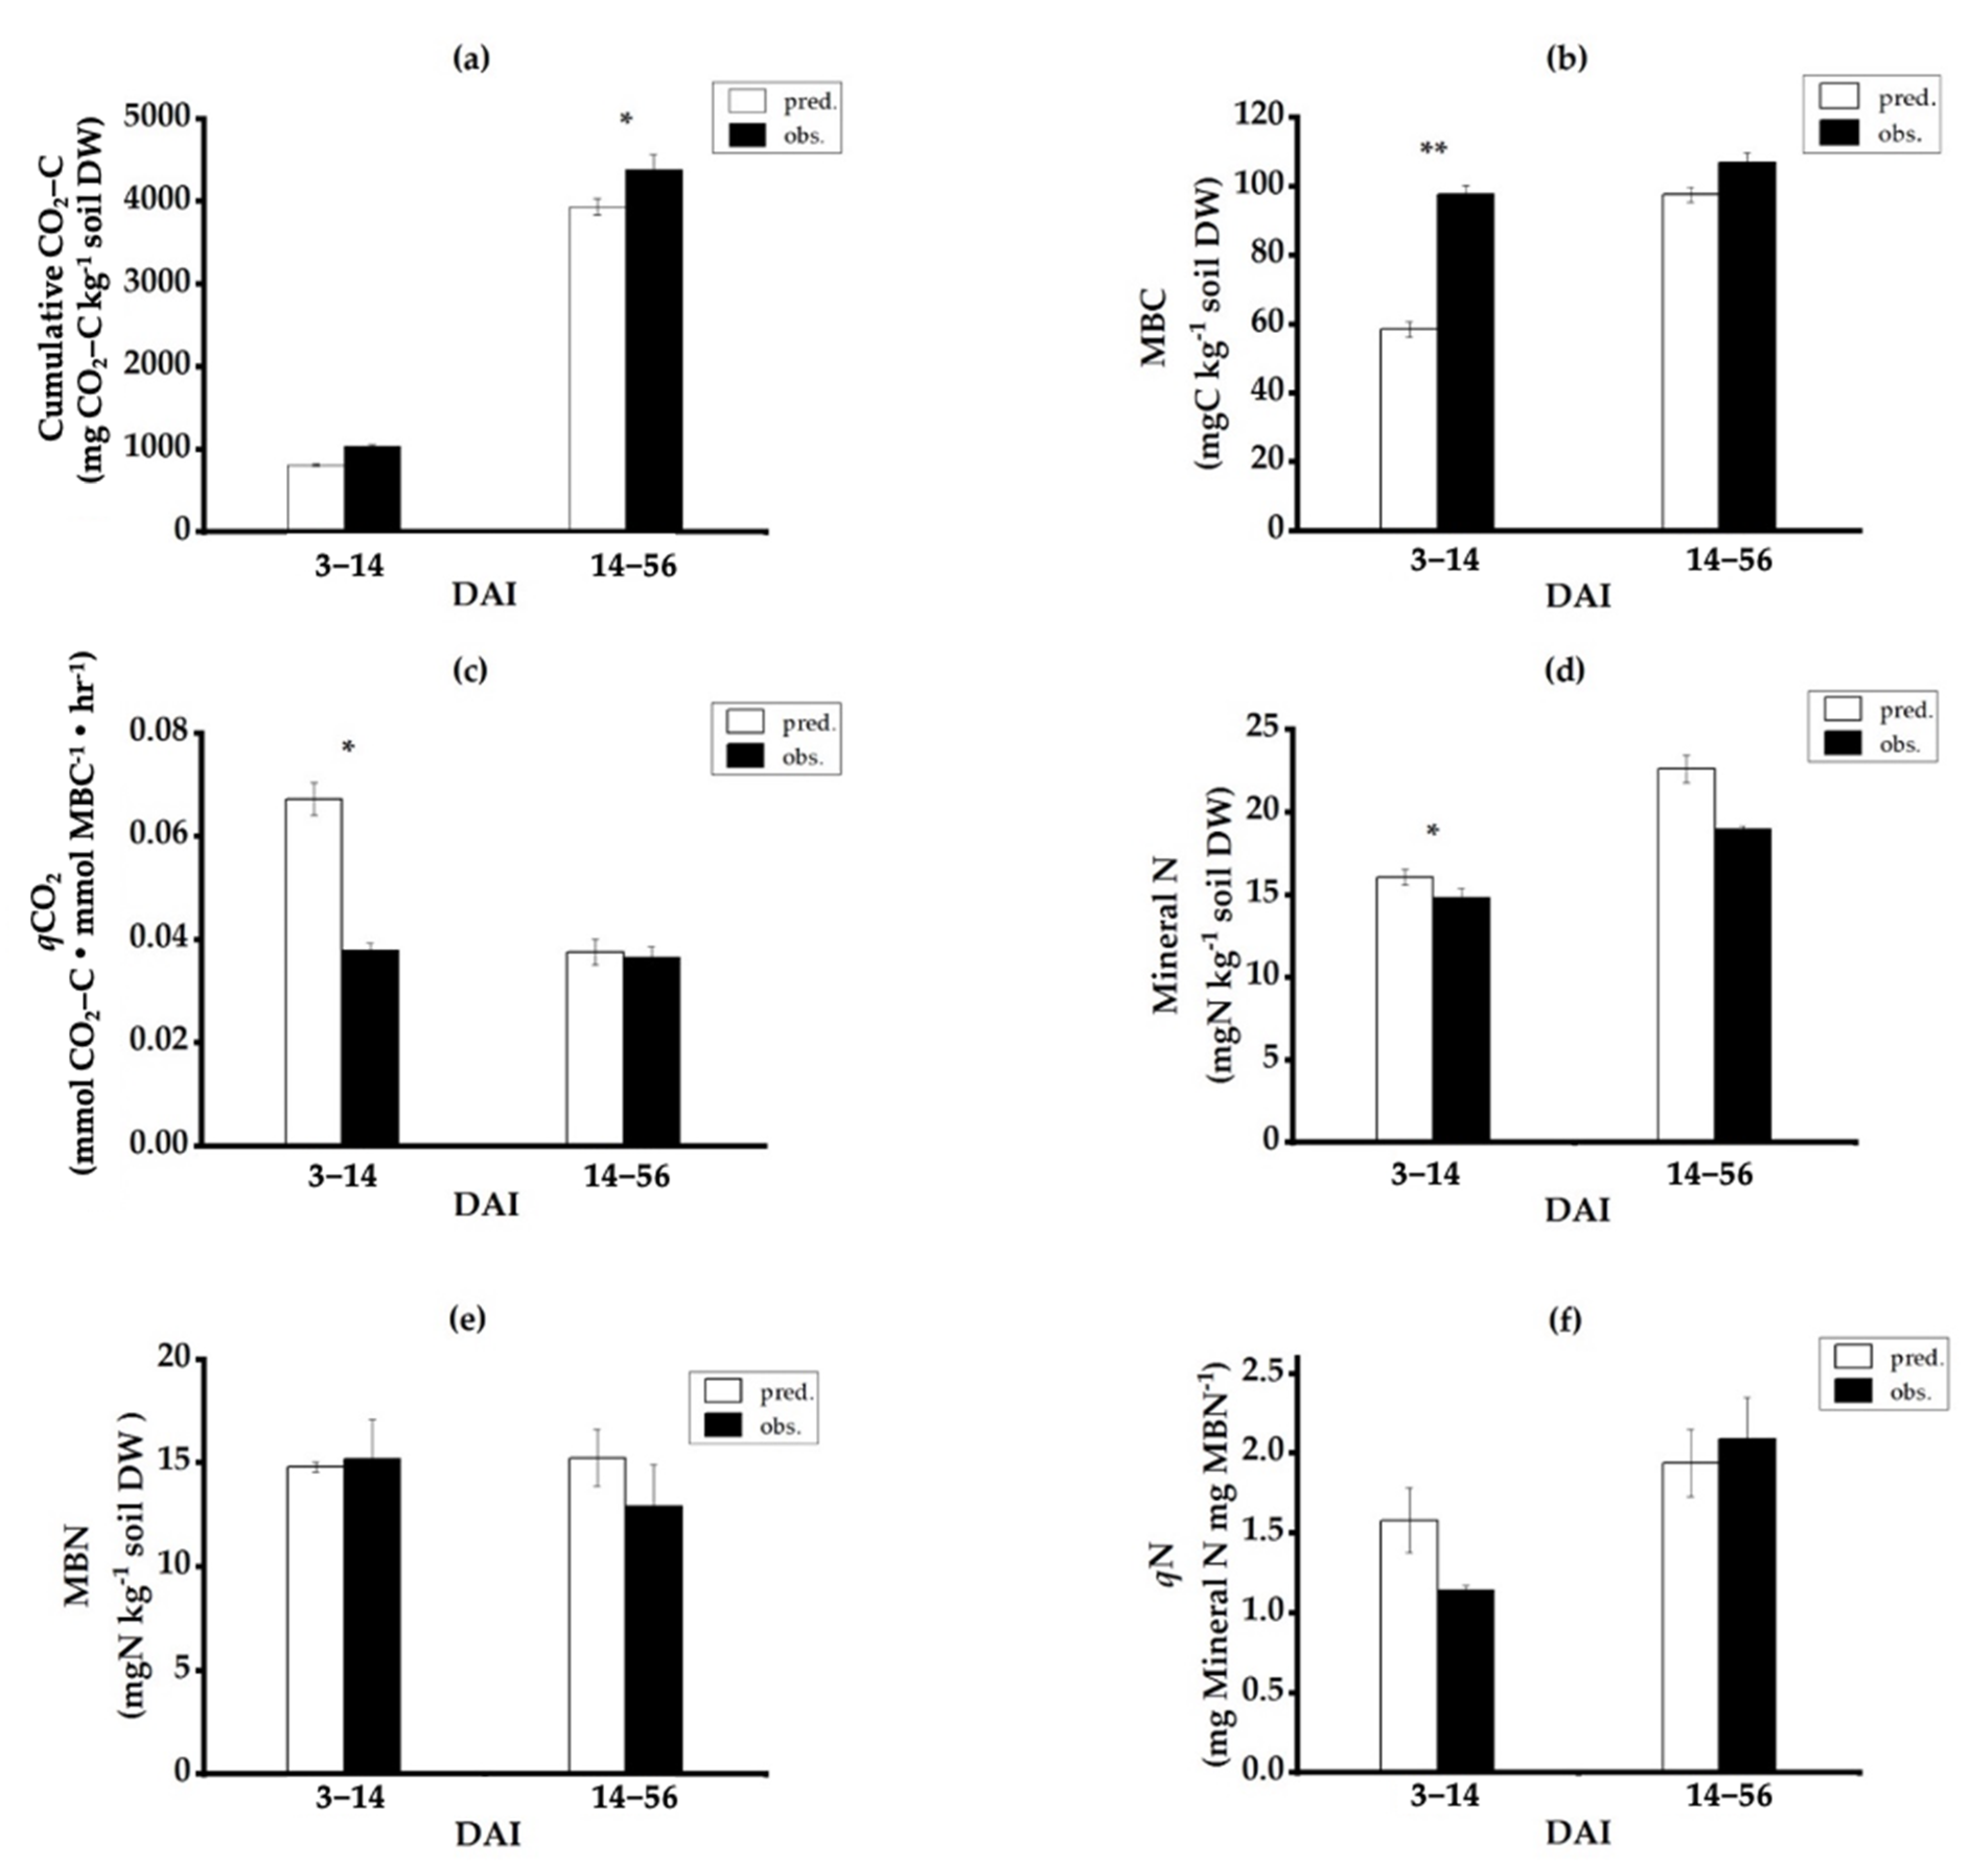
3.4. Nonadditive Effects of Mixed-Residue Decomposition Processes

The bivariate relationship between the predicted and observed values showed that nonadditive effects of mass loss were synergistic (Figure 4a), indicating that the mixed residues enhanced mass loss relative to the single residues. Similarly, the loss of residue chemical constituents showed the occurrence of nonadditive synergistic effects, which occurred more frequently than the additive or antagonistic nonadditive effects for C, N, ADF, L, and CL loss (Figure 4b–f).
The occurrence of the nonadditive effects of the soil microbiological parameters in the mixed (RS + GN) treatment is depicted in Figure 5. Differences between the observed and predicted values indicated the nonadditive effects in the mixed-residue treatment. The predicted values higher than observed values indicated antagonistic nonadditive effects, while the observed values higher than predicted values indicated synergistic nonadditive effects. Most soil microbiological parameters showed significant nonadditive effects during 3–14 DAI (Figure 5a–f), except for the cumulative CO2 evolution, which had a significant synergistic nonadditive effect in the decomposition period after 14 DAI (Figure 5a). Significant synergistic effects were found in MBC (Figure 5b), while antagonistic effects were found in mineral N (Figure 5d) and qCO2 (Figure 5c) during 3–14 DAI.

4. Discussion

4.1. Decomposition of the Mixed Residues Is Altered as Compared with Single Residues due to Enhanced Availability of C and N in the Mixed Residues

Residue decomposition can be divided into early (0–14 DAI) and late (14–56 DAI) stages based on temporal changes in residue decomposition parameters, including remaining mass, C, N, CL, and lignocellulose (ADF), as well as soil microbiological parameters, including mineral N and MBN. The residue parameters showed a general pattern of rapid decrease 0–14 DAI, followed by a stable or slower decrease during 14–56 DAI. The soil parameters showed increased content that reached a peak at 14 DAI, followed by a more stable content (mineral N) or a sharp decrease (MBN) from 14 DAI onwards.
Mixed residues of low-quality RS and high-quality GN in equal mass showed altered decomposition, which was mainly due to enhanced decomposition of the RS component (Figure 1a). This finding was shown by the synergistic nonadditive effect of remaining biomass (AFDW) (Figure 4a). This AFDW synergistic nonadditive effect was accompanied by those of C and N, indicating that mixed residues enhanced decomposition relative to single residues through enhanced C and N decomposition. The enhanced decomposition was more pronounced in the RS component than in its GN counterpart in the mixed-residue treatment (Figure 1a–c). In addition, synergistic nonadditive effects were observed in the CL and ADF (lignocellulose) constituents of the residues during early stages of decomposition. The greater losses of C, N, CL, and ADF (L + CL) components in the mixed residues resulted in a higher mass loss in the mixed residue relative to the low-quality single RS. The occurrence of nonadditive effects partly supported our first hypothesis that the decomposition process was altered in the mixed residues relative to the single residues. Moreover, our results showed that the loss of C and N from the mixed residues during the early stage was predominantly due to labile compounds such as CL- and N-bearing compounds, such as proteins, further shown by a positive correlation between the remaining mass of mixed residues and the relative CL (r = 0.980, p ≤ 0.001) and N (r = 0.976, p ≤ 0.001) content, respectively (data not shown).
A mechanism underlying the observed synergistic nonadditive effects was shown by Bonanomi et al. [32], who found significantly accelerated decay rates (i.e., synergistic interaction) for N-poor substrates (cellulose strips) when paired with N-rich leaf litter (Quercus ilex and Hedera helix). They reported significant N transfer from the N-rich leaf litter to an N-poor substrate through fungal mycelia, which explained the consequent increase in the mass loss rate of the N-poor material. Thus, increases in N content in the residue mixture enhanced its decomposition. Talbot and Treseder [46] found in the model plant system Arabidopsis thaliana that litter N had a positive effect on total mass loss because it increased the loss of lignin, N, and soluble C. Not only did N transfer take place in mixtures, but also C transfer occurred. Both C and N transfers were proposed to occur through amino acids via fungal mycelia in a mixture of maize and pine needles, in which N content was enhanced by the addition of N fertilizers [47]. Our results are confirmed by other published results that indicate that C and N transfers affect mixed-residue decomposition, which also support our second hypothesis that N and C transfers are mechanisms that occur when CL-rich but N-poor RS is mixed with N-rich GN, which alters the decomposition of the mixture when compared with the decomposition of each of these residues alone.
During the early stage of decomposition, the loss of labile compounds was more rapid in the mixed-residue treatment than in the single-residue treatments, causing an increase in recalcitrant L content at an earlier time in the mixed-residue (7 DAI) treatment than in the single-residue (14 DAI) treatments. This is evidence of the altered or enhanced decomposition of labile constituents in the mixed residues relative to the single residues. The rapid and early decrease in relative L content also indicated faster L degradation in soils treated with mixed residues than the single-residue treatments. In the late stage, recalcitrant compound (L) continued to be lost and was more pronounced with the mixed residues than the single residues. The enhanced loss of L in the mixed residues in both the early and later stages of decomposition was due to the higher supply of labile C and N compounds that were used more by microbes in the mixed residues than in the single residues. Both labile CL and N were found to have positive effects on L loss in the Arabidopsis thaliana study [46]. Another study by De Marco et al. [48] also reported increased L decomposition of a mixture of N-rich litter (Q. ilex) with CL-rich but N-poor Phillyrea angustifolia litter relative to that of the single residues. The increased L decomposition included the contribution of readily decomposable C compounds from the C-rich litter, which increased the availability of energetic substrates for ligninolytic fungi.

4.2. Use of qCO2 and qN as Indicators of Microbial SUE, Which Is the Main Process That Alters Decomposition of Mixed Residues as Compared with Single Residues

Our results showed that mixed-residue soil amendment resulted in lower qCO2, or in other words, higher CUE, than the single residues (Figure 3a), and led to significant antagonistic nonadditive effects of qCO2 throughout the early stage of decomposition (Figure 5c). The higher CUE in the mixed residues was due to higher C conservation in microbial biomass (MBC) (Figure 2b) and lower C loss as CO2 (Figure 2a) than in the single GN, which further affected the antagonistic nonadditive effects of qCO2. Mixing GN with RS significantly reduced the release of CO2-C relative to GN alone during the first 7 d of decomposition (Figure 2a). This corresponded to the higher MBC in the mixed residues than in the single-GN-residue treatment (Figure 2b). Carbon in the mixed residues was conserved in the microbial biomass, leading to dramatically increased CUE relative to the single GN (Figure 3a). The conservation of C in the microbial biomass in the mixed treatment manifested in the synergistic nonadditive effects of MBC during the early stage of decomposition (Figure 5b). However, the loss of C in the form of CO2 was not significantly altered, as shown by the absence of nonadditive effects of CO2-C evolution (Figure 5a). The increase in C conservation in the microbial biomass or the increase in MBC that resulted in high CUE in the mixed-residue treatment was likely due to the transfer of C in microbially transformed compounds, notably amino acids and amino sugars [47,49]. The significantly higher microbial CUE in the mixed residues during the early stage of decomposition was only significant when compared with GN, but not RS. These results suggest that the chemical composition of litter changes when residues are mixed, compared with their singular composition. Relative to GN, the mixed residues had lower L (76.7 g kg−1 in the mixed residues vs. 108.7 g kg−1 in GN) but higher CL (427 g kg−1 in the mixed residues vs. 408 g kg−1 in GN). These differences in L and CL contents between the mixed and single-GN residues led to a lower ratio of L/CL in the mixed treatment (0.18) than in the GN (0.27) treatment. Indeed, the mixed residues had higher available C substrates in the form of a labile compound (CL) but lower recalcitrant L than GN. Conversely, the mixed and GN residues had higher L but lower CL than RS when compared with that between the mixed and RS residues alone. The mixed residues had a chemical composition with less available labile C but higher recalcitrant C than single RS, which did not bring about significant enhancement of CUE in the mixed-residue treatment relative to the single-RS-residue treatment.
Labile C constituents of residues enhanced decomposition, while recalcitrant C inhibited decomposition [50]. Our results support this previous finding, as we also found a positive correlation between CL and the remaining ash-free dry weight of residues (r = 0.980, p ≤ 0.001) (data not shown). In addition, a lower ratio of L/CL in the mixed residues relative to GN alone indicated that CL allowed for effective microbial use of L in the mixed residues than the single GN [46]. The nitrogen constituent of these residues has been shown to play an important role in increasing CUE [51]. By mixing N-rich GN with N-poor RS, the mixed residues reduced N limitation relative to the single RS, leading to the stimulation of microbial use of available C, as shown by the increased MBC and CO2-C evolution, resulting in higher CUE in the mixed treatment relative to single-RS treatment. A recent study comparing the decomposition of legume aboveground residues of Calliandra calothyrsus of medium and high quality based on N contents of 19.9 and 22.5 g kg−1, respectively, showed that the high-quality residue with lower qCO2 indicated higher CUE than its medium-quality counterpart [52]. Alleviation of the N limitation by using N-poor residues and mixing them with an N-rich residue can be described by the ecological stoichiometry theory [19] as creating a stoichiometric imbalance between residues and decomposer microorganisms [53,54]. In this case, the imbalance in the C and N nutrients is indicated by the C/N ratio. Under the restored N-sufficient conditions through the mixing of N-rich GN with N-poor RS, the microbial growth was stimulated relative to the N-deficient conditions of the single-RS treatment, leading to a decreased C/N ratio of the mixed residues. It is established knowledge that C is lost at a faster rate than N, and N is conserved in the microbial biomass [55]. Further, the effects of higher CUE in the mixed treatment than in the single-residue treatments on the soil matrix indicated higher production of microbial products leading to higher SOM stabilization in the soil matrix [6]. Our results also indicate that more SOM accumulation could result from the application of mixed (RS + GN) residues than that of any one of these residues applied singly to soils.
Similar to qCO2, the mixed residues resulted in lower qN (i.e., a higher microbial NUE (the inverse of qN)) than the single residues in the early stage of decomposition. However, a significant difference was only observed between the mixed residues and RS in the initial stage (0–3 DAI) (Figure 3b). The higher NUE in the mixed treatment was due to decreased mineral N release relative to the single GN (Figure 2c), which was manifested in the significant antagonistic nonadditive effects of mineral N (Figure 5d). These results are consistent with those of Redin et al. [16], who showed that increased N availability from mixing low-N with high-N organic materials led to decreased soil N mineralization. The microbial NUE in the mixed treatment was only significantly higher than that in RS in the initial stage of decomposition (0–3 DAI). The change in C and N stoichiometry in the mixed treatment relative to the single-RS treatment was likely the controlling factor for the microbial NUE of residues [28,29,30]. Under RS alone, there was limited N availability, which was not conducive to microbial N metabolism, as indicated by the low MBN (Figure 2d) and mineral N in the RS treatment (Figure 2c). The increase in N availability in the mixed-residue treatment increased N metabolism, as shown by the increased MBN and significantly increased mineral N relative to the single RS. Thus, there was an N transfer from the N-rich GN to the N-poor RS when they were in a mixture. N transfer is found in microbially transformed compounds, for example, amino acids and amino sugars [47,49]. In addition, stoichiometric imbalance was created by mixing residues, as shown by the C/N ratio, and resulted in a decreased C/N ratio in the mixed residue relative to the single-RS residue. Our results show that NUE with RS treatment was lower than that in the mixed residues. These results corroborate those of Mooshammer et al. [19], who showed that at a low organic resource C/N ratio, microbial NUE rapidly increased, whereas at high resource C/N ratios, the increase in microbial NUE was less pronounced. In addition, a recent global meta-analysis of published data from various terrestrial ecosystems, including grasslands, forests, croplands, and wetlands in temperate and tropical zones with different soils [28], has shown N limitation, which restricts microbial biomass on a global scale. Thus, N limitation induces microbes to increase their metabolism to gain N.

5. Conclusions

Our results support the hypothesis that mixing N-poor but CL-rich RS with N-rich GN altered decomposition compared with the decomposition of the two residues alone, as shown by the nonadditive effects of residue mass loss concomitant with that of chemical constituents including C (cellulose, lignin) and N. The altered decomposition processes were more pronounced during the early stages of decomposition. The mechanisms underlying the altered decomposition include increased microbial SUE (or decreased qCO2 and qN) and increased CUE and NUE under the mixed residues relative to the single residues. The increased CUE was a result of the increased MBC of the mixed residues relative to both single residues. The increased NUE of the mixed residue was due to the increased MBN of the mixed residue relative to the single RS residue and decreased N loss due to N mineralization relative to the single GN. Mixing GN with RS alleviated soil N limitations under a single RS and concurrently increased labile C (cellulose) availability relative to the single GN. These factors enhanced the microbial substrate use efficiency (SUE) for both C and N nutrients in the mixed residue. The increase in SUE provides a basis for the synthesis of microbial products that contribute to the formation of the stable SOM pool. The SOM stabilization could bring about the much-needed SOM accumulation that is lacking under the single-RS application. Our findings have implications for the balanced use of organic amendments that contain both C and N to restore SOM, especially in degraded sandy soils.

Author Contributions

Conceptualization, P.V.; methodology, P.V. and W.P.; software, W.P.; validation, P.V. and W.P.; formal analysis, W.P.; investigation, P.V. and W.P.; resources, P.V.; data curation, W.P. and P.V.; writing—original draft preparation, W.P. and P.V.; writing—review and editing, P.V.; visualization, W.P.; supervision, P.V.; project administration, P.V.; funding acquisition, P.V. All authors have read and agreed to the published version of the manuscript.

Funding

This research was funded by the Royal Golden Jubilee PhD Program under the Thailand Research Fund (TRF) (grant number PHD/0157/2556), the Thailand Research Fund (TRF) Basic Research Programs—project code BRG5880018), and the Government of Thailand’s grants to Khon Kaen University (KKU) (FY 2015, 2016, 2017).

Institutional Review Board Statement

Not applicable.

Informed Consent Statement

Not applicable.

Data Availability Statement

The data presented in this study are available on request from the corresponding author.

Acknowledgments

We thank Banyong Toomsan from the Department of Agronomy, Khon Kaen University, for his editorial assistance and constructive comments.

Conflicts of Interest

The authors declare no conflict of interest.

References

  1. Kunlanit, B.; Butnan, S.; Vityakon, P. Land-use changes influencing C sequestration and quality in topsoil and subsoil. Agronomy 2019, 9, 520. [Google Scholar] [CrossRef] [Green Version]
  2. Kumar, K.; Goh, K.M. Crop residues and management practices: Effects on soil quality, soil nitrogen dynamics and nitrogen recovery. Adv. Agron. 2000, 68, 197–319. [Google Scholar] [CrossRef]
  3. Puttaso, A.; Vityakon, P.; Seanjan, P.; Trelo-Ges, V.; Cadisch, G. Relationship between residue quality, decomposition patterns, and soil organic matter accumulation in a tropical sandy soil after 13 years. Nutr. Cycl. Agroecosyst. 2011, 89, 159–174. [Google Scholar] [CrossRef]
  4. Palm, C.A.; Gachengo, C.N.; Delve, R.J.; Cadisch, G.; Giller, K.E. Organic inputs for soil fertility management in tropical agroecosystems: Application of an organic resource database. Agric. Ecosyst. Environ. 2001, 83, 27–42. [Google Scholar] [CrossRef]
  5. Kunlanit, B.; Vityakon, P.; Puttaso, A.; Cadisch, G.; Rasche, F. Mechanisms controlling soil organic carbon composition pertaining to microbial decomposition of biochemically contrasting organic residues: Evidence from midDRIFTS peak area analysis. Soil Biol. Biochem. 2014, 76, 100–108. [Google Scholar] [CrossRef]
  6. Cotrufo, M.F.; Wallenstein, M.D.; Boot, C.M.; Denef, K.; Paul, E. The Microbial Efficiency-Matrix Stabilization (MEMS) framework integrates plant litter decomposition with soil organic matter stabilization: Do labile plant inputs form stable soil organic matter? Glob. Chang. Biol. 2013, 19, 988–995. [Google Scholar] [CrossRef] [Green Version]
  7. Cotrufo, M.F.; Soong, J.L.; Horton, A.J.; Campbell, E.E.; Haddix, M.L.; Wall, D.H.; Parton, W.J. Formation of soil organic matter via biochemical and physical pathways of litter mass loss. Nat. Geosci. 2015, 8, 776–779. [Google Scholar] [CrossRef]
  8. Office of Agricultural Economics, Ministry of Agriculture and Cooperatives. Available online: www.oae.go.th/download/journal/agri_eco56/agu-JAN56.pdf (accessed on 7 April 2020).
  9. Puttaso, A.; Vityakon, P.; Rasche, F.; Seanjan, P.; Trelo-Ges, V.; Cadisch, G. Does organic residue quality influence carbon retention in a tropical sandy soil. Soil Sci. Soc. Am. J. 2013, 77, 1001–1011. [Google Scholar] [CrossRef]
  10. Kunlanit, B.; Rasche, F.; Puttaso, A.; Cadisch, G.; Vityakon, P. Vertical dynamics of dissolved organic carbon in relation to organic input quality and microaggregate formation in a coarse-textured Ultisol. Eur. J. Soil Sci. 2020, 71, 459–471. [Google Scholar] [CrossRef]
  11. Keawpradit, W.; Toomsan, B.; Vityakon, P.; Limpinuntana, V.; Saenjan, P.; Jogloy, S.; Patanothai, A.; Cadisch, G. Regulating mineral N release and greenhouse gas emissions by mixing groundnut residues and rice straw under field conditions. Eur. J. Soil Sci. 2008, 59, 640–652. [Google Scholar] [CrossRef]
  12. Vityakon, P.; Meepech, S.; Cadisch, G.; Toomsan, B. Soil organic matter and nitrogen transformation mediated by plant residues of different qualities in sandy acid upland and paddy soils. Neth. J. Agric. Sci. 2000, 48, 75–90. [Google Scholar] [CrossRef] [Green Version]
  13. Jaman, M.S.; Muraina, T.O.; Dam, Q.; Zhang, X.; Jamil, M.; Bhattarai, S.; Islam, F. Effects of single and mixed plant types on soil carbon and nitrogen dynamics in homestead agroforestry systems in Northern Bangladesh. Agric. Ecosyst. Environ. 2021, 315, 107434. [Google Scholar] [CrossRef]
  14. Chen, X.; Chen, H.Y.H.; Chen, C.; Ma, Z.; Searle, E.B.; Yu, Z.; Huang, Z. Effects on plant diversity on soil carbon in diverse ecosystems: A global meta-analysis. Biol. Rev. 2020, 95, 167–183. [Google Scholar] [CrossRef] [PubMed]
  15. Zhang, C.; Li, S.; Zhang, L.; Xin, X.; Liu, X. Litter mixing significantly affects decomposition in the Hulun Buir meadow steppe of Inner Mongolia. J. Plant Ecol. 2014, 7, 56–67. [Google Scholar] [CrossRef] [Green Version]
  16. Redin, M.; Recous, S.; Aita, C.; Dietrich, G.; Skolaude, A.C.; Ludke, W.H.; Schmatz, R.; Giacomini, S.J. How the chemical composition and heterogeneity of crop residue mixtures decomposing at the soil surface affects C and N mineralization. Soil Biol. Biochem. 2014, 78, 65–75. [Google Scholar] [CrossRef]
  17. Almagro, M.; Ruiz-Navarro, A.; Díaz-Pereira, E.; Albaladejo, J.; Martínez-Mena, M. Plant residue chemical quality modulates the soil microbial response related to decomposition and soil organic carbon and nitrogen stabilization in a rainfed Mediterranean agroecosystem. Soil Biol. Biochem. 2021, 156, 108198. [Google Scholar] [CrossRef]
  18. Manzoni, S.; Capek, P.; Porada, P.; Thurner, M.; Winterdahl, M.; Beer, C.; Brüchert, V.; Frouz, J.; Herrmann, A.M.; Lindahl, B.D.; et al. Reviews and syntheses: Carbon use efficiency from organisms to ecosystems—Definitions, theories, and empirical evidence. Biogeosciences 2018, 15, 5929–5949. [Google Scholar] [CrossRef] [Green Version]
  19. Mooshammer, M.; Wanek, W.; Hämmerle, I.; Fuchslueger, L.; Hofhansl, F.; Knoltsch, A.; Schnecker, J.; Takriti, M.; Watzka, M.; Wild, B.; et al. Adjustment of microbial nitrogen use efficiency to carbon: Nitrogen imbalances regulates soil nitrogen cycling. Nat. Commun. 2014, 5, 3694. [Google Scholar] [CrossRef]
  20. Xu, X.; Schimel, J.P.; Janssens, I.A.; Song, X.; Song, C.; Yu, G.; Sinsabaugh, R.L.; Tang, D.; Zhang, X.; Thornton, P.E. Global pattern and controls of soil microbial metabolic quotient. Ecol. Monogr. 2017, 87, 429–441. [Google Scholar] [CrossRef] [Green Version]
  21. Anderson, T.-H.; Domsch, K.H. Maintenance carbon requirements of actively—Metabolizing microbial populations under in situ conditions. Soil Biol. Biochem. 1985, 17, 197–203. [Google Scholar] [CrossRef]
  22. Anderson, T.-H.; Domsch, K.H. Determination of ecophysiological maintenance carbon requirements of soil microorganisms in a dormant state. Biol. Fertil. Soils. 1985, 1, 81–89. [Google Scholar] [CrossRef]
  23. Anderson, T.-H.; Domsch, K.H. The metabolic quotient for CO2 (qCO2) as a specific activity parameter to assess the effects of environmental conditions, such as pH, on the microbial biomass of forest soils. Soil Biol. Biochem. 1993, 25, 393–395. [Google Scholar] [CrossRef]
  24. Wardle, D.A.; Ghani, A. A tale of two theories, a chronosequence and a bioindicator of soil quality. Soil Biol. Biochem. 2018, 121, A3–A7. [Google Scholar] [CrossRef]
  25. Zheng, Q.; Hu, Y.; Zhang, S.; Noll, L.; Böckle, T.; Richter, A.; Wanek, W. Growth explains microbial carbon use efficiency across soils differing in land use and geology. Soil Biol. Biochem. 2019, 128, 45–55. [Google Scholar] [CrossRef]
  26. Shimizu, K. Metabolic regulation of a bacterial cell system with emphasis on Escherichia coli metabolism. ISRN Biochem. 2013, 2013, 645983. [Google Scholar] [CrossRef] [PubMed] [Green Version]
  27. Shi, W.; Yao, H.; Bowman, D. Soil microbial biomass, activity and nitrogen transformations in a turfgrass chronosequence. Soil Biol. Biochem. 2006, 38, 311–319. [Google Scholar] [CrossRef]
  28. Li, Z.; Zeng, Z.; Tian, D.; Wang, J.; Fu, Z.; Wang, B.; Tang, Z.; Chen, W.; Chen, H.Y.H.; Wang, C.; et al. The stoichiometry of soil microbial biomass determines metabolic quotient of nitrogen mineralization. Environ. Res. Lett. 2020, 15, 034005. [Google Scholar] [CrossRef]
  29. Sinsabaugh, R.L.; Hill, B.H.; Shah, J.J.F. Ecoenzymatic stoichiometry of microbial organic nutrient acquisition in soil and sediment. Nature 2009, 462, 795–798. [Google Scholar] [CrossRef]
  30. Sistla, S.A.; Schimel, J.P. Stoichiometric flexibility as a regulator of carbon and nutrient cycling in terrestrial ecosystems under change. New Phytol. 2012, 196, 68–78. [Google Scholar] [CrossRef]
  31. Gartner, T.B.; Cardon, Z.G. Decomposition dynamics in mixed-species leaf litter. Oikos 2004, 104, 230–246. [Google Scholar] [CrossRef]
  32. Bonanomi, G.; Capodilupo, M.; Incerti, G.; Mazzoleni, S. Nitrogen transfer in litter mixture enhances decomposition rate, temperature sensitivity, and C quality changes. Plant Soil 2014, 381, 307–321. [Google Scholar] [CrossRef]
  33. Mao, R.; Zeng, D.-H. Non-additive effects vary with the number of component residues and their mixing proportions during residue mixture decomposition: A microcosm study. Geoderma 2012, 170, 112–117. [Google Scholar] [CrossRef]
  34. Schimel, J.P.; Cates, R.G.; Ruess, R. The role of Balsam poplar secondary chemicals in controlling soil nutrient dynamics through succession in the Alaskan Taiga. Biogeochemistry 1998, 42, 221–234. [Google Scholar] [CrossRef]
  35. Hättenschwiler, S.; Vitousek, P.M. The role of polyphenols in terrestrial ecosystem nutrient cycling. Trends Ecol. Evol. 2000, 15, 238–243. [Google Scholar] [CrossRef]
  36. Soil Survey Staff. Keys to Soil Taxonomy; Natural Resources Conservation Service, United States Department of Agriculture: Washington, DC, USA, 2006.
  37. Butnan, S.; Deenik, J.L.; Toomsan, B.; Antal, M.J.; Vityakon, P. Biochar characteristics and application rates affecting corn growth and properties of soils contrasting in texture and mineralogy. Geoderma 2015, 237–238, 105–116. [Google Scholar] [CrossRef]
  38. Dewis, J.; Fretias, F. Physical and Chemical Methods of Soil and Water Analysis; FAO: Rome, Italy, 1970; p. 275. [Google Scholar]
  39. Pansu, M.; Gautheyrou, J. Handbook of Soil Analysis: Mineralogical, Organic and Inorganic Methods; Springer: Berlin/Heidelberg, Germany, 2006; p. 993. [Google Scholar]
  40. Anderson, J.P.E. Soil respiration. In Methods of Soil Analysis, 2nd ed.; Miller, R.H., Keeny, D.R., Eds.; American Society of Agronomy and Soil Science Society of America: Madison, WI, USA, 1982; pp. 831–871. [Google Scholar]
  41. Amato, M.; Ladd, J.N. Assay for microbial biomass based on ninhydrin-reactive nitrogen in extracts of fumigated soils. Soil Biol. Biochem. 1988, 20, 107–114. [Google Scholar] [CrossRef]
  42. Sparling, G.P.; West, A.W. A direct extraction method to estimate soil microbial C: Calibration in situ using microbial respiration and 14C labeled cells. Soil Biol. Biochem. 1988, 20, 337–343. [Google Scholar] [CrossRef]
  43. Wood, E.D.; Armstrong, F.A.J.; Richards, F.A. Determination of nitrate in sea water by cadmium-copper reduction to nitrite. J. Mar. Biol. Assoc. UK 1967, 47, 23–31. [Google Scholar] [CrossRef] [Green Version]
  44. Sluiter, A.; Hames, B.; Ruiz, R.; Scarlata, C.; Sluiter, J.; Templeton, D. Determination of Ash in Biomass: Laboratory Analytical Prodedure (LAP); A National Laboratory of the U.S. Department of Energy Efficiency and Renewable Energy: Golden, CO, USA, 2008.
  45. Van Soest, P.J. Use of detergents in the analysis of fibrous feeds. II. A rapid method for the determination of fiber and lignin. J. Assoc. Off. Anal. Chem. 1963, 46, 829–835. [Google Scholar] [CrossRef]
  46. Talbot, J.M.; Treseder, K.K. Interactions among lignin, cellulose, and nitrogen drive litter chemistry-decay relationships. Ecology 2012, 93, 345–354. [Google Scholar] [CrossRef] [Green Version]
  47. Berglund, S.L.; Ågren, G.I.; Ekblad, A. Carbon and nitrogen transfer in leaf litter mixtures. Soil Biol. Biochem. 2013, 57, 341–348. [Google Scholar] [CrossRef]
  48. De Marco, A.; Meola, A.; Maisto, G.; Giordano, M.; Virzo De Santo, A. Non-additive effects of litter mixtures on decomposition of leaf litters in a Mediterranean maquis. Plant Soil 2011, 344, 305–317. [Google Scholar] [CrossRef] [Green Version]
  49. Hobara, S.; Osono, T.; Hirose, D.; Noro, K.; Hirota, M.; Benner, R. The roles of microorganisms in litter decomposition and soil formation. Biogeochemistry 2014, 118, 417–486. [Google Scholar] [CrossRef]
  50. Berg, B.; McClaugherty, C. Influences of chemical variation in the litter on decomposition. In Plant Litter: Decomposition, Humus Formation, Carbon Sequestration, 3rd ed.; Springer: Berlin/Heidelberg, Germany, 2014; pp. 107–135. [Google Scholar]
  51. Manzoni, S.; Taylor, P.; Richter, A.; Porporato, A.; Ågren, G.I. Environmental and stoichiometric controls on microbial carbon-use efficiency in soils. New Phytol. 2012, 196, 79–91. [Google Scholar] [CrossRef] [PubMed]
  52. Agumas, B.; Blagodatsky, S.; Balume, I.; Musyoki, M.K.; Marhan, S.; Rasche, F. Microbial carbon use efficiency during plant residue decomposition: Integrating multi-enzyme stoichiometry and C balance approach. Appl. Soil Ecol. 2021, 159, 103820. [Google Scholar] [CrossRef]
  53. Sterner, R.W.; Elser, J.J. Ecological Stoichiometry: The Biology of Elements from Molecules to the Biosphere; Princeton University Press: Princeton, NJ, USA, 2002. [Google Scholar]
  54. Manzoni, S.; Trofymow, J.A.; Jackson, R.B.; Porporato, A. Stoichiometric controls on carbon, nitrogen, and phosphorus dynamics in decomposing litter. Ecol. Monogr. 2010, 80, 89–106. [Google Scholar] [CrossRef]
  55. Haynes, R.J. The decomposition process: Mineralization, immobilization, humus formation and degradation. In Mineral Nitrogen in the Plant-Soil System, 1st ed.; Cameron, K.C., Goh, K.M., Sherlock, R.R., Eds.; Academic Press: Orlando, FL, USA, 1986; pp. 52–126. [Google Scholar]
Figure 1. Dynamics of plant residue decomposition in litter bags at different days after residue incorporation (DAI): (a) remaining ash-free dry weight (% initial), (b) remaining carbon, (c) remaining nitrogen, (d) remaining acid detergent fiber, (e) remaining lignin, and (f) remaining cellulose. The inset table accompanying each figure shows comparisons of the plant residue treatments and each time interval, where lowercase letters indicate comparisons among treatments and uppercase letters denote comparisons among sampling dates. Different letters are significantly different (p ≤ 0.05) as determined by the least significant difference test (LSD). Vertical bars represent standard error of the means (n = 3). Asterisks represent significant difference among treatments (* significant at p ≤ 0.05).
Agronomy 11 01030 g001
Figure 2. Dynamics of soil microbiological parameters at various days after residue incorporation (DAI) that were affected by different plant residue treatments: (a) cumulative carbon dioxide-C evolution, (b) microbial biomass C, (c) mineral N, and (d) microbial biomass N. The inset table accompanying each panel shows the comparisons of the plant residue treatments and each time interval, where lowercase letters denote comparisons among treatments and uppercase letters denote comparisons among the sampling DAI. Different letters are significantly different (p ≤ 0.05), as determined by the least significant difference test (LSD). Vertical bars represent standard errors of the means (n = 3). Asterisks represent significant difference among treatments (* significant at p ≤ 0.05; ** significant at p ≤ 0.01; *** p ≤ 0.001).
Agronomy 11 01030 g002
Figure 3. Dynamics of microbial C and N use efficiencies days after residue incorporation (DAI) in soil amended with different plant residue treatments: (a) microbial metabolic quotient (qCO2) and (b) microbial N quotient (qN). The different letters indicate within a DAI period significant difference (p ≤ 0.05) using the least significant difference test (LSD). Vertical bars represent standard error of the means (n = 3).
Agronomy 11 01030 g003
Figure 4. Relationship between predicted and observed values of mixtures of (in % initial): (a) remaining ash-free dry weight (AFDW), (b) remaining carbon (C), (c) remaining nitrogen (N), (d) remaining acid detergent fiber (ADF), (e) remaining lignin (L), (f) remaining cellulose (CL); (g) dashed line indicates a 1:1 line along which predicted and observed values are equal (additive effect), and the arrows indicate the direction of deviations of solid lines from the dashed line, which indicate the nonadditive effects that are either synergistic (below the dashed line) or antagonistic (above the dashed line).
Agronomy 11 01030 g004
Figure 5. Comparison of observed values (filled bars) of the soil microbiological properties of the mixed treatments with predicted values (open bars) days after residue incorporation (DAI): (a) cumulative carbon dioxide-C evolution, (b) microbial biomass C, (c) microbial metabolic quotient (qCO2), (d) mineral N, (e) microbial biomass N, and (f) microbial N quotient (qN). Observed and predicted values differ significantly at p ≤ 0.05 (*) and p ≤ 0.01 (**) using the paired t-test.
Agronomy 11 01030 g005
Table 1. Initial chemical characteristics of plant residues.
Residues 1Chemical Composition of Plant Residues 2
CNADF
g kg−1
LCLC/NL/NCL/NL/CL
RS323.44.0514.736.7449.781.89.2113.80.1
GN347.517.5546.7108.7408.019.96.223.30.3
RS + GN341.614.3532.376.7427.024.05.429.90.2
1 RS = rice straw; GN = groundnut stover. 2 C, carbon; N, nitrogen; ADF, acid detergent fiber; L, lignin; CL, cellulose.
Publisher’s Note: MDPI stays neutral with regard to jurisdictional claims in published maps and institutional affiliations.

