Article

Diverse Physiological and Physical Responses among Wild, Landrace and Elite Barley Varieties Point to Novel Breeding Opportunities

1
School of Life Sciences, University of Essex, Colchester CO4 3SQ, UK
2
Institute of Molecular Cell & Systems Biology, University of Glasgow, Glasgow G12 8QQ, UK
*
Author to whom correspondence should be addressed.
Agronomy 2021, 11(5), 921; https://doi.org/10.3390/agronomy11050921
Submission received: 31 March 2021 / Revised: 4 May 2021 / Accepted: 4 May 2021 / Published: 7 May 2021
(This article belongs to the Special Issue Stomata, Photosynthesis and Plant Water Use Efficiency)

Abstract

:
Climate change from elevated [CO2] may reduce water availability to crops through changes in precipitation and higher temperatures. However, agriculture already accounts for 70% of human consumption of water. Stomata, pores in the leaf surface, mediate exchange of water and CO2 for the plant. In crops including barley, the speed of stomatal response to changing environmental conditions is as important as maximal responses and can thus affect water use efficiency. Wild barleys and landraces which predate modern elite lines offer the breeder the potential to find unexploited genetic diversity. This study aimed to characterize natural variation in stomatal anatomy and leaf physiology and to link these variations to yield. Wild, landrace and elite barleys were grown in a polytunnel and a controlled environment chamber. Physiological responses to changing environments were measured, along with stomatal anatomy and yield. The elite barley lines did not have the fastest or largest physiological responses to light nor always the highest yields. There was variation in stomatal anatomy, but no link between stomatal size and density. The evidence suggests that high photosynthetic capacity does not translate into yield, and that landraces and wild barleys have unexploited physiological responses that should interest breeders.

1. Introduction

Rising concentrations of greenhouse gases including CO2 ([CO2]) are expected to raise global mean surface temperatures by 3 °C above the baseline by the end of this century [1,2]. Extreme weather is also becoming more common, with heat waves, droughts and precipitation events expected more often, that are more severe and for longer periods than in the past [1]. Meanwhile, the global population is expected to rise from 7.2 to 9.6 billion by 2050 [3] putting increasing pressure on food production. It has been predicted that crop yields have to double by 2050 as a result [4]. Widespread use of biofuels and changing dietary preferences along with rising urbanisation [5,6] are also adding pressure to raise yields in the key crops including rice, wheat and maize that are responsible for the vast majority of all calories consumed globally [7].
As a result of climate-induced surface temperature increases, photosynthesis could be reduced in some temperature-sensitive plants (dependent on species and variety), decreasing productivity [8]. Direct thermal damage to plants will rise, while soil water availability will fall [8]. Greater evapotranspiration (the process by which liquid water enters the gas phase either from the soil (evaporation) or plants (transpiration)) may further reduce soil moisture content via higher stomatal conductance (gs) (and thus transpiration rates) in some C3 plants which demand greater evaporative cooling, although elevated [CO2] tends to reduce stomatal aperture [9,10,11]. High vapour pressure deficit (VPD) acts in addition to direct temperature effects on evapotranspiration by reducing gs [10,12]. Meanwhile changed patterns of precipitation will additionally reduce replenishment rates of water stores [1,3,13,14]. As agriculture already accounts for up to 70% of freshwater withdrawals worldwide, the combined threat of climate change and yield pressure on water resources is clear, with inevitable consequences expected on crop yields [1,3,13,15,16].
One of the key determinants of the rate of gs and transpiration is the number, size and position of stomatal pores on the leaf external surfaces [17]. Stomata must simultaneously manage mesophyll demands for CO2 diffusion into the leaf for assimilation (A), while minimizing water loss through transpiration [18]. The ratio of water loss through stomatal conductance to assimilation rate is known as intrinsic water use efficiency (WUEi = A/gs) [19]. Reducing stomatal density and thereby gs has been shown to enhance crop biomass with lower water use in rice and barley [20,21], while greater WUEi can also be achieved by increasing assimilation rates without using more water, through genetic manipulation of photosynthetic pathways [22,23,24,25]. Steady-state gas exchange measurements have shown a close proportional relationship between A and gs [26] and several studies have demonstrated that gs is also correlated with final yield in the field [27,28]. However under ambient conditions, such as those observed in the field, ‘steady-state’ is rarely achieved; light intensity can change rapidly (seconds to minutes) over a large range of intensities [29]. The assimilation rate adjusts within seconds in response to changing light intensity or other environmental cues, while gs is often an order of magnitude slower to respond [30,31,32,33]. Therefore, a disconnect between changes in A and gs can lead to periods of reduced CO2 assimilation relating to diffusional constraints on A from low gs, as well as periods of unnecessary water loss when the slow speed of stomatal closure does not match a rapid decline in A [30,31]. The kinetic responses of stomata including the rapidity and magnitude of change in gs provide a potentially unexploited target for increasing crop yield [30,34]. Small stomata are reported to be faster to respond to changing environmental cues owing to greater surface area to volume ratio [17], enhanced further in dumbbell-shaped guard cells, which are surrounded by subsidiary cells, the latter facilitating speedy stomatal movements by providing a reservoir of solutes that can be rapidly transferred to guard cells where they act as an osmotic to alter turgidity [29,35,36]. Therefore, before we can exploit these potential novel breeding targets we must understand the underlying mechanisms responsible for gs dynamics, and the processes and pathways that coordinate A and gs [37].
Historically, breeding has been directed toward yield improvement with a consequent loss of genetic diversity [4]. Heterogenous stomatal kinetic responses do however exist within and between C3 crop species and cultivars [38,39,40,41,42]. Exploiting such variation in landraces, wild relatives and elite varieties of major crops, including barley, could provide an avenue to recapture genetic diversity and identify new traits for exploitation [31,43,44].
The aim of this study was to characterise natural variation in stomatal anatomy and leaf physiology of wild barleys and landraces relative to elite varieties grown in both field and controlled environments to understand the extent of variation in gs, and A in non-elite cultivars compared to commercial varieties and assess the impact of stomatal responses on these. By linking physiological to anatomical data we hope to provide a greater understanding of underlying mechanisms that coordinate between the two, and how these may be exploited for improved yield potential. This study showed that there was no link between stomatal size and density and that the non-elite barley lines possessed physiological traits that would be attractive to breeders.

2. Materials and Methods

2.1. Plant Material and Growth Conditions

A wide combination of varieties of barley Hordeum vulgare L and H. vulgare ssp. Spontaneum (Table 1) were sourced from KWS (KWS UK Ltd., 56 Church St, Thriplow, UK) and John Innes Centre Germplasm Resources Unit (JIC GRU, Norwich Research Park, Norwich, UK) encompassing two and six-row ears, spring or winter habits and malt/feed end-uses.
Seeds were sown on 24 March 2016 into modular pots in Levington F2 + S at the KWS UK Ltd. field site at Thriplow, Cambs. Following an initial 5 days stratification in the dark at 5 °C, the seeds were transferred to a glasshouse. After three weeks they were transplanted into a polytunnel for the duration of the experiment in order to assure rapid establishment and growth, in a randomised 6-block design with one biological replicate per block. All six varieties (Table 1) were grown in each block, with double guard rows surrounding them, between March and July 2016 and were watered weekly. No additional fertiliser was used. Three groups of varieties were selected: 2 wild barleys originating in Central Asia (B3733 and B3745); 2 Central/Southern European landraces (Golden Archer and Hatif de Grignon) and 2 elite cultivars (KWS Orwell and KWS Sassy).
In addition, a selection of landrace barleys (Dea, Eire 6-Row, Golden Archer and Hatif de Grignon) as well as the elite variety KWS Irina were germinated on damp paper towels in two separate experiments in 2016 in the glasshouse at the University of Essex. On germination, they were transplanted into Levington F2 + S in 1 L pots and transferred to a controlled growth chamber (Conviron, Isleham, Cambs, UK) at 23 °C day/15 °C night at ambient humidity and CO2 with 188 +/− 6 μmol m−2 s−1 PPFD.

2.2. Infra-Red Gas Exchange Measurements of Photosynthesis.

Assimilation rate (A) was measured as a function of light intensity to assess photosynthetic performance. The mid-portion of the youngest fully expanded leaf (rather than a particular leaf succession, to account for developmental differences in the timing of leaf emergence) of each replicate was placed in a LiCOR 6400 (Li-COR Inc, Lincoln, NE, USA) chamber at a light intensity of 1500 μmol m−2 s−1 PPFD and left until A was stable (15–30 min). PPFD was then decreased in a stepwise manner and A recorded when a new steady state had been achieved (ca. 2 min). The light intensities used were 1500, 1250, 1100, 900, 700, 600, 500, 400, 200, 100, 50 and 0 μmol m−2 s−1 PPFD. VPD was maintained at 1 KPa, temperature at 22 °C [45] and [CO2] at 400 µmol mol−1. Data were modelled as Michaelis-Menten [46] enzyme kinetic parameters with PPFD as the substrate with concentration [S].
A = A s a t × [ S ] K m + [ S ] + R d
The rate of assimilation A was thus a function of Rd, the respiration rate in the dark, Asat the maximal assimilation rate at saturating light intensity and Km the Michaelis-Menten constant where the reaction rate was half maximum. The initial slope (i.e., quantum efficiency) of the light response curve was therefore in the linear part of the curve between 0 and 150 μmol m−2 s−1 PPFD:
S l o p e i = ( A s a t × 150 ( K m + 150 ) A s a t × 0 ( K m + 0 ) 150 0 )
Assimilation rate was also measured as a function of [CO2] to assess the impact of internal CO2 concentration on photosynthetic capacity. The mid-portion of the youngest fully expanded leaf of each replicate was placed in a LiCOR 6400 (Li-COR Inc, Lincoln, NE, USA) chamber at a light intensity of 1500 μmol m−2 s−1 PPFD and left until A was stable (15–30 min). Partial pressure of CO2 was then decreased in a stepwise manner and A recorded when a new steady state had been achieved (ca. 2 min). The CO2 concentrations used were 400, 250, 150, 100, 50, 400, 550, 700, 900, 1100 and 1300 μmol CO2 mol−1 air. VPD was maintained at 1 KPa and temperature at 22 °C. Data were modelled using the methods outlined by Duursma et al. [47] by curve-fitting the Farquhar-Berry-von Caemmerer model of stomatal conductance and expressing the results as three parameters of a series of non-linear regressions; Vc max, the maximum velocity of Rubisco for carboxylation, Jmax, the maximum rate of electron transport demand for Ribulose 1,5 bisphosphate and Rd, the rate of respiration in the dark.

2.3. Stomatal Kinetic Responses

Kinetic responses of A and gs were measured by placing the youngest fully expanded leaf in the cuvette of an infra-red gas analyser (LiCOR 6400, Li-COR Inc., Lincoln, NE, USA). Leaves were first equilibrated at a PPFD of 0 μmol m−2 s−1 until both A and gs were stable (ca. 20–30 min). PPFD was then increased to 1000 μmol m−2 s−1 for 40 min. The leaf cuvette was maintained at 400 μmol mol−1 CO2 concentration (Ca), a block temperature of 25 °C and a VPD of 1. Assimilations and stomatal conductance were recorded every 1 min. Intrinsic water use efficiency (WUEi) was calculated as WUEi = A/gs. Data were modelled according to the method in Vialet-Chabrand et al. (2013) [48] as updated by McAusland et al. (2016) [39]. The model described the temporal response of gs at time t using a time constant (τ, min), an initial time lag (λ, min) and a steady-state gs (Gs1000, mmol m−2 s−1) reached at given PPFD:
g s = ( G s   1000 g 0 ) × e e ( λ + t τ + 1 ) + g 0
while the change in A was modelled as a simple exponential without the lag, λ:
A = ( A 1000 A 0 ) × e t τ + A 0
Time t = 0 was the point at which PPFD was increased from 0 to 1000 μmol m−2 s−1; g0 (mmol m−2 s−1), was the initial value of stomatal conductance before the change in PPFD, A0 (μmol m−2 s−1) the initial value of A before a change in PPFD and A1000 (μmol m−2 s−1) the value of A at 1000 μmol m−2 s−1 PPFD.
A second parameter combining rapidity and amplitude of the response, the maximum slope (Slmax), was used to describe the maximal slope of the gs and A responses to the step-change in PPFD:
S l m a x = τ × ( G s   1000 g 0 ) e

2.4. Stomatal Anatomical Characteristics

Stomatal impressions of the abaxial leaf surfaces were taken at the same locations measured during gas exchange. A negative impression was made using dental polymer (Xantoprene, Heraesus Kulzer Ltd., Hanau, Germany) following the methods of Weyers and Johansen [49]. A positive impression was made from the dried polymer by painting with nail varnish and placing the dried film on a microscope slide. Three pseudo-replicates from each impression (with a field of view of ~1250 μm2) were averaged to give stomatal density and stomatal pore length determined using a calibrated 5 MP eyepiece camera (MicroCAM 5 MP, Bresser Optics, Rhede, Germany).

2.5. Growth Measurements

A number of measurements important in partitioning growth and development were taken at harvest 162 days after sowing when the plants were visibly mature and dry: tiller number, fertile ears tiller−1, harvest Index (grain mass/above-ground biomass, HI [50], thousand grain weight (TGW), grain number plant−1 and grain mass plant−1 [51]. Thousand grain weight is a measure of yield quality that is known to have a genetic component [52].

2.6. Statistical Analyses

Statistical analyses were conducted using R and RStudio [53]. A two-way analysis of variance (ANOVA) was used for gas exchange data when two factors (genotype × block) were present (i.e., for the variables A, gs, τ, A1000, Gs1000 and Slmax of A and gs for fieldwork) with outliers greater than 3 sd from the mean removed. Single factor analyses were carried out using one-way ANOVA (i.e., for A, gs, Asat, gs sat, Vc max, Jmax in the controlled environment chamber). Curve fitting in R used the plantecophys package [47]. Shapiro–Wilk’s and Breusch-Pagan’s tests were used to test data for normality and homogeneity of variance, respectively. The strength of trait associations (between stomatal density and size, and with kinetic and maximal responses) were measured using Pearson’s correlation coefficient.

3. Results

3.1. Analysis of Steady-State and Kinetics of gs and A in Field-Grown Varieties

To evaluate the responsiveness of A and gs to changing light intensity in the field, we applied a step change in light intensity from low (0 µmol m−2 s−1 PPFD) to high (1000 µmol m−2 s−1 PPFD) and measured the responses using infra-red gas exchange analysis (Figure 1). The data were modelled as per the exponential Equations (3)–(5) described in the methods section (Figure 2). Assimilation was negative at the start of the measurements at 0 µmol m−2 s−1 PPFD (Figure 1A), and initially rose rapidly after PPFD was increased to 1000 µmol m−2 s−1 before reaching a plateau toward the end of the measurement period. There was a lag in the response of gs to increasing light intensity, but it too rose, albeit more slowly, toward a plateau toward the end of the period.
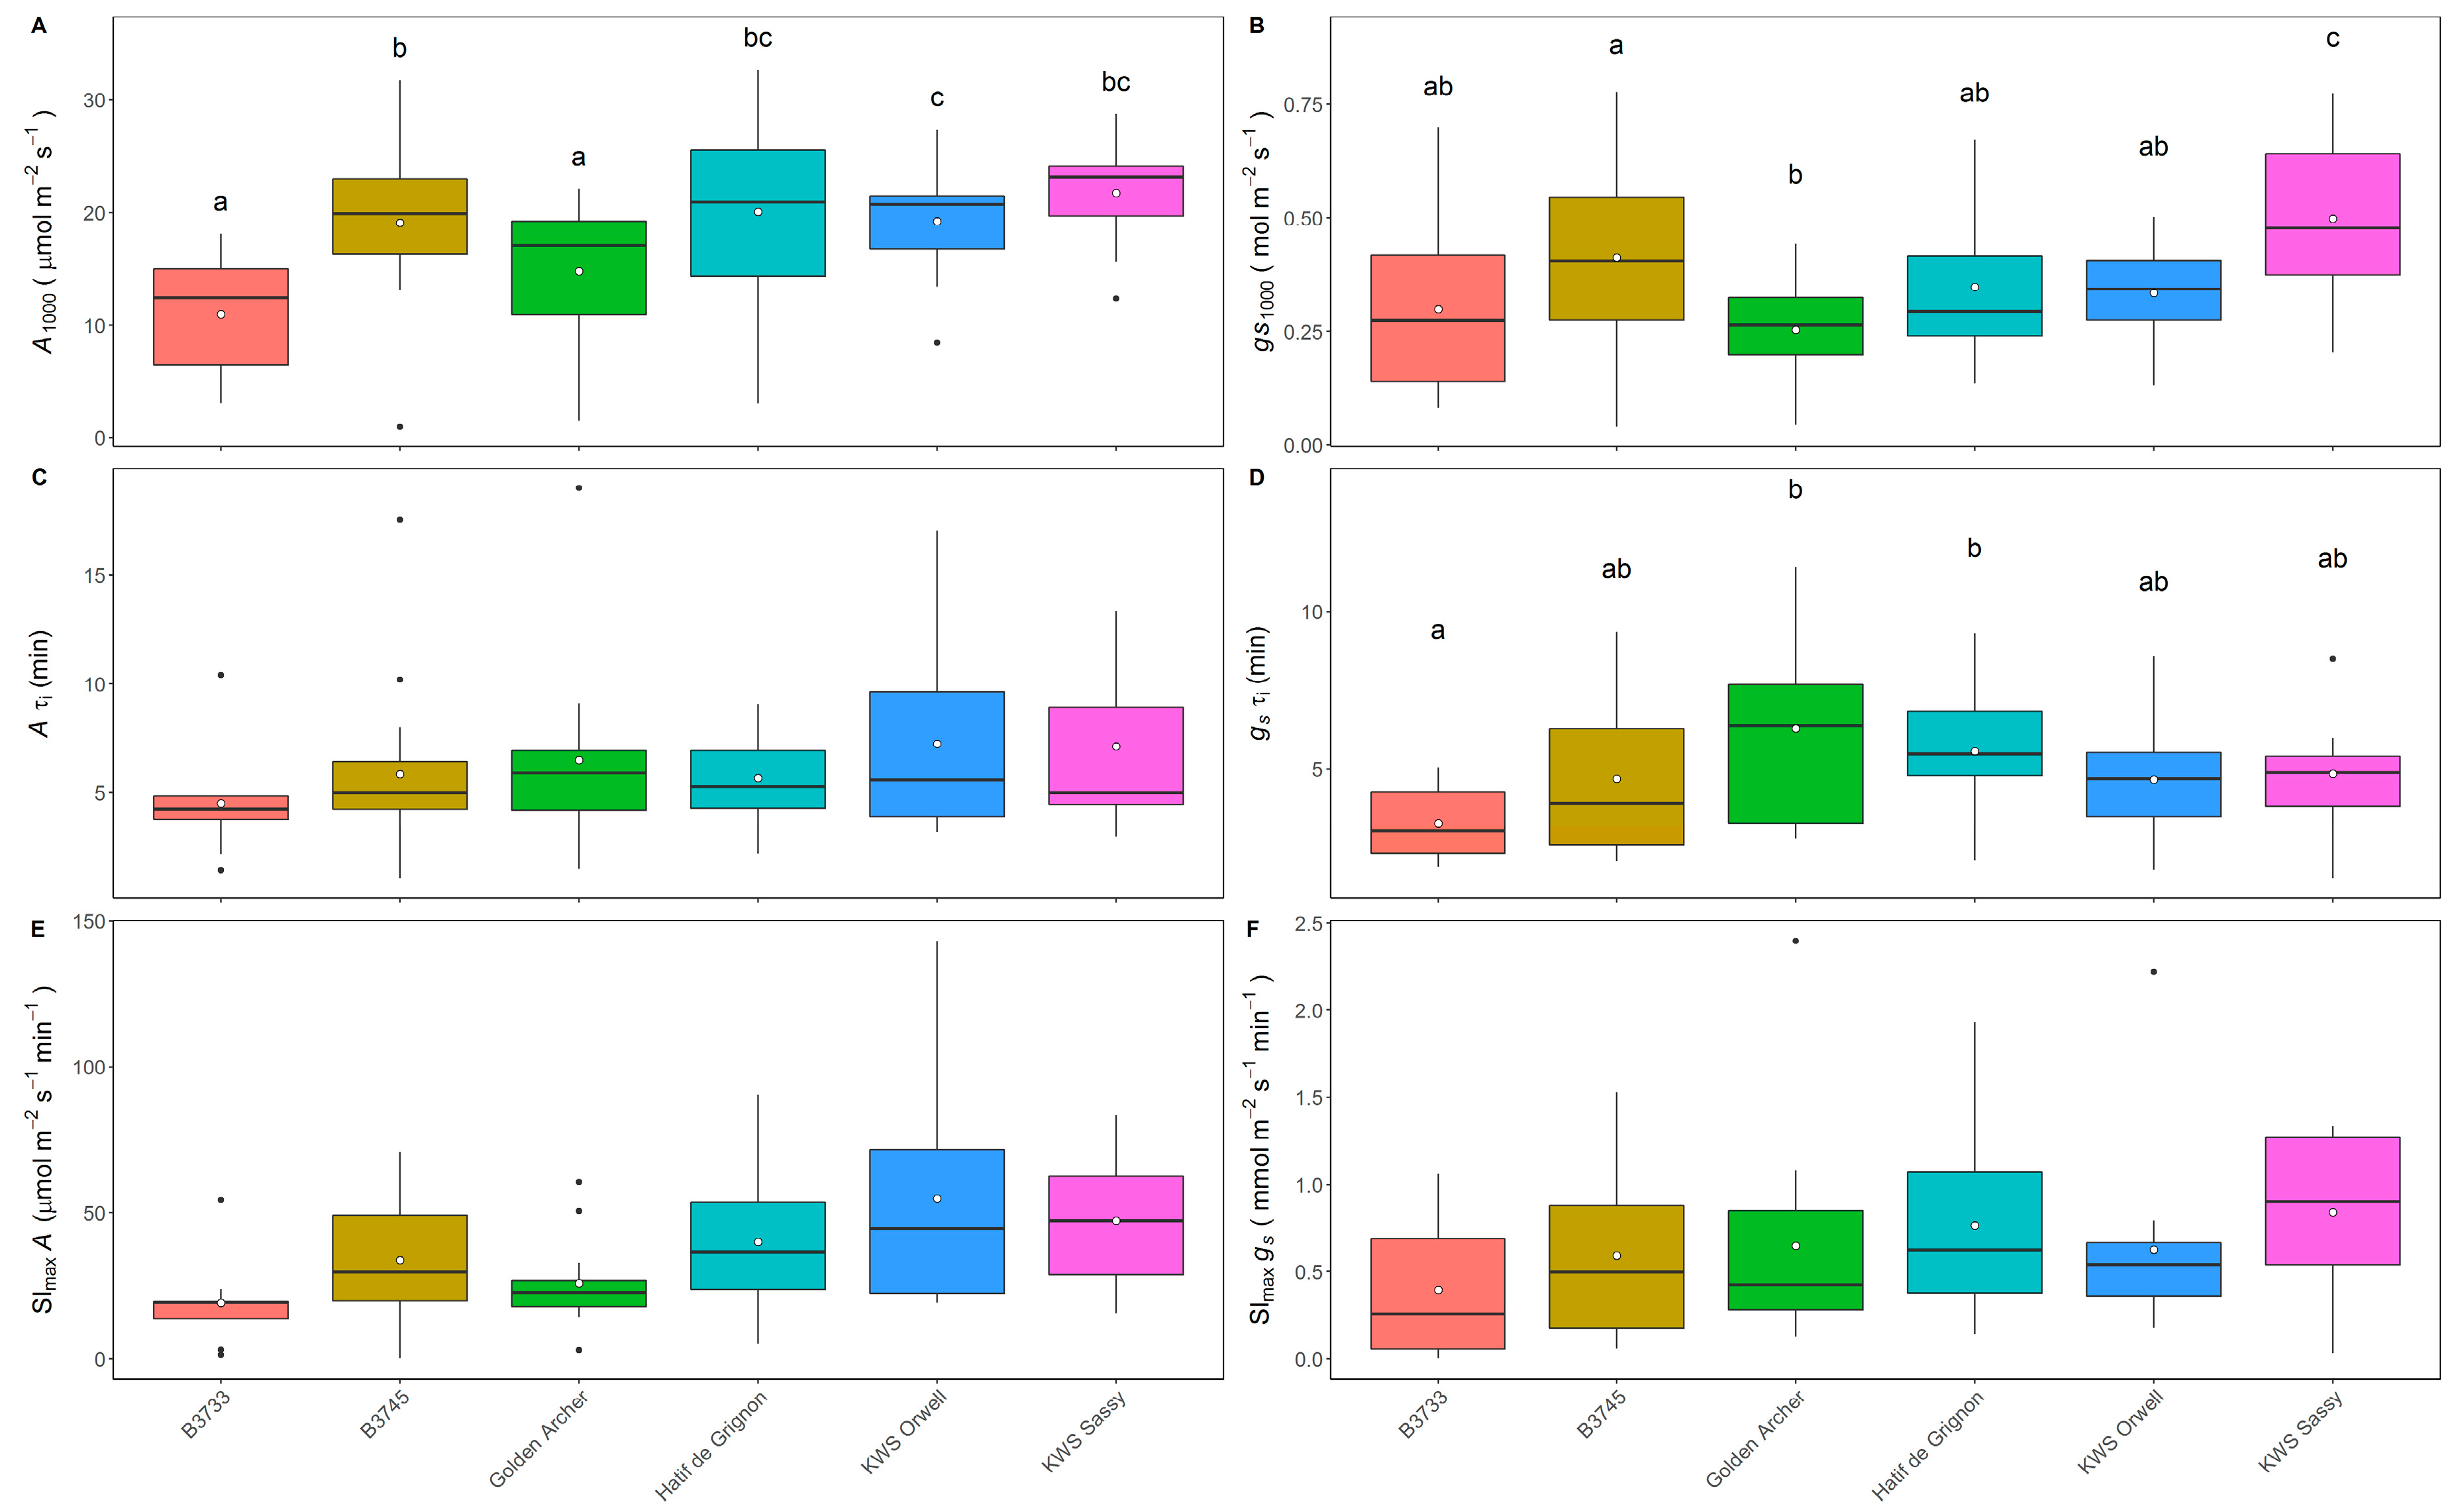
Maximal rates (taken as the last five minutes of the measurement period) for A and gs at 1000 μmol m−2 s−1 PPFD (Figure 2A,B) were significantly different across genotypes (F(5, 70) = 23.2 and F(5, 70) = 9.8, respectively, p < 0.05). The wild barley B3733 had the lowest maximal assimilation (11.0 μmol m−2 s−1) while KWS Sassy had the highest (21.7 μmol m−2 s−1); similarly there was a 2-fold difference in maximal gs between the landrace Golden Archer and the elite cultivar KWS Sassy.
We further characterised the speed of responses to changing light intensity from 0 μmol m−2 s−1 to 1000 μmol m−2 s−1, separately from maximal values (Figure 2C–F). There was no genotypic variation in the time constant of assimilation responses (p = 0.51, Figure 2C), although the overall model was significant for the maximum rate of change of the assimilation response (F(5, 70) = 3.45, p < 0.05, Figure 2E) and while A for KWS Orwell increased by 55.1 μmol m−2 s−1 min−1 compared to 19.1 μmol m−2 s−1 min−1 for B3733, Tukey’s test was unable to distinguish between the varieties. In addition, there was a clear effect of variety on stomatal responses to changing light intensity. The time constant of gs response to increasing light was affected by variety (F(5, 71) = 2.41, p < 0.05, Figure 2B), although not the rate of response of gs (p = 0.48, Figure 2D). The time constants for gs (Figure 2B) were longest for the landraces Golden Archer (6.3 min) and Hatif de Grignon (5.6 min), and shortest for the wild barley, B3733 (3.3 min). Meanwhile, there was trend for the wild barleys (B3733 = 0.39 μmol m−2 s−1 min−1 and B3745 = 0.5937 μmol m−2 s−1 min−1) to have the slowest rate of change in response of gs to increasing light intensity (Figure 2F), while landraces and elite varieties were the fastest to react by 43% or more.

3.2. Field Trial Stomatal Anatomy

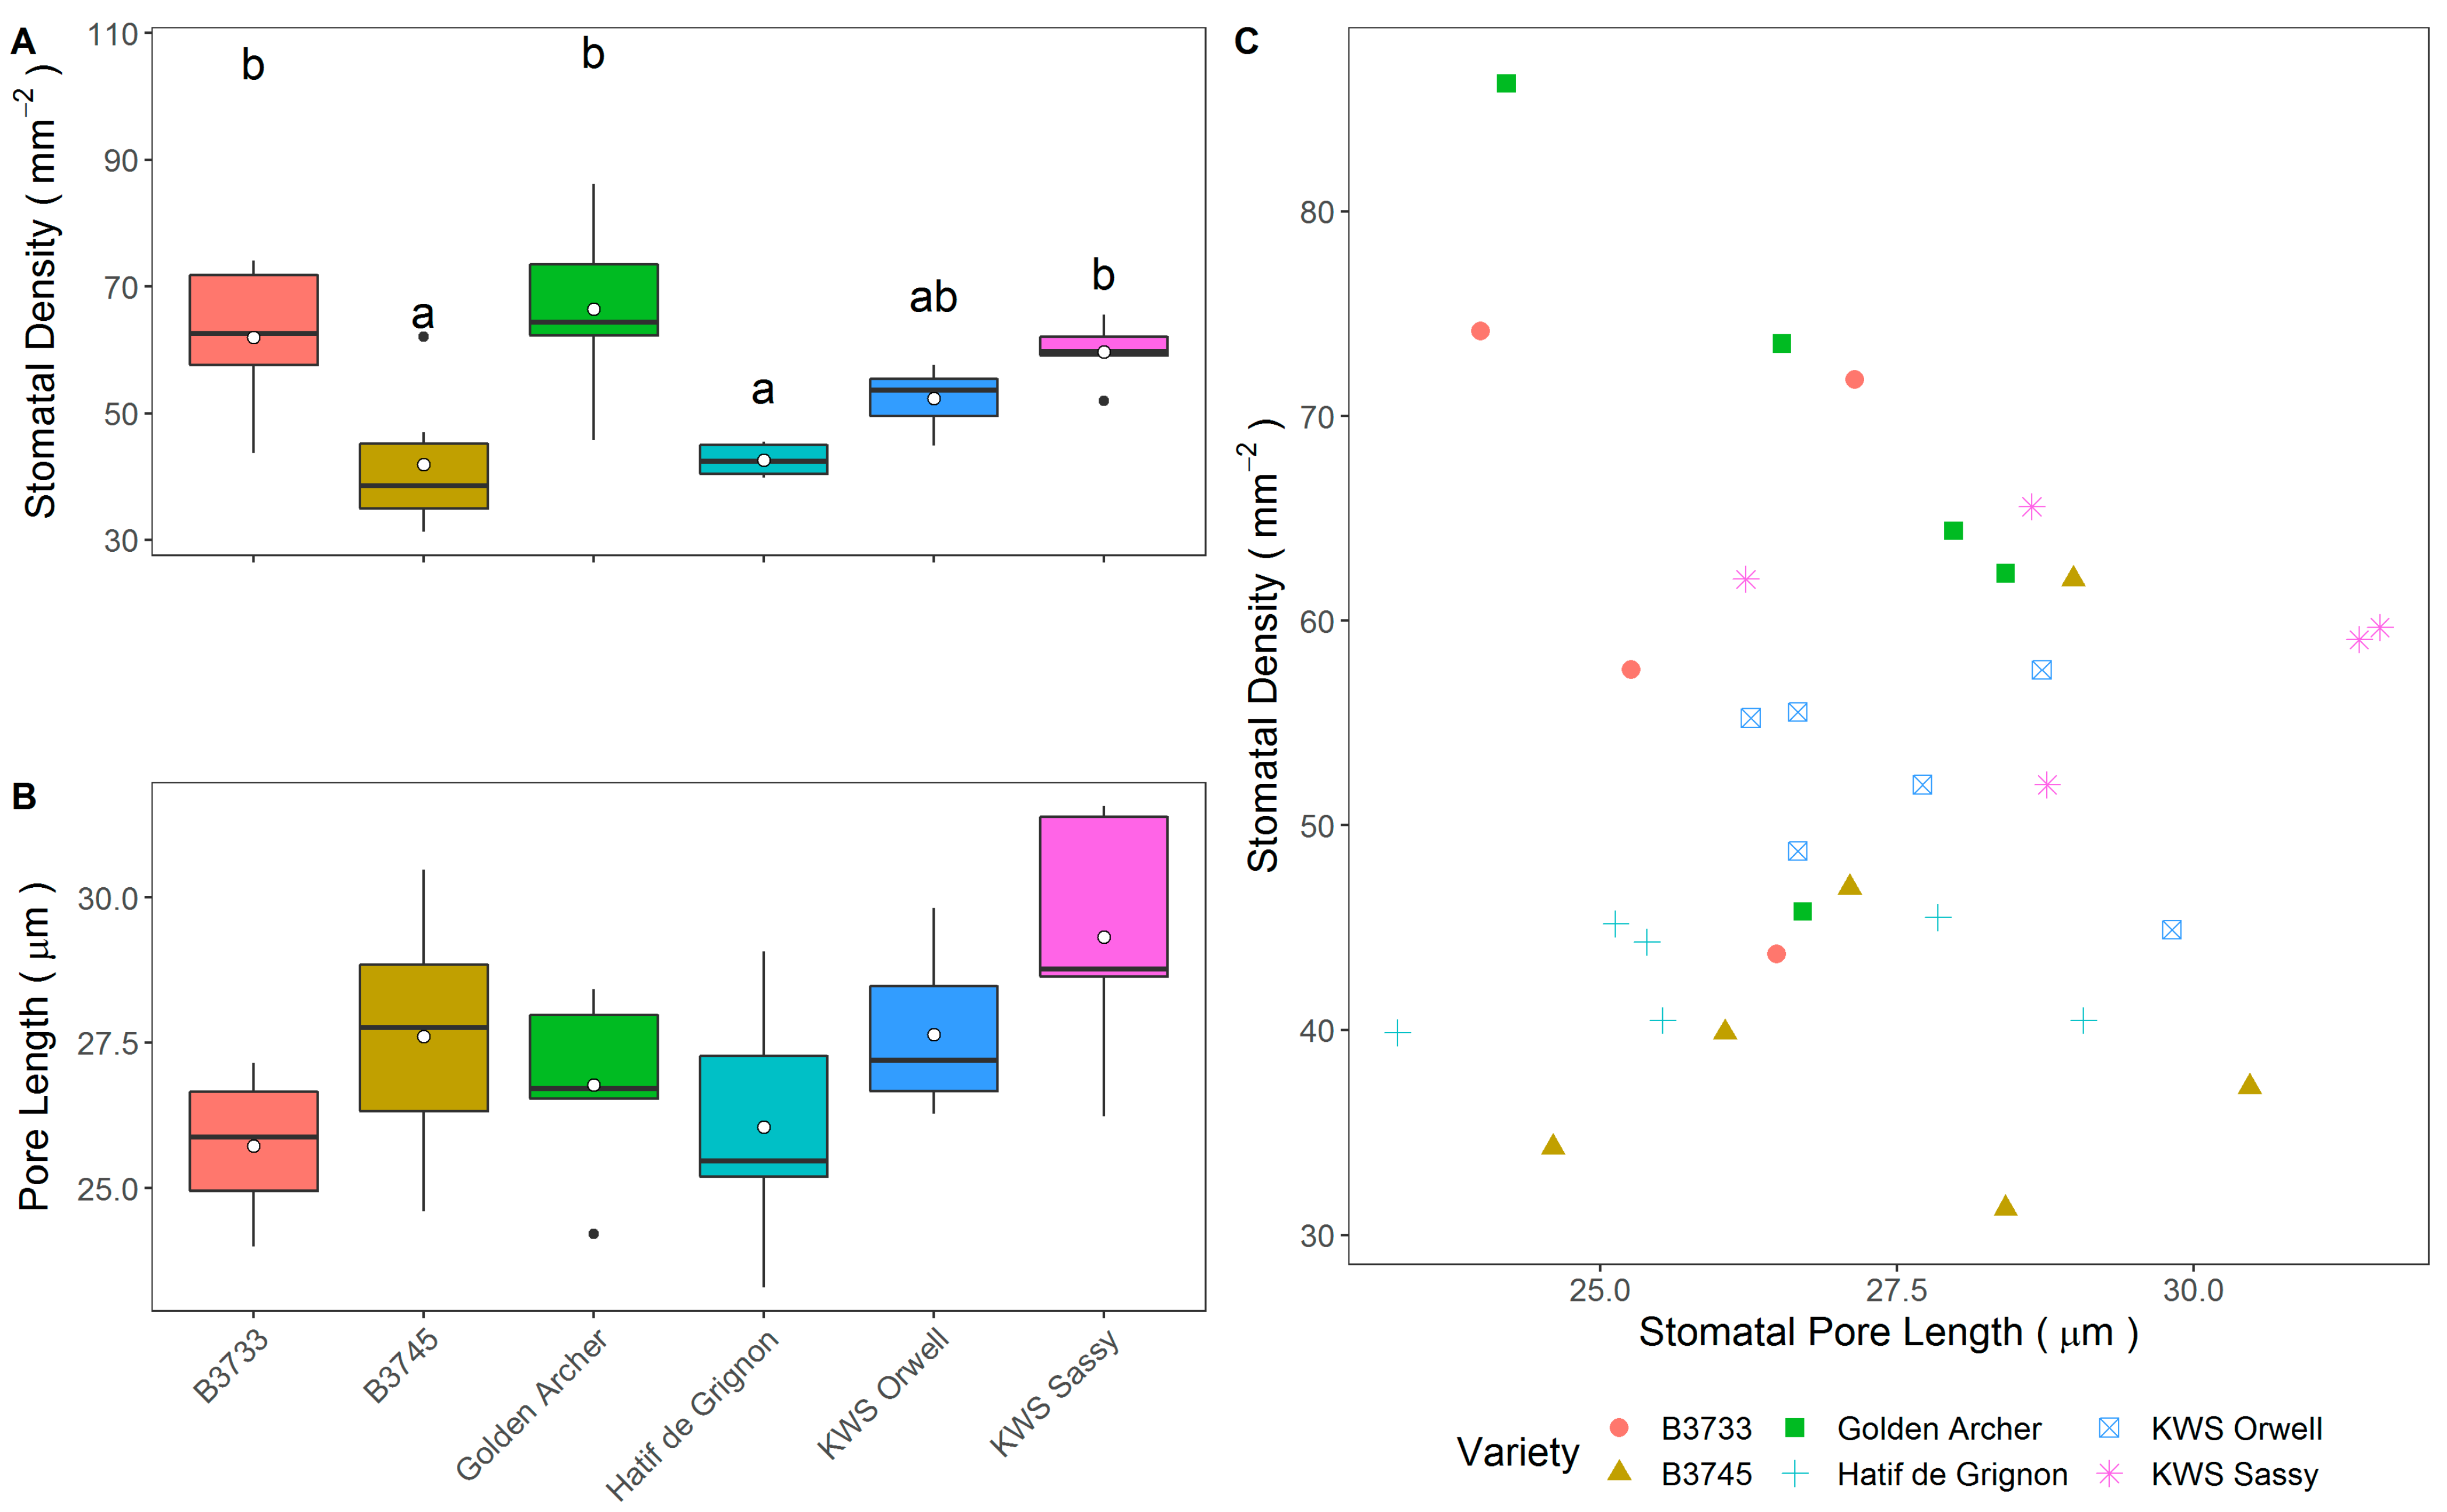
To explore whether the responses to changing light intensity resulted from stomatal anatomical variability, stomatal impressions were taken of the leaves subjected to the step change measurements (Figure 3A–C). There was a significant genotypic variation in stomatal density (Figure 3A, F(5, 22) = 7.0, p < 0.05) but not size (Figure 3B, p = 0.056) and no correlation between the two (Figure 3C, p = 0.20), even when accounting for the effect of variety on that relationship (p = 0.52). The wild barley variety B3745 had the lowest stomatal density (41.9 mm−2) and along with the landrace Hatif de Grignon (42.6 mm−2) had density that was significantly lower than B3733 (61.8 mm−2), Golden Archer (66.2 mm−2) and KWS Sassy (59.4 mm−2). Elsewhere, KWS Sassy had a pore length that was only 13.5% longer than that of the variety with the shortest pores, B3733 (Figure 3C).
To characterize the relationship between stomatal anatomy and gs kinetic responses further, the relationships between stomatal density and A or gs at high light intensity were explored. There was no correlation between stomatal density and A1000 (p = 0.64), or with gs1000 (p = 0.57) even accounting for variety. Similarly, there was no evidence that stomatal size was linked to the kinetic responses to changing light intensity including any of τA (p = 0.84), τgs (p = 0.61), Slmax A (p = 0.86) or Slmax gs (p = 0.92) (Supplementary Materials).

3.3. Field Trial Harvest

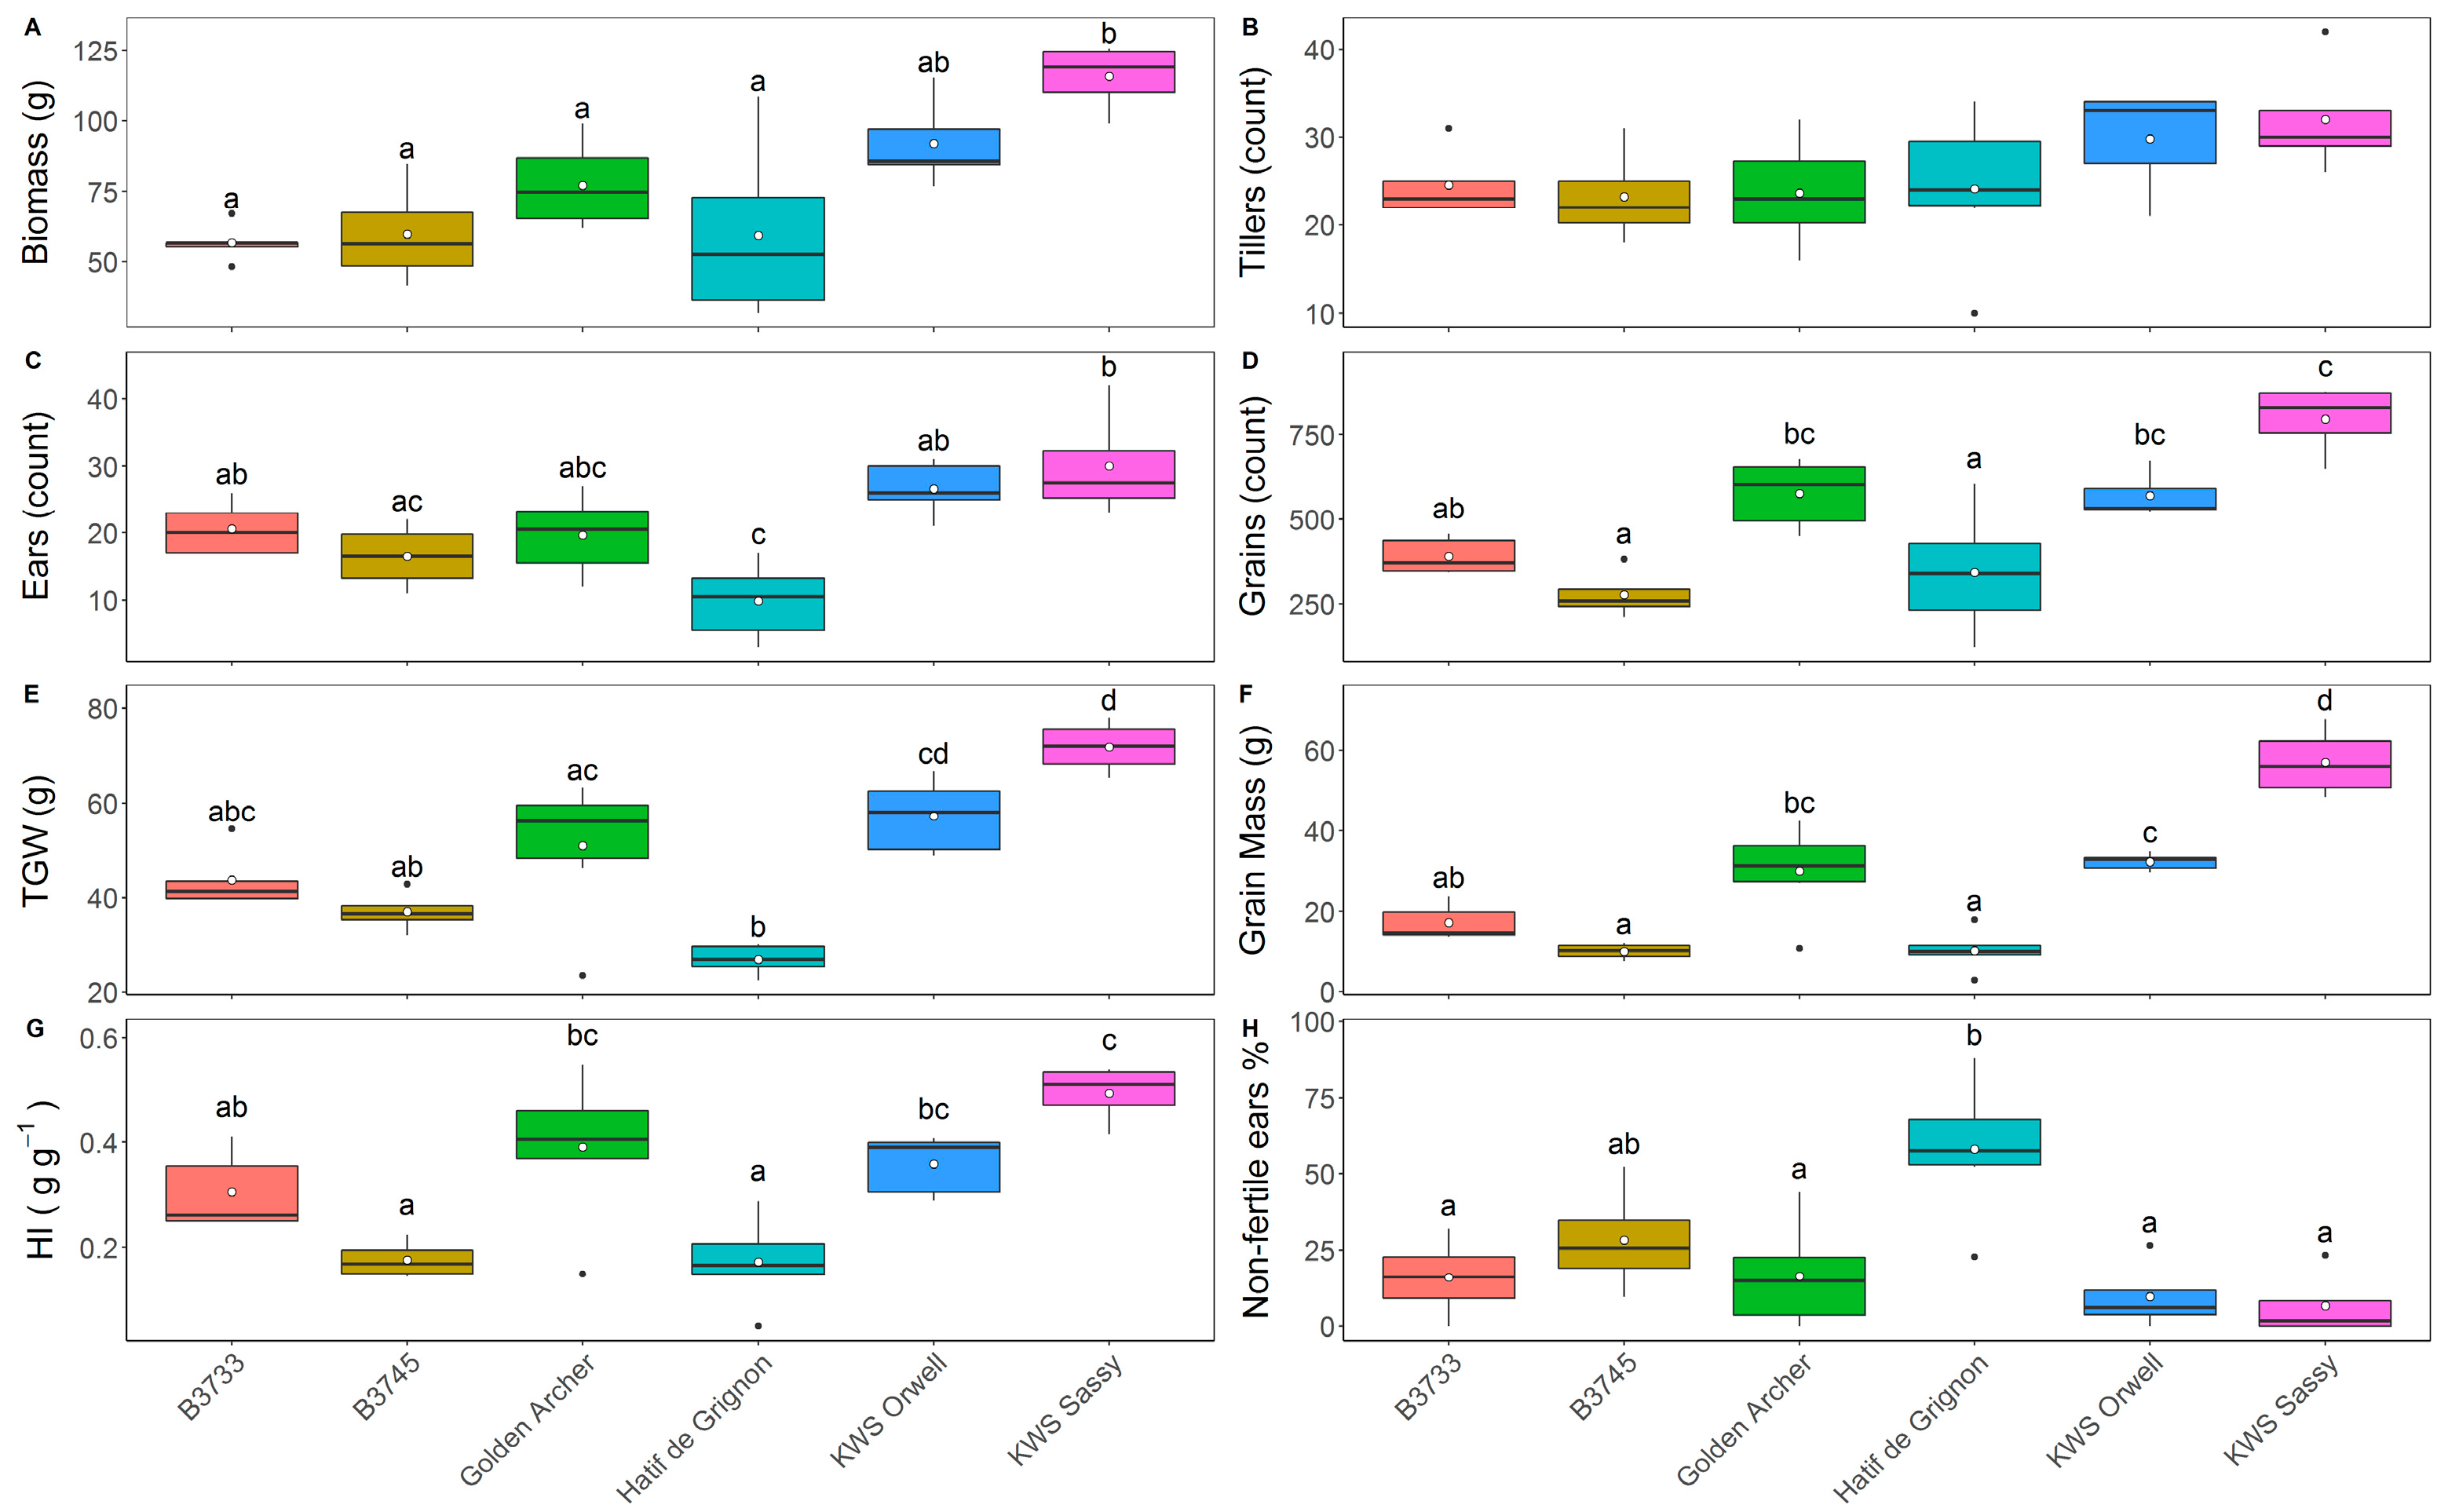
At the completion of the field trial, a range of data relating to harvest were recorded (Figure 4) to understand the variability in yield and yield components among the different varieties, and to attempt to link physiological and anatomical traits to yield. The elite variety KWS Sassy outperformed other varieties across all metrics compared to landrace and wild varieties (Figure 4A–H). The landrace Golden Archer delivered yield and yield component outcomes that were comparable with those for KWS Orwell on all variables measured and contrasted strongly with the performance of the landrace Hatif de Grignon (Figure 4A–H).
Variety significantly affected biomass (F(5, 24) = 7.23, p < 0.05), ear number (F(5, 24) = 8.5, p < 0.05), grain number (F(5, 24) = 14.0, p < 0.05), grain mass (F(5, 23) = 29.5, p < 0.05), thousand grain weight (F(5, 23) = 15.3, p < 0.05), harvest index (F(5, 19) = 11.7, p < 0.05) and the proportion of non-fertile ears (F(5, 20) = 8.6, p < 0.05). There were no differences at a varietal level in tiller number (p = 0.21), although only the elite varieties exceeded 30 tillers on average while all the other varieties had fewer than 26 tillers (Figure 4B). KWS Sassy delivered double the biomass per plant (119 g) compared to B3733, B3745 and Hatif de Grignon (all 56 g; Figure 4A). This disparity in biomass was reflected in the number of ears, where KWS Sassy managed 27.5 ears plant−1 compared to just 11.0 in the case of Hatif de Grignon (Figure 4C). KWS Sassy also stood in contrast to Hatif de Grignon and B3745 in grain number plant−1 delivering 2.4 and 3.3 times more grains, respectively, (Figure 4D). Likewise, KWS Sassy was superior to the other varieties in TGW and grain mass plant−1 (Figure 4E,F). One reason for the relatively poor harvest outcomes for Hatif de Grignon could have been the number of infertile tillers (Figure 4H), where over half the latter’s tillers did not bear ears compared to under 2% in the case of KWS Sassy.

3.4. Photosynthetic Capacity of Elite and Landrace Barley Lines

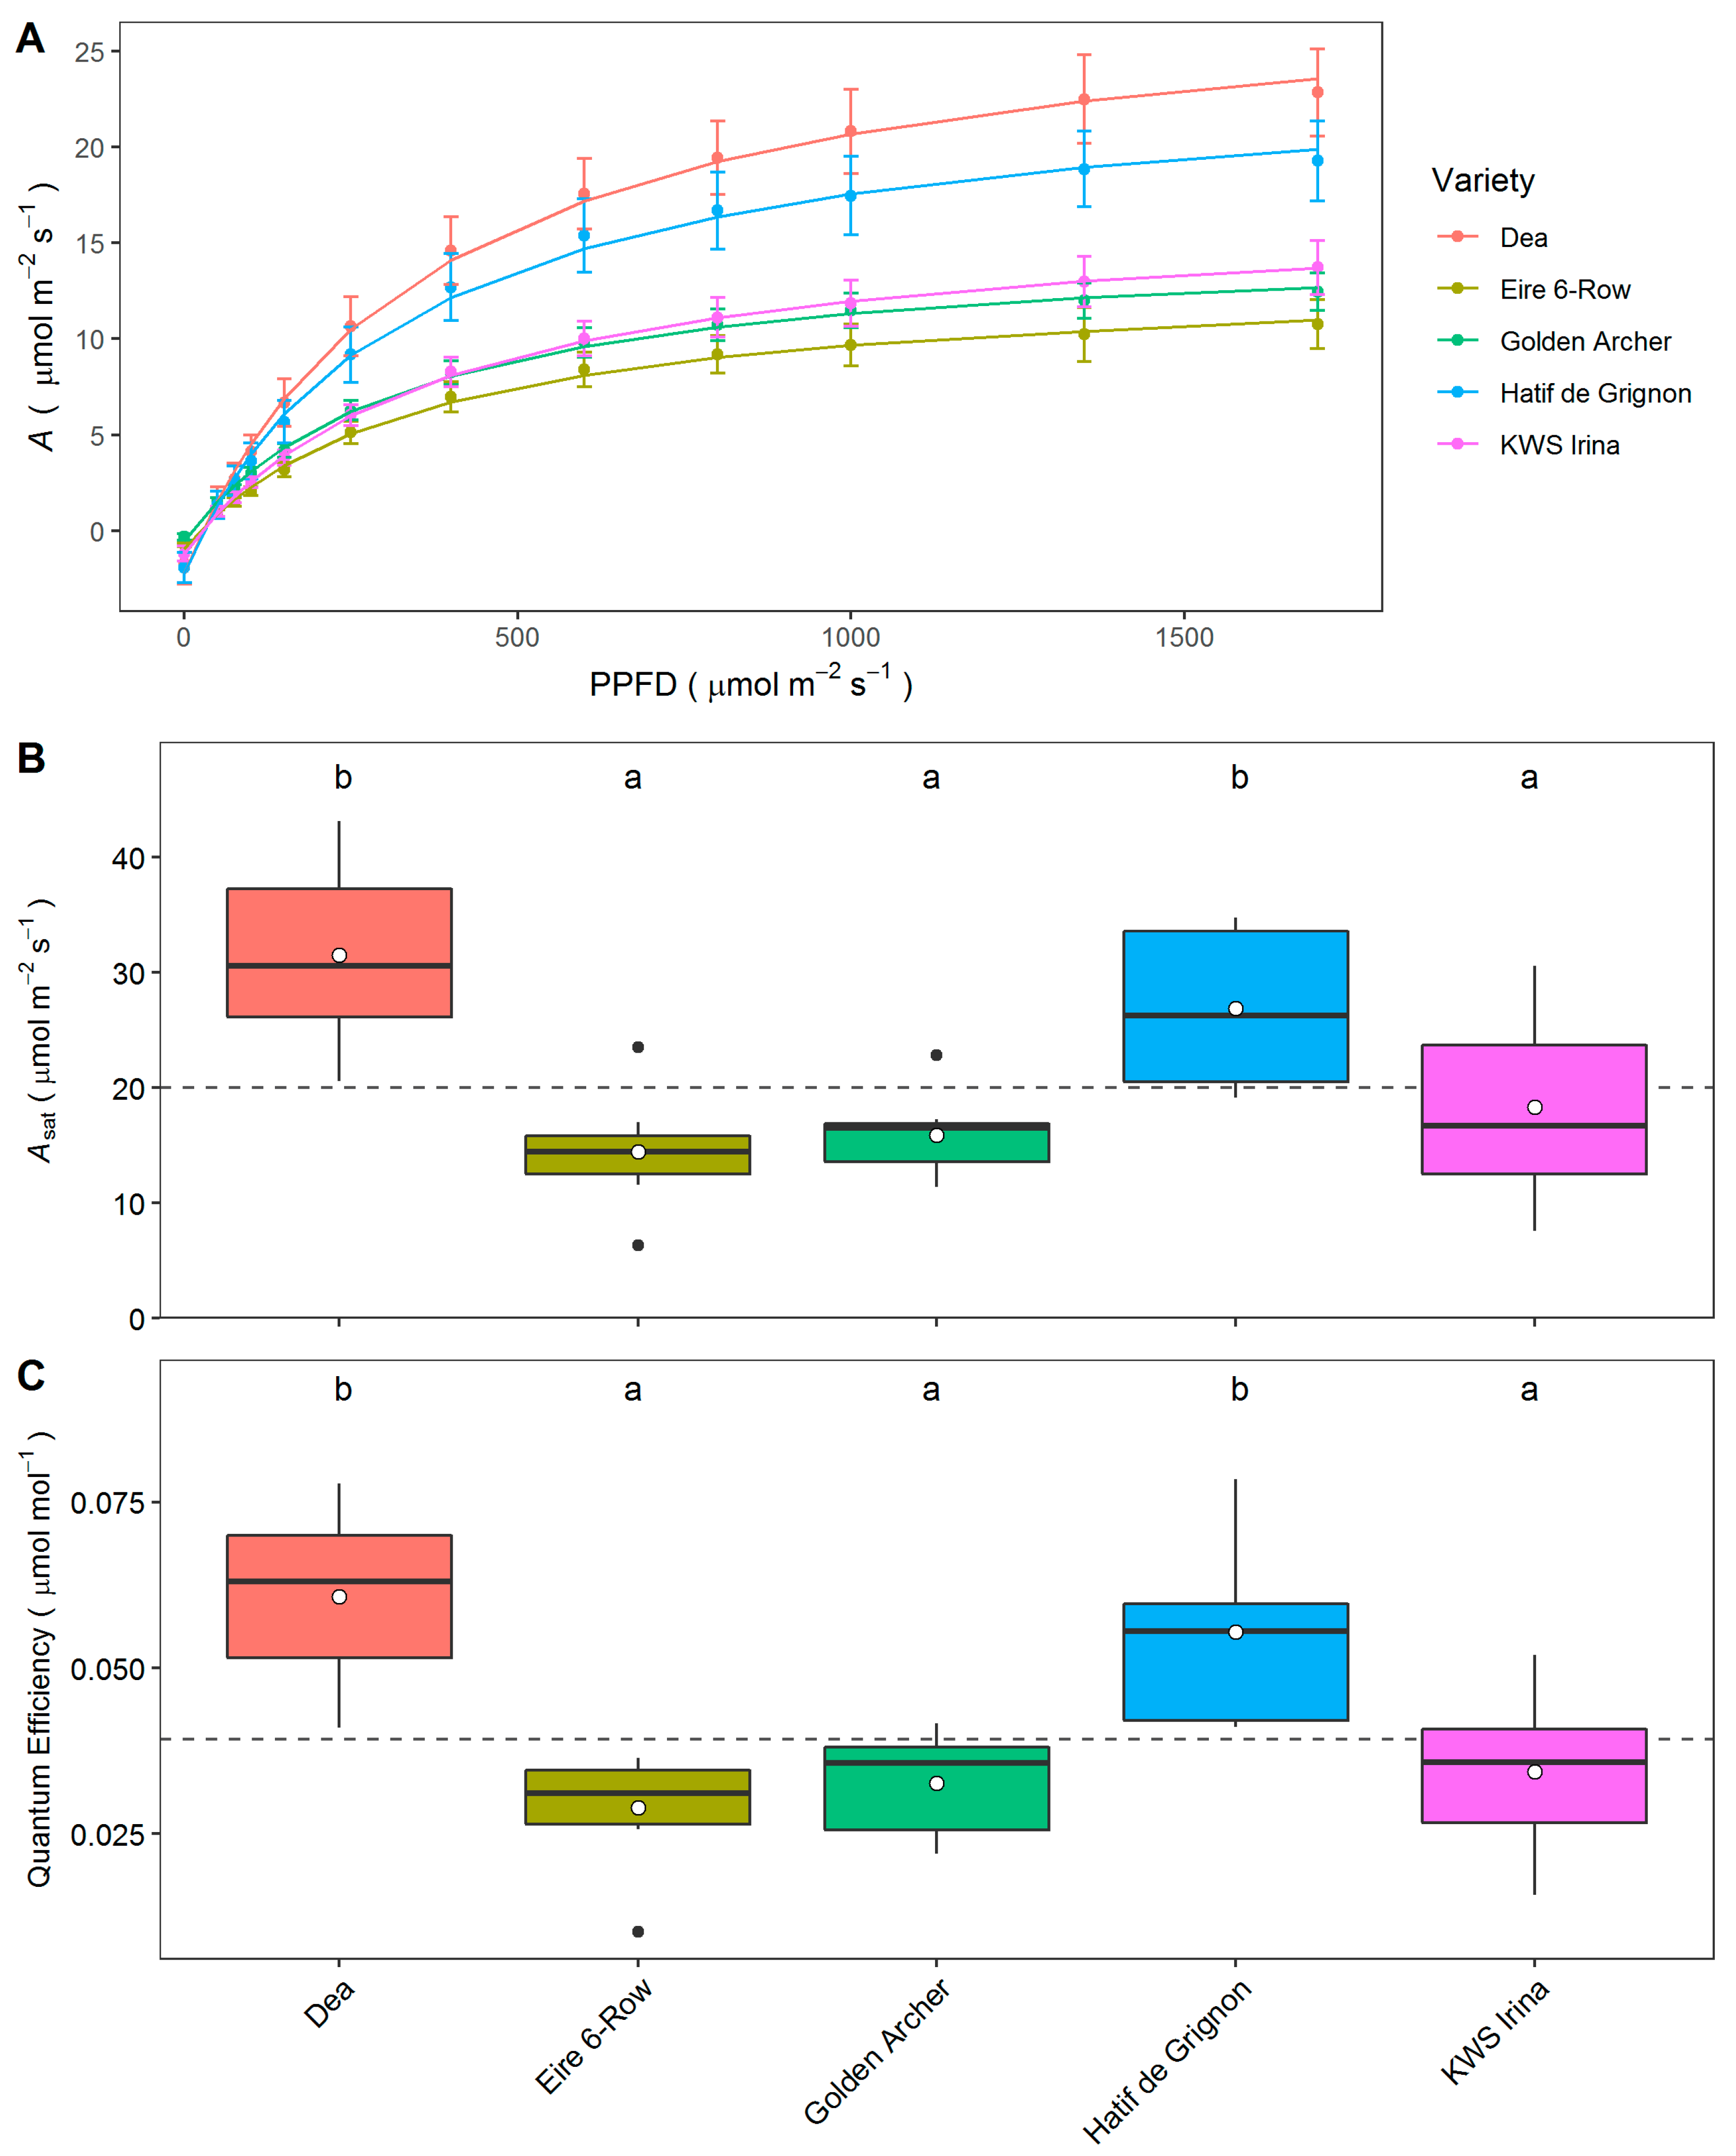
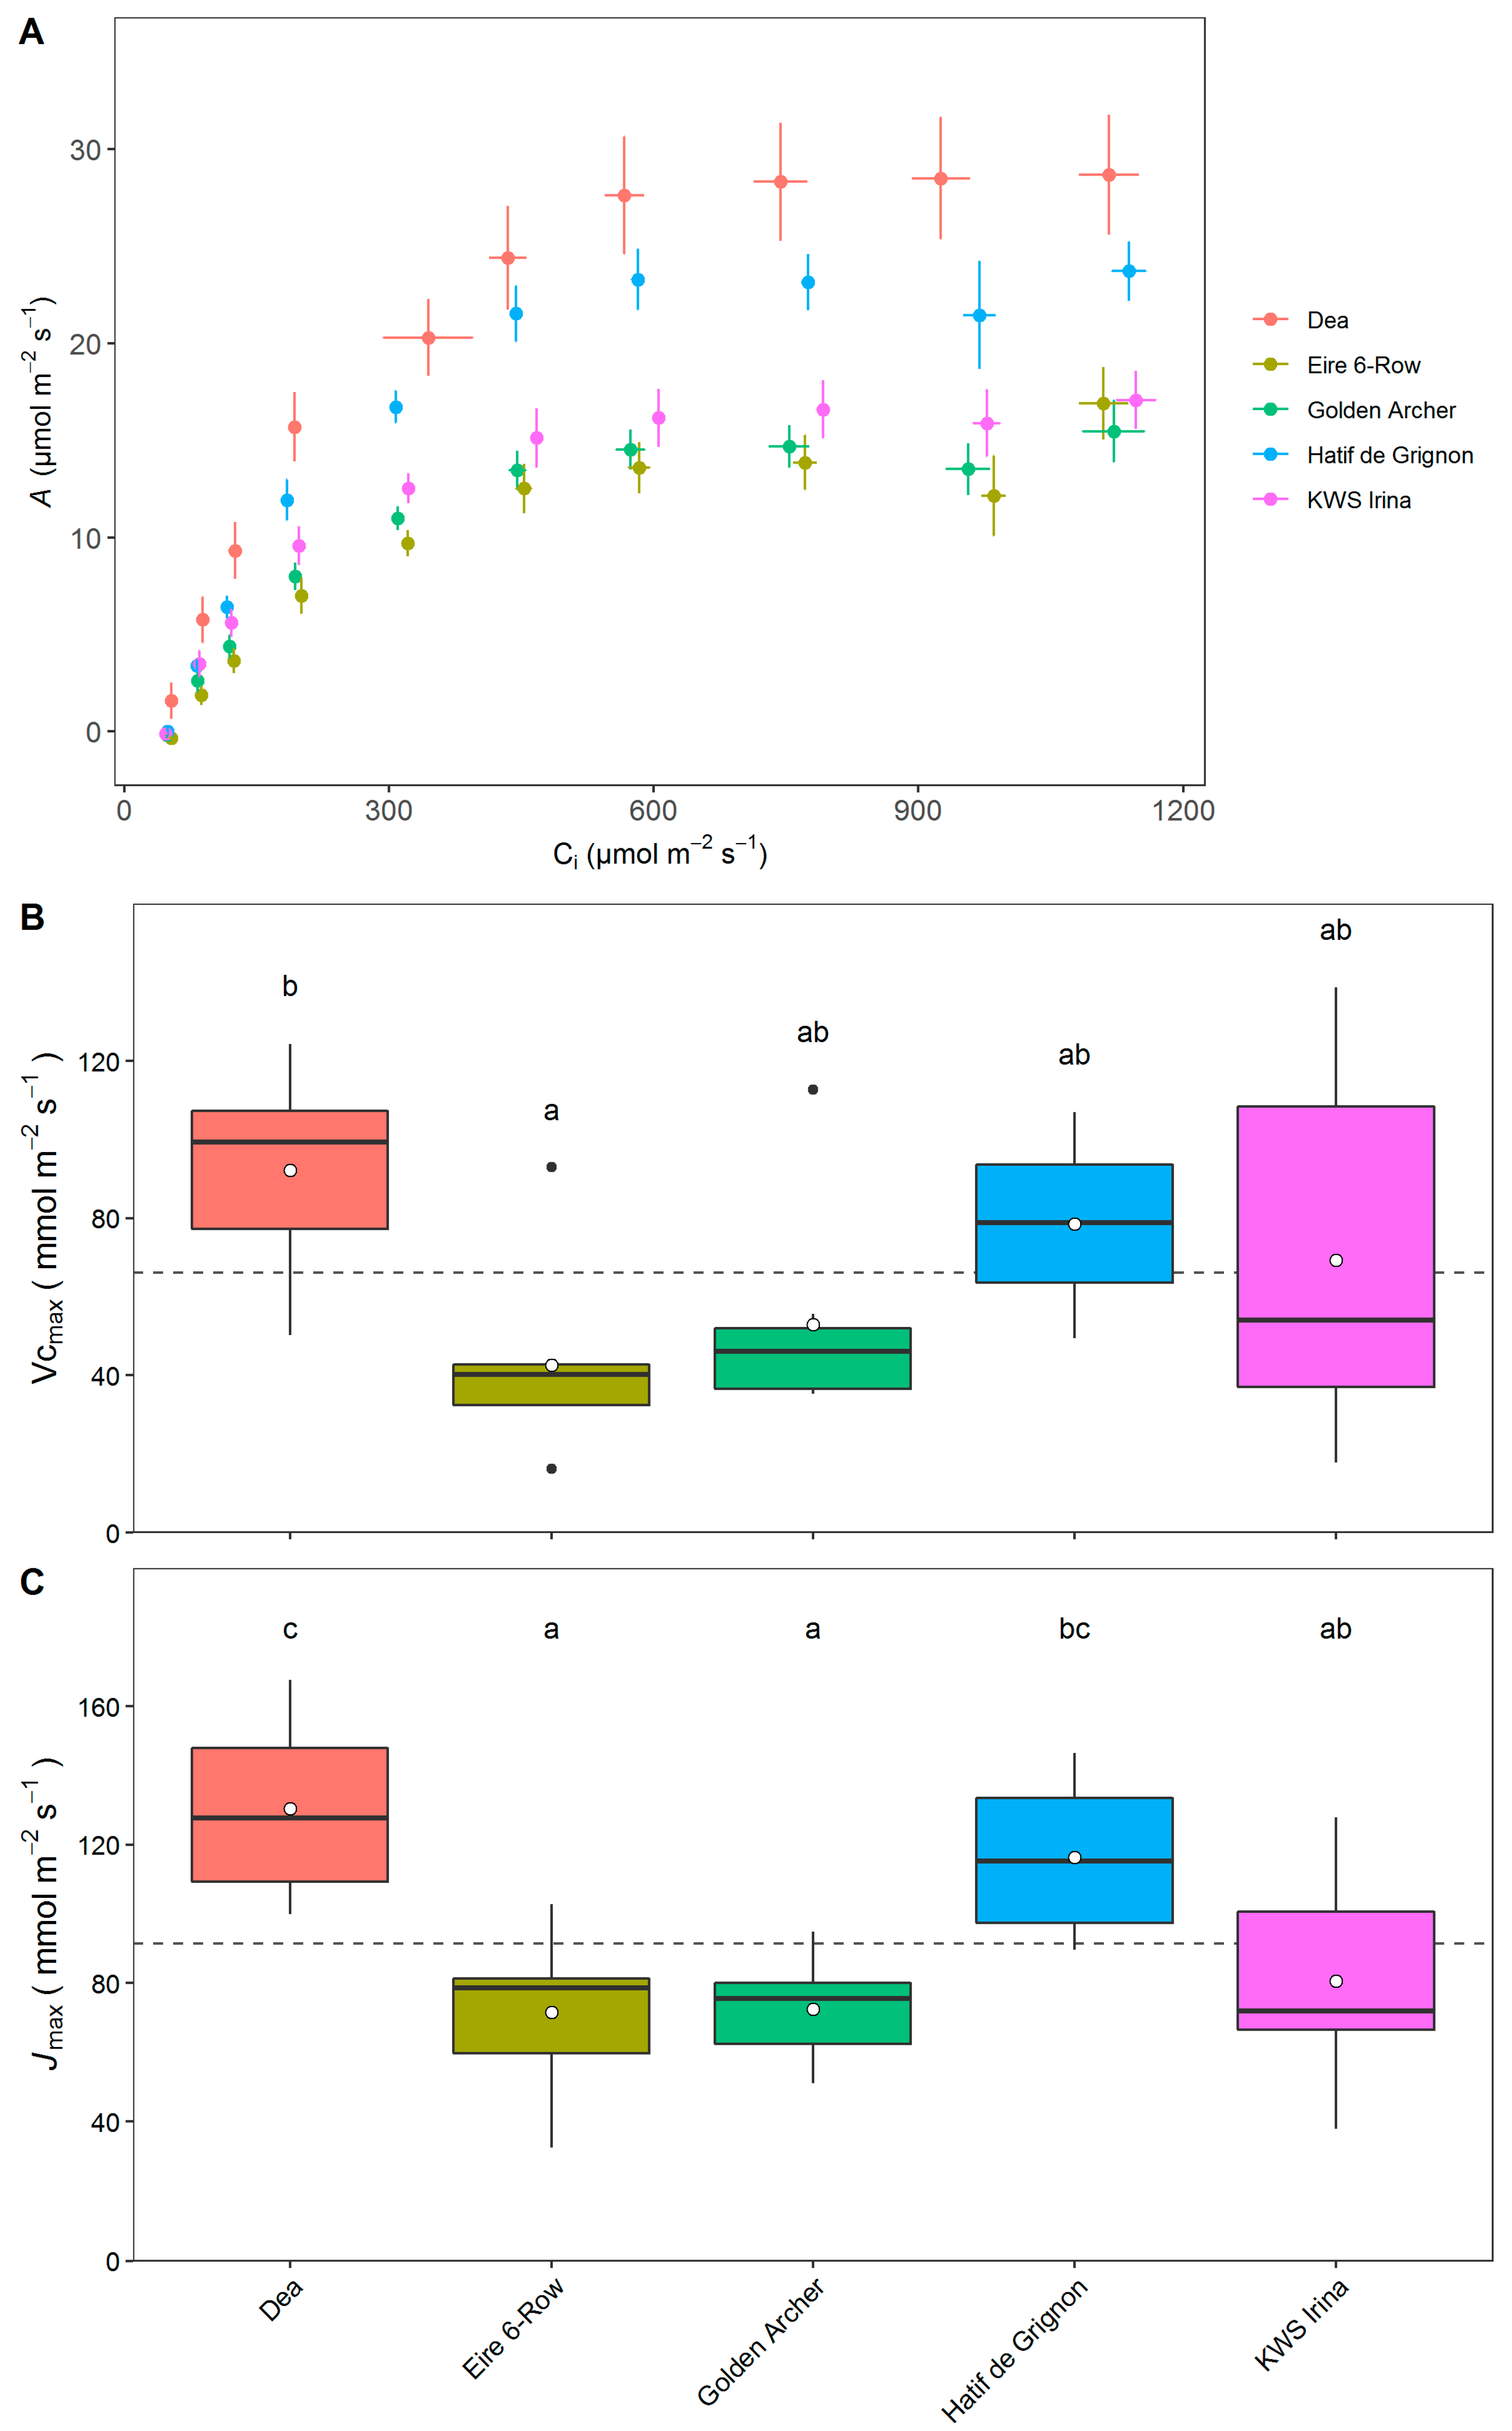
To examine the possibility that heterogeneity in kinetic responses to changing light intensity was driven by biochemical processes, the photosynthetic capacities of a range of landraces and the elite variety KWS Irina were characterized (Figure 5). By measuring assimilation at a range of light intensities from 0 to 1300 μmol m−2 s−1 PPFD, it was possible to assess the quantum efficiency (i.e., the initial slope of assimilation response to increasing light above 0 μmol m−2 s−1 PPFD) as well as the level of assimilation when light was saturating (Figure 5A–C). The Central/Southern European landraces Dea and Hatif de Grignon had greater quantum efficiency (0.061 and 0.055 μmol μmol−1, respectively) compared to the northern European cultivars Golden Archer and Eire 6-Row (0.029 and 0.033 μmol μmol−1; Figure 5C). Furthermore, Dea and Hatif de Grignon had higher Asat (31.5 and 28.9 μmol m−2 s−1, respectively) compared to Eire 6-Row and Golden Archer (14.5 and 15.9 μmol m−2 s−1, respectively).
The response of A to changing Ci can be used to generate insights into biochemical activity in the chloroplast; notably the maximum rate of carboxylation of Rubisco (Vc max) and the maximum rate of electron transfer (Jmax). As Ci increases, so does assimilation which asymptotically approaches a maximum level (Figure 6A).
Here, the both the Vcmax (Figure 6B) and Jmax (Figure 6C) responses followed a similar pattern to those observed in the light response curves. Variety had a significant effect on Vcmax (F(4, 37) = 2.63, p < 0.05), and the landraces Dea and Hatif de Grignon had the highest Vcmax (92.2 and 78.5 μmol m−2 s−1 mol−1) compared to Golden Archer and Eire 6-Row (53.3 and 42.6 μmol m−2 s−1 mol−1). It was a similar pattern for Jmax, where there was also a significant effect of variety (F(4, 37) = 9.62, p < 0.05), and once again, Dea and Hatif de Grignon had higher rates of electron transport (142.9 and 116.2 μmol m−2 s−1, respectively) than either Golden Archer or Eire 6-Row (75.9 and 71.6 μmol m−2 s−1, respectively). There was also a close correlation between Vcmax and Asat overall (σ = 0.41, p < 0.05) and between Jmax and Asat (σ = 0.93, p < 0.05).

4. Discussion

The aim of this study was to assess the extent of natural variation in anatomical and physiological characteristics among a diverse range of barleys. Despite many decades of breeding for yield [54,55], we did not fully confirm our expectation that the elite varieties (KWS Orwell, KWS Sassy and KWS Irina) would have higher assimilation rates and gs and faster gs kinetic responses to changes in light intensity leading to greater growth relative to landraces and wild barleys (Figure 1, Figure 2 and Figure 4) as shown for the elite wheat [38].
Previous research examining variation in stomatal anatomy has suggested a trade-off between stomatal size and stomatal density [17,31,56,57], with species displaying higher stomatal density usually having smaller stomata, while lower stomatal density coincides with larger stomata. This relationship has been shown to hold in closely related species [17,56] and different environments [57], although this has not always been demonstrated across diverse species [39,58]. Our findings here do not support a relationship between stomatal density and size, and furthermore, we observed no relationship between anatomical characters and physiological responses (Figure 3, Supplemental Materials).
Previous studies have associated the speed of stomatal responses with the size of stomata, with smaller stomata facilitating rapid changes in pore area in a range of different species although the relationship may not be true of all species [17,34,39,43,44,56,57,59,60]. The majority of the above studies have focused on stomatal opening in response to environmental change, and the size-speed relationship has been queried by Elliott-Kingston et al. [60], who reported that the speed of closure was not related the stomatal length in a range of species including ferns, gymnosperms, monocots and eudicots. Crops such as barley have dumbbell-shaped stomata and it is well-established that such morphology promotes rapid stomatal responses compared with the more-common kidney-shaped anatomy [39,57,61,62,63].
Rapidity in stomatal behavior has gained considerable attention recently due to the potential for greater co-ordination between A and gs which would optimize gaseous exchange under dynamic environmental conditions [15,30,31,39,44]. Slow stomatal opening to increasing light intensity for example has been reported to limit A by ca. 10% [39] while slow closure during a shade fleck could decrease water use efficiency by 20% [31]. Even though the mechanisms behind the rapidity of stomatal movements are still to be fully elucidated [31,34,56,63,64,65], studies that have successfully manipulated the speed of stomatal response have resulted in improved CO2 uptake and/or water use efficiency [63], and therefore this represents an unexploited opportunity to finding novel genetic traits for future breeding programs [55]. Recently Salter et al. [66] identified QTLs for dynamic photosynthesis in barley, with novel QTLs for stomatal conductance described, illustrating the potential of such an approach.
Here we demonstrate significant variation in the time constants for increases in gs (τgs) in response to a step change in light intensity, as well as overall steady state gs values, although no relationship between the two was found (Figure 2). Both the kinetic responses and light response curves demonstrate a clear correlation between A and gs (Figure 1 and Figure 2, Supplemental Materials), with high gs values correlated with A, supporting the close relationship between A and gs [54]. Although dynamic responses are clearly important and have implications for the rates of gs and A realized in the field, photosynthetic capacity (which provides an indication of maximum potential A) can also demonstrate significant variation between crop cultivar [67,68] and has been correlated with yield [68]. Here we measured photosynthesis as a function of light intensity to assess variation in light use efficiency between cultivars, while photosynthesis as a function of Ci permits the biochemistry of Rubisco and the Calvin cycle to be evaluated. As expected both curves showed a hyperbolic response (Figure 5A and Figure 6A). However it is clear that Dea and Hatif de Grignon, both landraces, showed considerably higher rates of photosynthesis compared to the three other cultivars, including an elite line, which grouped together at lower rates. Between cultivars we also found significant variation in light-saturated rate of photosynthesis (Asat), quantum efficiency (QE), maximum rate of carboxylation (Vc max) and maximum electron transport (Jmax) rates determined from light and CO2 response curves (Figure 5 and Figure 6). Interestingly, the greatest values in the above parameters were observed in the landraces Dea and Hatif de Grignon, while the elite cultivars grouped together at lower values.
McAusland et al. [69] report significant differences in photosynthetic rates and potential in wild relatives of modern wheat and suggested that this represents an underutilized source of genetic and phenotypic diversity, while the same is also true for landraces and older elite varieties [38,67] that have yet to be evaluated. The greater QE observed in Dea and Hatif (Figure 5) suggests a greater efficiency in use of absorbed light in CO2 fixation, as well as enhanced carboxylation capacity of Rubisco. This superior physiological performance could be due to underlying biochemistry [70], as well as anatomical differences or modifications in diffusional constraints. Irrespective of the mechanism they represent an unexploited pool of potential genetic targets for increasing photosynthetic capacity and efficiency even if the evidence for yield enhancement is as yet unproven.
A couple of caveats accompany the findings presented here. The ambient temperature in the polytunnel was somewhat variable, with a mean of 26.6 °C +/− 1.1 °C and a peak of 44 °C during the time gas exchange measurements were being taken (15–17 June 2016) while RH was also variable through the day (44.2% +/− 2.6%). Such stress is known to affect yield negatively in cereals [71] with adverse impacts of high temperatures not just during stem elongation, but also during booting and heading [72]. All cultivars would be affected by extreme temperatures, but we would expect that landraces bred for cool, moist climates such as Eire 6-Row would be affected more than other cultivars [73].
There was also the lack of additional N application in this study, which in modern varieties appears deleterious [74,75]. However, not providing additional N provided us with the opportunity to explore physiological variation and interesting traits in wild barleys and landraces that could be masked if modern N application rates were used. We have shown in the absence of a substantial push from N fertilizers, landraces can deliver very creditable yields that are in line with those seen in some elite cultivars (Figure 3).
Therefore the physiological and biochemical traits identified above offer the breeder interesting avenues to explore in the search for new germplasm [76,77]. Tiller numbers are known to be relatively invariant under selection, so finding a similarity across varieties may have been expected [52,78]. However, the strong yield performance of the landrace Golden Archer in relation to the elite cv KWS Orwell should be of real interest.
Furthermore, the contrast in light and Ci responses and in stomatal density between the two landraces Golden Archer and Hatif de Grignon is a trade-off in anatomy and physiology that warrants further investigation, particularly since similar contrasts were consistently observed in the light and Ci responses in the other landraces, Dea and Eire 6-Row.
Varieties which tend not to conserve water also deliver higher yields through improved temperature control, particularly around the mid-day canopy temperature peak [20,54,79]. Such non-conservative varieties of barley should have slower kinetic responses delivering larger yields which was broadly confirmed here [80]. Hatif de Grignon and Golden Archer had relatively higher time constants for opening stomata suggesting a non-conservative phenotype compared to the elite cultivars, while yields in the former tended to be lower than KWS Sassy, but at a level similar to KWS Orwell.
We might have expected the Central European landrace Dea and the Southern European Hatif de Grignon [80,81,82] to be optimized for higher WUEi based on a need to conserve water compared to Golden Archer and Eire 6-Row which are typically found in the wetter British Isles [80]. As climactic conditions faced by UK and other farmers force changes in varietal selection [83], the results presented above point to candidates for breeding programs under a wide variety of possible environmental conditions.
In our study, high photosynthetic capacity did not translate directly into yield, with the elite varieties outperforming the landraces and wild relatives in terms of tillers, biomass and grain mass [67]. However, the increase in performance was not as high as might have been expected. Yields for elite crop cultivars have clearly improved recent decades [4]. However, in the absence of additional N, as in this study, yield performance by the elite varieties varied and therefore the higher photosynthetic capacity from some of the landraces could potentially be beneficial in the future or in certain regions when inputs may become limited. While high photosynthetic capacity does not always translate into increased yield [67], it does provide an opportunity to breed for specific traits that could be extremely beneficial in future crop breeding programme [68], that will require the identification of new traits to produce crops with greater resilience or the ability to grow in certain regions or under different climate scenarios.

5. Conclusions

The results presented here offer opportunities for breeders to identify and include additional genetic material to improve diversity and reduce bottlenecks to yield improvement but that opportunity surprisingly may not occur through directly trading off stomatal size and density. The evidence in this study suggests that even relatively modern landraces have many features of interest including rapid stomatal kinetics and increased photosynthetic capacity. These are features that could be exploited for the improvement of elite lines through enhanced physiology, as agronomists increasingly tune varietal performance to regional environmental requirements.

Supplementary Materials

The following are available online at https://www.mdpi.com/article/10.3390/agronomy11050921/s1.

Author Contributions

Conceptualization, J.S., M.A.J. and T.L.; methodology, J.S., M.A.J. and T.L.; software, J.S.; formal analysis, J.S.; investigation, J.S.; writing—original draft preparation, J.S. and T.L.; review and editing, J.S., M.A.J. and T.L.; supervision, J.S. and T.L.; funding acquisition, J.S., M.A.J. and T.L. All authors have read and agreed to the published version of the manuscript.

Funding

J.S. was funded by The Perry Foundation and the University of Essex, School of Life Sciences. T.L. was supported through Biotechnology and Biological Sciences Research Council grants BB/1001187/1 and BB/N021061/1 and by the Global Challenges Research Fund as part of TIGR2ESS: Transforming India’s Green Revolution by Research and Empowerment for Sustainable food Supplies (BB/P027970/). M.A.J. was supported through the Biotechnology and Biological Sciences Research Council grant BB/S005404/1. The APC was funded by the UKRI open access block grant awarded to the University of Essex for 2021–2022.

Institutional Review Board Statement

Not applicable.

Informed Consent Statement

Not applicable.

Data Availability Statement

The datasets used or analyzed during the current study, as well as the materials used, are available from the corresponding author on reasonable request.

Acknowledgments

The authors would like to thank KWS UK Ltd. for supply of materials, trials site and practical support. Phillip Davey and John Stamford kindly assisted with the data collection. Silvere Vialet-Chabrand helped with the data modelling.

Conflicts of Interest

The authors declare no conflict of interest.

References

  1. IPCC. Climate Change 2014: Synthesis Report. Contribution of Working Groups I, II and III to the Fifth Assessment Report of the Intergovernmental Panel on Climate Change; Team, C.W., Pachauri, R.K., Meyer, L.A., Eds.; IPCC: Geneva, Switzerland, 2014. [Google Scholar]
  2. UN Enviroment Programme; UNEO DTU Partnership. Emissions Gap Report; UNEP: Nairobi, Kenya, 2020; Available online: https://www.unep.org/emissions-gap-report-2020 (accessed on 21 April 2021).
  3. McGuire, S. WHO, World Food Programme, and International Fund for Agricultural Development. 2012. The State of Food Insecurity in the World 2012. Economic growth is necessary but not sufficient to accelerate reduction of hunger and malnutrition. Rome, FAO. Adv. Nutr. 2013, 4, 126–127. [Google Scholar] [CrossRef] [PubMed] [Green Version]
  4. Ray, D.K.; Mueller, N.D.; West, P.C.; Foley, J.A. Yield Trends Are Insufficient to Double Global Crop Production by 2050. PLoS ONE 2013, 8. [Google Scholar] [CrossRef] [PubMed] [Green Version]
  5. Amin, S.; Bongaarts, J.; McNicoll, G.; Todaro, M.P. 2006 state of the future. Popul. Dev. Rev. 2006, 32, 787. [Google Scholar]
  6. Jones, B.G.; Kandel, W.A. Population-growth, urbanization, and disaster risk and vulnerability in metropolitan areas—A conceptual framework. Environ. Manag. Urban Vulnerabil. 1992, 168, 51–76. [Google Scholar]
  7. Maclean, J.; Hardy, B.; Hettel, G. Rice Almanac: Source Book for One of the Most Important Economic Activities on Earth, 4th ed.; International Rice Research Institute (IRRI): Los Banos, Phillipines, 2013. [Google Scholar]
  8. Hatfield, J.L.; Prueger, J.H. Temperature extremes: Effect on plant growth and development. Weather Clim. Extrem. 2015, 10, 4–10. [Google Scholar] [CrossRef] [Green Version]
  9. Ainsworth, E.A.; Rogers, A. The response of photosynthesis and stomatal conductance to rising CO2: Mechanisms and environmental interactions. Plant Cell Environ. 2007, 30, 258–270. [Google Scholar] [CrossRef]
  10. Sage, R.F.; Sharkey, T.D. The effect of temperature on the occurrence of O2 and CO2 insensitive photosynthesis in field-grown plants. Plant Physiol. 1987, 84, 658–664. [Google Scholar] [CrossRef] [Green Version]
  11. Urban, J.; Ingwers, M.; McGuire, M.A.; Teskey, R.O. Stomatal conductance increases with rising temperature. Plant Signal. Behav. 2017, 12. [Google Scholar] [CrossRef] [Green Version]
  12. Merilo, E.; Yarmolinsky, D.; Jalakas, P.; Parik, H.; Tulva, I.; Rasulov, B.; Kilk, K.; Kollist, H. Stomatal VPD Response: There Is More to the Story Than ABA. Plant Physiol. 2018, 176, 851–864. [Google Scholar] [CrossRef] [Green Version]
  13. FAO. Towards a Water and Food Secure Future; FAO Natural Resources and Environment Department: Rome, Italy, 2015; p. 76. [Google Scholar]
  14. Aasamaa, K.; Sober, A.; Rahi, M. Leaf anatomical characteristics associated with shoot hydraulic conductance, stomatal conductance and stomatal sensitivity to changes of leaf water status in temperate deciduous trees. Aust. J. Plant Physiol. 2001, 28, 765–774. [Google Scholar] [CrossRef]
  15. Farquhar, G.D.; Sharkey, T.D. Stomatal conductance and photosynthesis. Ann. Rev. Plant Physiol. Plant Mol. Biol. 1982, 33, 317–345. [Google Scholar] [CrossRef]
  16. Vogel, E.; Donat, M.G.; Alexander, L.V.; Meinshausen, M.; Ray, D.K.; Karoly, D.; Meinshausen, N.; Frieler, K. The effects of climate extremes on global agricultural yields. Environ. Res. Lett. 2019, 14. [Google Scholar] [CrossRef]
  17. Hetherington, A.M.; Woodward, F.I. The role of stomata in sensing and driving environmental change. Nature 2003, 424, 901–908. [Google Scholar] [CrossRef] [PubMed]
  18. Woodward, F.I. Stomatal Numbers are sensitive to increases in CO2 from preindustrial levels. Nature 1987, 327, 617–618. [Google Scholar] [CrossRef]
  19. Condon, A.G.; Richards, R.A.; Rebetzke, G.J.; Farquhar, G.D. Improving intrinsic water-use efficiency and crop yield. Crop Sci. 2002, 42, 122–131. [Google Scholar] [CrossRef]
  20. Caine, R.S.; Yin, X.J.; Sloan, J.; Harrison, E.L.; Mohammed, U.; Fulton, T.; Biswal, A.K.; Dionora, J.; Chater, C.C.; Coe, R.A.; et al. Rice with reduced stomatal density conserves water and has improved drought tolerance under future climate conditions. New Phytol. 2019, 221, 371–384. [Google Scholar] [CrossRef]
  21. Hughes, J.; Hepworth, C.; Dutton, C.; Dunn, J.A.; Hunt, L.; Stephens, J.; Waugh, R.; Cameron, D.D.; Gray, J.E. Reducing Stomatal Density in Barley Improves Drought Tolerance without Impacting on Yield. Plant Physiol. 2017, 174, 776–787. [Google Scholar] [CrossRef] [Green Version]
  22. Murchie, E.H.; Ruban, A.V. Dynamic non-photochemical quenching in plants: From molecular mechanism to productivity. Plant J. 2020, 101, 885–896. [Google Scholar] [CrossRef] [Green Version]
  23. Hubbart, S.; Smillie, I.R.A.; Heatley, M.; Swarup, R.; Foo, C.C.; Zhao, L.; Murchie, E.H. Enhanced thylakoid photoprotection can increase yield and canopy radiation use efficiency in rice. Commun. Biol. 2018, 1. [Google Scholar] [CrossRef] [PubMed] [Green Version]
  24. Lopez-Calcagno, P.E.; Brown, K.L.; Simkin, A.J.; Fisk, S.J.; Vialet-Chabrand, S.; Lawson, T.; Raines, C.A. Stimulating photosynthetic processes increases productivity and water-use efficiency in the field. Nat. Plants 2020, 6, 1054. [Google Scholar] [CrossRef]
  25. Condon, A.G.; Richards, R.A.; Rebetzke, G.J.; Farquhar, G.D. Breeding for high water-use efficiency. J. Exp. Bot. 2004, 55, 2447–2460. [Google Scholar] [CrossRef] [PubMed] [Green Version]
  26. Wong, S.C.; Cowan, I.R.; Farquhar, G.D. Stomatal conductance correlates with photosynthetic capacity. Nature 1979, 282, 424–426. [Google Scholar] [CrossRef]
  27. Guan, X.K.; Song, L.; Wang, T.C.; Turner, N.C.; Li, F.M. Effect of Drought on the Gas Exchange, Chlorophyll Fluorescence and Yield of Six Different-Era Spring Wheat Cultivars. J. Agron. Crop Sci. 2015, 201, 253–266. [Google Scholar] [CrossRef]
  28. Kromdijk, J.; Glowacka, K.; Leonelli, L.; Gabilly, S.T.; Iwai, M.; Niyogi, K.K.; Long, S.P. Improving photosynthesis and crop productivity by accelerating recovery from photoprotection. Science 2016, 354, 857–861. [Google Scholar] [CrossRef] [Green Version]
  29. Vialet-Chabrand, S.; Matthews, J.S.A.; Brendel, O.; Blatt, M.R.; Wang, Y.; Hills, A.; Griffiths, H.; Rogers, S.; Lawson, T. Modelling water use efficiency in a dynamic environment: An example using Arabidopsis thaliana. Plant Sci. 2016, 251, 65–74. [Google Scholar] [CrossRef] [PubMed]
  30. Lawson, T.; von Caemmerer, S.; Baroli, I. Photosynthesis and stomatal behaviour. In Progress in Botany; Springer: Berlin/Heidelberg, Germany, 2010; Volume 72, pp. 265–304. [Google Scholar]
  31. Lawson, T.; Blatt, M.R. Stomatal Size, Speed, and Responsiveness Impact on Photosynthesis and Water Use Efficiency. Plant Physiol. 2014, 164, 1556–1570. [Google Scholar] [CrossRef] [PubMed] [Green Version]
  32. Ng, P.A.P.; Jarvis, P.G. Hysteresis in the response of stomatal conductance in Pinus sylvestris L needles to light: Observations and a hypothesis. Plant Cell Environ. 1980, 3, 207–216. [Google Scholar]
  33. Whitehead, D.; Teskey, R.O. Dynamic response of stomata to changing irradiance in loblolly pine (Pinus taeda L.). Tree Physiol. 1995, 15, 245–251. [Google Scholar] [CrossRef]
  34. Franks, P.J.; Farquhar, G.D. The mechanical diversity of stomata and its significance in gas-exchange control. Plant Physiol. 2007, 143, 78–87. [Google Scholar] [CrossRef] [Green Version]
  35. Graf, A.; Schlereth, A.; Stitt, M.; Smith, A.M. Circadian control of carbohydrate availability for growth in Arabidopsis plants at night. Proc. Natl. Acad. Sci. USA 2010, 107, 9458–9463. [Google Scholar] [CrossRef] [Green Version]
  36. Haydon, M.J.; Mielczarek, O.; Robertson, F.C.; Hubbard, K.E.; Webb, A.A.R. Photosynthetic entrainment of the Arabidopsis thaliana circadian clock. Nature 2013, 502, 689. [Google Scholar] [CrossRef]
  37. Lehmann, P.; Or, D. Effects of stomata clustering on leaf gas exchange. New Phytol. 2015, 207, 1015–1025. [Google Scholar] [CrossRef] [PubMed]
  38. Faralli, M.; Matthews, J.; Lawson, T. Exploiting natural variation and genetic manipulation of stomatal conductance for crop improvement. Curr. Opin. Plant Biol. 2019, 49, 1–7. [Google Scholar] [CrossRef] [PubMed]
  39. McAusland, L.; Vialet-Chabrand, S.; Davey, P.; Baker, N.R.; Brendel, O.; Lawson, T. Effects of kinetics of light-induced stomatal responses on photosynthesis and water-use efficiency. New Phytol. 2016, 211, 1209–1220. [Google Scholar] [CrossRef]
  40. Kumar, U.; Quick, W.P.; Barrios, M.; Cruz, P.C.S.; Dingkuhn, M. Atmospheric CO2 concentration effects on rice water use and biomass production. PLoS ONE 2017, 12, e0169706. [Google Scholar] [CrossRef] [Green Version]
  41. Munns, R.; James, R.A.; Sirault, X.R.R.; Furbank, R.T.; Jones, H.G. New phenotyping methods for screening wheat and barley for beneficial responses to water deficit. J. Exp. Bot. 2010, 61, 3499–3507. [Google Scholar] [CrossRef] [PubMed] [Green Version]
  42. Qu, M.N.; Hamdani, S.; Li, W.Z.; Wang, S.M.; Tang, J.Y.; Chen, Z.; Song, Q.F.; Li, M.; Zhao, H.L.; Chang, T.G.; et al. Rapid stomatal response to fluctuating light: An under-explored mechanism to improve drought tolerance in rice. Funct. Plant Biol. 2016, 43, 727–738. [Google Scholar] [CrossRef] [Green Version]
  43. Raven, J.A. Speedy small stomata? J. Exp. Bot. 2014, 65, 1415–1424. [Google Scholar] [CrossRef] [Green Version]
  44. Lawson, T.; Vialet-Chabrand, S. Speedy stomata, photosynthesis and plant water use efficiency. New Phytol. 2019, 221, 93–98. [Google Scholar] [CrossRef] [Green Version]
  45. Garmash, E. Temperature Controls a Dependence of Barley Plant Growth on Mineral Nutrition Level. Russ. J. Plant Physiol. 2005, 52, 338–344. [Google Scholar] [CrossRef]
  46. Michaelis, L.; Menten, M.L. Die kinetik der invertinwirkung. J. Biochem. Z 1913, 49, 352. [Google Scholar]
  47. Duursma, R.A. Plantecophys—An R Package for Analysing and Modelling Leaf Gas Exchange Data. PLoS ONE 2015, 10. [Google Scholar] [CrossRef]
  48. Vialet-Chabrand, S.; Dreyer, E.; Brendel, O. Performance of a new dynamic model for predicting diurnal time courses of stomatal conductance at the leaf level. Plant Cell Environ. 2013, 36, 1529–1546. [Google Scholar] [CrossRef]
  49. Weyers, J.; Johansen, L. Accurate estimation of stomatal aperture from silicone rubber impressions. New Phytol. 1985, 101, 109–115. [Google Scholar] [CrossRef] [PubMed]
  50. Van de Wouw, M.; van Hintum, T.; Kik, C.; van Treuren, R.; Visser, B. Genetic diversity trends in twentieth century crop cultivars: A meta analysis. Theor. Appl. Genet. 2010, 120, 1241–1252. [Google Scholar] [CrossRef] [PubMed] [Green Version]
  51. Evenson, R.E.; Gollin, D. Assessing the impact of the Green Revolution, 1960 to 2000. Science 2003, 300, 758–762. [Google Scholar] [CrossRef] [PubMed] [Green Version]
  52. AHDB. Barley Growth Guide. Available online: http://cereals.ahdb.org.uk/media/186381/g67-barley-growth-guide.pdf (accessed on 24 May 2019).
  53. R Core Team. R: A Language and Environment for Statistical Computing. Available online: https://www.R-project.org/ (accessed on 2 August 2019).
  54. Fischer, R.A.; Rees, D.; Sayre, K.D.; Lu, Z.M.; Condon, A.G.; Saavedra, A.L. Wheat yield progress associated with higher stomatal conductance and photosynthetic rate, and cooler canopies. Crop Sci. 1998, 38, 1467–1475. [Google Scholar] [CrossRef]
  55. Faralli, M.; Cockram, J.; Ober, E.; Wall, S.; Galle, A.; Van Rie, J.; Raines, C.; Lawson, T. Genotypic, Developmental and Environmental Effects on the Rapidity of g(s) in Wheat: Impacts on Carbon Gain and Water-Use Efficiency. Front. Plant Sci. 2019, 10. [Google Scholar] [CrossRef] [Green Version]
  56. Franks, P.J.; Beerling, D.J. Maximum leaf conductance driven by CO2 effects on stomatal size and density over geologic time. Proc. Natl. Acad. Sci. USA 2009, 106, 10343–10347. [Google Scholar] [CrossRef] [Green Version]
  57. Drake, P.L.; Froend, R.H.; Franks, P.J. Smaller, faster stomata: Scaling of stomatal size, rate of response, and stomatal conductance. J. Exp. Bot. 2013, 64, 495–505. [Google Scholar] [CrossRef] [Green Version]
  58. McElwain, J.C. Climate-independent paleoaltimetry using stomatal density in fossil leaves as a proxy for CO2 partial pressure. Geology 2004, 32, 1017–1020. [Google Scholar] [CrossRef] [Green Version]
  59. Elliott-Kingston, C.; Haworth, M.; Yearsley, J.M.; Batke, S.P.; Lawson, T.; McElwain, J.C. Does Size Matter? Atmospheric CO2 May Be a Stronger Driver of Stomatal Closing Rate Than Stomatal Size in Taxa That Diversified under Low CO2. Front. Plant Sci. 2016, 7. [Google Scholar] [CrossRef] [PubMed] [Green Version]
  60. Kardiman, R.; Raebild, A. Relationship between stomatal density. size and speed of opening in Sumatran rainforest species. Tree Physiol. 2018, 38, 696–705. [Google Scholar] [CrossRef] [PubMed]
  61. Chen, Z.H.; Chen, G.; Dai, F.; Wang, Y.Z.; Hills, A.; Ruan, Y.L.; Zhang, G.P.; Franks, P.J.; Nevo, E.; Blatt, M.R. Molecular Evolution of Grass Stomata. Trends Plant Sci. 2017, 22, 124–139. [Google Scholar] [CrossRef] [PubMed]
  62. Harrison, E.L.; Arce Cubas, L.; Gray, J.E.; Hepworth, C. The influence of stomatal morphology and distribution on photosynthetic gas exchange. Plant J. 2020, 101, 768–779. [Google Scholar] [CrossRef] [Green Version]
  63. Perera-Castro, A.V.; Nadal, M.; Flexas, J. What drives photosynthesis during desiccation? Mosses and other outliers from the photosynthesis-elasticity trade-off. J. Exp. Bot. 2020, 71, 6460–6470. [Google Scholar] [CrossRef]
  64. Lawson, T.; Matthews, J. Guard Cell Metabolism and Stomatal Function. Ann. Rev. Plant Biol. 2020, 71, 273–302. [Google Scholar] [CrossRef] [PubMed] [Green Version]
  65. Papanatsiou, M.; Petersen, J.; Henderson, L.; Wang, Y.; Christie, J.M.; Blatt, M.R. Optogenetic manipulation of stomatal kinetics improves carbon assimilation, water use, and growth. Science 2019, 363, 1456–1459. [Google Scholar] [CrossRef] [Green Version]
  66. Salter, W.T.; Li, S.; Dracatos, P.M.; Barbour, M.M. Identification of quantitative trait loci for dynamic and steady-state photosynthetic traits in a barley mapping population. AoB Plants 2020, 12. [Google Scholar] [CrossRef]
  67. Driever, S.M.; Lawson, T.; Andralojc, P.J.; Raines, C.A.; Parry, M.A.J. Natural variation in photosynthetic capacity, growth, and yield in 64 field-grown wheat genotypes. J. Exp. Bot. 2014, 65, 4959–4973. [Google Scholar] [CrossRef] [Green Version]
  68. Carmo-Silva, E.; Andralojc, P.J.; Scales, J.C.; Driever, S.M.; Mead, A.; Lawson, T.; Raines, C.A.; Parry, M.A.J. Phenotyping of field-grown wheat in the UK highlights contribution of light response of photosynthesis and flag leaf longevity to grain yield. J. Exp. Bot. 2017, 68, 3473–3486. [Google Scholar] [CrossRef]
  69. McAusland, L.; Vialet-Chabrand, S.; Jauregui, I.; Burridge, A.; Hubbart-Edwards, S.; Fryer, M.J.; King, I.P.; King, J.; Pyke, K.; Edwards, K.J.; et al. Variation in key leaf photosynthetic traits across wheat wild relatives is accession dependent not species dependent. New Phytol. 2020, 228, 1767–1780. [Google Scholar] [CrossRef] [PubMed]
  70. Lawson, T.; Kramer, D.M.; Raines, C.A. Improving yield by exploiting mechanisms underlying natural variation of photosynthesis. Curr. Opin. Biotechnol. 2012, 23, 215–220. [Google Scholar] [CrossRef] [PubMed]
  71. Bezant, J.; Laurie, D.; Pratchett, N.; Chojecki, J.; Kearsey, M. Mapping QTL controlling yield and yield components in a spring barley (Hordeum vulgare L) cross using marker regression. Mol. Breed. 1997, 3, 29–38. [Google Scholar] [CrossRef]
  72. Bidinger, F.; Musgrave, R.B.; Fischer, R.A. Contribution of stored pre-anthesis assimilate to grain yield in wheat and barley. Nature 1977, 270, 431–433. [Google Scholar] [CrossRef] [Green Version]
  73. Ugarte, C.; Calderini, D.F.; Slafer, G.A. Grain weight and grain number responsiveness to pre-anthesis temperature in wheat, barley and triticale. Field Crops Res. 2007, 100, 240–248. [Google Scholar] [CrossRef]
  74. Sylvester-Bradley, R.; Kindred, D.R. Analysing nitrogen responses of cereals to prioritize routes to the improvement of nitrogen use efficiency. J. Exp. Bot. 2009, 60, 1939–1951. [Google Scholar] [CrossRef] [Green Version]
  75. Bingham, I.J.; Karley, A.J.; White, P.J.; Thomas, W.T.B.; Russell, J.R. Analysis of improvements in nitrogen use efficiency associated with 75 years of spring barley breeding. Eur. J. Agron. 2012, 42, 49–58. [Google Scholar] [CrossRef]
  76. Wang, C.L.; Hu, S.L.; Gardner, C.; Lubberstedt, T. Emerging Avenues for Utilization of Exotic Germplasm. Trends Plant Sci. 2017, 22, 624–637. [Google Scholar] [CrossRef] [Green Version]
  77. Russell, J.R.; Fuller, J.D.; Macaulay, M.; Hatz, B.G.; Jahoor, A.; Powell, W.; Waugh, R. Direct comparison of levels of genetic variation among barley accessions detected by RFLPs, AFLPs, SSRs and RAPDs. Theor. Appl. Genet. 1997, 95, 714–722. [Google Scholar] [CrossRef]
  78. Sadras, V.O.; Slafer, G.A. Environmental modulation of yield components in cereals: Heritabilities reveal a hierarchy of phenotypic plasticities. Field Crops Res. 2012, 127, 215–224. [Google Scholar] [CrossRef]
  79. Chapin, F.S. The mineral nutrition of wild plants. Ann. Rev. Ecol. Syst. 1980, 11, 233–260. [Google Scholar] [CrossRef]
  80. GRU. John Innes Centre Germplasm Resources Unit SeedStor Database. Available online: https://www.seedstor.ac.uk/ (accessed on 28 June 2019).
  81. Rode, J.; Ahlemeyer, J.; Friedt, W.; Ordon, F. Identification of marker-trait associations in the German winter barley breeding gene pool (Hordeum vulgare L.). Mol. Breed. 2012, 30, 831–843. [Google Scholar] [CrossRef]
  82. Molina-Cano, J.; Fra-Mon, P.; Salcedo, G.; Aragoncillo, C.; De Togores, F.R.; García-Olmedo, F. Morocco as a possible domestication center for barley: Biochemical and agromorphological evidence. Theor. Appl. Genet. 1987, 73, 531–536. [Google Scholar] [CrossRef] [PubMed] [Green Version]
  83. Atlin, G.N.; Cairns, J.E.; Das, B. Rapid breeding and varietal replacement are critical to adaptation of cropping systems in the developing world to climate change. Glob. Food Secur.-Agric. Policy Econ. Environ. 2017, 12, 31–37. [Google Scholar] [CrossRef] [PubMed]
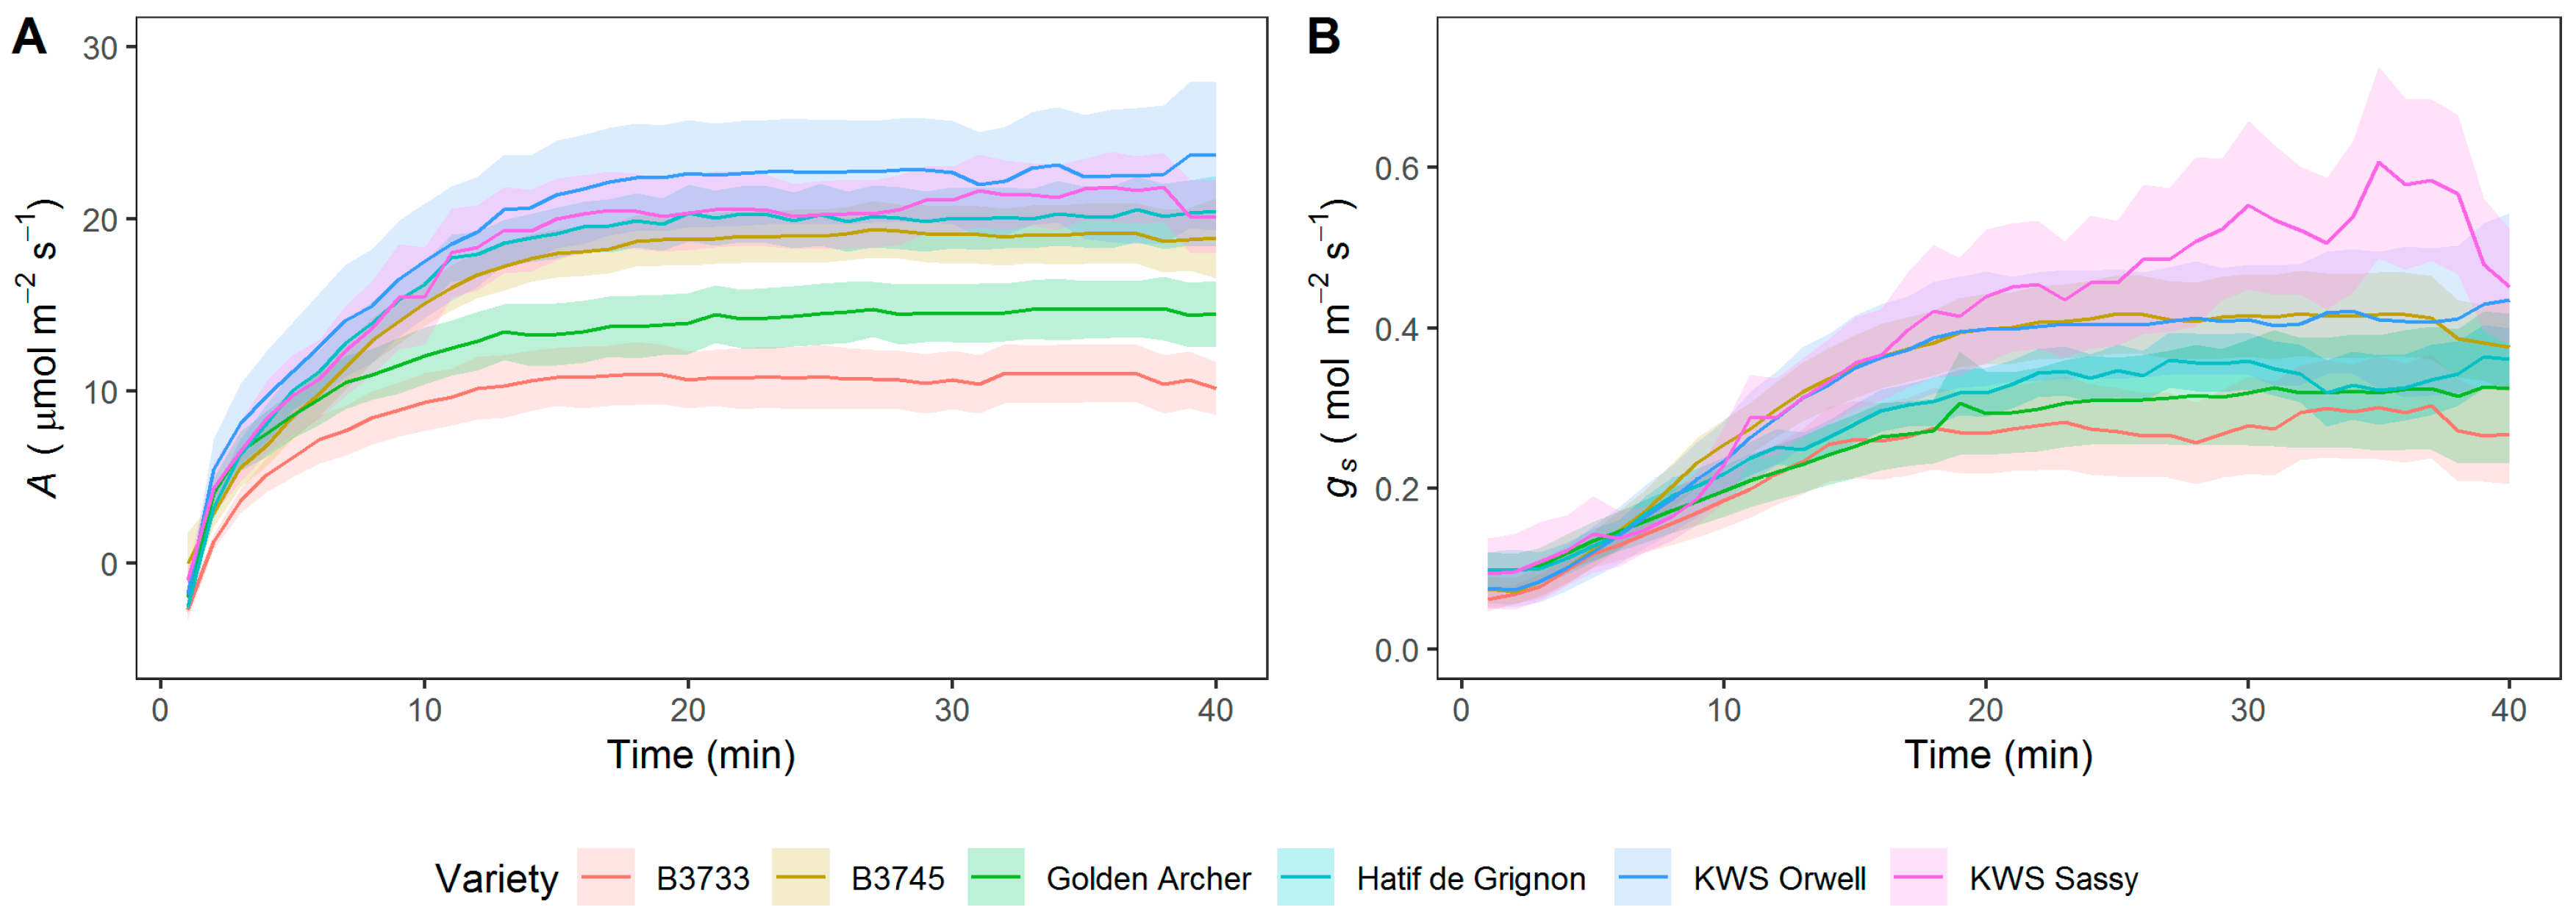
Figure 1. Step changes from low to high light intensity (0 to 1000 µmol m−2 s−1 PPFD) for a selection of 6 polytunnel-grown barley varieties: 2 wild barleys (B3733 and B3745), 2 landraces (Golden Archer and Hatif de Grignon) and 2 elite cultivars (KWS Orwell and KWS Sassy), data shown start at t = 2 min after the initiation of high light intensity, to reduce noise. (A) Assimilation. (B) Stomatal conductance. Means shown +/− se, N = 5–6 for each variety.
Agronomy 11 00921 g001
Figure 2. Kinetic parameters modelled according to the method in Vialet-Chabrand et al [48] from step changes light shown in Figure 1 for the wild barleys B3733 and B3745, the landraces Golden Archer and Hatif de Grignon, and the elite cultivars KWS Orwell and KWS Sassy. Left-hand side— assimilation parameters, right-hand side— stomatal conductance. (A) Maximal rate of A achieved at 1000 μmol m−2 s−1 PPFD during the test. (C) Time constant for assimilation to increase by 63%. (E) Maximal rate of change of response of A to increasing light. (B) Maximal rate of gs achieved at 1000 μmol m−2 s−1 PPFD during the test. (D) Time constant for stomatal conductance to increase by 63%. (F) Maximal rate of change of response of gs to increasing light. N = 5–6, box and whisker plots with means shown as white dots. Identical letters show no significant differences between means based on Tukey’s test of model outputs at p = 0.05.
Agronomy 11 00921 g002
Figure 3. Stomatal anatomy of 6 select barley cultivars: the wild barleys B3733 and B3745, the landraces Golden Archer and Hatif de Grignon and the elite cultivars KWS Orwell and KWS Sassy acquired at the same time and from the same plants as gas exchange data. (A) Stomatal density. (B) Stomatal Pore length. (C) Comparison of stomatal pore length to stomatal density. No correlation was found between the two even if the effect of cultivar was considered. Means shown as white dots in box and whisker plots in panels A and B, N = 5–6. Identical letters denote no significant differences between means based on Tukey’s test of model outputs at p = 0.05.
Agronomy 11 00921 g003
Figure 4. Harvest at maturity (162 days after sowing) of 6 barley cultivars (the wild barleys B3733 and B3745, the landraces Golden Archer and Hatif de Grignon and the elite cv’s KWS Orwell and KWS Sassy) grown in a polytunnel; (A) Total above-ground biomass plant−1. (B) Tiller number plant−1. (C) Number of ears plant−1. (D) Number of grains ear−1. (E) Thousand Grain Weight plant−1. (F) Grain mass plant−1. (G) Harvest Index (=Grain mass/Total biomass). (H) Non-fertile tillers as a percentage of all tillers. Data shown as box and whisker plot, means as white points, N = 5–6, Identical letters indicate no significant differences between means based on Tukey’s test of model outputs at p = 0.05.
Agronomy 11 00921 g004
Figure 5. The assimilation response of 5 barley cultivars (the landraces Dea, Eire 6-Row, Golden Archer and Hatif de Grignon and the elite line KWS Irina) to changing light intensity (A-Q curves). Michaelis-Menten parameters were derived from A-Q curves. (A) Assimilation response to changing PPFD. Points and error bars reflect actual data, line derived from model. (B) Maximal value of assimilation based on model outputs at 1500 μmol m−2 s−1 PPFD. (C) Initial slope (quantum efficiency) of response to changing PPFD based on model outputs. Data shown are means +/− se in (A) and box-and-whisker plots in (B), (C), where white points are mean values. N = 5–6. Identical letters indicate no significant differences between means based on Tukey’s test of model outputs at p = 0.05.
Agronomy 11 00921 g005
Figure 6. Assimilation responses of 5 barley cultivars (the landraces Dea, Eire 6-Row, Golden Archer and Hatif de Grignon and the elite cultivar KWS Irina) to changing Ci. (A) A-Ci response curves for each cultivar to increasing Ci. (B) Vcmax, the maximum velocity of Rubisco for carboxylation. (C) Jmax, the maximum rate of electron transport demand for Ribulose 1,5 bisphosphate. Data shown in (A) are means +/− se, N = 5−6, and box and whisker plots in (B), (C), where white points indicate the mean. Identical letters indicate no significant differences between means based on Tukey’s test of model outputs at p = 0.05.
Agronomy 11 00921 g006
Table 1. List of elite, wild and landrace barleys, their key selection criteria, the experiments in which they were used and the source of the seed material. Selection criteria were the varietal type (wild, landrace or elite cultivars), the number of rows on the ear (2 or 6), the habit or vernalization requirement (winter or spring) and the typical end use of the variety (feed or malt). A Polytunnel and growth chamber were used to permit a degree of control over the environment in which the experiments were conducted.
VarietyTypeRowsHabitUsePoly-TunnelGrowth ChamberSource
B3733Wild2Winter- JIC GRU
B3745Wild2Winter- JIC GRU
DeaLandrace6WinterFeed JIC GRU
Eire-6-RowLandrace6SpringMalt KWS UK Ltd.
Golden ArcherLandrace2SpringMaltJIC GRU
Hatif de GrignonLandrace6WinterFeedJIC GRU
KWS IrinaElite2SpringFeed/Malt KWS UK Ltd.
KWS OrwellElite2WinterFeed KWS UK Ltd.
KWS SassyElite2SpringMalt KWS UK Ltd.
Publisher’s Note: MDPI stays neutral with regard to jurisdictional claims in published maps and institutional affiliations.