Article

Effect of the Degree of Soil Contamination with Heavy Metals on Their Mobility in the Soil Profile in a Microplot Experiment

by
Dorota Pikuła
1,* and
Wojciech Stępień
2
1
Institute of Soil Science and Plant Cultivation—State Research Institute in Puławy, Department of Plant Nutrition and Fertilization, Czartoryskich 8, 24-100 Puławy, Poland
2
Institute of Agriculture, Independent Department of Agricultural Chemistry, Warsaw University of Life Sciences—SGGW, Nowoursynowska 159, 02-776 Warsaw, Poland
*
Author to whom correspondence should be addressed.
Agronomy 2021, 11(5), 878; https://doi.org/10.3390/agronomy11050878
Submission received: 16 March 2021 / Revised: 26 April 2021 / Accepted: 27 April 2021 / Published: 29 April 2021
(This article belongs to the Special Issue Heavy Metal Pollution and Its Effects on Agriculture)

Abstract

:
Adjusting Polish law to EU standards, many studies were started in the 1990s on the harmfulness of presumably contaminating elements (PCE) to the environment and the quality of plants intended produced for food purposes. For this reason, in 1987, a unique microplate experiment was established on natural soils artificially contaminated with copper, zinc, lead and cadmium oxides (up to the pollution level of class I, II and III). The soils were diversified in terms of pH (through liming), organic matter content (through the addition of brown coal) and the grain size composition of the humus level (Ap) (strong clay sand and light silt clay). After 14 years from the introduction of different rates of metals into the top layer (0–30 cm) of the two soils studied, relatively large movement of heavy metals in the soil profile occurred. The amount of leached metals depended mainly on the rate of a given element. The more contaminated was the soil was, the heavier the metals that leached to lower genetic levels of soil. Contaminated soils always had a higher concentration of individual metals in Et than in Bt level. The content of the tested metals in the Et layer was determined in HCl (1 mol·dm−3) and compared to the humus level. Only at the soil depth below 50 cm (Bt), the content of the studied metals’ forms was much lower than in the surface levels. The calculated mobility coefficients of the tested metals determined in 1 M HCl indicate a larger movement of the tested metals in lighter soils than in medium soils. The highest displacement coefficients were obtained for cadmium, while the lowest were for lead. An increase in mobility was obtained alongside an increase in soil contamination with the heavy metals studied. By analyzing the mobility coefficients (heavy metal increase in the Bt and Et layers), they can be ranked in the following decreasing sequence: on light soils: Cd > Cu > Zn > Pb and on medium soils: Cd > Zn > Pb > Cu.

1. Introduction

Currently, one of the major threats to soil and plant quality is contamination by presumably contaminating elements (PCE), especially lead and cadmium. According to Kabata-Pendias [1], the balance of heavy metals in Europe is positive. Both cadmium and lead are elements belonging to the group of heavy metals with a very high risk to the environment [2,3] and feeds [4]. As indicated by Dziadek and Wacławek [5], the development of civilization and industrialization continues to cause increased pollution of soil with such heavy metals, which poses a threat to the quality of crops and the development of all living organisms [6,7]. In the case of some of PCE, the persistence in the soil is fairly immobile, but in some others, it would be more mobile. PCE reaches the soil mainly in the form of insoluble compounds. Then, they undergo different changes in the soil depending on their physical and chemical properties. The relocation of heavy metals in soil profiles is an important element of environmental monitoring, because even a slow migration of these elements in the profile may lead to the pollution of groundwater [8].
The solubility of PCE in the soil depends primarily on the reaction of the soil, the granulometric composition, the capacity of the soil composition and the content of organic matter in the soil.
The mobility of heavy metals in the soil environment depends on the form of their occurrence and the mechanisms of their fixing to organic and inorganic soil components [9]. The possibility of such contaminants spreading in the soil environment and penetrating into the soil solution poses a risk of heavy metals entering the groundwaters and food chain [10]. Organic matter has this ability. This substance forms simple or complex chelate compounds with heavy metals. They prevent the movement of PCE, immobilizing them in the soil. It should be stressed, however, that the fixing of heavy metals by soil humus is associated with the number of active fixation points of this medium. As far as humus substances are concerned, the exact nature of the fixation points is not known, and therefore, the determination of changes in solubility of metals in a specific soil environment under the influence of organic substances is a good indicator of the possibility of their uptake by plants. Due to the strong sorption properties of the soil, what is possible thanks the presence of the organic matter, heavy metals are to a large extent retained in its upper, humus layers. The greatest amounts of Cd and Pb are found in the 0–5 cm layer of soil. Decreasing the soil pH also affects the mobility of heavy metals, and an effect on their leaching takes place. The soil reaction also plays an important role, as it shows a strong effect on adsorption of heavy metals. For example, the precipitation of Pb in the form of carbonates and phosphates at pH > 6.5 is an important process for its immobilization in the arable soil layer. The soil texture factor contributes a positive role in the mobility of metals in the soil profile. The soil consists of minerals and fine particles such as oxides and clays. The soil texture reflects the particle size distribution. These particles of oxides and clays are most important and act as adsorption/biding surface for heavy metals in soils. The clay soil retains a high amount of metals compared to sandy soil. The mobility of metals can be controlled by the sorption process. Due to the mobile nature of the metals, certain problems would occur when they reach the ground water and when they will be taken up by the plants. Their persistence in soil also causes an accumulation of PCE in the food chain when they reach the maximum concentration in the environment [11]. Adjusting Polish law to EU standards, many studies were started in the 1990s on the harmfulness of PCE heavy metals to the environment and the quality of plants intended for food purposes. For this purpose, the factors influencing the mobility of heavy metals in basic soil species and the influence of various crop management techniques on metal uptake by basic plant species were investigated. Research was conducted on the influence of various factors on the leaching of heavy metals, which poses a risk of water pollution with these elements. Therefore, at the Department of Agricultural Chemistry of the Warsaw University of Life Sciences has undertaken the research to assess the impact of the different pH and organic matter content in the soil on the mobility of heavy metals. Additionally, which of the extraction methods (forms of heavy metals) in the best way describes the correlation between the content of a given element in the soil and its uptake by plants was assessed.
An additional objective of these studies was to assess the impact of various factors on the mobility of individual metals in the soil by determining the mobility coefficients in the conditions of crop management techniques, balanced mineral and organic fertilization and soil liming. For this purpose, in 1987, a unique microplot experiment was established on soils artificially contaminated with copper, zinc, lead and cadmium oxides (up to the pollution level of class I, II and III, according to the regulation of the Minister of the Environment). The soils were diversified in terms of pH (through liming), organic matter content (through the addition of brown coal) and the grain size composition of the humus level (Ap) (strong clay sand and light silt clay).
The paper assesses the influence of artificial contamination of soils with heavy metals of light and medium soils on the movement of heavy metals deep into the soil profile depending on selected physical and chemical properties.

2. Materials and Methods

2.1. Study Area Location

The experiment was carried out on microplots at the Experimental Station in Skierniewice (Poland) (Lat:51°58′ N; Long:20°10′ E), which belongs to the Faculty of Agriculture and Biology at the Warsaw University of Life Sciences under natural climatic conditions. The climate at the site is temperate with a mean annual rainfall for the years 1921–2020 at 536.1 mm, a mean annual temperature 8.1 °C and insolation 1714 h. This climate is considered as Dfb according to the Köppen-Geiger climate classification (warm humid continental climate).

2.2. Study Area

The experimental factors in the experiment were: two types of soil (light soil—loamy sand with 17% of particles < 0.02 mm and medium soil—light dusty clay with 25% of particles < 0.02 mm), three levels of Corg. concentration (6, 9 and 12 g C∙kg−1 of the soil), four levels of heavy metal contamination of soils Zn, Pb, Cd and Cu (natural content—0, increased content—I, weak contamination—II, medium contamination—III [12].
The microplots were supplied with vitrified clay pipes with diameter of 0.4 m and a height of 1.2. They were buried vertically in the soil, which in 1987, were filled with layers of Albic Luvisol soil (FAO, 1998): (1) ochric (Ap) 0–30 cm (the surface horizon that has been plowed or cultivated)—17% of particles < 0.02 mm; (2) luvic (Et) 30–50 cm (the subsurface horizon of eluvial loss of silt and clay)—13% of particles < 0.02 mm; (3) agric (Bt) below 50 cm (the subsurface horizon of illuvial accumulation of clay and humic substances)—25% of particles < 0.02 mm.
In 2004, the arable soil layer was removed from each pot to the depth of 30 cm. In half of the microplots, a soil material of strong clay sand composition was used, while in the second half, of light dusty clay. Appropriate amounts of calcium carbonate, lignite and heavy metals (Cd, Cu, Zn and Pb) were added to the 0–30 cm layer. As a result, soils representing 4 levels of contamination with 4 abovementioned heavy metals were obtained. Single doses of individual heavy metals per microplot (56 kg of soil) were: zinc—3.2 g in the form of ZnO, lead—28 g in the form of PbO, copper—1.3 g in the form of CuO and cadmium—35 mg in the form of CdSO4·H2O. In this way, research objects with different acidification levels (pH 4.2, 4.9, 5.9) were created, 3 levels of organic carbon (approx. 6, 9 and 12 g·kg−1), 2 levels of floating parts (17 and 25%) and 4 levels of soil contamination with heavy metals (natural content (0), elevated (I), polluted in the 1st degree (II), polluted in the 2nd degree (III)). The classification mentioned above enables us to assess the extent of soil contamination with heavy metals taking their bioavailability into account. The experiment consisted of 216 ground microplots. In the experiment, different plant species were cultivated in the following years of the experiment (cereals, maize, rapeseed, mustard seed, coarse-seeded legumes).

2.3. Collection and Processing of Soils

Soil samples were taken for testing in 2018 after the harvest of spring barley for grains. Soil samples were collected at the end of the growing season (September–October) from 0−25 cm soil layer. Next, the soil was prepared for analysis in accordance with the ISO11465 standard. The soil material was determined for: organic C by direct method PN-EN 15936, pH in the suspension KCl (mol∙dm−3) PN-EN 10390, sum of alkali (S in 0.1 M HCl) and hydrolytic acidity (Hh in 1M (CH3 COO)2 Ca) by the Kappen method, exchangeable cations in the solution of 1 mol∙dm−3 CH3COONH4 using the Jackson method. Heavy metals were determined in 3 levels (top layer Ap, Et, Bt) in the extract of 1 M HCl, while in level Ap 3 with methods: total (in royal water acc. to PN-ISO 11466) and in 1 mol∙dm−3 HCl [13]. The content of cations in the solution was determined by the AAS method. In order to validate the method for accuracy and precision, certified reference material was used. The measurement of uncertainty for heavy metals was assessed for light soil based on CRM trace metals silt clay 1 and for medium soil trace metals—clay 1. The calculated measurement uncertainty for the metal determination method in aqua regia was: Pb ± 22%, Zn ± 20%, Cu ± 17%, Cd ± 25%. The samples are used in duplicate to detect systematic errors due to the sample’s matrix, or to evaluate the stability of a sample after its collection.
The movement of heavy metals in the soil profile was determined on the basis of the mobility coefficient CM (increase in heavy metal in the Bt and Et layer compared to the control).
The obtained results were analyzed statistically by means of variance analysis (using Tukey’s test) and single factor regression. Statistical calculations were performed using the program Statgraphics plus). Results are the means from 3 replications.

3. Results

3.1. Physico-Chemical Characteristics of Soils

Apart from the granulometric composition, the tested soils differed in the capacity of the sorption complex, degree of alkaline saturation, hydrolytic acidity and pH. The actual pH of light soil was 4.0, 4.97 and 5.96, while of medium soils, it was 4.03, 5.08 and 6.05, respectively. The actual Corg. concentration in the light soil was 6.6, 9.2 and 11.9 g·kg−1, while in the medium soil, it was 6.2, 8.9 and 1.8 g·kg−1, respectively. In the tables, total pH values were assumed to be 4, 5 and 6, while Corg. in g∙kg−1 was 6, 9 and 12.
Light soil had a smaller sum of exchangeable alkalis, lower value of the sorption complex saturation with alkalis, higher hydrolytic acidity and lower capacity of the sorption complex than the average soil (Table 1). With the increase in soil pH, the sum of alkalis and the sorption complex saturation with alkalis increased, while the hydrolytic acidity decreased in both light and medium soils. The increase in the sum of alkalis and sorption capacity could result from an increase in the amount of active alkaline cations as well as from an increase in the amount of free uncompensated negative loads on the organic part of the sorption complex, as shown by Fotyma and Mercik [14]. The increase in soil organic carbon concentration in the range 6–12 g·kg−1 caused a lower increase in the sum of alkalis and capacity of the sorption complex than the addition of CaCO3. A varied concentration of organic carbon had little effect on the saturation of the sorption complex with alkalis.
The soils were the least varied in terms of exchangeable potassium concentration. The medium soil, as compared to light soil, contained twice as much calcium, six times as much magnesium and 23% more potassium (Table 2).

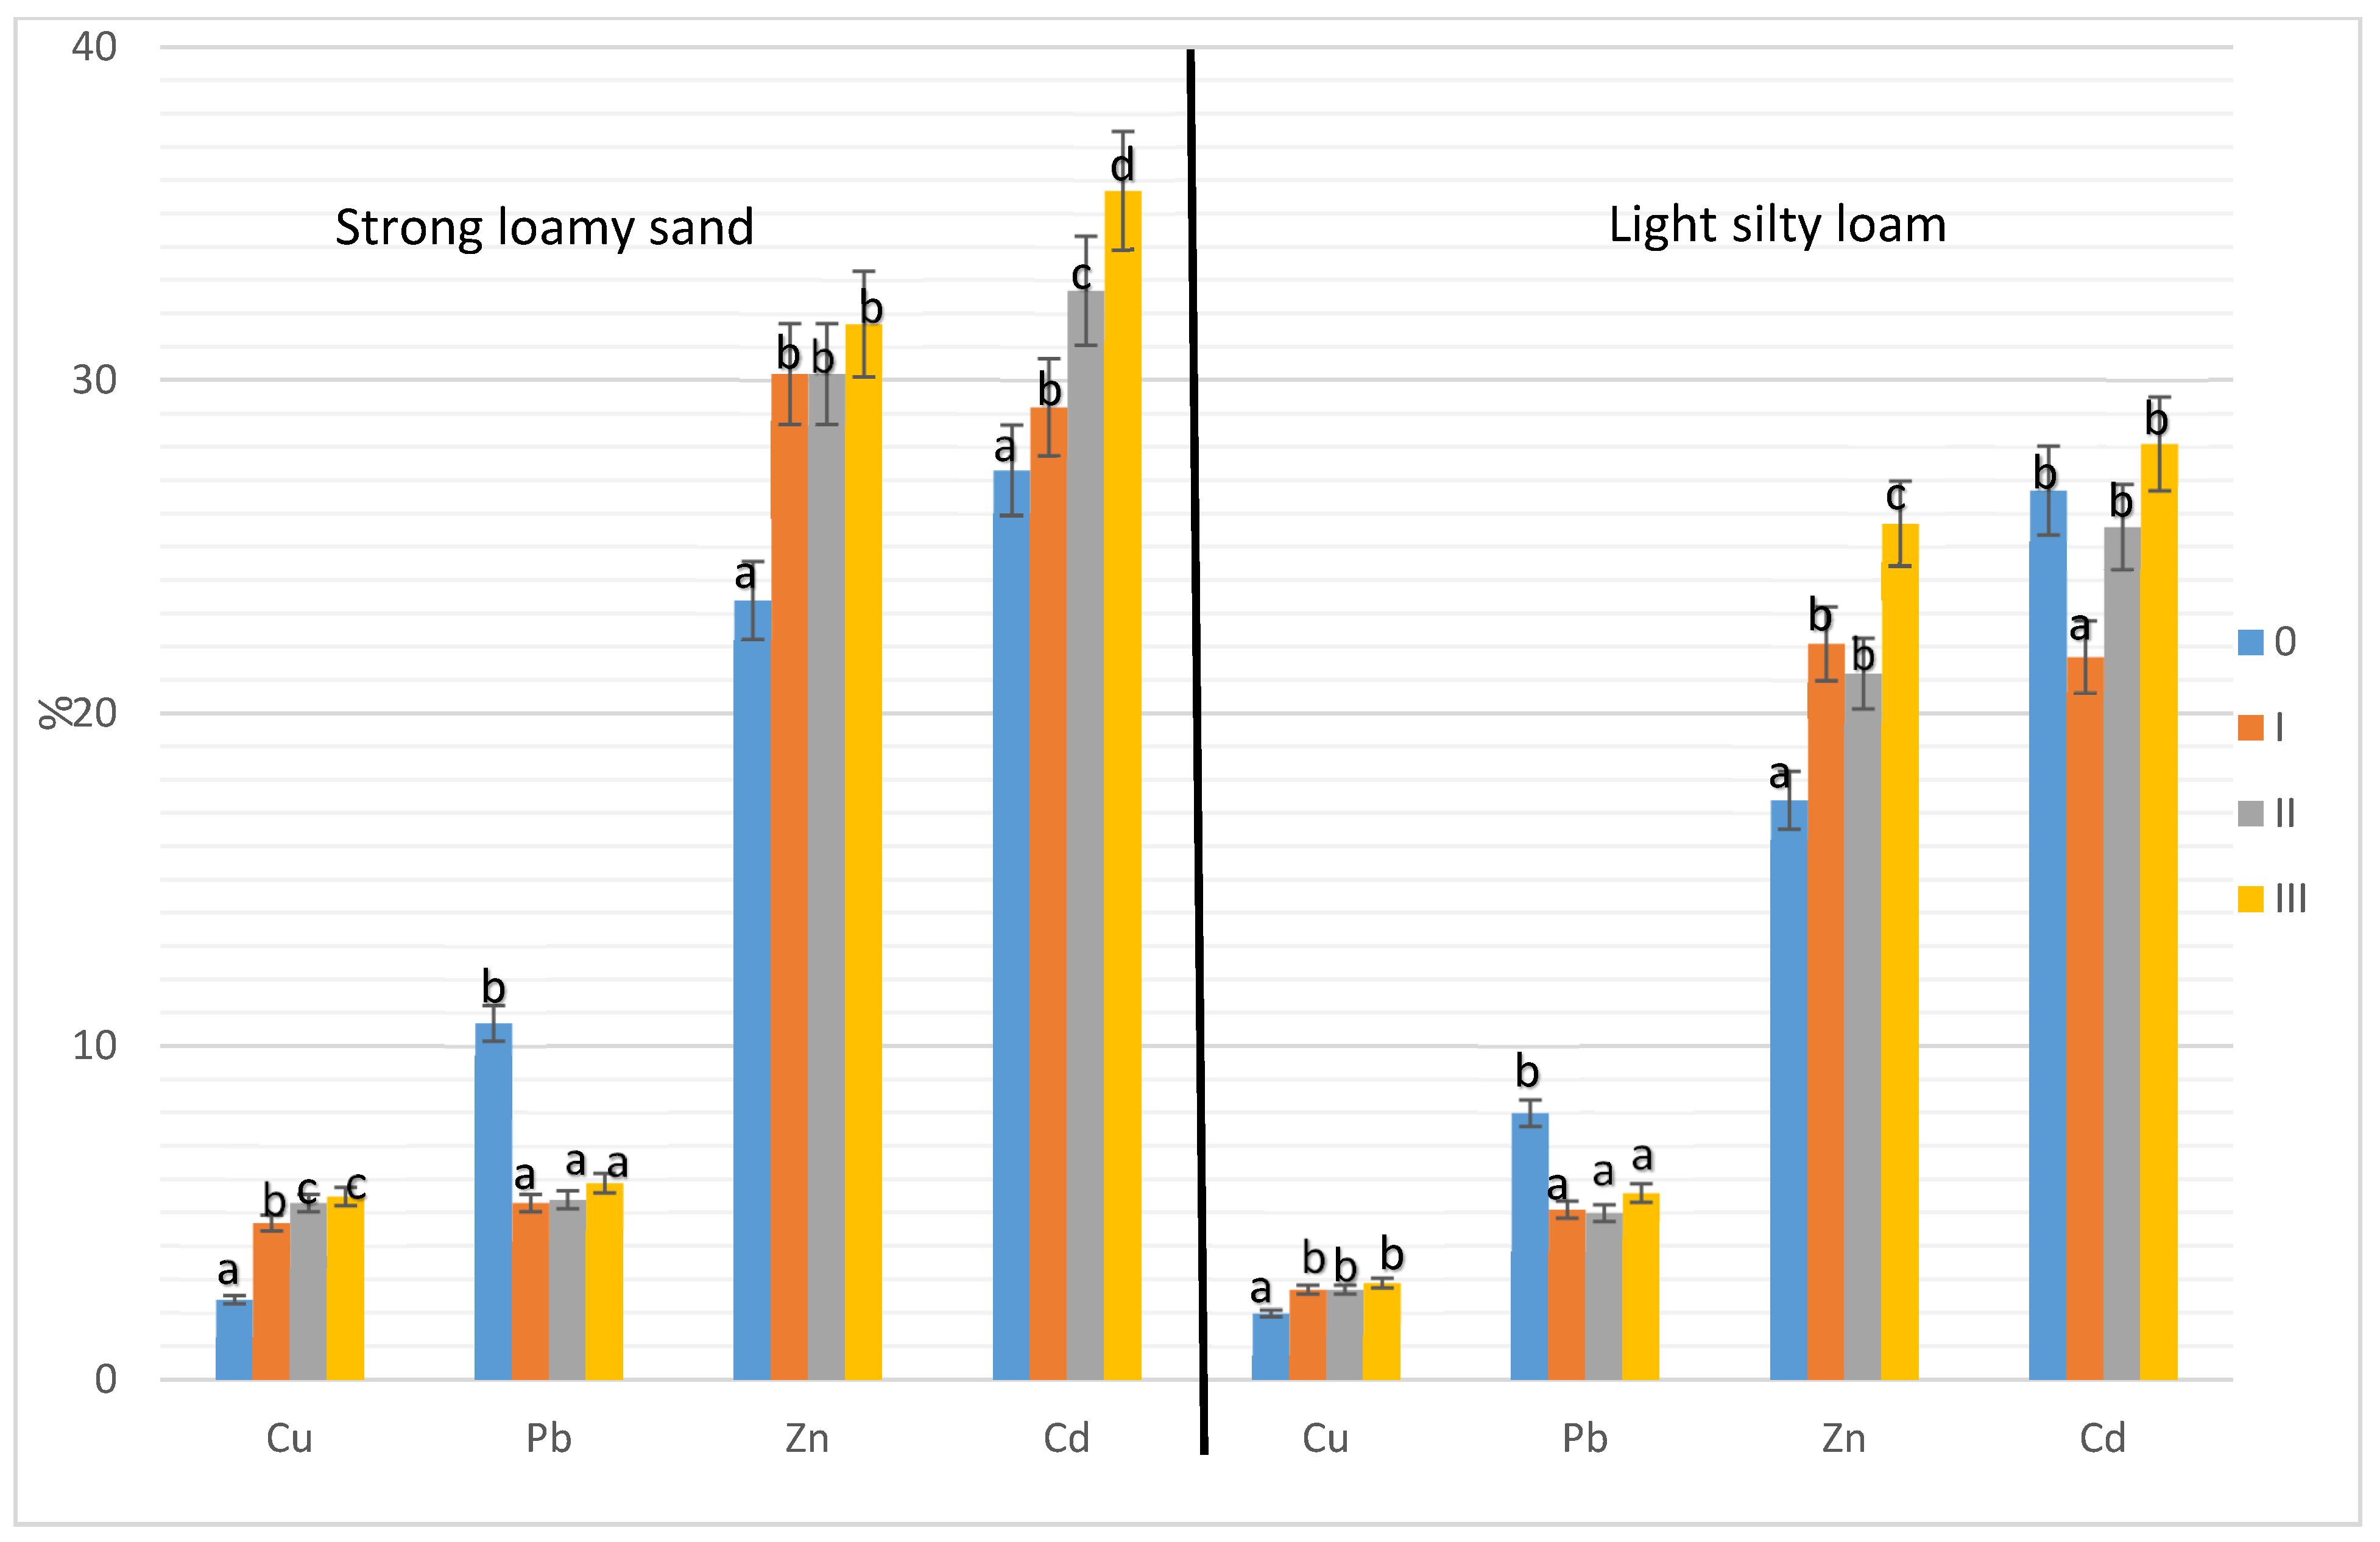
3.2. Share of Soluble Forms of Heavy Metals in the Total Content of These Elements in the Soil

Light soil contained, on average, less total heavy metal forms than the medium soil (Figure 1). This is because the natural concentration of these metals in the medium soil was higher than in the light soil. Zinc occurred in the highest amount, while cadmium in the lowest amount in the soil.
In the extract of 1 M HCl, an average of 65 to 94% of the total concentration of the metals determined in royal water was determined (Figure 2). The highest proportion of this metal form was obtained for lead, while the lowest for cadmium. A higher proportion of this metal form was obtained in light soil than in medium soil. The solubility of metals in 1 M HCl was influenced by the degree of soil contamination with these elements. The highest relationship was obtained for zinc. In both light and medium soils, the proportion of the soluble form of this element determined in HCl considerably decreased together with its increasing concentration in the soil. On light soils, a significantly lower proportion of this form of lead and copper was obtained only on the soil that was most contaminated with these elements. On medium soil, the percentage of the form of Pb, Cd and Cu soluble in HCl in the total form did not depend on the degree of soil contamination with these elements.
The percentage of the available form of the metals tested determined in 1M ammonium nitrate ranged from 2 to 35% compared to the total form (Figure 3) The highest percentage of this metal form was obtained for cadmium and zinc. The solubility of copper and lead in NH4NO3 was many times lower than Zn and Cd. Higher solubility was obtained on light than on medium soil. The increase in the amount of metals in the soil usually significantly increased the percentage of this form of metals in the total concentration. A reverse relation was obtained only for lead. This indicates that the form of lead added to the soil is poorly soluble in 1M ammonium nitrate.

3.3. The Relocation of Heavy Metals in Soil Profiles

After 14 years from the introduction of different rates of metals into the top layer (0–30 cm) of the two soils, relatively large movement of heavy metals in the soil profile occurred (Figure 4). The amount of leached metals depended mainly on the rate of a given element. The more contaminated the soil was, the heavier metals leached to lower genetic levels. Contaminated soils always had a higher concentration of individual metals in Et than in Bt level. In the Et layer, the content of the metals tested determined in HCl (1 mol dm−3) was comparable to the humus level. Only at the depth below 50 cm (Bt), the content of the studied metal form was much lower than in the surface levels. It indicates that within a few years after the contamination of soils with heavy metals, the largest amounts of them moved to the subsoil layer. However, in the layer below 50 cm, significant amounts of the heavy metals studied were also obtained, which indicates the possibility of their movement into deeper soil layers.
The calculated mobility coefficients of the tested metals determined in 1M HCl indicate a larger movement of the tested metals in lighter soils than in medium soils (Figure 4 and Figure 5). The highest displacement coefficients were obtained for cadmium, while the lowest were for lead. An increase in mobility was obtained alongside the increase in soil contamination with the heavy metals. By analyses of the mobility coefficients (heavy metal increase in the Bt and Et layers), they can be ranked in the following decreasing sequence: on light soils: Cd > Cu > Zn > Pb and on medium soils: Cd > Zn > Pb > Cu.

4. Discussion

In our research, the movement of PCE in the soil profile was detected. The highest leaching took place at low soil pH and relatively low organic matter content. In the more contaminated soil, the heavier metals leached deep into the soil profile. The most susceptible to leaching was Cd, while the least was Cu. In the literature, it can be found that more leaching of cadmium and nickel occurs from sand soil than from loam soil [15]. Comparing the results of the research with the data of other authors, it can be stated that a higher leaching of heavy metals deep into the soil profile occurs on lighter soils compared to the medium. In Gębski’s study [16], heavy metals (Zn and Cd) introduced into the arable layer were easily moved to deeper layers of the soil profile. The mobility of these elements, and thus, their leaching intensity, increased together with the decrease in soil pH. A similar tendency was observed in our own research. However, at high soil pH, the movement of Cd deep into the soil profile is small [17]. In turn, Borowiec et al. [18] report that Cd can accumulate mainly at the accumulation level, although most studies indicate that this element can easily move deep into the soil profile. Many researchers have observed a significant reduction in the leaching of Zn and Cd metals under the influence of an increase in soil pH value and a lack of Pb response to a change in pH [19]. This thesis is confirmed by our own research. There is also no evidence of the movement deep into soil profiles of Zn, Cd and Pb in soils with a similar pH to the neutral one and having a higher content of floatable parts [20,21,22]. The finding that higher movement of Zn and Cd occurs in sandy soils with strong acidity [23] is consistent with the results of our research.
Most literature reports that lead does not leach into the soil profile, but Bowen [24] states that this element does move in the soil, yet very slowly. Kabata-Pendias and Pendias [25], on the other hand, draw attention to the possibility of a serious change in the rate of lead movement in the soil profile due to a decrease in soil sorption capacity or an increase in acidification. Under such conditions, this element can migrate to groundwater, posing a serious toxicological risk. Other researchers from the Czech Republic who determine the mobility of Pb, Zn and Cd in soils from the Příbram region (Czech Republic) heavily contaminated by metallurgy—two profiles of alluvial soils were closely studied—report that the profile distribution of lead (the least mobile metal) is characterized by a gradual decrease with depth [26].
The addition of increasing amounts of organic matter in the soil in the range of 6–12 g/kg reduced the leaching of PCE deep into the soil profile, especially on light soils. The increase in Corg. concentration in the soil limited the leaching of Pb the most, while Cd the least. The literature also states that heavy metals do not leach deep into the soil profile but accumulate in the topsoil layer. In the arable layer of Lublin soils, higher amounts of cadmium are found compared to their subsoil [27]. In the study of Kaniuczak and Hajduk [28], a higher Cd concentration was found in the layer of 25–50 than 0–25 cm. On the other hand, studies carried out in the area of influence of the Częstochowa Steelworks (Poland) (where most of the soils belong to weakly clayey sands) for the condition of the soil environment showed a lack of movement and accumulation of Zn, Cd, Pb, Cr, Ni and Cd in deeper soil layers [29]. This shows that the leaching of heavy metals in natural conditions is lower than in the microplot experiment, where this movement is strong.

5. Conclusions

In the extract of 1 M HCl, we obtained an average of 65 to 94% of the total concentration of the metals determined in royal water. The highest proportion of this metal form was obtained for lead, while the lowest for cadmium. The percentage of the form soluble in HCl significantly decreased together with the increasing concentration of this element in the soil. The share of available form, determined in 1M ammonium nitrate, of the studied metals ranged from 2 to 35% compared to the total form. The highest share of this metal form was obtained for cadmium and zinc. The increase in the amount of metals in the soil usually significantly increased the share of this metal form in the total concentration. The leaching of the studied metals depended on the degree of contamination and soil species. The more contaminated the soil was, the more PCE determined in 1 M HCl leached to lower genetic levels, more to Et than Bt. The highest displacement factors were obtained for cadmium, and the lowest were for lead. By analyzing the mobility coefficients (heavy metal growth in the Bt and Et layers), they can be ranked in the following decreasing sequence: on light soils: Cd > Cu > Zn > Pb and on medium soils: Cd > Zn > Pb > Cu.

Author Contributions

Conceptualization, D.P.; methodology, D.P. and W.S.; formal analysis, D.P. and W.S.; investigation, D.P. and W.S.; data curation, D.P. and W.S.; writing—D.P. and W.S.; original draft preparation, D.P. and W.S.; writing—review and editing, D.P.; visualization, D.P. and W.S. All authors have read and agreed to the published version of the manuscript.

Funding

This research received no external funding.

Institutional Review Board Statement

Not applicable.

Informed Consent Statement

Own research.

Data Availability Statement

Own research and data.

Conflicts of Interest

The authors declare no conflict of interest. The funders had no role in the design of the study; in the collection, analyses or interpretation of data; in the writing of the manuscript or in the decision to publish the results.

References

  1. Kabata-Pendias, A. Agricultural Problems Related to Excessive Trace Metal Contents of Soils. In Heavy Metals; Förstner, U., Salomons, W., Mader, P., Eds.; Springer: Berlin/Heidelberg, Germany, 1995; pp. 3–18. [Google Scholar]
  2. Kabata-Pendias, A. Soil-plant transfer of trace elements an environment issue. Geoderma 2004, 122, 143–149. [Google Scholar] [CrossRef]
  3. Cadmium in the Human Environment: Toxicity and Carcinogenicity. Available online: https://publications.iarc.fr/Book-And-Report-Series/Iarc-Scientific-Publications/Cadmium-In-The-Human-Environment-Toxicity-And-Carcinogenicity-1992 (accessed on 3 February 2020).
  4. Sillanpää, M. Trace elements in soil and agriculture. FAO Soils Bull. 1972, 17, 33. [Google Scholar]
  5. Dziadek, K.; Wacławek, W. Metals in the Environment, Vol. I Heavy Metals (Zn, Cu, Ni, Pb, Cd) in the Soils Environment; Department of Chemical Physics, University of Opole, Institute of Chemistry: Opole, Poland, 2005; Volume 10, pp. 1–2. [Google Scholar]
  6. Puga, S.; Sosa, M.; Lebgue, T.; Quintana, C.; Campos, A. Heavy metals pollution in soils damaged by mining industry. Ecol. Appl. 2006, 5, 149–155. [Google Scholar] [CrossRef] [Green Version]
  7. Senesil, G.S.; Baldassaree, G.; Senes, N.; Radina, B. Trace element inputs into soils by anthropogenic activities and implications for human health. Chemosphere 1999, 39, 343–377. [Google Scholar] [CrossRef]
  8. Koncewicz-Baran, M.; Gondek, K. Content of trace elements in agricultural soils. Infrastruct. Ecol. Rural. Areas 2010, 14, 65–74. [Google Scholar]
  9. Violante, A.; Cozzolino, V.; Perelomov, L.; Caporale, A.; Pigna, M. Mobility and bioavailability of heavy metals and metalloids in soil environments. J. Soil Sci. Plant Nutr. 2010, 10, 268–292. [Google Scholar] [CrossRef] [Green Version]
  10. Alkorta, I.; Hernandez-Allica, J.; Becerril, J.M.; Amezaga, I.; Albizu, I.; Gabisu, C. Recent findings on the phytoremediation of soils contaminated with environmentally toxic heavy metals and metalloids such as zinc, cadmium, lead and arsenic. Environ. Sci. Bio/Technol. 2004, 3, 71–90. [Google Scholar] [CrossRef]
  11. Shiva Kumar, D.; Srikantaswamy, S. Factors Affecting on Mobility of Heavy Metals in Soil Environment. IJSRD 2014, 2, 201–203. [Google Scholar]
  12. Kabata-Pendias, A.; Motowicka-Terelak, T.; Piotrowska, M.; Terelak, H.; Witek, T. The assesmen of the quality and possibilities of agricultural using soils polluted with heavy metals. Assessment of the degree of polluting soils and plants with heavy metals and sulphor. In General Guidelines for the Farming; Institute of Soil Science and Plant Cultivation: Pulawy, Poland, 1993; Volume 53, p. 20. [Google Scholar]
  13. Gembarzewski, H.; Korzeniowska, J. The Using of 1 M HCl Solution as a Common Extractant to Assess the Abundance of Soil in Available Forms of Microelements; Works of the Scientific Committee of the Polish Soil Science Society; Scientific Committee of the Polish Soil Science Society: Warsaw, Poland, 1987; Volume 991–999. [Google Scholar]
  14. Fotyma, M.; Mercik, S. Agricultural Chemistry; Polish Scientific Publishing House: Warsaw, Poland, 1992; ISBN 83-01-10654-9. [Google Scholar]
  15. Sykut, S.; Ruszkowska, M.; Wojcieska, U.K. Collection and washing of cadmium and nickel depending on soil type and fertilization (results of lysimetric experiment). Adv. Agric. Sci. Probl. Issues 1997, 448a, 317–322. [Google Scholar]
  16. Gębski, M. Development of a Method of Fertilization on Light Soils Contaminated with Heavy Metals. Ph.D. Thesis, Warsaw University of Life Sciences, Warsaw, Poland, 1997; 112p. [Google Scholar]
  17. Mercik, S.; Stępień, W.; Gębski, M. Cadmium content in plants and soil profiles as a result of two or three applications of lime from the lead smelter. Adv. Agric. Sci. Probl. Issues 1997, 448a, 253–259. [Google Scholar]
  18. Borowiec, J.; Baran, S.; Turski, R. Accumulation of Pb, Zn, Cd and Cr in individual mechanical fractions of soils contaminated with dust from zinc smelters. Adv. Agricul. Sci. Probl. Issues 1997, 448a, 241–246. [Google Scholar]
  19. Fulekar, M.H.; Dave, J.M. Release and behaviour of Cr, Mn, Ni and Pb in a flyash/soil/water environment: Column experiment. Int. J. Environ. Stud. 1991, 38, 281–296. [Google Scholar] [CrossRef]
  20. Sommers, L.E.; Nelson, D.W.; Silviera, D.J. Transformation of carbon, nitrogen and metals in soils treated with waste materials. J. Environ. Qual. 1979, 8, 287–294. [Google Scholar] [CrossRef]
  21. Williams, D.E.; Vlamis, J.; Pukite, A.H.; Corey, J.E. Metal movement in sludge-amended soils: A nine year study. Soil Sci. 1987, 143, 124–131. [Google Scholar] [CrossRef]
  22. Fijałkowski, K.; Kacprzak, M.; Grobelak, A.; Placek, A. The influence of selected soil parameters on the mobility of heavy metals in soil. Eng. Environ. Prot. 2012, 15, 81–92. [Google Scholar]
  23. Wessolek, G.; Fahrenhorst, C. Immobilization of heavy metals in a polluted soil of a sexage farm by application of a modified alumino-silicate: A laboratory and numerical displacement study. Soil Technol. 1994, 7, 221–232. [Google Scholar] [CrossRef]
  24. Bowen, H.M. Environmental Chemistry of the Elements; Academic Press: New York, NY, USA, 1979; 333p. [Google Scholar]
  25. Kabata-Pendias, A.; Pendias, H. Biogeochemistry of Trace Elements; Polish Scientific Publishing House: Warszawa, Poland, 1999; p. 398. [Google Scholar]
  26. Lipiński, W.; Bednarek, W. The presence of cadmium and nickel in soils with different granulometric compositions. Adv. Agric. Sci. Probl. Issues 1997, 448a, 231–235. [Google Scholar]
  27. Vaněk, A.; Borůvka, L.; Drábek, O.; Mihaljevič, M.; Komárek, M. Mobility of lead, zinc and cadmium in alluvial soils heavily polluted by smelting industry. Plant Soil Environ. 2005, 51, 316–332. [Google Scholar] [CrossRef] [Green Version]
  28. Kaniuczak, J.; Hajduk, E. Cadmium and lead in some soils of south-eastern Poland. Adv. Agric. Sci. Probl. Issuss 1995, 18, 241–246. [Google Scholar]
  29. Patorczyk-Pytlik, B.; Spiak, Z. Impact of Częstochowa iron-works on the soil environment and chemical composition of plants. Adv. Agric. Sci. Probl. Issues 1999, 467, 421–428. [Google Scholar]
Figure 1. Mean concentrations of Zn, Pb, Cd and Cu in the topsoil layer (0–30 cm) determined in royal water. a, b, c, d—treatments with the same letter are not significantly different (p ≤ 0.05).
Agronomy 11 00878 g001
Figure 2. Percentage of heavy metals determined in 1 M HCl (%) in the total concentration of these elements determined in royal water according to soil contamination levels. a, b, c—treatments with the same letter are not significantly different (p ≤ 0.05).
Agronomy 11 00878 g002
Figure 3. The share of heavy metals determined in 1 M NH4NO3 (%) in the total amount of these elements determined in royal water according to the level of soil contamination. a, b, c, d—treatments with the same letter are not significantly different (p ≤ 0.05).
Agronomy 11 00878 g003
Figure 4. The mobility coefficients (CM) for Cd, Cu, Zn and Pb determined in HCl (1 mol dm−3) in Et and Bt levels in light soil depending on the degree of contamination of the soils with these elements. a,b,c—treatments with the same letter are not significantly different (p ≤ 0.05), Et—the subsurface horizon of eluvial loss of silt and clay, Bt—the subsurface horizon of illuvial accumulation of clay and humic substances.
Agronomy 11 00878 g004
Figure 5. The mobility coefficients (CM) for Cd, Cu, Zn and Pb determined in HCl (1 mol·dm−3) in Et and Bt levels in medium soil depending on the degree of contamination of the soils with these elements. a,b,c—treatments with the same letter are not significantly different (p ≤ 0.05), Et—the subsurface horizon of eluvial loss of silt and clay, Bt—the subsurface horizon of illuvial accumulation of clay and humic substances.
Agronomy 11 00878 g005
Table 1. Average soil pH, sum of alkalis (S), hydrolytic acidity (Hh), capacity of the sorption complex (T), saturation of the sorption complex with alkalis (V) in the top layer (0–30 cm) of soil.
Soil TextureCorg. Content in g∙kg−1Soil pHSHhTV
mmol (+) kg−1%
Strong loamy sand 429.6 a43.6 c73.1 a40
537.4 b36.1 b73.5 a51
658.1 c30.4 a88.6 b66
Light silty loam 487.8 a34.1 c121.9 a72
5102.4 b29.5 b131.9 b78
6121.4 c23.5 a144.9 c84
Strong loamy sand6 34.1 a30.0 a64.2 a53
941.1 b35.7 b76.8 b54
1249.8 c44.4 c94.2 c53
Light silty loam6 96.1 a23.3 a119.4 a80
9102.7 b27.7 b130.4 b79
12112.7 c36.1 c148.8 c76
a, b, c—treatments with the same letter are not significantly different (p ≤ 0.05).
Table 2. Mean content of exchangeable cations (mg∙kg −1) in the top layer of light and medium soils (0–30 cm).
Soil TextureMean Content of Ca, Mg and K w mg∙kg −1 d.w.
CaMgK
Light674.355.9130.0
Medium1440.2332.9159.6
Publisher’s Note: MDPI stays neutral with regard to jurisdictional claims in published maps and institutional affiliations.

