Article

Sweet Sorghum (Sorghum bicolor) Performance in a Legume Intercropping System under Weed Interference

1
Crop Science, School of Agricultural, Earth and Environmental Science, University of KwaZulu-Natal, Private Bag X01, Scottsville, Pietermaritzburg 3209, South Africa
2
Agricultural Research Council―Soil, Climate and Water, Private Bag X79, Pretoria 0083, South Africa
*
Author to whom correspondence should be addressed.
Agronomy 2021, 11(5), 877; https://doi.org/10.3390/agronomy11050877
Submission received: 12 February 2021 / Revised: 13 April 2021 / Accepted: 20 April 2021 / Published: 29 April 2021
(This article belongs to the Section Weed Science and Weed Management)

Abstract

:
Sweet sorghum (Sorghum bicolor L. Moench) is highly susceptible to weed competition during the early growth stages; hence, intercropping is considered to overcome the weed competition challenge. This study was conducted to determine the performance of sweet sorghum in legume intercropping systems under different weed management pressures. Three cropping systems (sole crop, inter-row, and intra-row intercropping) and three weed management levels (no weeding after crop emergency, ceasing weeding 50 days after crop emergency, and weeding throughout) were tested. Intercropping pattern had a significant (p < 0.05) impact on the plant and the number of leaves per plant, while other treatments remained insignificant during the 2017/18 growing season. During the 2018/19 growing season, the intercropping pattern had a significant (p < 0.05) effect on dry and fresh biomass and plant height at 60 days after emergence. An increase in weeding frequencies reduced Brix (Bx). Uncontrolled weed plots had the lowest sweet sorghum dry biomass accumulation, whereas the biomass increased as weeding frequencies increased but remained insignificant as weeding frequencies further increased from 50% to 100% in both seasons. Consequently, SS/DB intra-row intercropping and intermediate weeding are sufficient for optimum SS biomass production and sugar levels.

1. Introduction

Sweet sorghum (Sorghum bicolor L. Moench) is one of the most underutilized crops in South Africa [1], yet its biomass can be valuable for producing energy [2]. Concerns about rising fuel prices and energy demands are some of the few reasons why biofuels have been advocated for due to their potential to reduce the environmental impact brought by the emissions of greenhouse gases [3]. Sweet sorghum (SS) is a multipurpose crop that has of late attracted considerable interest as a potential energy crop. Moreover, its drought and heat tolerance traits [4] make it one of the most suitable plant materials for biofuel production, particularly in moisture-limited conditions [5]. Sweet sorghum is relatively a small-seeded grass with retarded growth from the first few weeks after emergence [6], which exposes the crop to competition with weeds [7]. The limited number of herbicides exacerbates sorghum weed control [6] challenges, whereas hand weeding is a significantly labor-intensive activity.
Therefore, calls for sustainable intensification of the agricultural systems, such as intercropping have intensified and are considered a new “Green Revolution” [8]. Intercropping is the practice of growing two or more crops in the same piece of land simultaneously [9]. It has been promoted as a potential technology to prevent further environmental degradation [10], such as soil erosion, environmental pollution, and greenhouse gas emissions that have accelerated due to overuse of agrochemicals, which reduces soil fertility and microbial biodiversity [11]. Intercropping can reduce the risk of weeds and pests and minimize the application of agrochemicals while stimulating biodiversity and increasing yield and yield stability [9]. Additionally, weed suppression is significantly higher in the intercropping system than in the monoculture system, while rates of serious pests [12,13] and disease [13] are reduced in intercrops. Intercrops influence disease dynamics through the modification of the micro-climate by altering the temperature and moisture conditions, leading to a change in host morphology and physiology and direct pathogen inhibition [12]. Weed suppression is one of the advantages of intercropping, but it complicates physical and chemical weed control strategies [14].
Past research showed that regardless of weed species, grain sorghum yields doubled in plots weeded during the first two weeks after planting compared to non-weeded plots [15]; however, weed growth beyond two weeks after grain sorghum emergence negatively affected grain sorghum yield [16]. Generally, weeds compete with crops for nutrient resources within the inter-row spaces [17]. Some weeds are a food resource for insects and sources of plant diseases [18], affecting crop yield and quality. A recent study showed that sorghum forage quality was affected by intercropping and weed control treatments such that the crude protein and total ash were affected by sorghum intercropped with 33% and 66% hairy vetch under no weeding plots [19].
It is, therefore, necessary to recommend appropriate agronomic weed control practices such as intercropping, which among other effects, increase crop diversity, hence reducing synthetic N’s global requirement and concomitantly ensuring sustainable cropping systems [9] through biological N fixation by legumes. Sweet sorghum requires less fertilizer than most crops and is easily cultivated on marginal lands [20]. Moreover, it can grow up to 3 m in plant height and yield between 45–112 t ha−1 of fresh biomass [21]. Its sizeable fibrous root system helps to absorb water more effectively than other crops, and its leaf blades are covered with a waxy coating that reduces water loss; for this reason, it is a firmly drought-resistant crop [7].
Legumes are frequently used as intercrops and play a pivotal role in many intercropping systems [22]. The use of selected leguminous crops such as dry bean (DB) (Phaseolus vulgaris L.) and cowpea (CP) (Vigna unguiculata L. Walp.) for intercropping can also help suppress weeds [23]. Legume species have low N absorption during early growth [24], which could contribute to their susceptibility to weed competition [25], especially when intercropped with non-legumes [26]. However, previous studies reported that N limitation decreases canopy photosynthesis by reducing leaf area development and leaf photosynthesis rate [27]. Therefore, early canopy cover plays a crucial role in establishing competitive advantages towards weeds [28].
Information regarding the potential of legumes to reduce fossil energy inputs and greenhouse gas emissions from agricultural systems relying on mineral N fertilization and the carbon sequestration in soils remains sparse [29]. A better understanding of competition in intercropping systems is pivotal to determining compatible intercropping pattern arrangement to avoid inter- and intraspecies competition, thus alleviating the degradation of agricultural ecosystems and weed competition.
However, there is a paucity of information on intercropping patterns and weeding frequency effects on SS production. There has been a prolonged interest in maximizing the sustainable use of marginal land in Southern African countries to produce plant biomass for biofuels [30]. It is therefore vital to execute research based on appropriate cropping systems that would produce higher yields and enhance soil productivity. The one possible obstacle that may affect yield is weed pressure, and one feasible and sustainable approach in improving crop productivity and reducing weed pressure is through intercropping.
Nevertheless, for intercropping to be efficient, crop selection and spatial arrangement are essential. Currently, few works have examined SS, hence this study. This study’s main objective was to evaluate SS performance in a DB or CP intercropping system compared to sole cropping under different weeding management levels. The study also aimed to determine the optimum spatial arrangement for SS with DB/CP intercropping to maximize biomass production.

2. Materials and Methods

2.1. Experimental Site, Design, and Trial Management

A field experiment was conducted at Ukulinga Research and Training farm at the University of KwaZulu-Natal in Pietermaritzburg, South Africa (29°39′56″ S 30°24′26.2″ E) during the 2017/18 and 2018/2019 growing seasons. Generally, mid-October to late April is considered the growing season for summer crops in South Africa. The site has an annual rainfall of 644–838 mm, an average temperature of 18.4 °C, and an altitude of 791 m.
A randomized complete block design (RCBD) with a split-plot treatment structure was used for three crops, viz. dry bean (Phaseolus vulgaris L.) cultivar Ukulinga, cowpea (Vigna unguiculata L. Walp.) var. Agrinawa, and sweet sorghum (Sorghum bicolor L. Moench) var. Supasweet II. Twenty-seven treatment combinations composed of three intercropping patterns (sole crops, inter-row, and intra-row spacing) and three weeding frequencies (no weeding after emergency = 0%, weeding ceased after 45–50 days of emergency = 50%, and weeding throughout = 100%) were used and replicated three times, resulting in a total of 81 plots.
The plot dimensions were 4.2 m × 3 m resulting in a gross plot area of 12.6 m2, whereas 1 m between plots and 2 m between replicates were maintained. All treatment combinations were planted at 0.60 m inter-row and 0.30 m intra-row spacing (55,555.55 plants ha−1) to achieve uniformity for both sole crops and intercrops. The field trials were sown on 13 December 2017 and harvested on 11 April 2018 for the 2017/18 growing season and again sown on 14 December 2018 and harvested on 03 April 2019 for the 2018/19 growing season. In environments that receive high rainfall and are characterized by shallow clay soils like Ukulinga, sorghum–CP intercrop systems should be planted around 15 December [31]. A disk plow and rotovator implements were used for land preparation. The land was fallow for two years before planting; therefore, fertilizer (NPK) was applied based on soil analysis at planting, and limestone ammonium nitrate (LAN) was applied as top-dressing, and all crops were planted simultaneously. Hand hoes were used to control weeds in the plots; however, no herbicides were used to control weeds. Two weeks after germination, thinning and the first weeding processes were simultaneously applied and continued until the flowering stage for weed-free plots. Sweet sorghum plants were thinned to two plants per station, while cowpea was thinned to one plant per station.

2.2. Data, Soil Sample Collection, and Yield

The data collected were the dry and fresh biomass, the number of leaves per plant, plant height, and sugar content Brix (Bx). Whole plants were harvested from 1.44 m2, then the fresh weight of sweet sorghum stalks, including leaves, were measured to determine biomass production. Moreover, oven-drying was kept at 50 °C for dry biomass determination. Based on the average of four randomly selected plants plot−1, a meter ruler was used to measure plant height, and a handheld refractometer was used to measure Bx at the third internode from above ground. Soil samples were randomly collected using a hand auger up to a depth of 20 cm in a zig-zag pattern.
Land equivalent ratio (LER) was determined using the formula as shown below:
LER= ∑ (Ypi/Ymi),
Yp denotes the crop yield in intercropping, and Ym denotes the crop yield in the sole cropping [32]. Legume species were changed in accordance with the data.

2.3. Soil Analysis and Climatic Condition

Soil fertility results indicated that soils at Ukulinga Research Farm are slightly acidic and nutrient-sufficient (Table 1). Due to the technical errors during the 2017/18 growing season, complete 2018/19 growing season soil analysis results were used (Table 1). The experimental soil is classified as chromic luvisol, with clay content of less than 29%, field capacity of 46.32%, permanent wilting point of 23.03%, and water saturation of 46.73% [31].
The total monthly rainfall was 703 mm in the 2017/18 growing season, whereas the 2018/19 growing season received 252.73 mm at Ukulinga Research Farm. The average minimum and maximum monthly temperatures were 14.47–25.87 °C during the 2017/18 growing season and 14.92–26.36 °C during the 2018/19 growing season (Figure 1).

2.4. Statistical Analysis

Analysis of variance (ANOVA) was used to compare the effects of intercropping pattern and weeding frequency on sweet sorghum dry and fresh biomass, the number of leaves per plant, plant height, and Bx using GEN STAT statistical software version 18. As treatments were significant (p < 0.05), a standard error of the difference (SED) was used to separate the means. The principal component analysis was used to evaluate the intercropping pattern and weeding frequency association with SS dry and fresh biomass, the number of leaves per plant, plant height, and Bx. The further an arrow is from the center of the PCA diagram, the greater the confidence in the correlation between sweet sorghum dry biomass, fresh biomass, the number of leaves per plant, plant height, Bx, and intercropping pattern and weeding frequency.

3. Results

3.1. Intercropping Patterns and Weeding Frequency Effects on SS Measured Agronomic Traits

Intercropping pattern had a significant (p < 0.05) effect on plant height and the number of leaves per plant 80 days after emergence (DAE), whereas the weeding frequency had a significant (p < 0.05) effect on Bx, dry and fresh biomass, plant height, and the number of leaves per plant during the 2017/18 growing season (Table 2). The intercropping pattern × weeding frequency interaction had significant (p < 0.05) effects on plant height 80 DAE, while others remained insignificant (Table 2). Intercropping pattern had a significant (p < 0.05) effect on dry and fresh biomass and plant height at 60 DAE during the 2018/19 growing season (Table 3). The weeding frequency had a significant (p < 0.05) effect on Bx, dry and fresh biomass, plant height at 80 DAE, and number of leaves at 60 and 80 DAE (Table 3). Moreover, the intercropping pattern × weeding frequency interaction had a significant (p < 0.05) effect on fresh biomass and the number of leaves per plant at 60 DAE, while other treatments remained insignificant (Table 3).

3.2. Brix, Dry and Fresh Biomass Yield Accumulation as Affected by Weeding Frequency

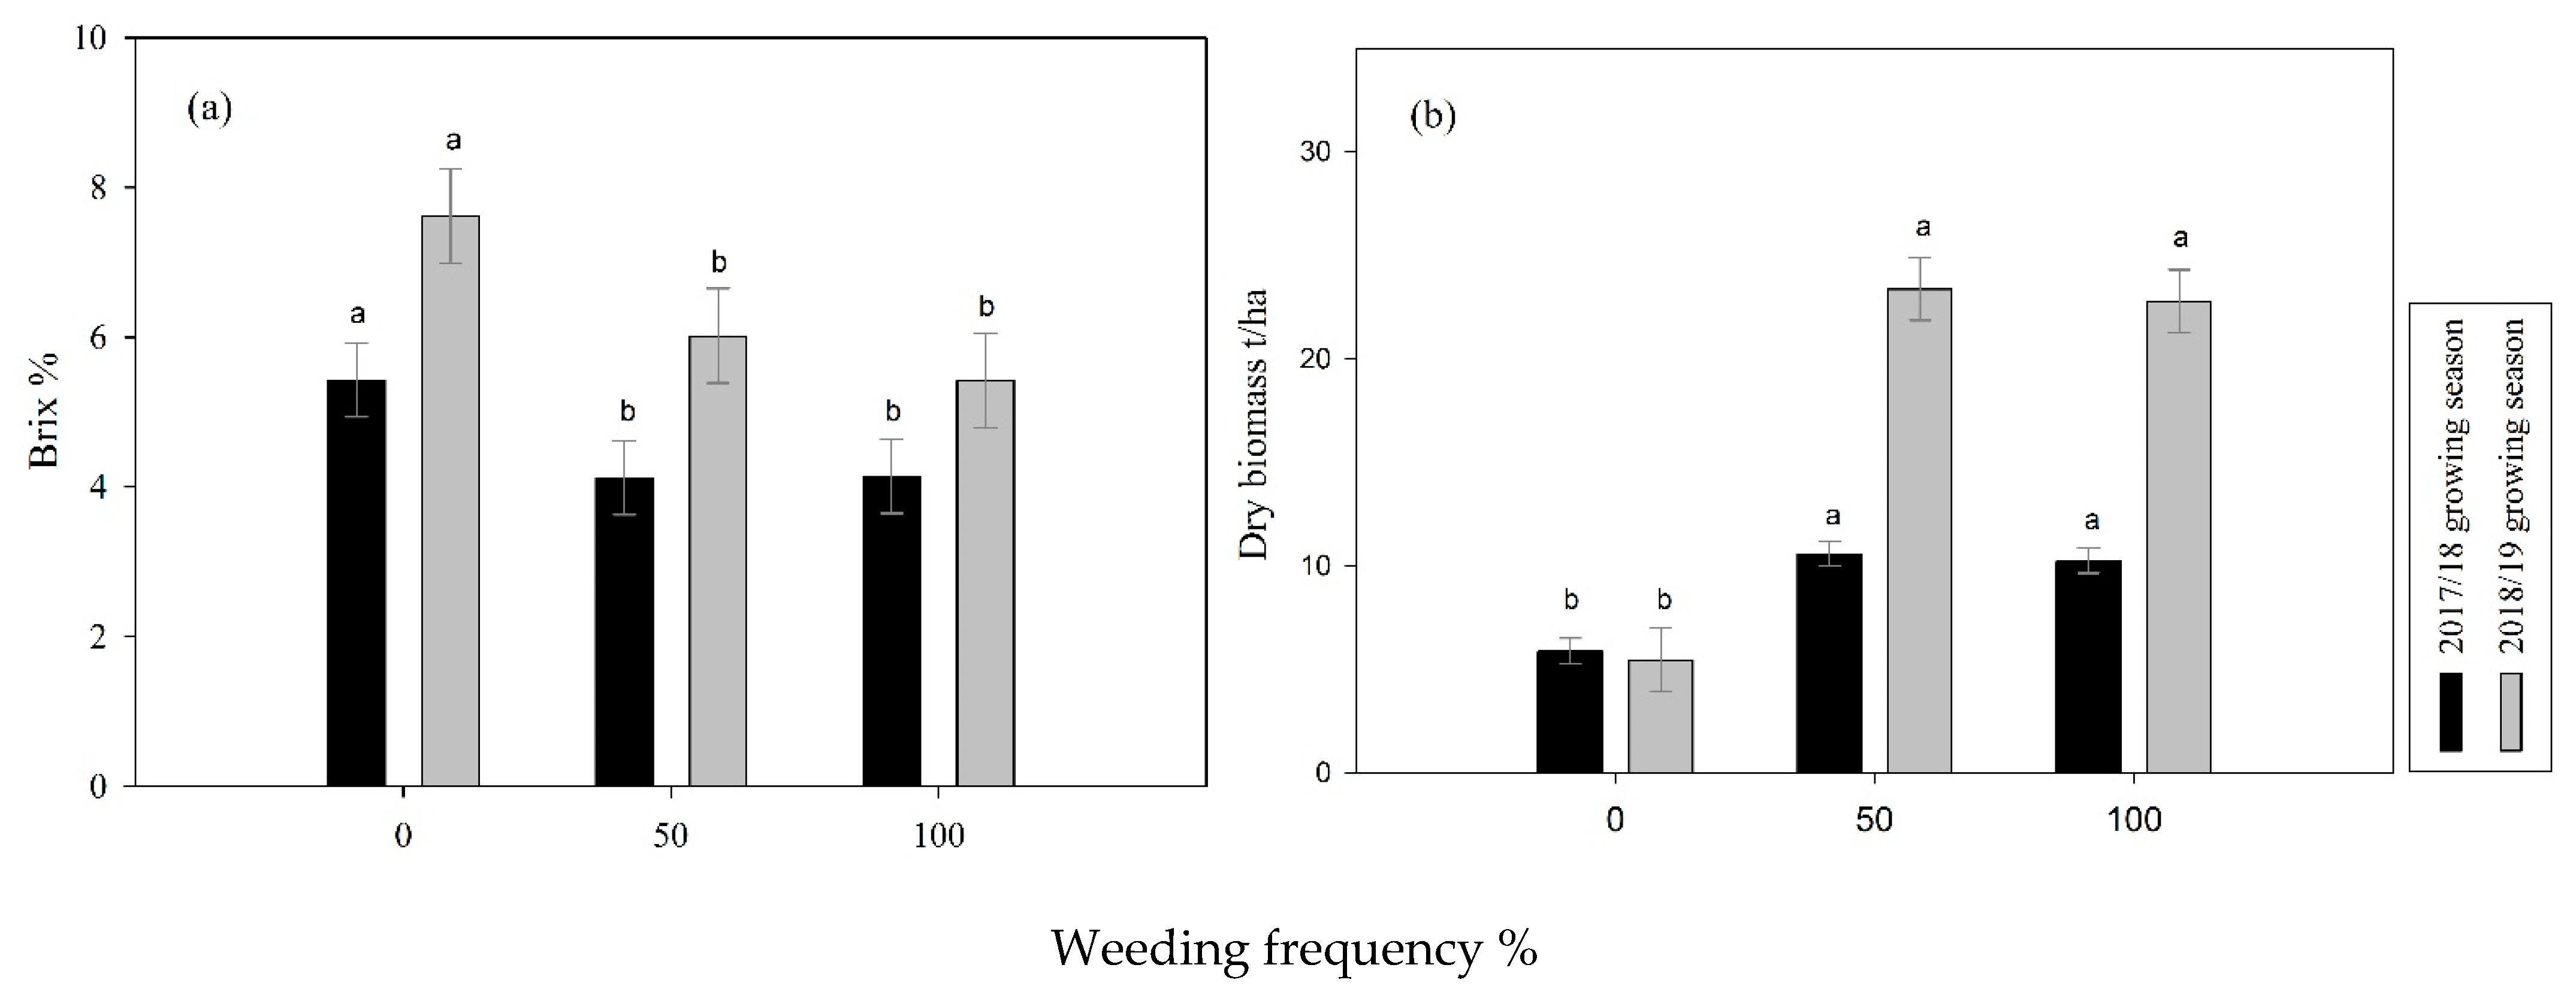
A comparison of the means of Bx during the 2017/18 and 2018/19 growing seasons indicated that Bx was significantly (p < 0.05) higher at 0% weeding frequency and declined as weeding frequency increased; the data further showed no significant differences between 50% and 100% weeding frequency (Figure 2a).
Intercropping pattern had a significant effect on dry biomass during both growing seasons (Figure 2b). Dry biomass was significantly lower at 0% weeding frequency but increased as weeding frequency increased (Figure 2b). Furthermore, the 0% weeding frequency differed significantly to 50% and 100% weeding frequency, but there were no significant differences between 50% and 100% weeding frequency for biomass accumulation during both the 2017/18 and 2018/19 growing seasons (Figure 2b). During the second year (2018/19 growing season), there was a twofold increase in dry biomass accumulation compared to the 2017/18 growing season at 50% and 100% weeding frequency, respectively (Figure 2b).
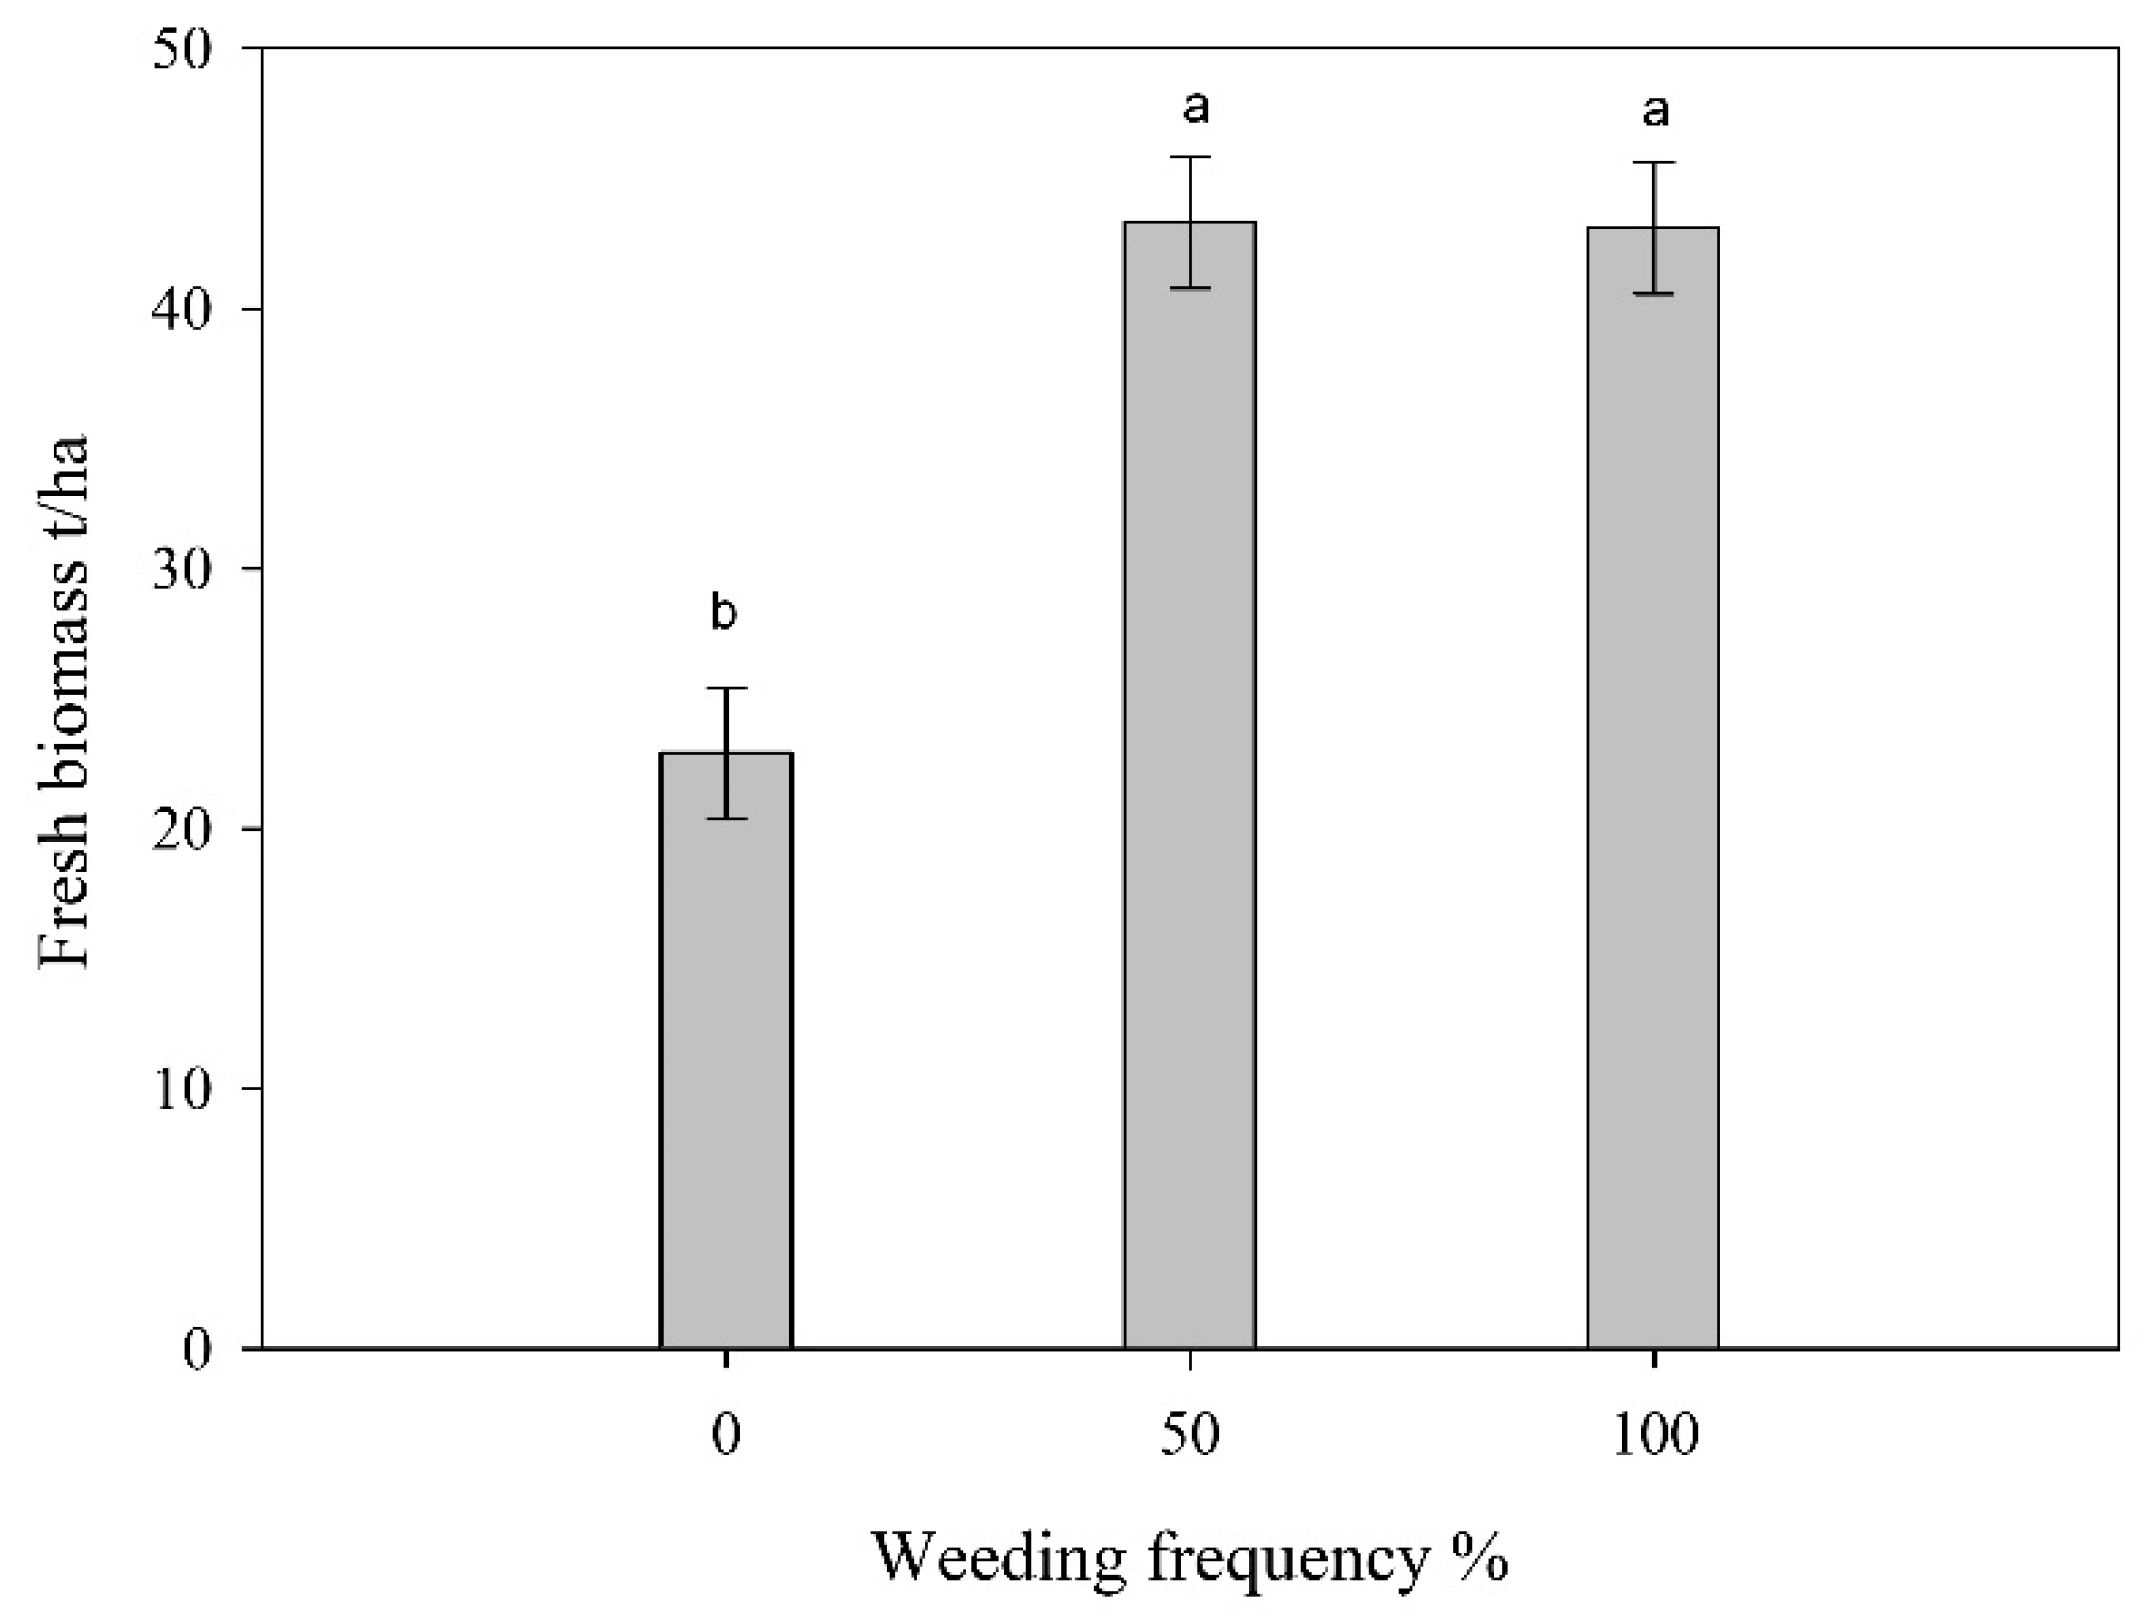
During the 2017/18 growing season, weeding frequency had a significant (p < 0.05) effect on SS fresh biomass (Figure 3). The fresh biomass increased as weeding frequency increased; however, it remained insignificant at 50% and 100% weeding frequency (Figure 3).

3.3. Dry and Fresh Biomass Yield Accumulation as Affected by Intercropping Pattern

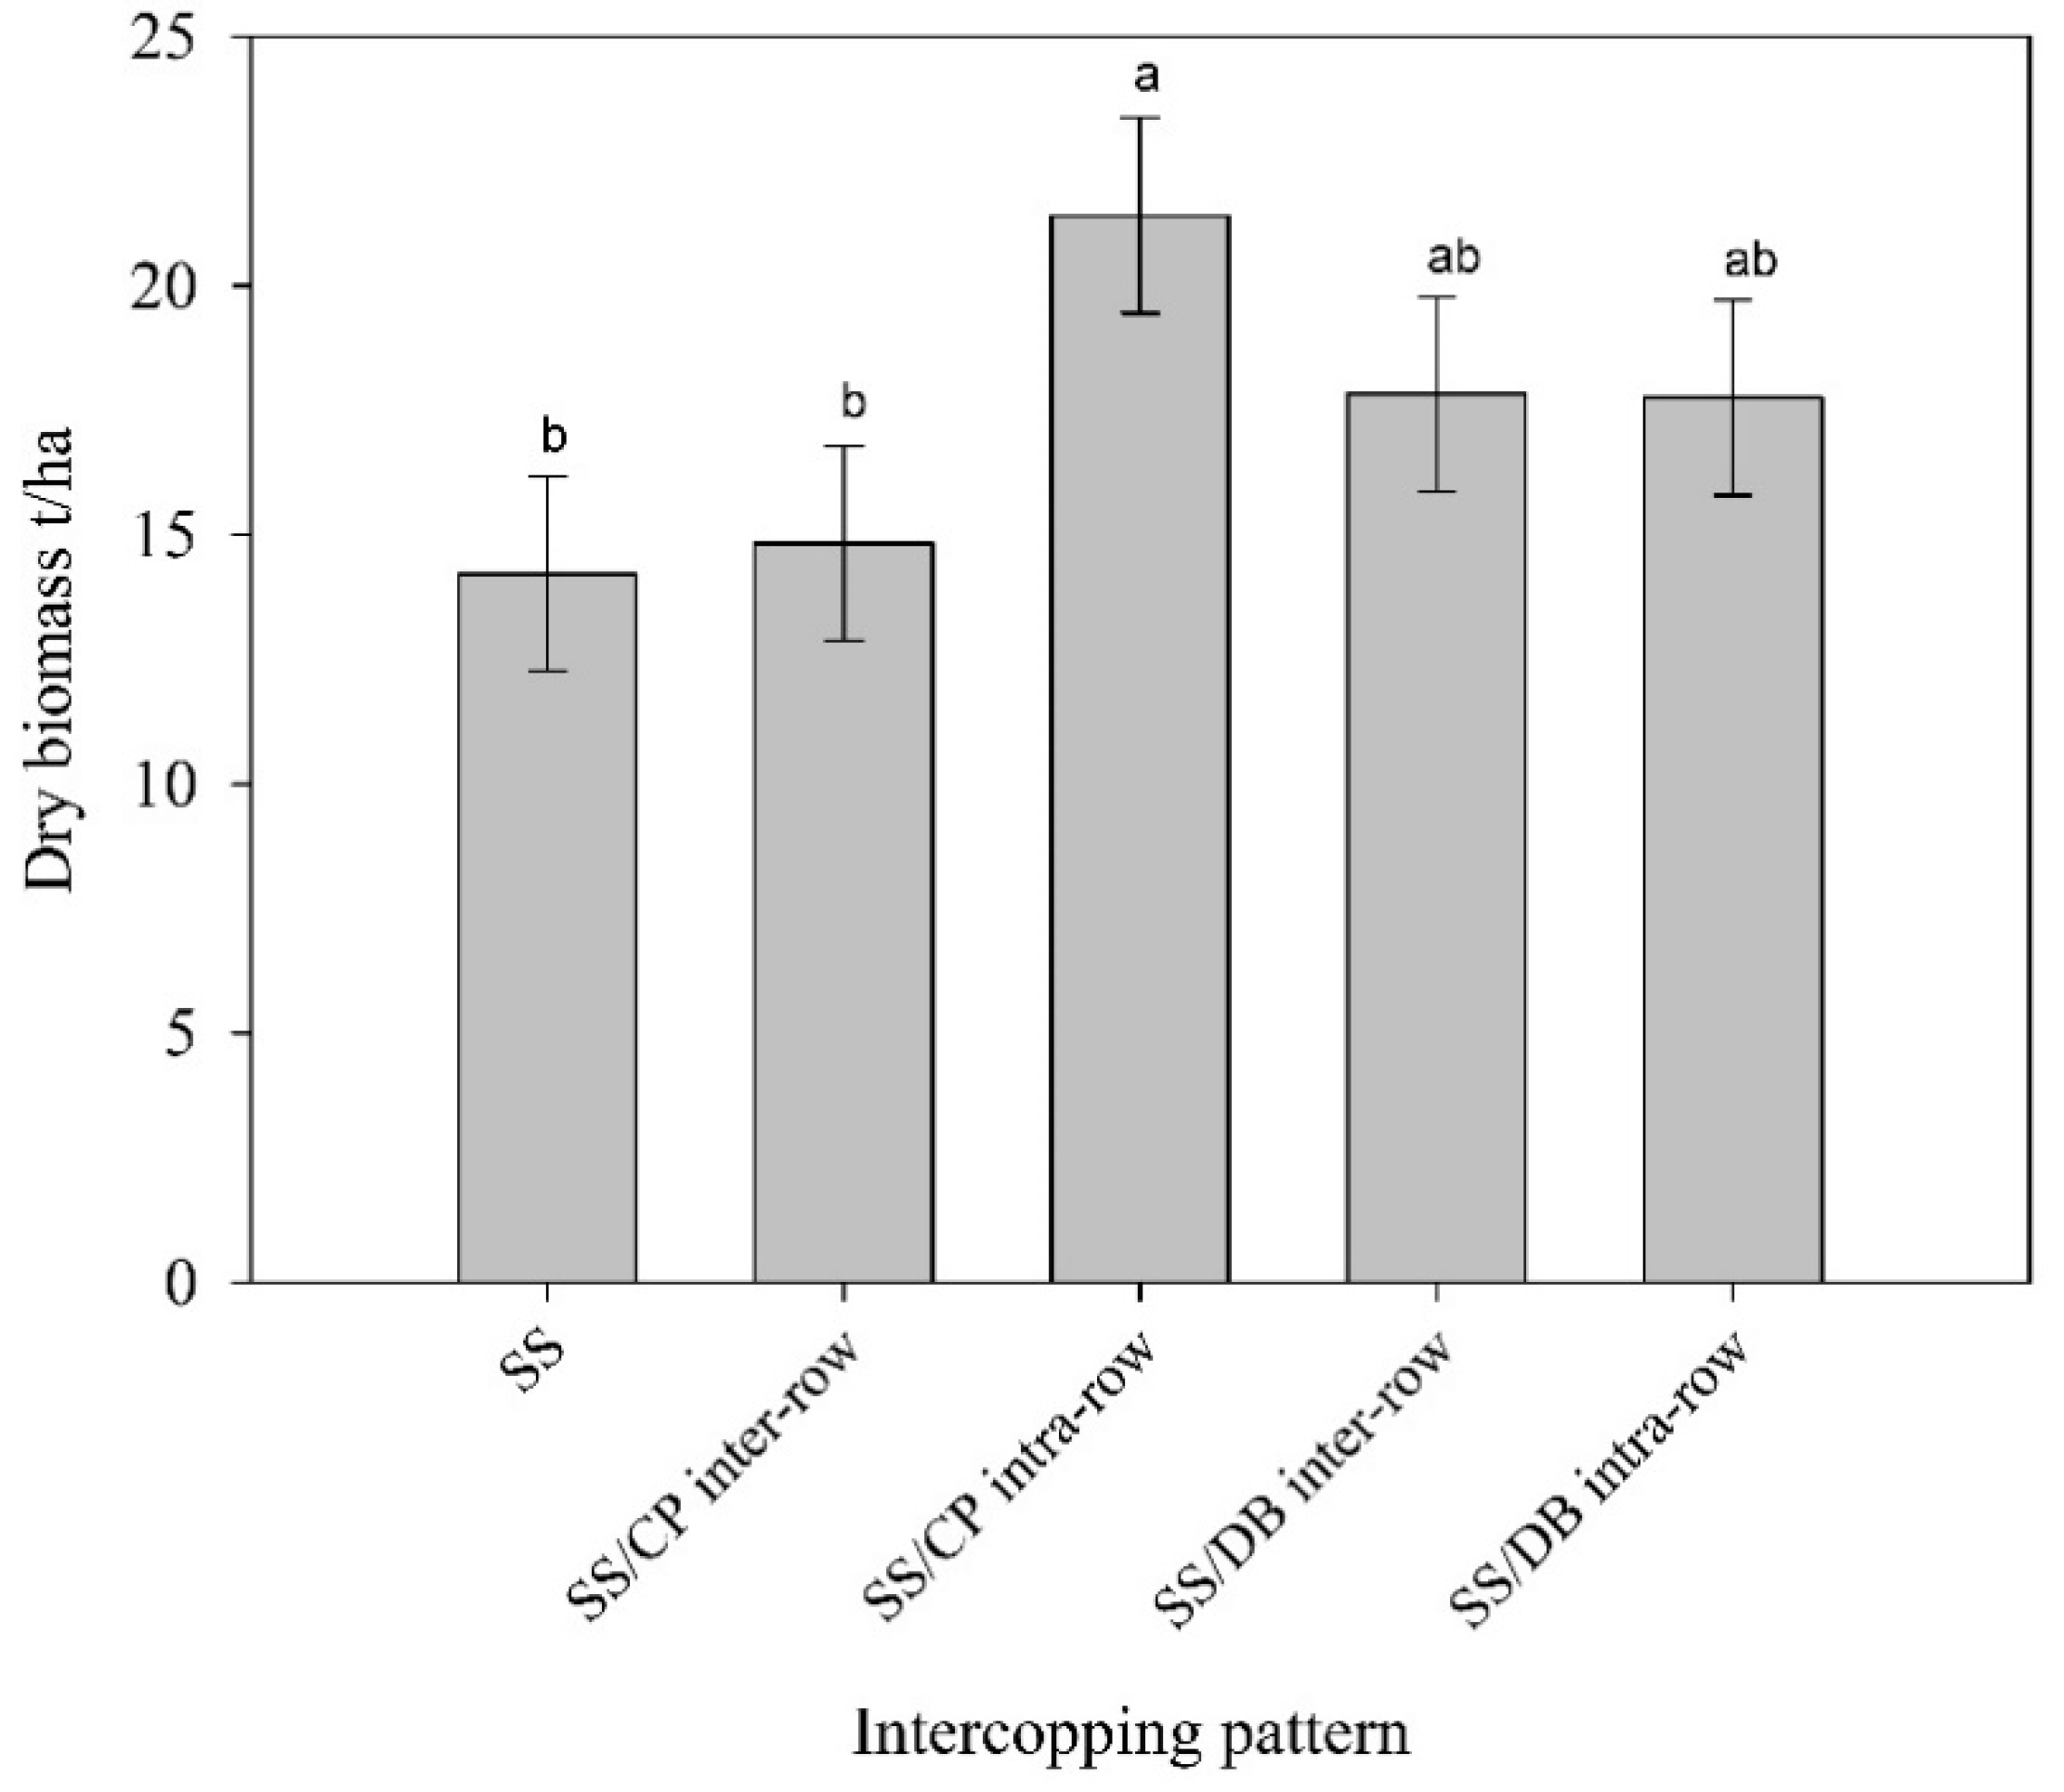
The intercropping pattern significantly (p < 0.05) influenced the dry biomass in the 2018/19 growing season. The sole SS and SS × CP inter-row intercropping (SS/CP inter-row) had the lowest dry biomass accumulation, whereas the SS/CP intra-row intercropping had the highest dry biomass accumulation (Figure 4).
During the 2018/19 growing season, the intercropping pattern × weeding frequency interaction had a significant (p < 0.05) effect on SS fresh biomass (Figure 5). The SS fresh biomass remained lower at intercropping pattern × 0% weeding frequency throughout; however, the biomass increased as weeding frequency increased (Figure 5). The lowest fresh biomass was observed in SS/DB intra-row intercropping × 0% weeding frequency, while the most considerable fresh biomass accumulation was observed in SS/CP intra-row intercropping × 50% and 100% weeding frequency (Figure 5). The intercropping pattern × weeding frequency interaction results showed that SS fresh biomass accumulation significantly increased as weeding frequency increased in the SS/DB inter-row intercropping × weeding frequency. However, under SS/DB intra-row intercropping × weeding frequency, the biomass significantly decreased from 50% to 100% weeding frequency (Figure 5). Furthermore, the other treatment interaction remained insignificant between 50% and 100% weeding frequency (Figure 5).

3.4. Impact of Intercropping Pattern and Weeding Frequency on SS Height and Number of Leaves per Plant

Weeding frequency had a significant effect on SS plant height; the lowest plant height was recorded at 0% weeding frequency and increased as weeding frequency increased to 50%; however, it declined at 100% weeding frequency at 60 DAE in the 2017/18 growing season (Figure 6a). The lowest plant height was observed at 0% weeding frequency and increased as weeding frequency increased from 50% to 100% at 60 and 80 DAE in the 2018/19 growing season (Figure 6a). Weeding frequency significantly affected the SS number of leaves per plant; 50% and 100% weeding frequency had the highest number of leaves per plant at 60 and 80 DAE in the 2017/18 growing season and 80 DAE in the 2018/19 growing season (Figure 6b).
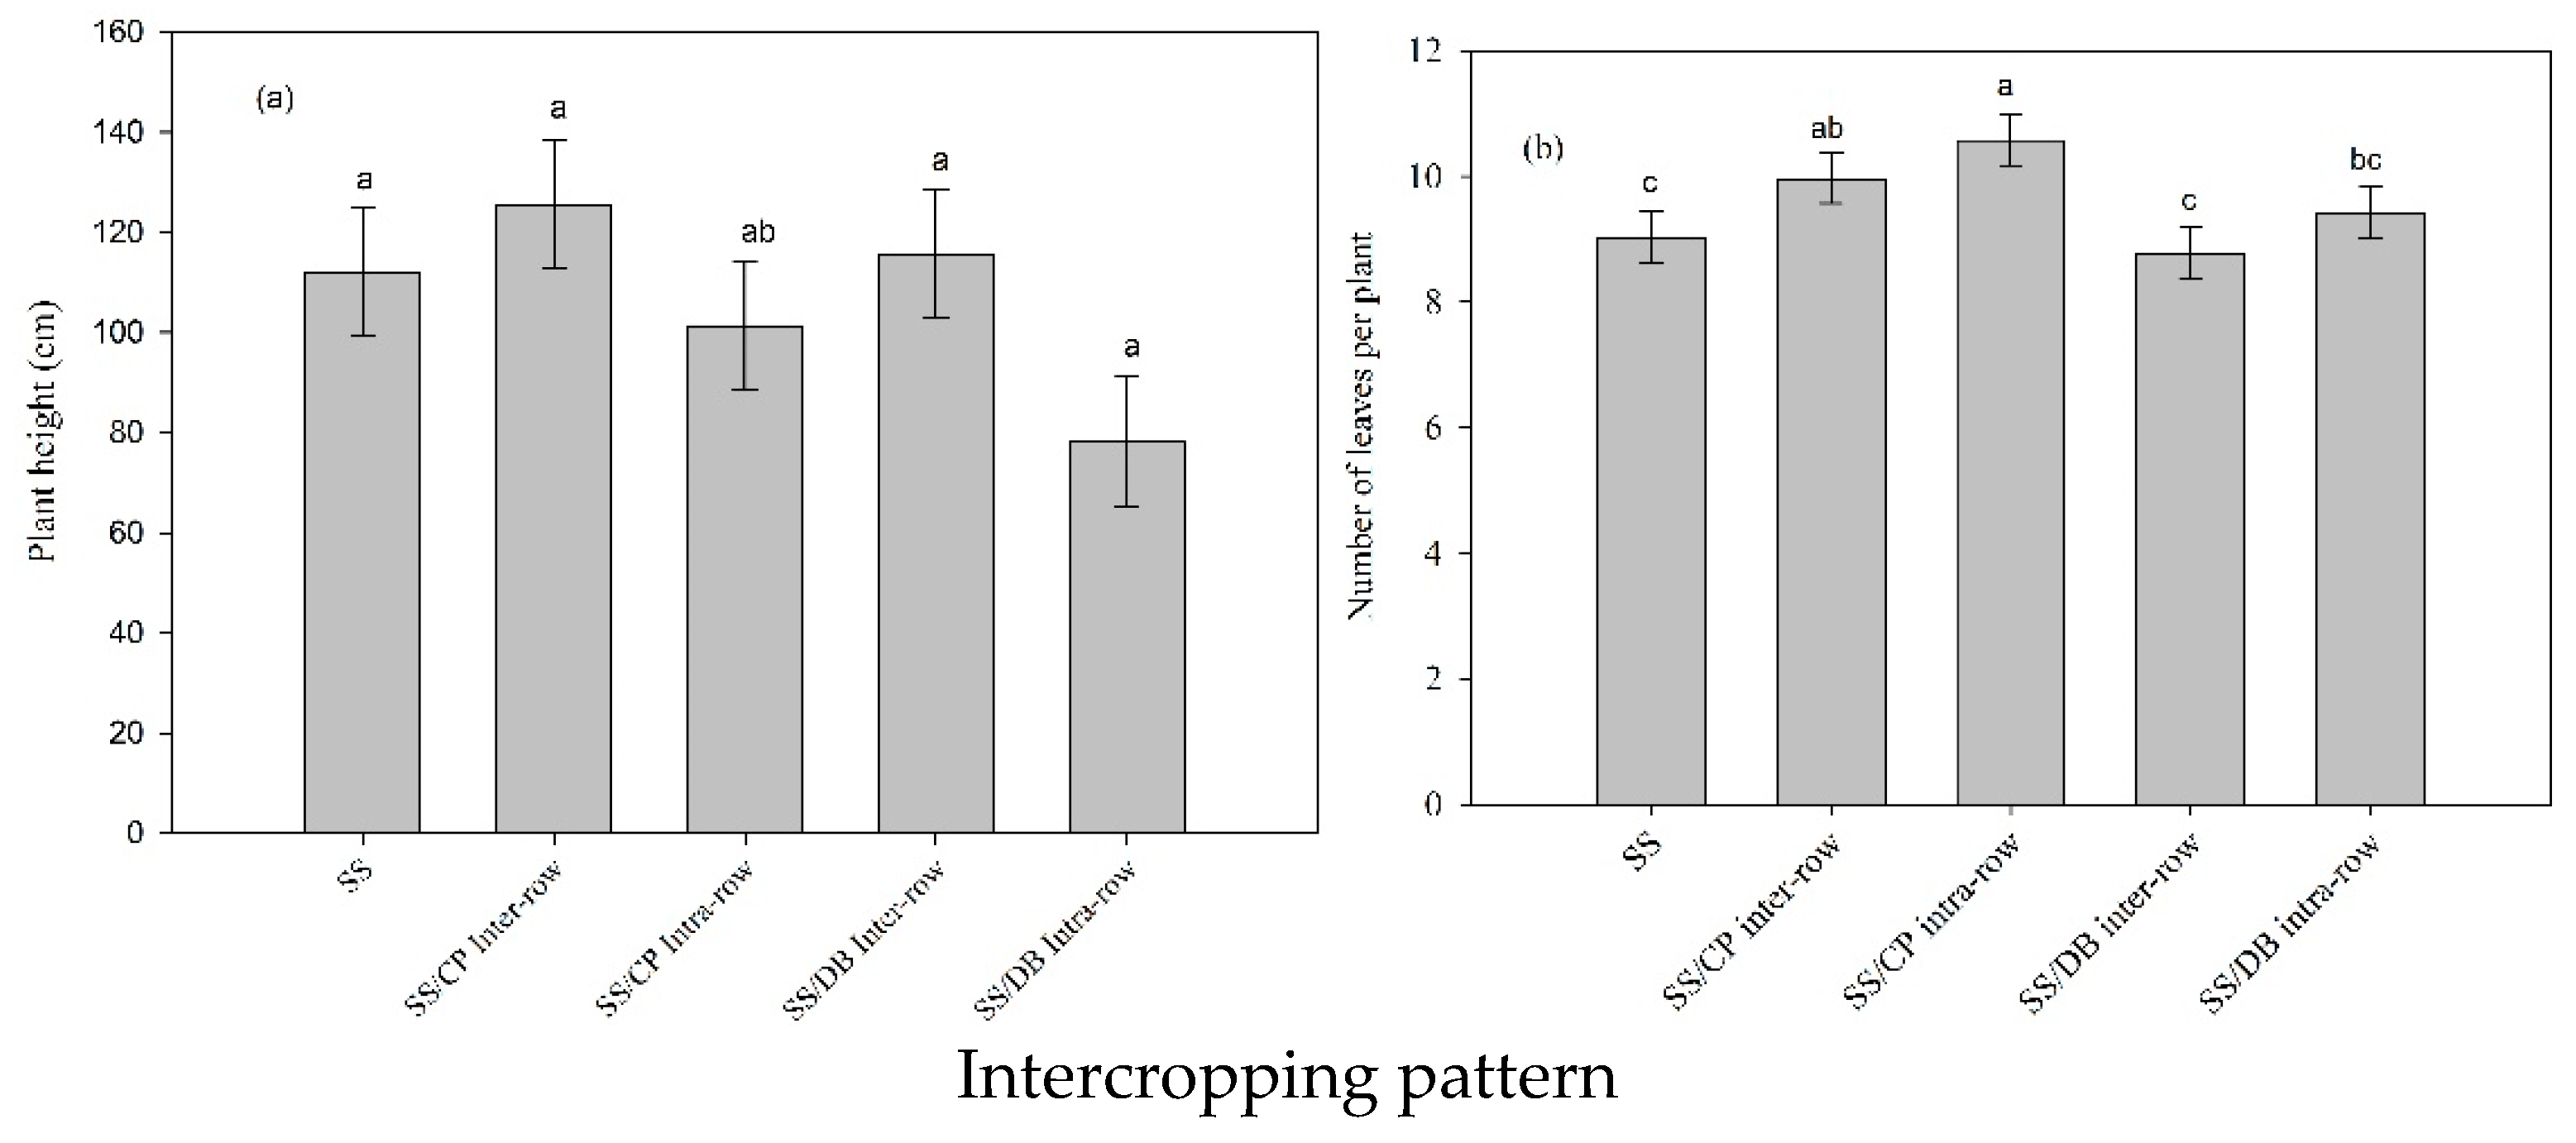
The SS/CP inter-row intercropping had the highest plant height, while SS sole cropping and SS/CP inter-row intercropping had the lowest (Figure 7a). Intercropping pattern influenced SS number of leaves per plant, and SS/CP intra-row intercropping had a significantly higher SS number of leaves, whereas sole SS had the lower SS number of leaves per plant during the 80 DAE in the 2017/18 growing season (Figure 7b).
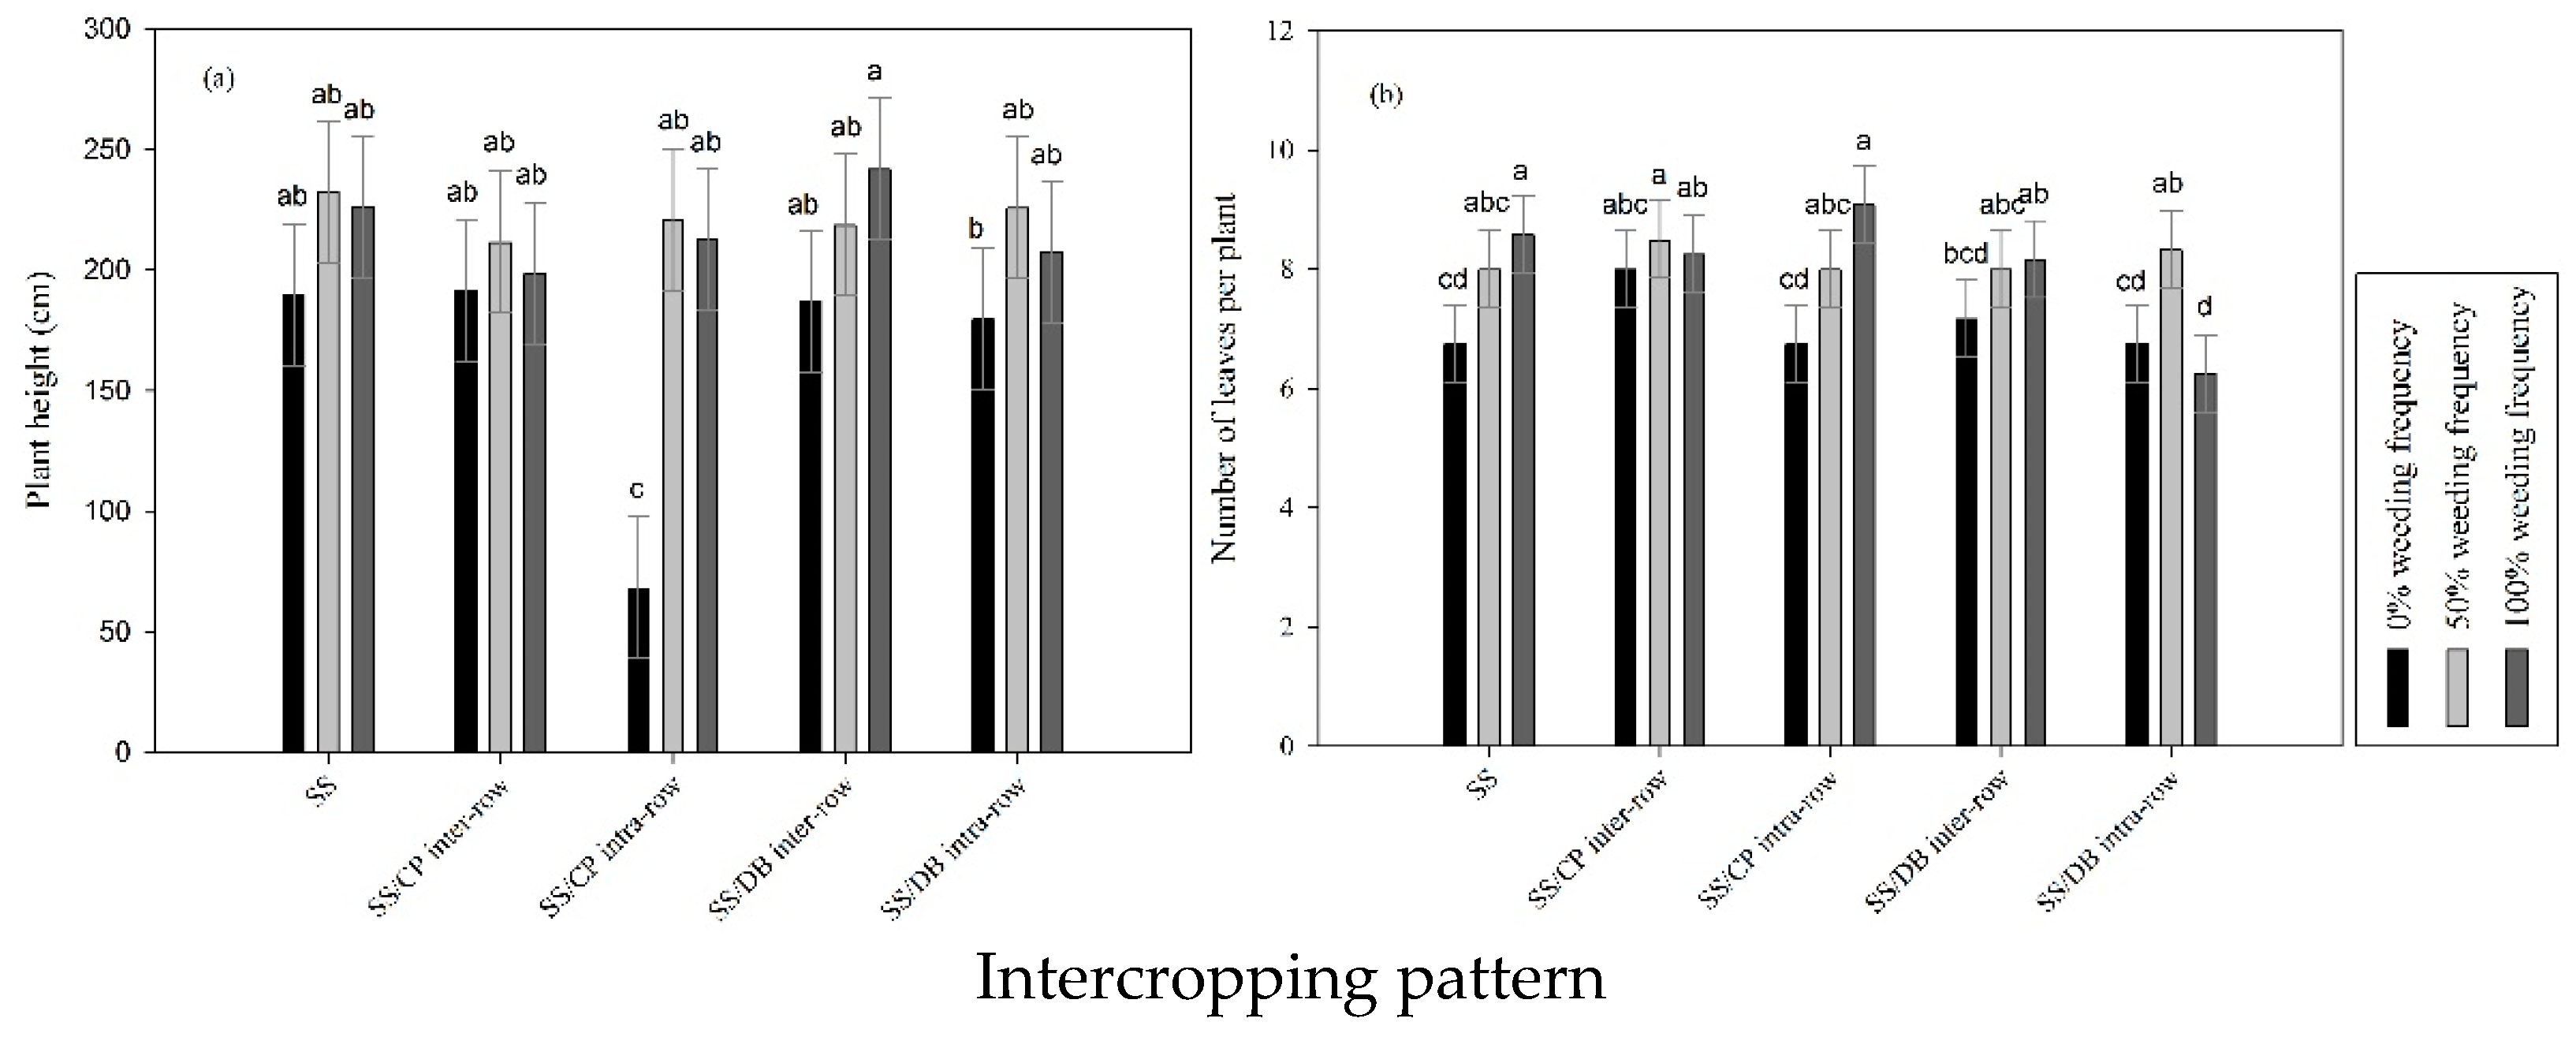
The SS/CP intra-row intercropping × 0% weeding frequency interaction had significantly lower plant height, while SS/DB intra-row intercropping × 100% weeding frequency interaction had the highest plant height; differences among other treatments were insignificant in the 2017/18 growing season (Figure 8a). The intercropping pattern affected SS height, and SS/CP inter-row intercropping had significantly higher SS height, whereas SS/DB intra-row intercropping recorded the lowest SS height for 60 DAE in the 2018/19 growing season (Figure 8a). The SS/CP intra-row intercropping × 100% weeding frequency interaction had the highest number of leaves per plant, whereas SS/DB intra-row intercropping × 100% weeding frequency interaction had the lowest number of leaves per plant 60 DAE in the 2018/19 growing season (Figure 8b).

3.5. LER and PCA Analysis of SS/DB or CP Intercropping in Weed Interference

Land equivalent ratio values were influenced by intercropping pattern and weeding frequency (Table 4). During the 2017/18 growing season, the LER value ranged between 0.91 and 2.69, whereas in the 2018/19 growing season, the LER value ranged between 1.16 and 2.65 (Table 4). The 2017/18 growing season showed that SS/CP intra-row combined with 50% weeding frequency resulted in a greater LER of 2.69 compared to other treatments, while in the 2018/19 growing season, SS/DB intra-row together with 0% weeding frequency resulted in an LER of 2.65, higher than that of other treatments (Table 4).
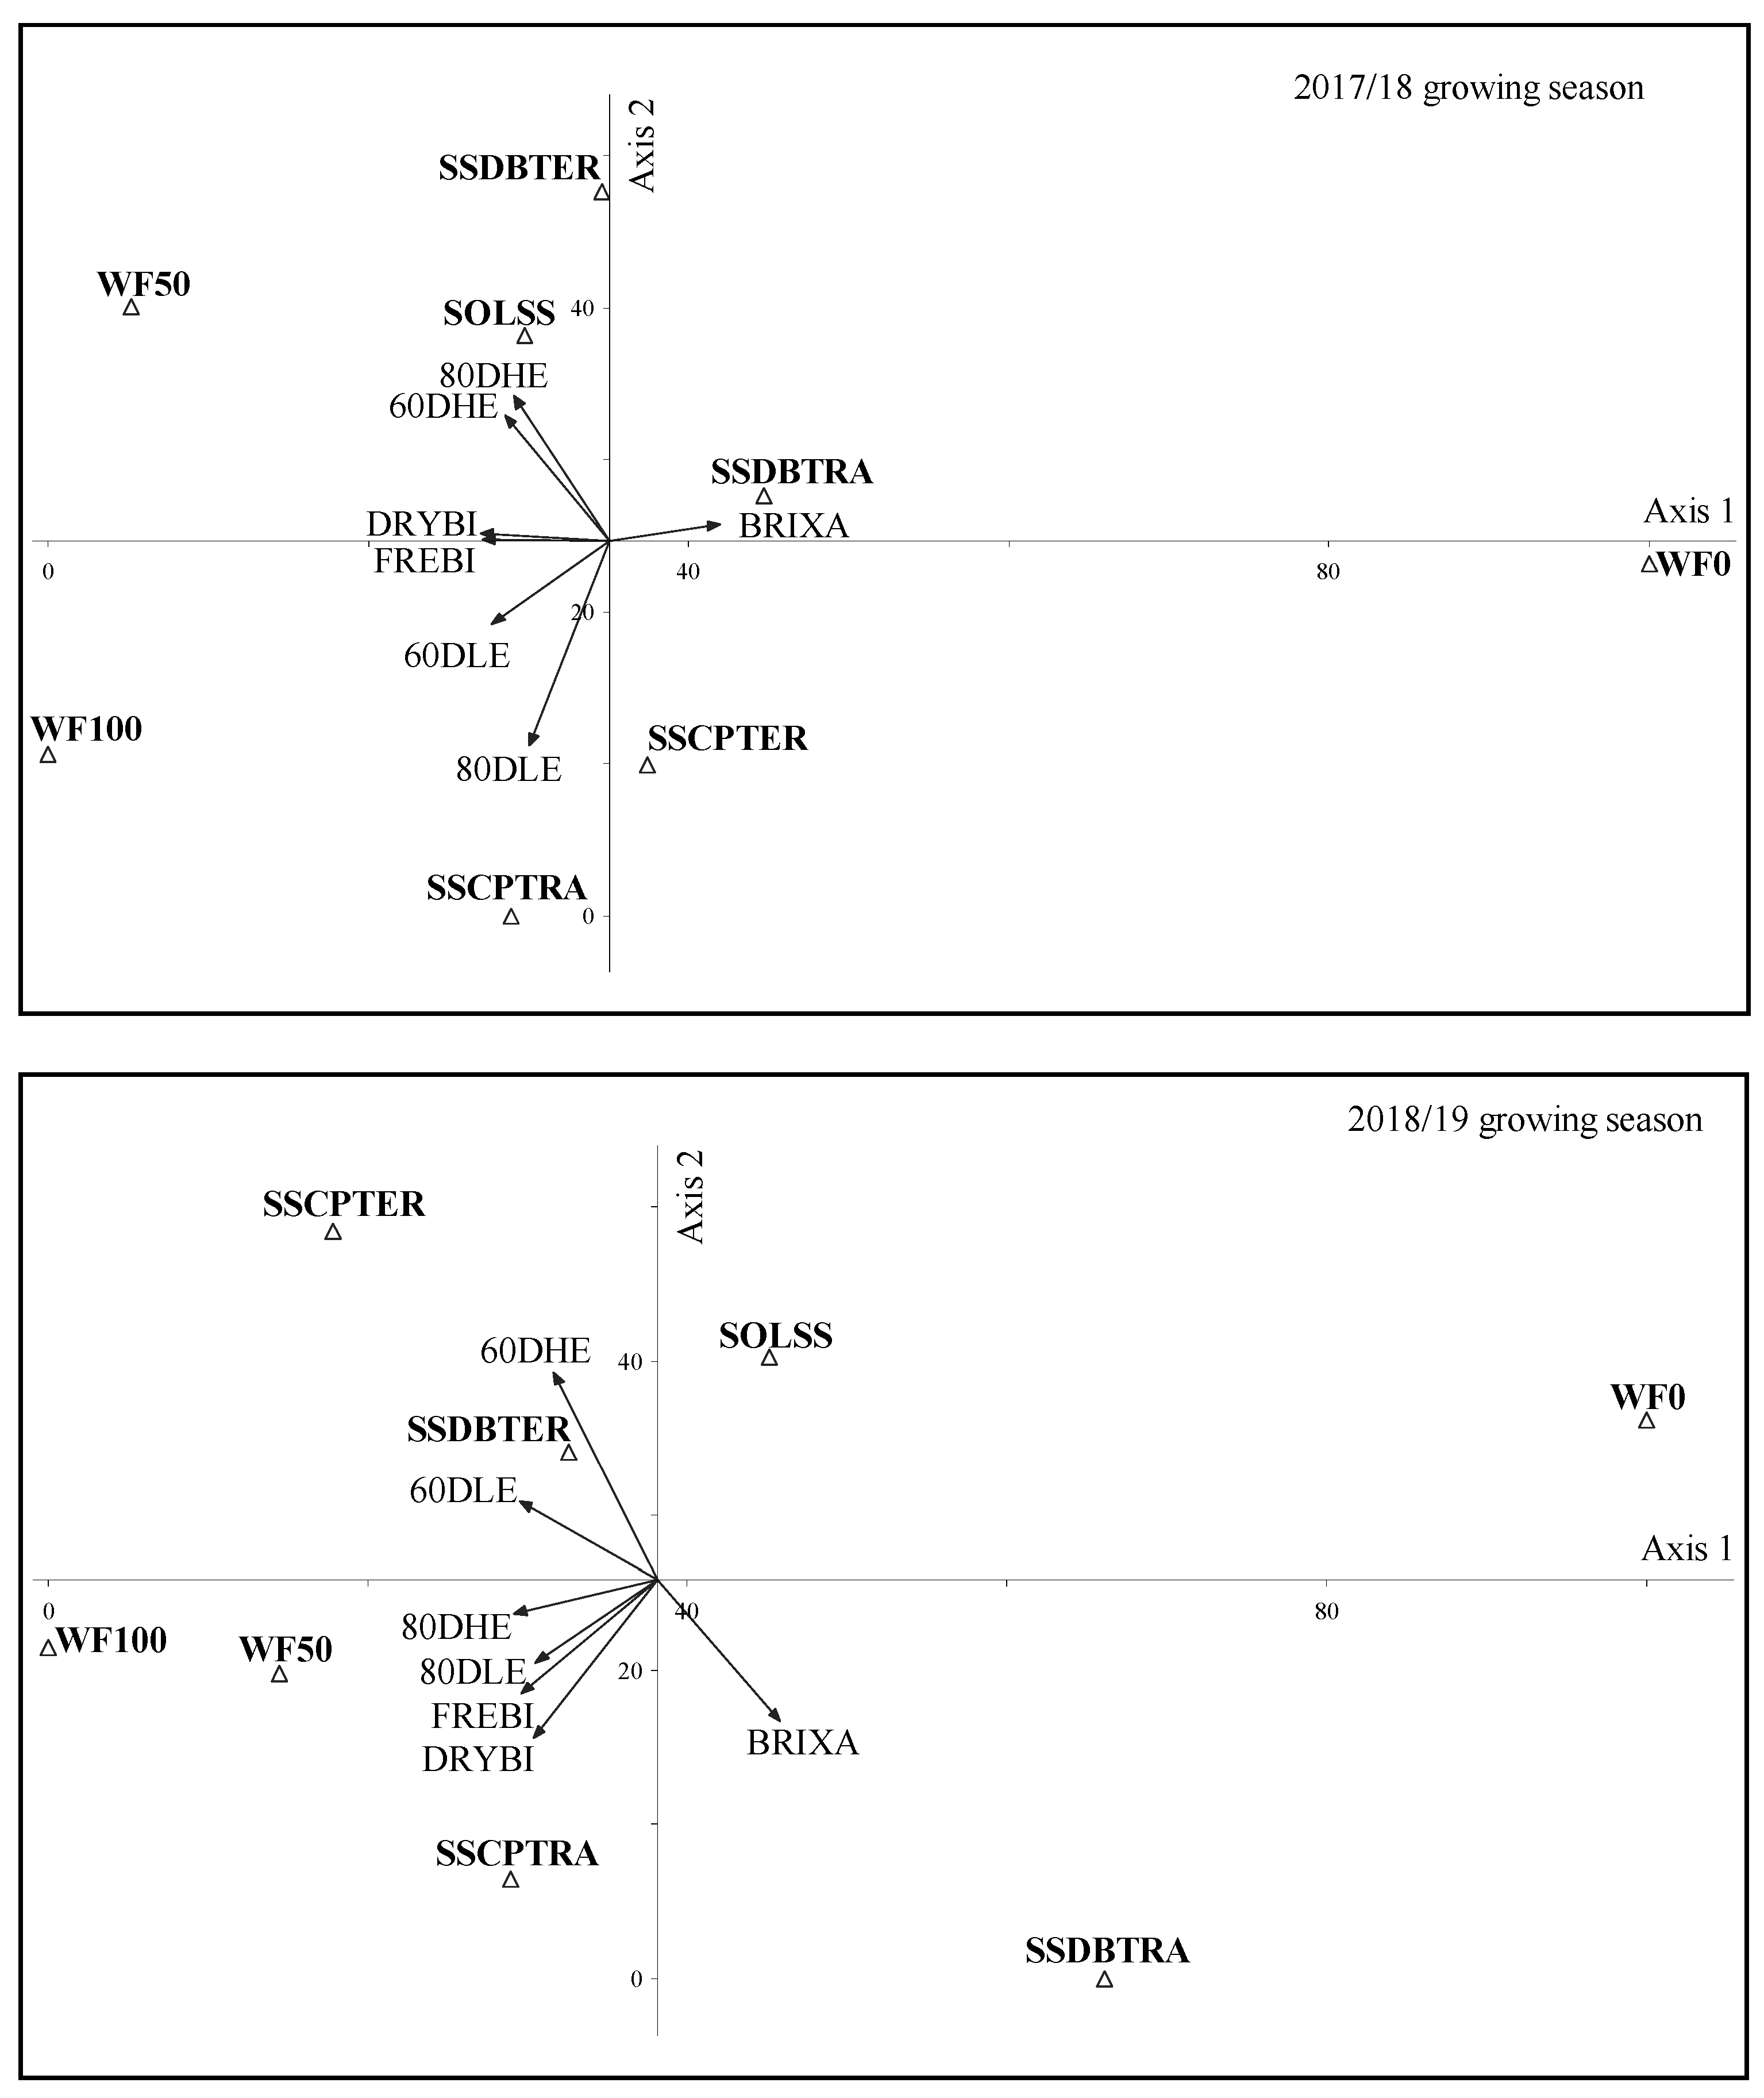
To better understand the Bx, dry biomass, fresh biomass, plant height, and the number of SS leaves in response to intercropping pattern and weeding frequency, PCA was used to analyze their correlation over growing seasons (Figure 9). The first axis showed a significant (p < 0.001) relationship during the 2017/18 and 2018/19 growing seasons with eigenvalues higher than one; the first and second axes were 67.94% and 18.69% for the 2017/18 growing season, while the 2018/19 growing season accounted for 72.98% and 18.71% of the total variation, respectively (Figure 9). The PCA ordination showed a positive and strong correlation between SS/DB intra-row and Bx during the 2017/18 and 2018/19 growing seasons (Figure 9). During the 2017/18 growing season, dry biomass, fresh biomass, 60 DAE, and 80 DAE plant height were associated with sole SS, 50% weeding frequency, and SS/DB inter-row intercropping (Figure 9). Likewise, 60 and 80 DAE number of leaves correlated with 100% weeding frequency and sweet SS/CP inter-row intercropping during the 2017/18 growing season. During the 2018/19 growing season, plant height and the number of leaves after 80 DAE showed a positive correlation with 50% and 100% weeding frequency and SS/CP intra-row intercropping. Plant height and the number of leaves after 60 DAE had a strong association with SS/DB inter-row intercropping and SS/CP inter-row and intra-row intercropping.

4. Discussion

Despite various advantages, SS is still regarded as an underutilized crop due to limited weed management strategies [33]. Furthermore, selecting suitable weed management strategies to achieve an eco-friendly outcome is a daunting task [34]. This study evaluated intercropping pattern and weeding frequency with their interaction on SS Bx, dry and fresh biomass, plant height, and the number of leaves. This study’s findings are of interest in biomass production to better understand the critical weed-free period, particularly in an intercropping system, to maximize biomass production.
The observed results of weeding frequency suggest that the more the weeding frequencies increased, the more the Bx declined, meaning that uncontrolled weed plots accumulated higher Bx than controlled weed plots (Figure 2a). The Brix values were generally low (4.12–5.43% during the 2017/18 growing season and 5.42–7.62% during the 2018/19 growing season) compared with the literature’s values. According to Xavier et al. [35], sorghum seed head detachment significantly increased Bx in the stalks and leaves; this could possibly explain the low Brix values. The Bx content depends on the variety, and it has been estimated to range from 14% to 23% [36]; therefore, one degree Bx is equal to 1 g of sugar per 100 g of juice [37]. These results reaffirm the findings of Silva et al. [38] that SS coexistence with weeds caused an increase in total Bx compared with the hoed controlled plot [38]. The authors further stated that increasing the number of plants per linear meter increased soluble solid content; thus, an increase in intraspecific competition may have adverse effects on water absorption, increasing the soluble solids concentration. Different varieties contain different Bx content, and these depend on several factors, viz. internode position, time of the year, stage of harvesting, environmental conditions [39], day length, global radiation, fertilization, and soil fertility [38]. The radiation usage efficiency, photosynthetic rate, and water absorption are regulated by leaf morphology and root architecture, translating into Bx’s quality [37]. Information about the physiological mechanism around sugar accumulation in SS is still sparse [21]. Sugar content varies inversely with biomass yield within SS germplasm, i.e., high sugar content with lower biomass or low sugar content with high biomass [40]. However, the most favorable genotypes would have higher biomass with high sugar yields [37].
As expected, uncontrolled weed plots had the lowest dry biomass accumulation, whereas the biomass increased as weeding frequency increased (Figure 2b). Therefore, it is worth noting that dry biomass accumulation remained insignificant as weed frequencies further increased from 50% to 100% (Figure 2b). Dry biomass accumulation doubled during the 2018/19 growing season compared to the 2017/18 growing season (Figure 2b). The 2017/18 growing season received high rainfall of 703 mm compared to the 2018/19 growing season of 252.73 mm; this could expound the biomass difference between the two seasons. Similar results were reported by Rad et al. [19], where different precipitation over seasons could explain the different sorghum and forage legume yield accumulation between the growing seasons; however, the authors further stated that the high level of ambient temperature, particularly the minimum temperature, accelerated and increased leaf area and plant growth and, finally, enhanced the forage yield. Moreover, there were also likely nutrient and soil quality improvements between the growing seasons. However, unpredictably SS managed to accumulate higher dry biomass in moisture stress conditions. Under low-rainfall conditions, it could be that the temporal use of radiation by the cropping system was increased by increasing biomass production [31]. Under a water-limited environment, SS plants become dormant but can resume growth immediately under favorable conditions. In contrast, excessive moisture usually reduces overall biomass and stalk juice quality and yield [41]. Thus, high biomass quantities are needed to aid a bio-based economy while maintaining sufficient food production levels and preserving natural resources, and environmental quality is indispensable [42].
The significant effect of weeding frequency on SS fresh biomass accumulation during the 2017/18 growing season showed that uncontrolled weeds had a detrimental effect on SS biomass accumulation (Figure 3). The results showed that SS biomass accumulation increased as weeding frequency increased. However, the insignificant difference between 50% and 100% weeding frequency reflects that SS biomass accumulation is not influenced by further weed control events (Figure 3).
The highest SS dry biomass was observed in SS/CP intercropping during the 2018/19 growing season. This could be that CP had a complete canopy cover; hence it denied weeds the light needed for germination (Figure 4). On the contrary, Chimonyo et al. [31] reported that intercropping insignificantly affected sorghum growth and development.
The significant interaction between intercropping pattern × weeding frequency showed that uncontrolled weeds had a significant impact on SS fresh biomass accumulation during the 2018/19 growing season (Figure 5). The intercropping patterns × 0% weeding frequency during the crop cycle was negatively affected (Figure 5), with a reduction of approximately 55% compared to 50% and 100% weeding frequency. Light interception by a crop canopy is determined by the species’ leaf area index and the leaves’ light absorption characteristics [43]. Thus presumably, high weed density and diversity in uncontrolled weed treatments affected light interception, which plays a crucial role in crop biomass production. Graham et al. [44] reported that high weed density negatively affected leaf area and light absorption, resulting in affected crop yield. These results support Dille et al. [45], who reported that approximately 47% of sorghum total yield was lost due to weed interference.
As different climatic conditions are considered, weeds are a significant hurdle for sorghum growth and yield, with 18–97% losses reported due to weeds [33]. A constant increase in atmospheric CO2 negatively affects vegetative growth in most C4 crops; therefore, this puts the C4 crop in a susceptible position to compete against its counterparts C3 weeds, and yield potential declines [46].
Moreover, increasing concerns about environmental and human health have reduced reliance on agrochemicals to control weeds worldwide [47]. Research focusing on combining cultural weed control strategies with mechanical and chemical methods could reduce herbicide use, thus improving sustainable weed control strategies [48]. With different environmental conditions in mind, a competitive cultivar in one region would not be as competitive as other regions [33]. The lack of modern technology implements in developing countries exacerbates the intra-row weed control hurdle faced by farmers who typically use handheld hoes and spades [49]. However, it is difficult to control weeds within intra-rows without injuring the crop [50].
The insignificant differences observed between intermediate and high weeding frequencies (Figure 6a,b) could be the result of crop canopy cover due to high plant population and uniform crop distribution affecting weeds’ light interception through shading [51]. Therefore, the filtered light quality of solar radiation reaching the ground surface affects weed seed germination [52]. The shading provided by faster canopy cover reduced weed germination, growth, and establishment [53]. The highest plant height in SS/CP inter-row intercropping could be due to the crops harmoniously utilizing the environmental resources with less competition for water, nutrients, and light (Figure 7a); this could also explain highest number of leaves per plant for the SS/CP intra-raw intercropping (Figure 7b). The appropriate selection of legumes in the intercropping system and increasing diversity can reduce the ability of weeds to compete for resources [19]. There is a direct propositional relationship between plant height and biomass [37]. The 80 DAE plant height results during the 2017/18 growing season showed that SS height under uncontrolled weed plots were significantly affected by the SS/CP intra-row intercropping × 0% weeding frequency interaction; however, the other treatment combination remained insignificant (Figure 8a). These results support the findings of Silva et al. [38] that uncontrolled weeds during the crop cycle negatively affected sorghum’s plant height. Intercropping pattern and weed interference affected the number of leaves (Figure 8b); thus, these results support the work of Shukla et al. [21], which found that competition reduced the number of leaves present. The authors further stated that the more sorghum plant remains vegetative, the higher the number of leaves; thus, the internode length and maturity influence the plant height.
Intercropping pattern and weeding frequency influenced the LER values; however, the intra-row intercropping pattern had greater values than the inter-row intercropping pattern (Table 4). Moreover, all the intercropping treatments had an LER above 1.0 except for 0% weeding frequency, signifying that intercropping was advantageous over sole cropping.
The PCA ordination highlighted crucial information on the intercropping pattern and weeding frequency concerning the sweet sorghum’s agronomic traits. The PCA ordination showed that Bx was consistent and had a strong association with SS/DB intra-row in both growing seasons. The different amounts of rainfall received within the two seasons could have contributed to the inconsistency of the number of leaves and plant height relation with SS/CP intra-row intercropping, SS/CP inter-row intercropping, and other variables.

5. Conclusions

Low SS biomass production was associated with the 0% weeding frequency, conversely resulting in higher sugar content Bx. Based on the observed results, after eight weeks of crop emergence, the weed control applications were not necessarily beneficial. Since SS biomass yield and Bx remained insignificant at 50% and 100% weeding frequencies, high crop injuries were noted. The intercropping pattern × weeding frequency interaction effect showed that fresh biomass, plant height, and the number of leaves per plant remained low at 0% weeding frequency; however, they increased as weeding frequency increased across all the intercropping patterns. The fresh biomass accumulation improved under intercropping with legumes compared to sole cropping.
Furthermore, dry biomass yield was highest under intra-row intercropping compared to other cropping arrangements. Therefore, looking at the dramatic difference in biomass yield between the two growing seasons, SS proved to be drought-tolerant and subsequently exhibited improved performance in moisture-limited conditions, and this can be explained by the different mm of rainfall received between the growing seasons. In general, the LER results showed that intra-row intercropping had superior performance compared to inter-row intercropping plots. The PCA analysis ordination proved that higher Brix was consistently associated with SS/DB intra-row intercropping over the seasons.

Author Contributions

Conceptualization, C.B. and A.T.M.; methodology, C.B. and A.T.M.; resources, C.B.; data curation, C.B.; writing—original draft preparation, C.B.; writing—review and editing, C.B., A.T.M., and A.D.N.; supervision, A.T.M. and A.D.N.; funding acquisition, A.D.N. and A.T.M. All authors have read and agreed to the published version of the manuscript.

Funding

This study was funded by the Agricultural Research Council—Soil, Climate and Water (ARC-SCW) and the University of KwaZulu-Natal.

Institutional Review Board Statement

Not applicable.

Informed Consent Statement

Not applicable.

Data Availability Statement

The data presented in this study are available in the manuscript.

Acknowledgments

Agricultural Research Council—Soil, Climate and Water (ARC-SCW) and the University of KwaZulu-Natal.

Conflicts of Interest

The authors declare no conflict of interest.

References

  1. Mabhaudhi, T.; Chimonyo, V.G.P.; Chibarabada, T.P.; Modi, A.T. Developing a Roadmap for Improving Neglected and Underutilized Crops: A Case Study of South Africa. Front. Plant Sci. 2017, 8, 2143. [Google Scholar] [CrossRef] [PubMed]
  2. Tang, S.; Wang, Z.; Chen, C.; Xie, P.; Xie, Q. The Prospect of Sweet Sorghum as the Source for High Biomass Crop. J. Agric. Sci. Bot. 2018, 2. [Google Scholar] [CrossRef]
  3. Gomiero, T. Are Biofuels an Effective and Viable Energy Strategy for Industrialized Societies? A Reasoned Overview of Potentials and Limits. Sustainability 2015, 7, 8491–8521. [Google Scholar] [CrossRef] [Green Version]
  4. Hadebe, S.T.; Modi, A.T.; Mabhaudhi, T. Drought Tolerance and Water Use of Cereal Crops: A Focus on Sorghum as a Food Security Crop in Sub-Saharan Africa. J. Agron. Crop Sci. 2017, 203, 177–191. [Google Scholar] [CrossRef]
  5. Prasad, S.; Sheetal, K.R.; Renjith, P.S.; Kumar, A.; Kumar, S. Sweet Sorghum: An Excellent Crop for Renewable Fuels Production. In Prospects of Renewable Bioprocessing in Future Energy Systems; Rastegari, A.A., Yadav, A.N., Gupta, A., Eds.; Springer International Publishing: Cham, Switzerland, 2019; pp. 291–314. [Google Scholar] [CrossRef]
  6. Damasceno, C.M.B.; Schaffert, R.E.; Dweikat, I. Mining Genetic Diversity of Sorghum as a Bioenergy Feedstock. In Plants and BioEnergy; McCann, M.C., Buckeridge, M.S., Carpita, N.C., Eds.; Springer New York: New York, NY, USA, 2014; pp. 81–106. [Google Scholar] [CrossRef]
  7. Bassam, N.E. Handbook of Bioenergy Crops: A Complete Reference to Species, Development and Applications; Routledge Studies in Bioenergy Series; Earthscan: London, UK, 2010. [Google Scholar]
  8. Martin-Guay, M.-O.O.; Paquette, A.; Dupras, J.; Rivest, D. The New Green Revolution: Sustainable Intensification of Agriculture by Intercropping. Sci. Total Environ. 2018, 615, 767–772. [Google Scholar] [CrossRef]
  9. Jensen, E.S.; Carlsson, G.; Hauggaard-Nielsen, H. Intercropping of Grain Legumes and Cereals Improves the Use of Soil N Resources and Reduces the Requirement for Synthetic Fertilizer N: A Global-Scale Analysis. Agron. Sustain. Dev. 2020, 40. [Google Scholar] [CrossRef] [Green Version]
  10. Feike, T.; Doluschitz, R.; Chen, Q.; Graeff-Hönninger, S.; Claupein, W. How to Overcome the Slow Death of Intercropping in the North China Plain. Sustainability 2012, 4, 2550–2565. [Google Scholar] [CrossRef] [Green Version]
  11. Peoples, M.B.; Hauggaard-Nielsen, H.; Huguenin-Elie, O.; Jensen, E.S.; Justes, E.; Williams, M. Chapter 8—The Contributions of Legumes to Reducing the Environmental Risk of Agricultural Production; Lemaire, G., Carvalho, P.C.D.F., Kronberg, S., Recous, S.B.T.-A.D., Eds.; Academic Press: Cambridge, MA, USA, 2019; pp. 123–143. [Google Scholar] [CrossRef]
  12. Boudreau, M.A. Diseases in Intercropping Systems. Annu. Rev. Phytopathol. 2013, 51, 499–519. [Google Scholar] [CrossRef]
  13. Lopes, T.; Hatt, S.; Xu, Q.; Chen, J.; Liu, Y.; Francis, F. Wheat (Triticum Aestivum L.)-Based Intercropping Systems for Biological Pest Control. Pest Manag. Sci. 2016, 72, 2193–2202. [Google Scholar] [CrossRef]
  14. Korres, N.E. Chapter 6—Agronomic Weed Control: A Trustworthy Approach for Sustainable Weed Management; Jabran, K., Chauhan, B.S.B.T.-N.-C.W.C., Eds.; Academic Press: Cambridge, MA, USA, 2018; pp. 97–114. [Google Scholar] [CrossRef]
  15. Burnside, O.C.; Wicks, G.A. The Effect of Weed Removal Treatments on Sorghum Growth. Weeds 1967, 15, 204–207. [Google Scholar] [CrossRef]
  16. Smith, B.S.; Murray, D.S.; Green, J.D.; Wanyahaya, W.M.; Weeks, D.L. Interference of Three Annual Grasses with Grain Sorghum (Sorghum bicolor). Weed Technol. 1990, 4, 245–249. [Google Scholar] [CrossRef]
  17. Xu, Y.; He, R.; Gao, Z.; Li, C.; Zhai, Y.; Jiao, Y. Weed Density Detection Method Based on Absolute Feature Corner Points in Field. Agronomy 2020, 10, 113. [Google Scholar] [CrossRef] [Green Version]
  18. Capinera, J.L. Relationships between Insect Pests and Weeds: An Evolutionary Perspective. Weed Sci. 2005, 53, 892–901. [Google Scholar] [CrossRef]
  19. Rad, S.V.; Valadabadi, S.A.R.; Pouryousef, M.; Saifzadeh, S.; Zakrin, H.R.; Mastinu, A. Quantitative and Qualitative Evaluation of Sorghum bicolor L. under Intercropping with Legumes and Different Weed Control Methods. Horticulturae 2020, 6, 78. [Google Scholar] [CrossRef]
  20. Yadav, P.; Priyanka, P.; Kumar, D.; Yadav, A.; Yadav, K. Bioenergy Crops: Recent Advances and Future Outlook. In Prospects of Renewable Bioprocessing in Future Energy Systems; Rastegari, A.A., Yadav, A.N., Gupta, A., Eds.; Springer International Publishing: Cham, Switzerland, 2019; pp. 315–335. [Google Scholar] [CrossRef]
  21. Shukla, S.; Felderhoff, T.J.; Saballos, A.; Vermerris, W. The Relationship between Plant Height and Sugar Accumulation in the Stems of Sweet Sorghum (Sorghum bicolor (L.) Moench). Field Crops Res. 2017, 203, 181–191. [Google Scholar] [CrossRef]
  22. Hauggaard-Nielsen, H.; Jensen, E.S. Facilitative Root Interactions in Intercrops. Plant Soil 2005, 274, 237–250. [Google Scholar] [CrossRef]
  23. Bilalis, D.; Papastylianou, P.; Konstantas, A.; Patsiali, S.; Karkanis, A.; Efthimiadou, A. Weed-Suppressive Effects of Maize–Legume Intercropping in Organic Farming. Int. J. Pest Manag. 2010, 56, 173–181. [Google Scholar] [CrossRef]
  24. Dayoub, E.; Naudin, C.; Piva, G.; Shirtliffe, S.J.; Fustec, J.; Corre-Hellou, G. Traits Affecting Early Season Nitrogen Uptake in Nine Legume Species. Heliyon 2017, 3, e00244. [Google Scholar] [CrossRef] [PubMed] [Green Version]
  25. Corre-Hellou, G.; Dibet, A.; Hauggaard-Nielsen, H.; Crozat, Y.; Gooding, M.; Ambus, P.; Dahlmann, C.; von Fragstein, P.; Pristeri, A.; Monti, M.; et al. The Competitive Ability of Pea–Barley Intercrops against Weeds and the Interactions with Crop Productivity and Soil N Availability. Field Crops Res. 2011, 122, 264–272. [Google Scholar] [CrossRef] [Green Version]
  26. Naudin, C.; Corre-Hellou, G.; Pineau, S.; Crozat, Y.; Jeuffroy, M.-H. The Effect of Various Dynamics of N Availability on Winter Pea–Wheat Intercrops: Crop Growth, N Partitioning and Symbiotic N2 Fixation. Field Crops Res. 2010, 119, 2–11. [Google Scholar] [CrossRef]
  27. Li, F.Y.; Jamieson, P.D.; Johnstone, P.R.; Pearson, A.J. Mechanisms of Nitrogen Limitation Affecting Maize Growth: A Comparison of Different Modelling Hypotheses. Crop Pasture Sci. 2009, 60, 738–752. [Google Scholar] [CrossRef]
  28. Fayaud, B.; Coste, F.; Corre-Hellou, G.; Gardarin, A.; Dürr, C. Modelling Early Growth under Different Sowing Conditions: A Tool to Predict Variations in Intercrop Early Stages. Eur. J. Agron. 2014, 52, 180–190. [Google Scholar] [CrossRef]
  29. Stagnari, F.; Maggio, A.; Galieni, A.; Pisante, M. Multiple Benefits of Legumes for Agriculture Sustainability: An Overview. Chem. Biol. Technol. Agric. 2017, 4, 2. [Google Scholar] [CrossRef] [Green Version]
  30. Fundira, T.; Henley, G. Biofuels in Southern Africa: Political Economy, Trade, and Policy Environment; WIDER Working Papers; World Institute for Development Economics Research (UNU-WIDER): Helsinki, Finland; United Nations University: Tokyo, Japan, 2017. [Google Scholar] [CrossRef] [Green Version]
  31. Chimonyo, V.G.P.; Modi, A.T.; Mabhaudhi, T. Assessment of Sorghum–Cowpea Intercrop System under Water-Limited Conditions Using a Decision Support Tool. Water SA 2016, 42, 316–327. [Google Scholar] [CrossRef] [Green Version]
  32. Willey, R.W. Intercropping: Its Importance and Research Needs. Part 1, Competition and Yield Advantages; Commonwealth Agricultural Bureaux: Wallingford, Oxfordshire, UK, 1979. [Google Scholar]
  33. Peerzada, A.M.; Ali, H.H.; Chauhan, B.S. Weed Management in Sorghum [Sorghum Bicolor (L.) Moench] Using Crop Competition: A Review. Crop Prot. 2017, 95, 74–80. [Google Scholar] [CrossRef]
  34. Gholami, S.; Moeini, M.; Zand, E.; Noormohammadi, G. Non Chemical Management of Weeds Effects on Forage Sorghum Production. Int. J. Adv. Biol. Biomed. Res. 2013, 1, 614–623. [Google Scholar]
  35. Xavier, K.V.; Pfeiffer, T.; Parreira, D.F.; Chopra, S.; Vaillancourt, L. Aggressiveness of Colletotrichum Sublineola Strains from Sorghum bicolor and S. halepense to Sweet Sorghum Variety Sugar Drip, and Their Impact on Yield. Plant Dis. 2017, 101, 1578–1587. [Google Scholar] [CrossRef] [Green Version]
  36. Vinutha, K.S.; Rayaprolu, L.; Yadagiri, K.; Umakanth, A.V.; Patil, J.V.; Srinivasa Rao, P. Sweet Sorghum Research and Development in India: Status and Prospects. Sugar Tech. 2014, 16, 133–143. [Google Scholar] [CrossRef]
  37. Mathur, S.; Umakanth, A.V.; Tonapi, V.A.; Sharma, R.; Sharma, M.K. Sweet Sorghum as Biofuel Feedstock: Recent Advances and Available Resources. Biotechnol. Biofuels 2017, 10, 146. [Google Scholar] [CrossRef] [Green Version]
  38. Silva, C.; Da Silva, A.F.; Do Vale, W.G.; Galon, L.; Petter, F.A.; May, A.; Karam, D. Weed Interference in the Sweet Sorghum Crop. Bragantia 2014, 73, 438–445. [Google Scholar] [CrossRef] [Green Version]
  39. Qazi, H.A.; Paranjpe, S.; Bhargava, S. Stem Sugar Accumulation in Sweet Sorghum—Activity and Expression of Sucrose Metabolizing Enzymes and Sucrose Transporters. J. Plant Physiol. 2012, 169, 605–613. [Google Scholar] [CrossRef] [PubMed]
  40. Disasa, T.; Feyissa, T.; Admassu, B. Characterization of Ethiopian Sweet Sorghum Accessions for Brix, Morphological and Grain Yield Traits. Sugar Tech. 2017, 19, 72–82. [Google Scholar] [CrossRef]
  41. Zhang, F.; Wang, Y.; Yu, H.; Zhu, K.; Zhang, Z.; Zou, F.L.J. Effect of Excessive Soil Moisture Stress on Sweet Sorghum: Physiological Changes and Productivity. Pak. J. Bot. 2016, 48, 1–10. [Google Scholar]
  42. Cassman, K.G.; Liska, A.J. Food and Fuel for All: Realistic or Foolish? Biofuels Bioprod. Biorefin. 2007, 1, 18–23. [Google Scholar] [CrossRef] [Green Version]
  43. Bastiaans, L.; Kropff, M.J. WEEDS|Weed Competition; Elsevier: Oxford, UK, 2003; pp. 1494–1500. [Google Scholar] [CrossRef]
  44. Graham, P.L.; Steiner, J.L.; Wiese, A.F. Light Absorption and Competition in Mixed Sorghum-Pigweed Communities. Agron. J. 1988, 80, 415–418. [Google Scholar] [CrossRef]
  45. Dille, J.A.; Stahlman, P.W.; Thompson, C.R.; Bean, B.W.; Soltani, N.; Sikkema, P.H. Potential Yield Loss in Grain Sorghum (Sorghum bicolor) with Weed Interference in the United States. Weed Technol. 2020, 34, 624–629. [Google Scholar] [CrossRef]
  46. Ziska, L.H. Changes in Competitive Ability between a C4 Crop and a C3 Weed with Elevated Carbon Dioxide. Weed Sci. 2001, 49, 622–627. [Google Scholar] [CrossRef]
  47. Zhang, M.; Zeiss, M.R.; Geng, S. Agricultural Pesticide Use and Food Safety: California’s Model. J. Integr. Agric. 2015, 14, 2340–2357. [Google Scholar] [CrossRef]
  48. Hozayn, M.; El-Shahawy, T.A.E.G.; Sharara, F.A. Implication of Crop Row Orientation and Row Spacing for Controlling Weeds and Increasing Yield in Wheat. Aust. J. Basic Appl. Sci. 2012, 6, 422–427. [Google Scholar]
  49. Hussain, M.; Farooq, S.; Merfield, C.; Jabran, K. Chapter 8—Mechanical Weed Control; Jabran, K., Chauhan, B.S.B.T.-N.-C.W.C., Eds.; Academic Press: Cambridge, MA, USA, 2018; pp. 133–155. [Google Scholar] [CrossRef]
  50. Tillett, N.D.; Hague, T.; Grundy, A.C.; Dedousis, A.P. Mechanical Within-Row Weed Control for Transplanted Crops Using Computer Vision. Biosyst. Eng. 2008, 99, 171–178. [Google Scholar] [CrossRef]
  51. Forcella, F.; Westgate, M.E.; Warnes, D.D. Effect of Row Width on Herbicide and Cultivation Requirements in Row Crops. Am. J. Altern. Agric. 1992, 7, 161–167. [Google Scholar] [CrossRef]
  52. Moomaw, R.S.; Martin, A.R. Cultural Practices Affecting Season-Long Weed Control in Irrigated Corn (Zea mays). Weed Sci. 1984, 32, 460–467. [Google Scholar] [CrossRef]
  53. Locke, M.A.; Reddy, K.N.; Zablotowicz, R.M. Weed Management in Conservation Crop Production Systems. Weed Biol. Manag. 2002, 2, 123–132. [Google Scholar] [CrossRef]
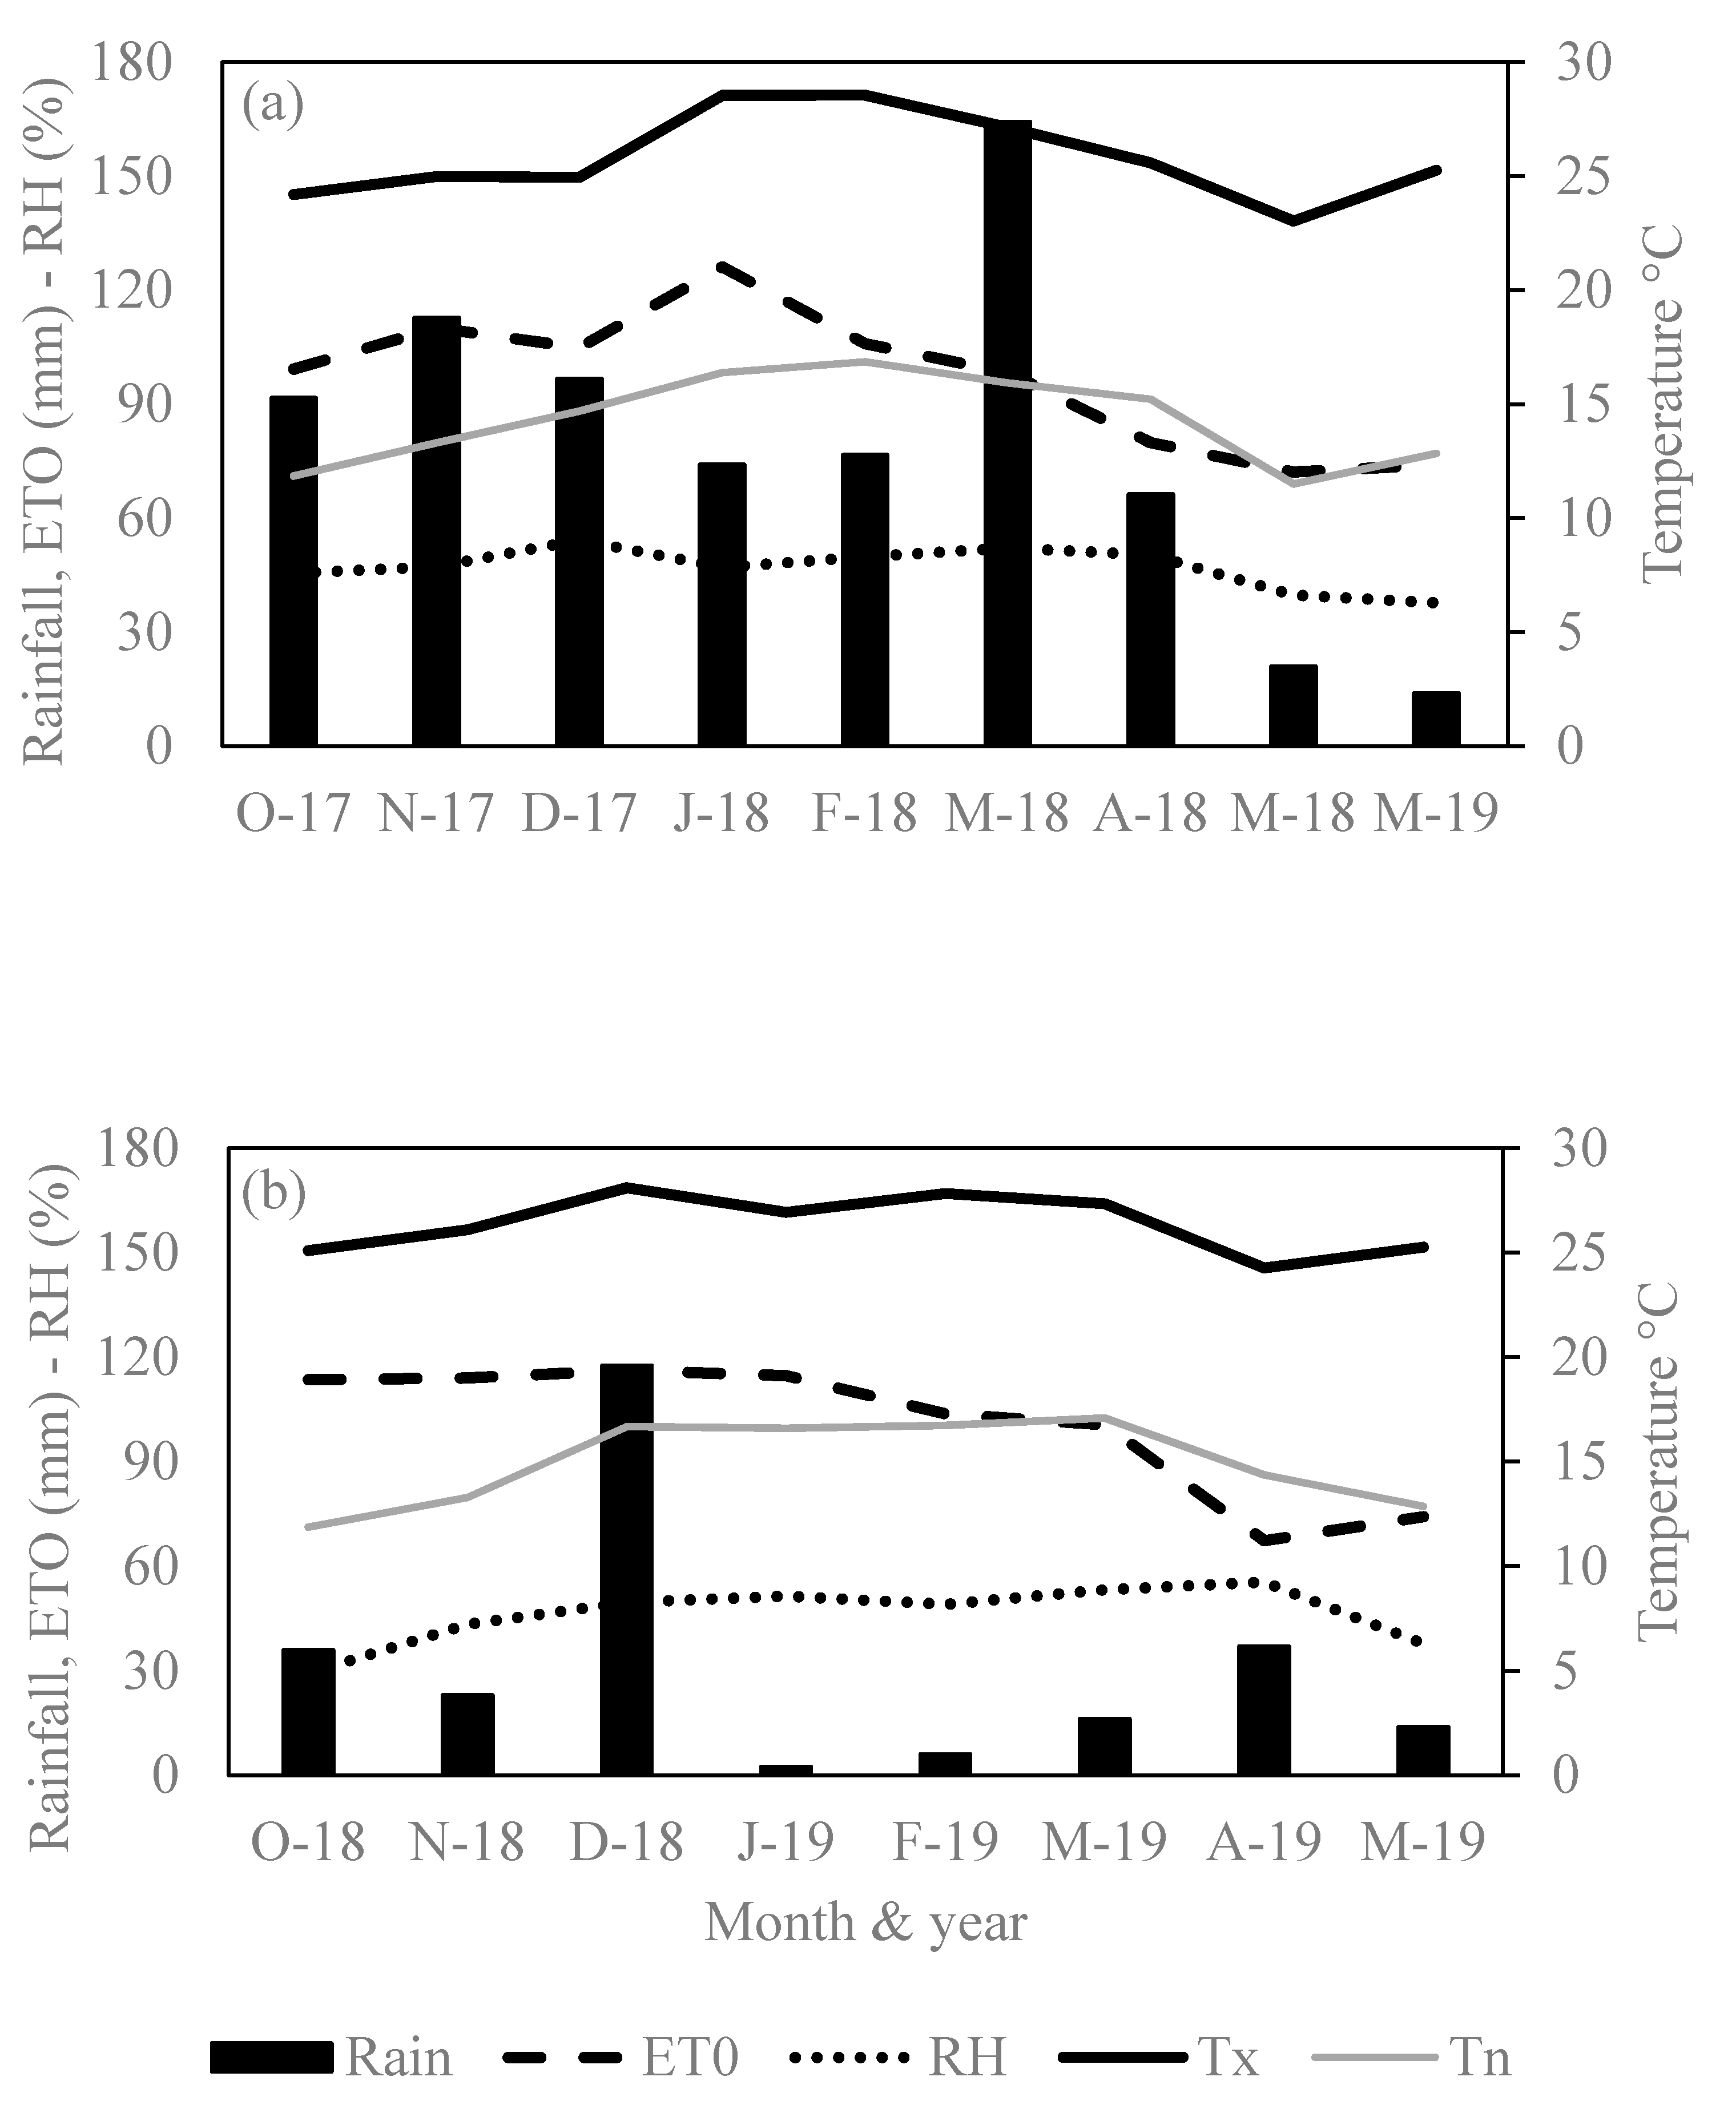
Figure 1. Average monthly rainfall, relative evaporation (ETO), relative humidity (RH), and maximum (Tn) and minimum (Tn) temperature °C from October to May during the (a) 2017/18 and (b) 2018/19 growing seasons.
Agronomy 11 00877 g001
Figure 2. Mean comparison of weeding frequency effect on SS (a) Bx and (b) dry biomass accumulation during the 2017/18 and 2018/19 growing seasons. The error bars indicate SED, and different letters denote significant differences.
Agronomy 11 00877 g002
Figure 3. Mean comparison of weeding frequency effect on SS fresh biomass accumulation during the 2017/18 growing season. The error bars indicate SED, and different letters denote significant differences.
Agronomy 11 00877 g003
Figure 4. Mean comparison of intercropping pattern effect on SS dry biomass accumulation during the 2018/19 growing season. The error bars indicate SED, and different letters denote significant differences.
Agronomy 11 00877 g004
Figure 5. Mean comparison of intercropping pattern × weeding frequency interaction effect on SS fresh biomass accumulation during the 2018/19 growing season. The error bars indicate SED, and different letters denote significant differences.
Agronomy 11 00877 g005
Figure 6. Mean comparison of weeding frequency effect on SS (a) height and (b) the number of leaves per plant 60 and 80 DAE during the 2017/18 and 2018/19 growing seasons. The error bars indicate SED, and different letters denote significant differences.
Agronomy 11 00877 g006
Figure 7. Mean comparison of intercropping pattern effect on SS (a) 60 DAE height and (b) 80 DAE number of leaves per plant during the 2018/19 and 2017/18 growing seasons, respectively. The error bars indicate SED, and different letters denote significant differences.
Agronomy 11 00877 g007
Figure 8. Mean comparison of intercropping pattern × weeding frequency interaction effect on (a) height and (b) 60 DAE number of leaves per plant during the 2017/18 and 2018/19 growing seasons. The error bars indicate SED, and different letters denote significant differences.
Agronomy 11 00877 g008
Figure 9. Principal component analysis denoting the association of intercropping pattern and weeding frequency with Bx, dry biomass, fresh biomass, plant height, and the number of leaves during the 2017/18 and 2018/19 growing seasons. Measured variables are represented by the vectors from the first and second axes SOLSS = sole SS, SSCPTER = SS/CP inter-row intercropping, SSCPTRA = SS/CP intra-row intercropping, SSDBTER = SS/DB inter-row intercropping, SSDBTRA= SS/DB intra-row, WF0= 0% weeding frequency, WF50 = 50% weeding frequency and WF100 = 100% weeding frequency, BRIXA= Bx, DRYBI = dry biomass, FREBI = fresh biomass, 60DLE = 60 DAE number of leaves, 80DLE = 80 DAE number of leaves, 60DHE = 60 DAE plant height, 80DHE = 80 DAE plant height.
Agronomy 11 00877 g009
Table 1. Soil chemical properties at 0–30 cm depth of the experimental site.
Growing SeasonpHPKCaMgNaOrg CTotal NCECBulk Density
(H2O)mg/kg%cmol (+)/kg(g∙cm−3)
2017/186.0427.65----1.760.17-1.10
2018/195.8752.86406.831801.67614.8351.58 0.121.71.12
Table 2. Analysis of variance of Bx, dry and fresh biomass, height, and number of leaves during the 2017/18 growing season.
Source of VariationdfBxDry BiomassFresh BiomassHeightNumber of Leaves
60 DAE80 DAE60 DAE80 DAE
msmsmsmsmsmsms
Intercropping pattern41.88 ns2.39 ns26.56 ns1637 ns14,415 *0.55 ns4.80 **
Weeding frequency28.39 *102.84 **2067.7 **4851.9 **31,957 **10.02 **15.47 **
Intercropping pattern × weeding frequency81.97 ns2.80 ns72.2 ns3210.4 ns23,802 *0.08 ns0.72 ns
Residual281.822.7647.45582936,1990.350.73
CV 29.618.618.910.417.91.93
ns: not significant; * and ** significant at 0.05 and 0.001 probability levels, respectively.
Table 3. Analysis of variance of Bx, dry and fresh biomass, height, and the number of leaves during the 2018/19 growing season.
Source of VariationdfBxDry BiomassFresh BiomassHeightNumber of Leaves
60 DAE80 DAE60 DAE80 DAE
msmsmsmsmsmsms
Intercropping pattern423.29 ns74.05 **120.26 *2943.4 *205 ns1.56 ns1.41 ns
Weeding frequency238.8 **1554.91 ***7168.41 ***1788.4 ns8569 *5.38 ***5.15 **
Intercropping pattern × weeding frequency818.13 ns37.05 ns109.18 **639.1 ns342 ns1.49 *0.63 ns
Residual2884.117.2630.74746.317890.620.72
CV 27.324.11325.622.110.28.9
ns: not significant; *, **, *** significant at 0.05, 0.01, and 0.001 probability levels, respectively.
Table 4. Sweet sorghum, DB, and CP LER for 2017/18 and 2018/19 growing seasons.
Growing SeasonIntercropping PatternWeeding Frequency %Total Plot
050100
2017/18SS/CP inter-row0.971.911.511.61
SS/CP intra-row1.482.692.292.26
SS/DB inter-row0.912.031.701.66
SS/DB intra-row1.122.782.12.19
2018/19SS/CP inter-row1.161.601.281.36
SS/CP intra-row1.652.451.852.47
SS/DB inter-row1.271.651.821.96
SS/DB intra-row2.651.841.601.75
Publisher’s Note: MDPI stays neutral with regard to jurisdictional claims in published maps and institutional affiliations.