1. Introduction
Aflatoxins are highly toxic secondary metabolites produced by
Aspergillus flavus Link and
Aspergillus parasiticus Link. These fungi grow on various foods and animal feed, such as cereals, figs, nuts, and dried fruit, under favourable temperature and humidity [
1]. Effects of aflatoxins contamination were discovered in the 1960s after a severe epidemic on turkey in the United Kingdom attributed to a feed containing peanuts heavily infested with
A. flavus. Following investigations revealed that the aflatoxins were highly hepatotoxic and hepatocarcinogenic and with teratogenic and mutagenic effects on humans and animals [
1]. Due to their toxicity and unpredictable contamination of food and feed, aflatoxins are a concern for producing and importing countries. For these reasons, many countries worldwide introduced strict regulation on aflatoxin levels on goods [
1,
2] that negatively impact international trading and causes economic losses to agricultural and food and feed industries. Many methods have been developed for the quantification of aflatoxins: thin-layer chromatography (TLC), high-performance liquid chromatography (HPLC), liquid chromatography tandem mass spectrometry (LC-MS/MS), immunology-based semi-quantitative and qualitative methods including enzyme-linked immunosorbent assays (ELISAs), and immuno-affinity column assays [
3]. These methodologies are accurate but slow, laborious, expensive, and difficult to automate [
2]. Recently, some relatively inexpensive, simple, and rapid semi-quantitative test kits have been commercially available. Nevertheless, even in developed countries, food authorities do not test a sufficient fraction of products, so contaminated products have a high probability of being introduced in the food and feed chains. Furthermore, even with relatively consistent food and feed testing, it is difficult to get a representative sample of the product and highly contaminated food and feed may not be detected.
Different strategies and techniques to avoid the limits of the methods mentioned above for the detection of aflatoxins presence have been studied with promising results: near-Infrared spectroscopy (NIR), hyperspectral imaging, photoacoustic spectroscopy (PAS), transient infrared spectroscopy (TIRS), electronic noses, and other emerging experimental methods including biosensors [
1,
3,
4]. These techniques have useful results for detecting infection and visible growth of the fungi, but they do not necessarily directly correlate with aflatoxin contamination and its concentrations. For example, infection and visible growth of aflatoxin-producing fungi significantly increase the likelihood that the crop is contaminated with aflatoxins [
5,
6]. Thus, detection of the fungus indirectly detects products that are likely to be contaminated with unacceptable levels of aflatoxin.
Optical methods have been investigated to detect seeds contaminated by aflatoxin-producing fungi for a long time because they potentially rapidly detect and physically identify, for removal, products contaminated by fungi [
7]. These techniques need high-resolution image acquisition devices and significant computational power for imaging processing and computing systems with the learning capability to autonomously identify infected products. The optical detection is based on bright greenish-yellow fluorescence (BGYF) under ultraviolet light or laser, which indicates the presence of aflatoxigenic molds or, possibly, aflatoxin itself [
2]. Even if the relationship between A. flavus infection, BGYF, and aflatoxin has been reported [
8], samples emitting fluorescence should be removed and tested for aflatoxins contamination by more accurate laboratory tests. Techniques based on BGYF used to detect the presence of aflatoxigenic molds, to some extent, can indicate aflatoxin contamination [
9]. This method is commonly adopted in manual fig-processing plants where workers in dark rooms under UV light separate BGYF positive fruits [
5,
6]. The manual selection process highly depends from the availability and expertise of workers. Furthermore, skin-related problems due to UV radiation may occur to the workers.
One of the most important products affected by aflatoxin contamination is peanut,
Arachis hypogaea L. [
10]. It is largely cultivated worldwide for oil extraction, especially in developing countries, where
Aspergillus infection and consequently aflatoxins contamination can occur after harvesting and during storage because crops are usually sun-dried in open fields and then stored in poor conditions [
1]. Furthermore, it is grown in tropical and subtropical regions where the warm and humid weather provides optimal conditions for the molds’ growth [
1]. Studies in several areas of the globe on the distribution of
Aspergillus spp. reported the
Aspergillus flavus as predominant in soils devoted to peanuts cultivation [
11,
12] and on peanuts and similar products available in markets [
13,
14].
Certain good agricultural practices in groundnut, such as farmyard fertilization, potash fertilization and gypsum application, irrigation after sowing, drying of pods, and their protection with tarpaulins after harvest are simple practices proven to reduce
A. flavus infection and, subsequently, aflatoxin contamination [
15]. A variety of chemicals and physical process have been investigated and used to eliminate or degrade aflatoxins effectively. Still, most of them are impractical or potentially unsafe to use because of the toxic residues or the effect on nutrient content, flavour, odour, colour, texture, and/or the product’s functional properties [
1]. Biocontrol products formulated with atoxigenic
Aspergillus flavus strains have been studied and developed [
16], approved by authorities (e.g., EPA, Environmental Protection Agency, Washington, D.C., USA), and are commercially available.
Since product contaminated by
Aspergillus may not be effectively removed by cleaning equipment and aflatoxins destroyed by post-harvesting processes, the systematic and complete monitoring of the single fruit, seed, grain, or kernel is the major challenge the food processing technology faces. Harvest and post-harvest technologies are essential for detecting product contamination [
17,
18,
19]; in particular, fully automated detection methods needs to be developed to overcome a skilled labor shortage and avoid unhealthy and unsafe working conditions when manual selection is adopted [
6].
Chaitra and Suresh [
20] investigated the effectiveness of different imaging techniques, such as thermal imaging, fluorescence, and colour imaging, to detect aflatoxin-producing fungi in peanuts. The results of their study revealed that colour imaging was the best technique in separating contaminated peanuts.
Magi et al. [
21] used image processing to classify peanuts’ morphological and colour attributes on white background adopting the support vector machine (SVM) method. They obtained an overall correct classification rate of 83.5%.
Suyantohadi and Masithoh [
22] developed a machine vision system for the detection of aflatoxin-contaminated peanuts. They placed a camera, a Petri, and a UV lamp in an aluminium box and images were classified by the mean k-clustering algorithm based on the average pixel value of RGB colour parameters, where they obtained 100% of the accuracy of the system.
Atas et al. [
9] developed a machine vision system based on hyperspectral imaging and machine learning to detect aflatoxin in chili pepper. They used UV and halogen lamps for lighting. Multi-layer perceptrons (MLPs) resulted in having better results (85.5%) than linear discriminant analysis (LDA) as classifiers.
Artificial neural network (ANN), support vector machine (SVM), and adaptive neuro-fuzzy inference system (ANFIS) are computational techniques that find broad applications in different fields of science, engineering, and economics [
23,
24,
25,
26,
27,
28,
29,
30,
31].
This paper reports a study on image processing where these techniques have been compared to detect and discriminate peanuts seed artificially infected with Aspergillus flavus. The study is addressed to identify the combination of a light source, image background, and computational classification method to best detect and segregate peanut seeds infected by Aspergillus flavus, the most common aflatoxin-producing fungus infecting peanuts.
2. Materials and Methods
2.1. Preparation of Samples
Samples of peanuts pods were retrieved from the local market in Iran. Peanuts seeds were obtained after the removal of the shell. An isolate of
Aspergillus flavus was provided by Shahid Chamran University, Iran. It was cultured in a dextrose agar medium. Peanut seeds were disinfected with 75% alcohol solution for 1 min, and then they were washed with distilled water to ensure that they were not contaminated [
32]. Peanut seeds were inoculated with a water spore suspension with 106 spore/mL of
Aspergillus flavus. A Tween solution was used to prevent spores from sticking to each other. Infected peanut seeds were placed in an incubator at a temperature between 25 °C and 30 °C and minimum 80% humidity, optimal growth conditions of
Aspergillus according to [
33]. For each of the test conditions later described 1200 sample (seeds), corresponding approximately to 31 kg of peanuts, were used.
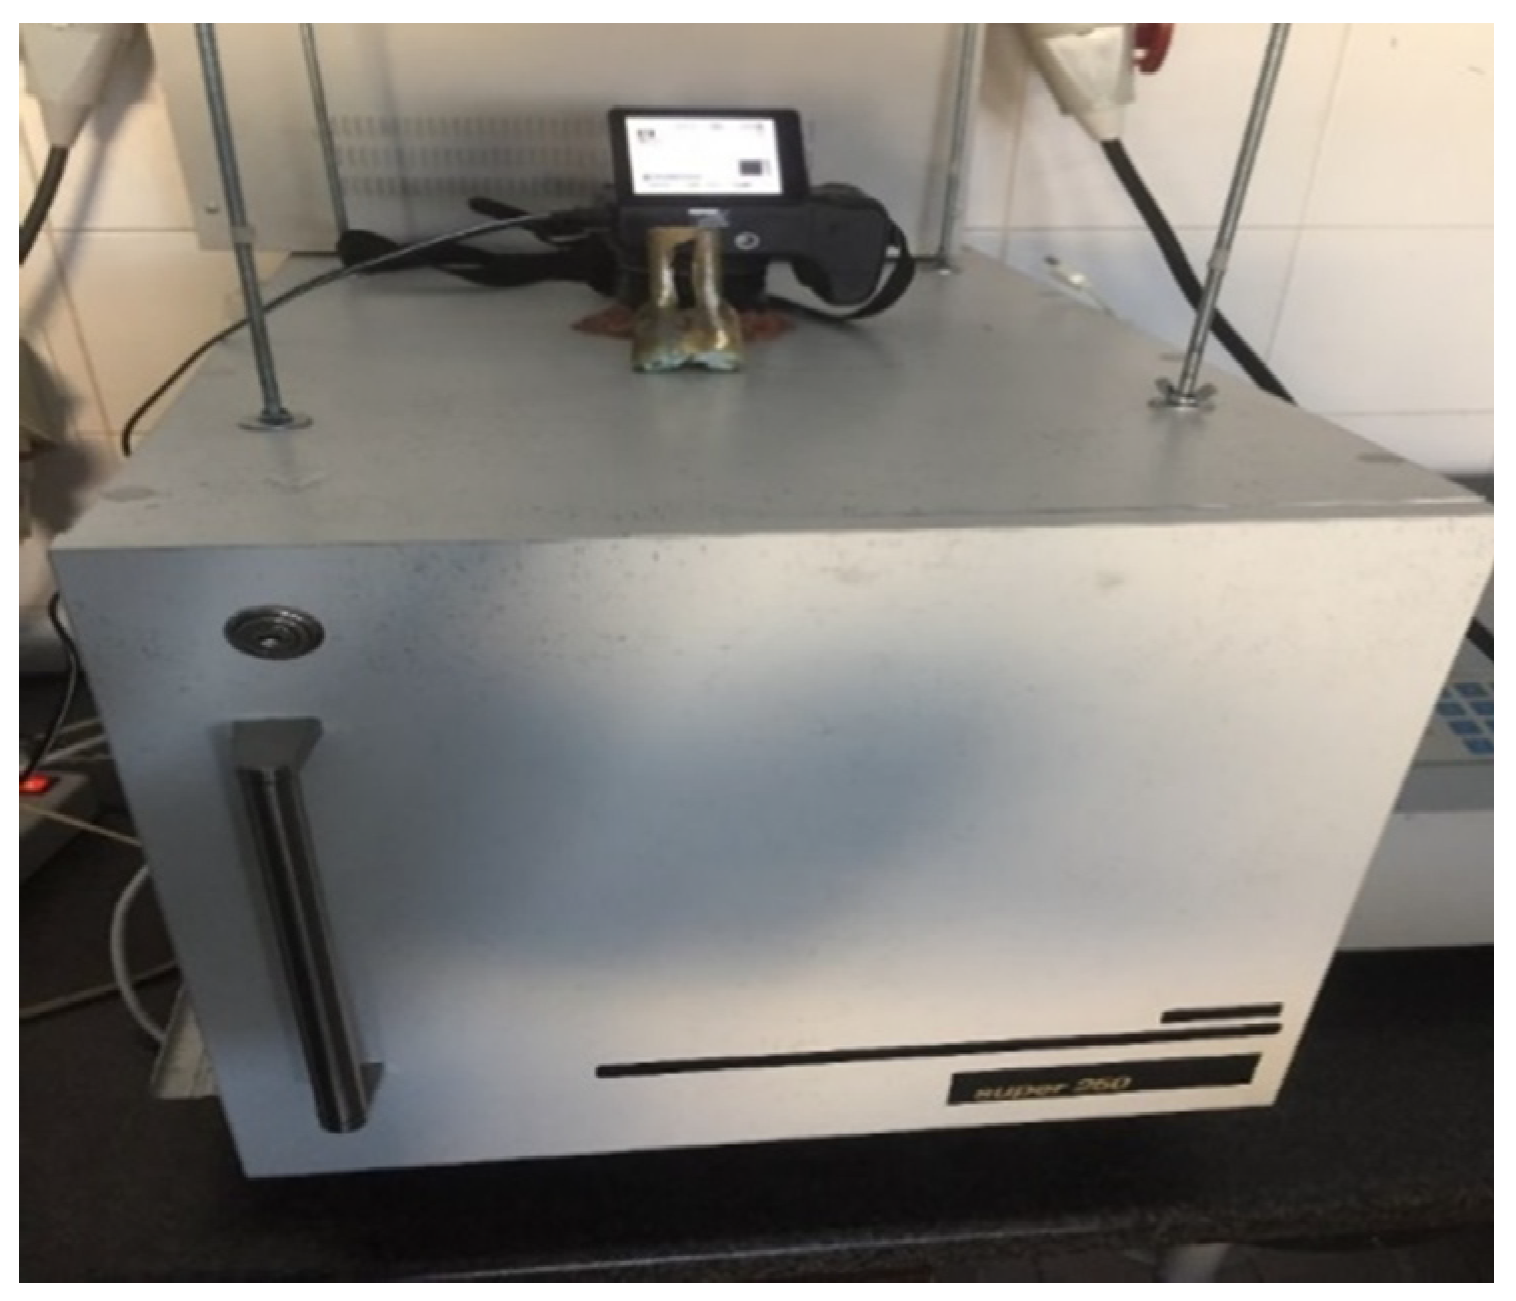
2.2. Imaging Box
The first operation of image processing and machine vision is to take pictures. An imaging box (
Figure 1) was built with medium-density fibreboard (MDF) panels. The box is a completely closed volume with a place on the top where a camera is located and a bottom surface on which the sample is placed at an adjustable distance from the camera. Inside the box, on the sidewalls, a lighting system is installed: artificial lighting prevents disturbances from ambient light (such as shadowing when exposed to the object), reduces noise and reflection, as well as increasing image contrast, thus improving process accuracy [
34,
35].
2.3. Camera
For the study, we used the Sony HX200v camera model with the CCD sensor. For investigation on agriculture products, CCD cameras are reported as more appropriate [
36,
37].
2.4. Light Source
Three types of light sources, fluorescent lamps, LED (white), and UV black-light, were compared. The fluorescent light source consists of two white light 8-Watt bulbs (330–350 nm wavelength) and two yellow light 8-Watt (290–310 nm wavelength). The LED light source consists of two 8-Watt bulbs (390 nm wavelength), while the UV black-light source consists of two 6-Watt bulbs with about 370 nm wavelength.
2.5. Background Selection
The images were taken on two backgrounds: black and white. The background material should not reflect light as much as possible: it is essential for proper image processing. Matte black and white cardboard were used as background.
2.6. Optimization of the Image Processing Algorithm
The image processing extracted color and geometric properties from peanut seeds images that were later used for classification by computational methods. By combining three light sources and two types of background, six shooting modes were obtained. Due to light reflection, the images taken with UV light on white background had low quality and, hence, this combination was not considered for the following steps of the study.
2.7. Image Taking Times
Images of peanut seeds were recorded before infection as a control treatment. Then, images of peanuts seeds were taken 48 and 72 h after infection. After a longer time, for example, 96 h, the Aspergillus mold had propagated to all seed, and images were not useful for the aim of the study.
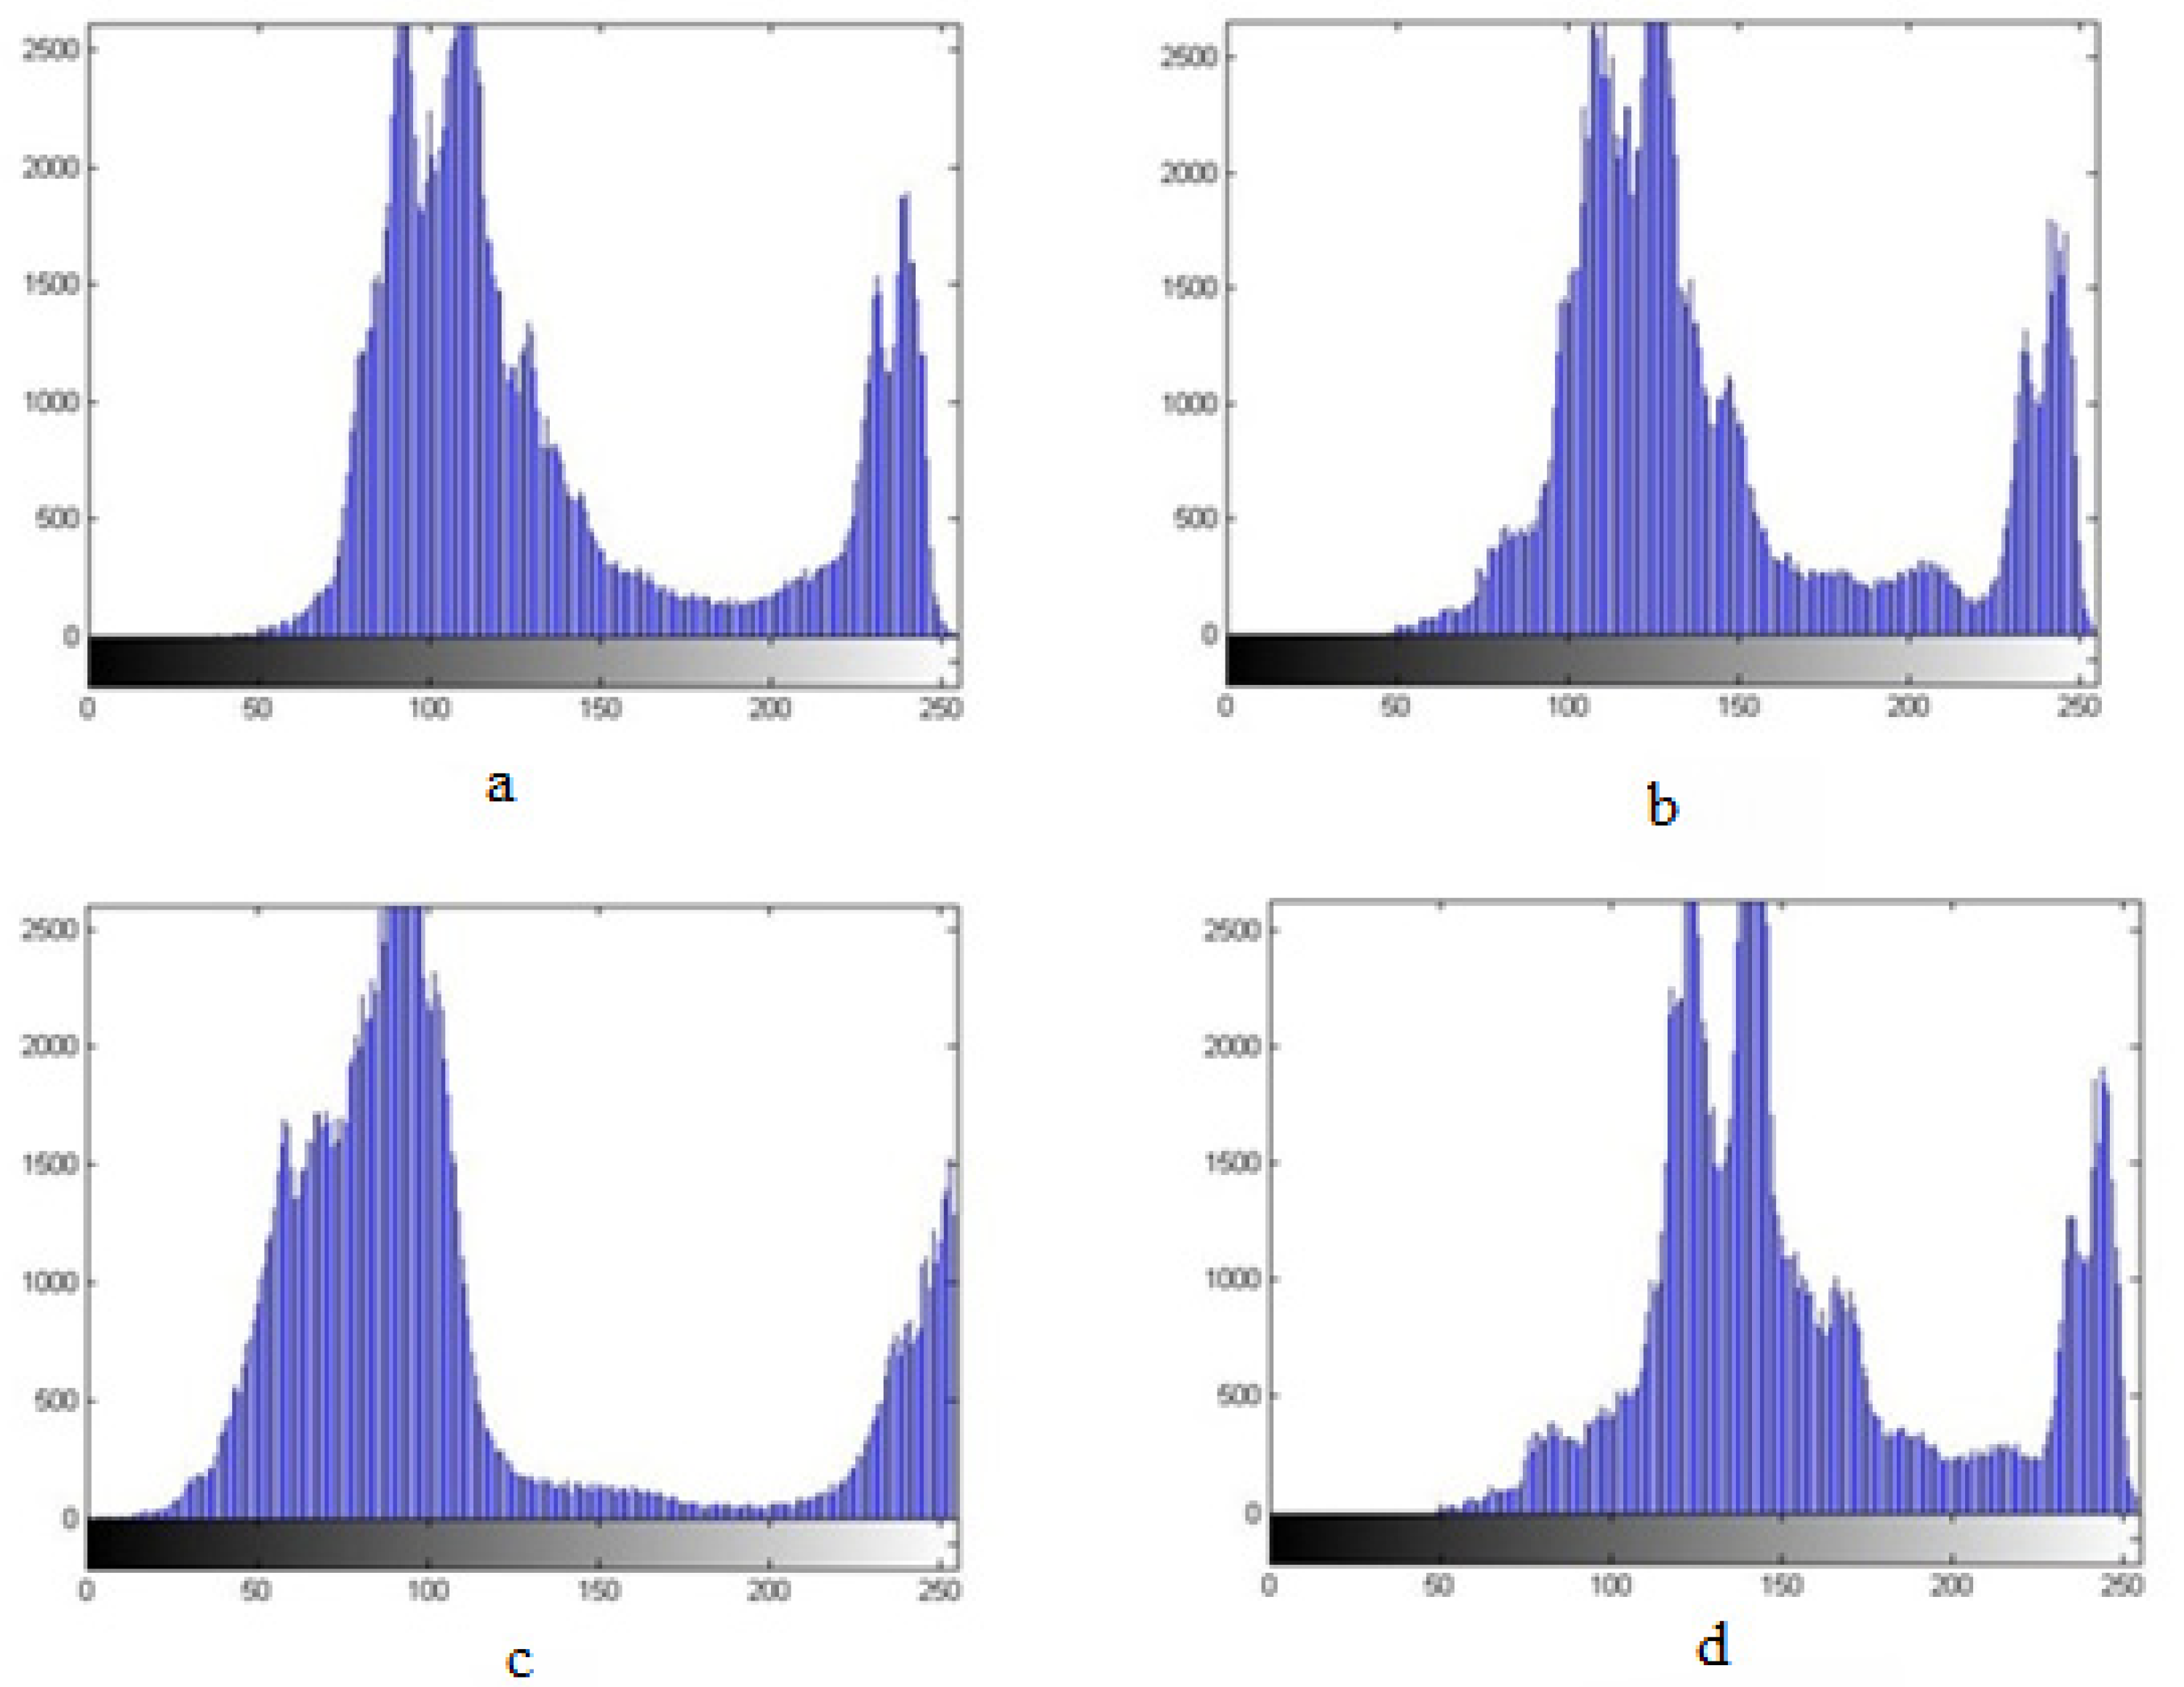
2.8. Transporting Images to 2D Space
The images were transported to grey space, but the results of the processing were not satisfactory because there was not a good contrast between the background and the target (the seed). The images were in RGB space with three, red, green, and blue, color layers, thus the images’ layers were separated and an image histogram extracted to find the best contrast. The “histogram” of an image shows the frequency of the occurrence of “gray surface” in an image; in other words, a histogram is a method to show the brightness of each pixel, a graphical representation of the number of occurrences of each gray area values in an image: the dark points are close to zero (the minimum value) while the bright points are close to 255 (the maximum value). When examining each layer’s histogram it was observed that the maximum contrast between seeds and background was in the blue layer that was, finally, the one adopted for the study (
Figure 2). The process was performed using the ravel order with MATLAB r2015b software.
2.9. Transporting Images to Binary Space
Images were transported to binary space and the background removed. Direct transfer removes portions of the target or leaves a portion of the background. Therefore, to avoid this issue, contrast transduction operators were used before the transfer. Specifically, in this study, the gamma operator was used to extend the contrast before transporting images to binary space and remove the background by the histogram process. The transport of images to binary space has been performed using the Binary Space Partitioning (BSP) method. It recursively subdivides a space into two convex sets by using hyperplanes as partitions. This subdividing process gives rise to a representation of objects within the space in the form of a tree data structure known as a BSP tree. The process was performed using MATLAB r2015b software.
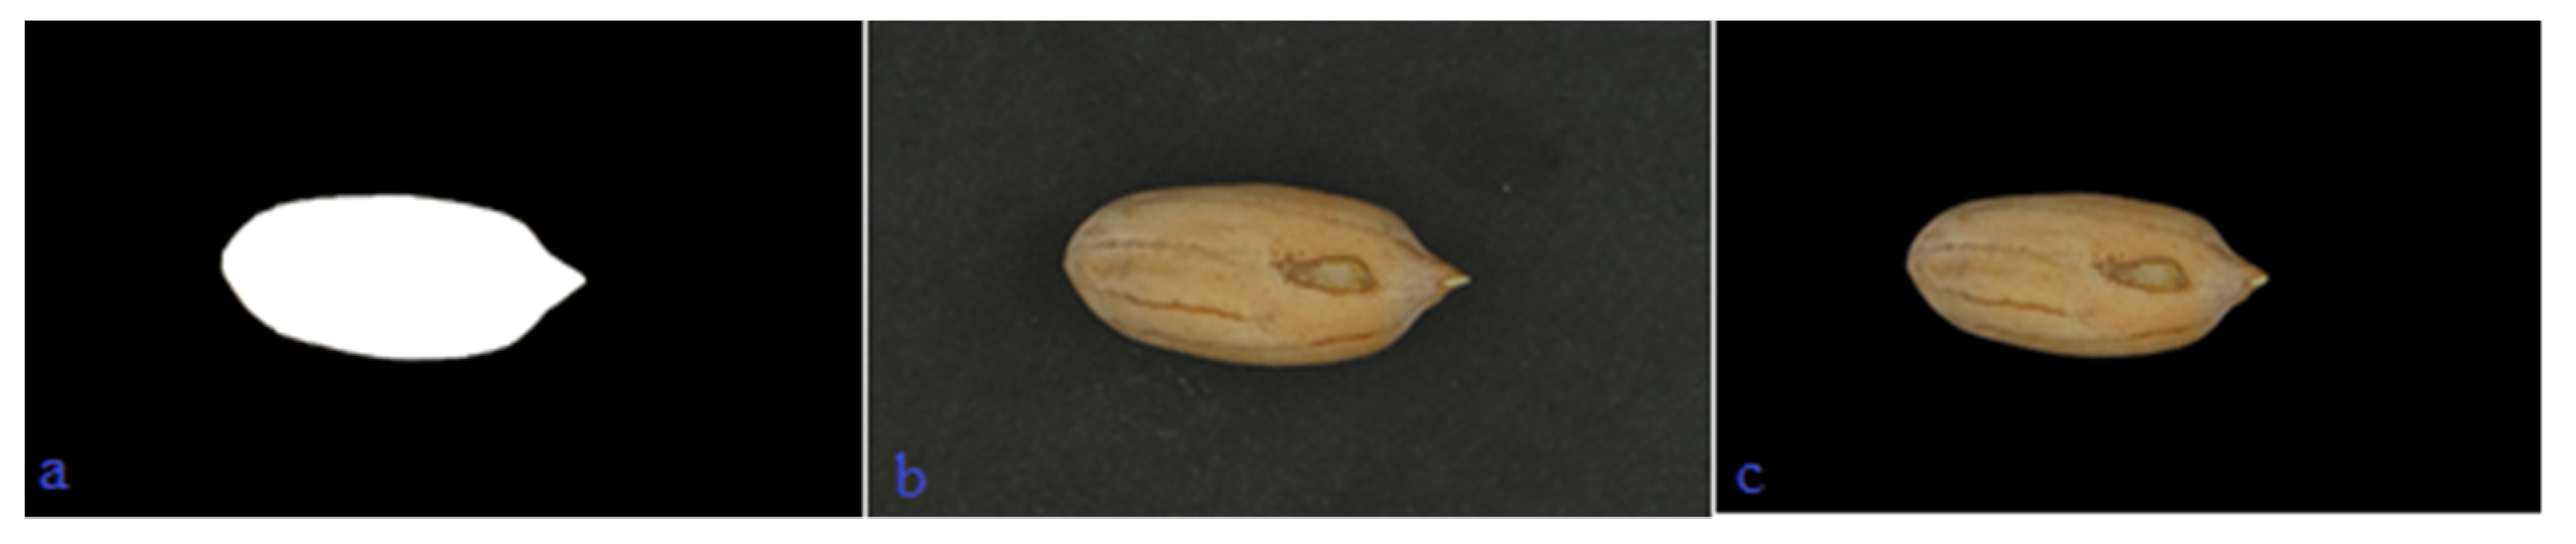
2.10. Transporting to Color Space
Colour images must be used to extract the characteristics of the connectors. Dot-matrix multiplication was used for removing the background and getting a colour image of the connectors. The corresponding elements in black dots (zero) were removed, and the corresponding dots remain in white dots (one). Since the colour image matrix is three-dimensional, first, the image layers were separated and, then, the binary image matrix was multiplied one by one. Finally, the resulting images were combined, and a new colour image obtained (
Figure 3).
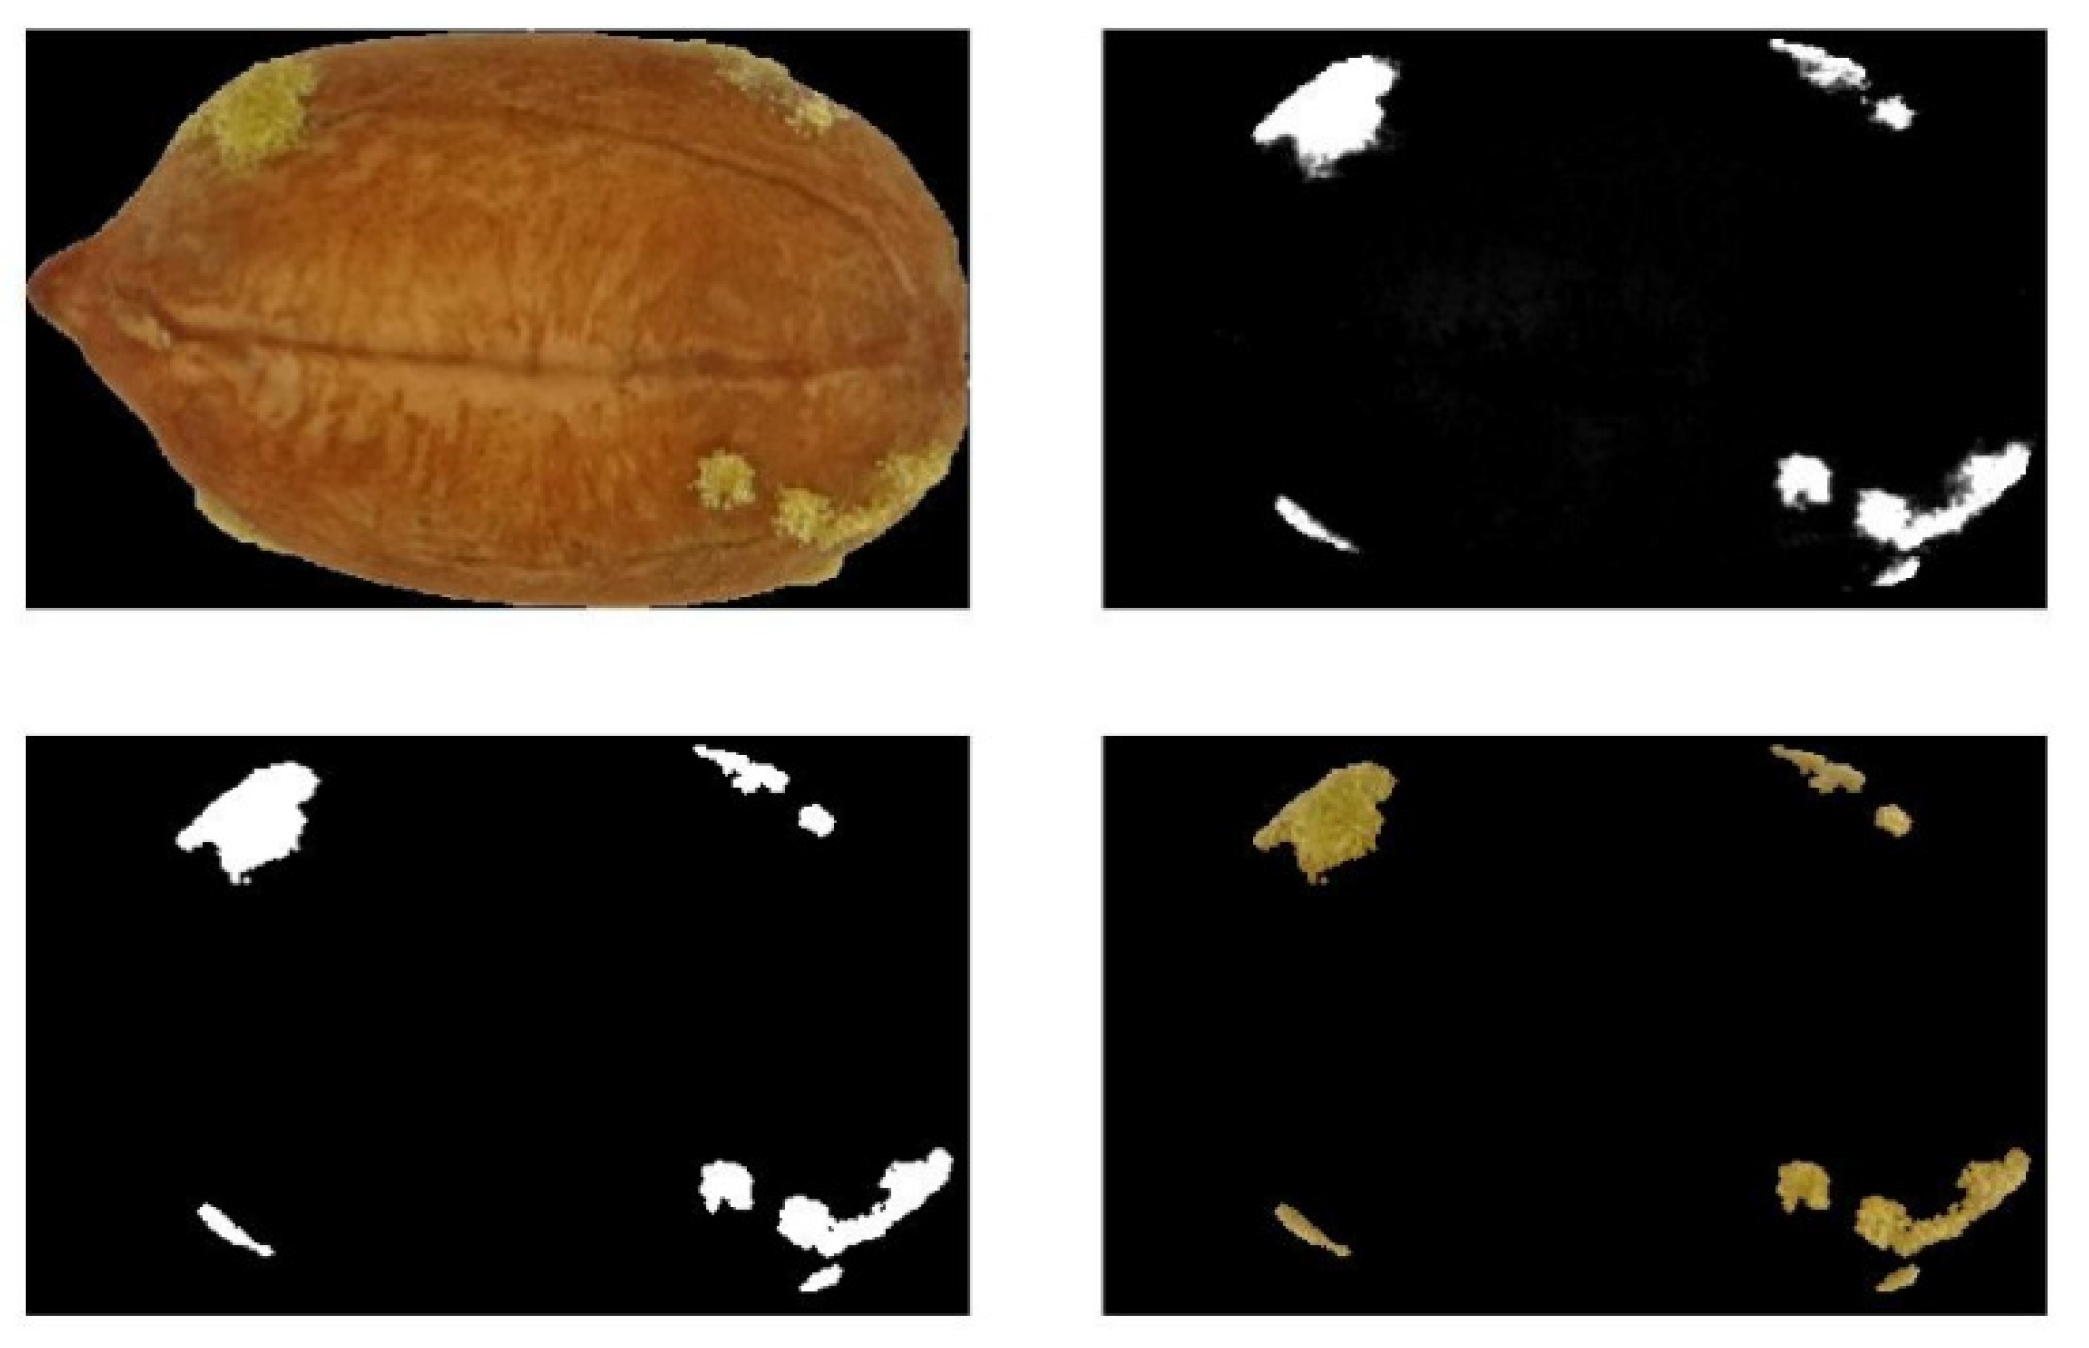
2.11. Computation of Contaminated Surface
To compute the contaminated area, all the image processing steps previously described are repeated for peanuts and contaminated areas considered as background and target, respectively. Additionally, the colour and dimensions of the area of seeds and of the contaminated surfaces were computed (
Figure 4).
2.12. Applying Detection Model
Three detection models ANN, SVM, and ANFIS were tested to determine the seed’s sporulation area and segregate contaminated from not contaminated (control) seeds.
2.12.1. Artificial Neural Network (ANN)
In this study, a neural network with a feedforward with a backpropagation learning algorithm was used. The backpropagation learning algorithm uses various functions such as purelin, sigmoid logarithm, and sigmoid tangent to standardize the data. In this study, these three functions were used (Equations (1)–(3)) [
38].
where n is the number of input neurons.
Eighty per cent of the data collected were used to train the model, while 20% of the data were used for the test. The algorithm was applied in 1000 epochs, and the stop criteria of the error was 0.001. The trainlm training algorithm was used to train the neural network. The network has one input layer containing index s (saturation), percentage of the contaminated area (with sporulation of the fungus) on the image of the seeds, two hidden layers with the logarithmic transfer, and tangent functions with the different number of neurons. It also consists of one output layer with an output +1 for contaminated product and −1 for contaminated seeds (
Figure 5).
2.12.2. Support Vector Machine (SVM)
The support-vector machine is a supervised learning model with associated learning algorithms that analyze data for classification. In the model, the Gaussian transform function (Radial-Basis) was adopted using 1500 training steps. The SVM is a training process easier than artificial intelligence and fuzzy systems, and it does not get stuck at the optimal local point. Moreover, it works well in transferring data to higher space and has good performance in a nonlinear system. Therefore, the balance of classification and error complexity can be controlled. Furthermore, it requires a small number of training samples.
2.12.3. Adaptive Neuro-Fuzzy Inference System (ANFIS)
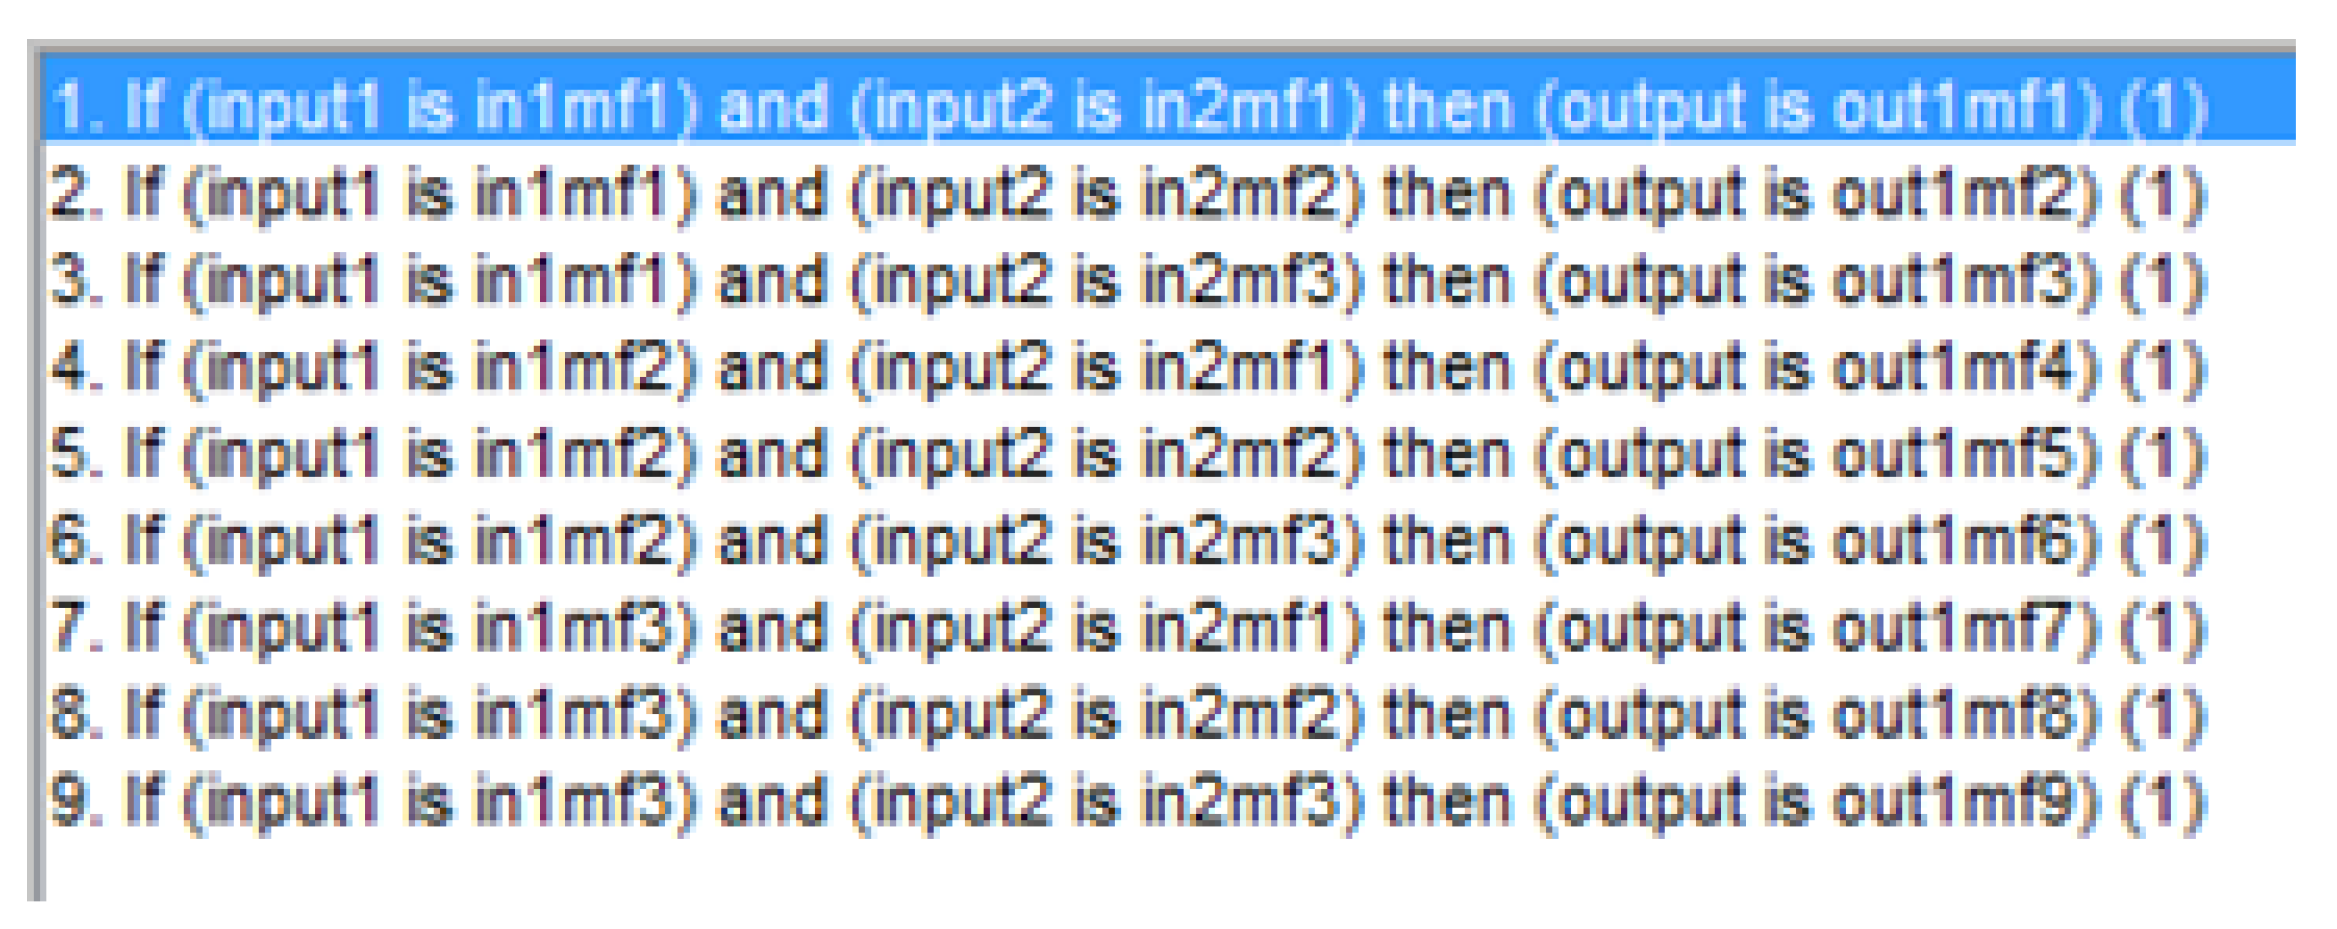
The Fuzzy Logical toolbox in MATLAB r2015b software was used for computation of the adaptive neuro-fuzzy inference system model based on the Sugeno system. The percentage of contamination and saturation were introduced into the network as inputs. The network outputs were +1 (contaminated) and −1 (not contaminated), and a fuzzy system was created comparing control and infected treatments. Three membership functions were selected for each entry by trial and error: less than three membership functions led to lower accuracy while more than three membership functions required a higher amount of calculations and running time. According to the three membership functions of each input, nine rules were obtained (
Figure 6).
Different learning techniques, such as a hybrid-learning algorithm [
39] or genetic algorithm (GA) [
40], can be adapted to solve the training problem. Better performance of ANFIS models has been reported through use of the rapid hybrid learning method, which integrates the gradient descent method and the least-squares method to optimize parameters [
41,
42]. Thus, for the purpose of this study, the hybrid learning method has been adopted to train the system. The tolerance value of the error was considered zero, and the training process stopped when the error persisted at this tolerance. The number of training steps was set at 100.
2.13. Model Evaluation and Statistics
MSE (mean square error), RMSE (root mean square), MAE (mean absolute error), and MPE (mean per cent error) (Equations (8)–(11)) were used for evaluating the accuracy of classification methods based on colour indexes Intensity (
I), Saturation (
S), and Hue (
H) calculated according to equations 4, 5, and 6, respectively.
where
R (red) is the first,
G (green) the second, and
B (blue) the third layer of the colour image and
MSE, MAE, RMSE, and MPE were calculated as follows:
where
is the actual value,
is the forecast value,
n is the number of forecasts,
is the number of correct classification,
is the number of incorrect classification.
The statistical difference among treatments was explored with the analysis of variance and Duncan’s post hoc test.
3. Results
Here, are reported the results of the methods for detection, classification, and, finally segregation, of peanut seeds infected with Aspergillus flavus. The results are reported based on the surface of seeds with sporulation of the fungus after 48 and 72 h from infection detected and computed by image processing, compared with the control treatment (seeds before contamination) and using different combinations of lighting and background.
The classification accuracy with different methods 48 and 72 h after contamination using the LED lamps and black background is reported in
Table 1. All three methods (SVM, ANN, and ANFIS) show lower accuracy after 48 than 72 h from contamination with
Aspergillus. The ANN classifier presents a lower error percentage at both times (48 and 72 h) after contamination.
The classification results with the three methods (SVM, ANN, and ANFIS) using the LED lamps and white background are reported in
Table 2. The ANN classifier results in the least percentage of error in classification after 72 h from infection, while the best results in classification after 48 are achieved with the SVM method. ANN and ANFIS show a lower percentage of error in detection and classification after 72 from contamination, while SVM makes it possible with LED light and a white background to achieve the least error in detection and classification after 48 h from contamination.
The classification results with the three methods (SVM, ANN, and ANFIS) 48 and 72 after contamination using the fluorescent lamps and a white background are reported in
Table 3. The ANN method of detection gives the best results in terms of the percentage of error of classification.
The classification results of the three methods (SVM, ANN, and ANFIS) 48 and 72 after contamination using fluorescent light and a black background are shown in
Table 4. In this condition, the least error in detecting and classifying peanuts seed contaminated with
Aspergillus, both after 48 and 72, is obtained with the ANFIS method. The ANN method show results similar to the ANFIS method, while for the SVM method the error percentage is significantly higher, in particular after 72 h from the contamination
The classification results of the three methods (SVM, ANN, and ANFIS) 48 and 72 after contamination from
Aspergillus using UV lamp and a black background are reported in
Table 5. Results show that the AMFIS method gives the lowest results in error detection and classification, both 48 and 72 after contamination of peanut seeds.
Comparison of Methods
Table 6 summarizes the 5 five combinations of image detection methods and classification with the conditions the images are taken (lights and backgrounds), giving accuracy larger than 90% for 48 and 72 h after
Aspergillus inoculation. According to the experimental trials’ outcome, the best results in
Aspergillus contamination detection are achieved using UV lamp with a black background: the accuracy is 99.8% and 99.2% after 48 and 72 h, respectively from the inoculation. The white background with LED light gives better contrast that makes it possible for ANN image processing to get remarkable accuracy in detecting
Aspergillus contamination, 98.6% and 99.7%, respectively, at early (48 h) and later (72 h) stages.
The data collected with the images previously described was submitted to the analysis of variance to analyze the effect of the type of imaging (the 5 combinations of light and background summarized in
Table 7) and the time (48 and 72 h from infection) the images have been taken. The results (
Table 7) show that the difference between the type of images (P) and the times the images are taken (T), as well as their interaction (P ∗ T), are statistically highly significant.
The Duncan’s post hoc test identified images taken with UV light and black background as significantly different and superior in detecting A. flavus on contaminated seeds than those taken with LED light on either a white background and a black background. In turn, these LED images are better than those taken with a fluorescent light on either a black background and a white background.
The Duncan’s post hoc highlights significant statistical difference among times the images are taken: 72 h and 48 h after inoculation.
The Duncan post-hot test results applied to the interaction of type of imaging and the time the pictures are taken are reported in
Table 8. Images taken with UV light and black background 48 h after inoculation are statistically different and then significantly superior in detecting
A. flavus on contaminated peanut seeds. Images taken with LED light on both black and white backgrounds are more effective than any other solution in detecting
A. flavus contamination 72 h after inoculation.
4. Discussion
According to the observation and statistical analysis results, the best combination for detecting and segregating
A. flavus-infected peanuts is obtained using images taken with the UV light on a black background and ANFISS classification. The technique is particularly effective, with 99.8% and 99.2% accuracy, in detecting the
Aspergillus growth after 48 h and 72 h after inoculation, respectively. Images taken with LED light on white background in combination with the ANN classification method effectively detected and segregated
A. flavus-contaminated peanuts at a later (72 h from inoculation) stage while it is little less efficient at an early stage (48 h from inoculation): the classification accuracy is 99.7% and 98.6%, respectively. The same classifier, ANN, processes images taken with fluorescent light on white background attaining 99.4% accuracy in detecting and segregating peanuts after 72 h from
A. flavus inoculation while the accuracy drops to 92.5% for images taken at an early stage (48 h) from inoculation. The accuracy in detection and segregation of
A. flavus growth on peanuts with the combinations of lights, backgrounds, and classification processing methods investigated is significantly high compared to previous studies. Chaitra and Suresh [
20] achieved an accuracy rate of 96.87% and 84.37% for classification of aflatoxin-mold contaminated peanuts applying Linear Discriminant Analysis (LDA) and Feed Forward Neural Network (FFNN) on color images, respectively. Magi et al. [
21] obtained 83.5% of correctness in quality grading of peanuts, based on their morphological and color attributes, processing images taken on white background with SVM classifier. This not particularly good performance of the SVM method in the classification of peanuts images is confirmed by the outcome of our study, where SVM resulted in being the least appropriate classifier for the purpose of the research and ANFISS and ANN demonstrated better accuracy in classification and segregation of images of
Aspergillus-contaminated peanuts.
Several experiences have been carried out with UV-based image systems for real-time detection and separation of dried figs contaminated with aflatoxin because of the economic relevance of the product, the costs, and the uncomfortable and unhealthy working conditions of operators employed in the manual sorting. The success rate in detection and separation for such systems reported by different authors ranges from 83% [
43] to 91% [
6] and 98% [
44].
Hyperspectral imaging with UV illumination and deep learning techniques have been investigated to detect and separate different fruits and seed contaminated by aflatoxin-producing mold. Zhongzhi and Limiao [
45] report 95% recognition of mold-infected peanut seed at pixel-level and higher than 90% at kernel-level, with Random Forest as the best performing classier among the models considered in their study [
46]. In a similar experimental setting on chilli pepper, 87.5% classification accuracy was achieved using Multi Layer Perceptrons (MLPs), outperforming the classification accuracy rate of other classifier models involved in the study [
9]. Karuppiah et al. [
47] investigated the effectiveness of NIR hyperspectral imaging system to identify fungal infections in seeds from different leguminous crops. They report accuracy between 98 and 100% in separating healthy from every stage of infection seeds using Linear Discriminant Analysis (LDA) compared with Quadratic Discriminant Analysis (QDA), which also showed promising but lower results. Jiang et al. [
48] combined near-Infrared (NIR) hyperspectral images with Principal Component Analysis (PCA) and marker-controlled watershed algorithm achieving 87.1% in learning image and 98.73% in validation image to detect moldy peanuts.
Finally, when compared with the previous studies, we can consider the accuracy in detection and segregation of peanuts inoculated with Aspergillus flavus obtained adopting the combinations of lights, backgrounds, and classification and segregation processing methods investigated in this study, remarkable and with possible future engineering application.
5. Conclusions
Aspergillus flavus and Aspergillus parasitucus fungi are responsible for aflatoxin contamination of several raw materials intended for human and animal consumption. Since the contamination from Aspergillus cannot be entirely removed by cleaning equipment, the systematic and complete monitoring of the single unit of such raw material (fruit, seed, grain, or kernel) for successful segregation is a significant challenge.
This paper reports the results of an investigation of the detection of A. flavus-contaminated peanuts using image processing. The effectiveness of three lighting sources (LED, fluorescent, and UV) and two backgrounds (white and black) were explored in combination with three classifiers, SVM, ANN, and ANFIS, to detect and classify the infected peanuts seeds. Images taken with UV lamp on black background resulted in being the solution having the least error in detecting the A. flavus contamination. This solution can be effectively combined with ANFIS image classification to automatically detect and classify the A. flavus contaminated peanuts with an accuracy greater than 99%.
On peanuts seed at a later contamination stage (72 h), images taken with LED lamps on white or black background resulted in being more effective in fungi detection. In this case, the most appropriate image processing method to detect and classify the contaminated peanuts seed is the ANN. These findings suggest that an effective system (with accuracy in detection and classification near 100%) based on image analysis to detect and classify peanuts contaminated by A. flavus, which is potentially dangerous because of the development of aflatoxins, should be grounded on a system simultaneously analyzing images of any single seed taken with LED and UV lights and processed with ANFIS and ANN methods, respectively. Additional reduction methods, such as principal component analysis (PCA), will be explored in the future to investigate the effectiveness of the classification technique used in this study. Furthermore, we plan to extend the experience on image analysis and processing on additional products subjected to A. flavus contamination investigating the impact of colour and geometric properties and the performances of the three different classifiers. Since the image processing and machine learning tools described in this study have been developed to detect and segregate Aspergillus flavus-infected peanuts, different specific algorithms will be investigated to detect other fungi, such as Aspergillus parasiticus, with different properties, on further raw materials.


