Article

Automated Detection of Tetranychus urticae Koch in Citrus Leaves Based on Colour and VIS/NIR Hyperspectral Imaging

by
María Gyomar Gonzalez-Gonzalez
,
Jose Blasco
*,
Sergio Cubero
and
Patricia Chueca
*
Agricultural Engineering Centre, Instituto Valenciano de Investigaciones Agrarias (IVIA), CV-315, km 10,7, Moncada, 46113 Valencia, Spain
*
Authors to whom correspondence should be addressed.
Agronomy 2021, 11(5), 1002; https://doi.org/10.3390/agronomy11051002
Submission received: 20 April 2021 / Revised: 6 May 2021 / Accepted: 10 May 2021 / Published: 18 May 2021

Abstract

:
Tetranychus urticae Koch is an important citrus pest that produces chlorotic spots on the leaves and scars on the fruit of affected trees. It is detected by visual inspection of the leaves. This work studies the potential of colour and hyperspectral imaging (400–1000 nm) under laboratory conditions as a fast and automatic method to detect the damage caused by this pest. The ability of a traditional vision system to differentiate this pest from others, such as Phyllocnistis citrella, and other leaf problems such as those caused by nutritional deficiencies, has been studied and compared with a more advanced hyperspectral system. To analyse the colour images, discriminant analysis has been used to classify the pixels as belonging to either a damaged or healthy leaves. In contrast, the hyperspectral images have been analysed using PLS DA. The rate of detection of the damage caused by T. urticae with colour images reached 92.5%, while leaves that did not present any damage were all correctly identified. Other problems such as damage by P. citrella were also correctly discriminated from T. urticae. Moreover, hyperspectral imaging allowed damage caused by T. urticae to be discriminated from healthy leaves and to distinguish between recent and mature leaves, which indicates whether it is a recent or an older infestation. Furthermore, good results were achieved in the discrimination between damage caused by T. urticae, P. citrella, and nutritional deficiencies.

1. Introduction

Spain is the world’s sixth largest producer of citrus and the first exporter of fruit for the fresh market [1]. Therefore, the external quality of fruits is a key factor in the purchase decision, and the pests that cause direct damage to these fruits are of crucial importance [2,3]. Among pests, mites are one of the major problems of citrus, including the citrus rust mite and the citrus red mite. Tetranychus urticae Koch (Acari: Tetranychidae), also called the two-spotted spider mite, is one of the economically most important pests in a wide range of outdoor and protected crops worldwide [4]. In Spain, T. urticae is a key pest of citrus [5,6,7] and affects especially clementine mandarin trees [8,9,10] because they are susceptible to outbreaks of this mite [11].
In summer, under Mediterranean conditions, T. urticae colonies are preferably located on the underside of the citrus leaves, where they are protected with silk threads. The mite feeds on the content of the epidermal and parenchyma cells of the leaves [12]. As a result of their feeding, they cause discolouration and desiccation, which in most cases is manifested by chlorotic (yellowish and rarely brown) spots and bulges on the upper side of the leaves [13]. Two-spotted spider mite damage also produces webbing and fine stippling. However, where it is most damaging is on the fruit because it causes rusty spots that spread throughout the fruit [6]. These injuries result in significant reductions in the quality of clementine tangerines, which downgrades the fruit and severely lowers the fresh market prices [14,15].
Under the integrated pest management (IPM) strategy, producers assess the presence of this pest on a weekly or biweekly basis between July and September, depending on the incidence of the pest [10]. This evaluation is carried out manually by placing two rings, 56 cm in diameter, in the crown of the tree and counting the number of rings with more than two symptomatic leaves (yellowish spots). This technique makes these evaluations an expensive, time-consuming, and labour-intensive task.
Remote sensing, specifically proximal sensing, can provide an effective alternative in pest monitoring [16,17]. The use of proximal sensors has advantages over manual methods because it allows the vegetation conditions to be inferred in a suitable, faster, and more agile way, while it is also a non-invasive and non-destructive technique. Some studies have been carried out in other non-citrus crops for the detection of T. urticae using a spectrometer. Martin and Latheef [18] used a ground-based multispectral optical sensor as a remote sensing tool to evaluate foliar damage caused by this pest on greenhouse-grown cotton, and they distinguished various levels of infestation at the beginning of the season. Herrmann et al. [19] used multispectral images of pepper leaves in a greenhouse to calculate vegetation indices, which allowed the early detection of damage caused by this pest. In lab-based strawberry leaves, Fraulo et al. [20] employed diffuse reflectance spectroscopy in the visible and near-infrared portions of the spectrum to identify spectral regions altered by the presence of T. urticae. Crockett et al. [21] used spectroscopy and visible and near infrared (VNIR) imaging on the leaves of different strawberry cultivars to characterise the reflectance patterns of the damage, which revealed the existence of differences in varietal susceptibility. In spectral methods based on cameras, Nieuwenhuizen et al. [22] studied the images obtained by an RGB camera and three multispectral cameras to detect red spider mite damage in greenhouse tomato leaves; the results showed discriminant spectral bands between healthy and damaged leaves. Moreover, Uygun et al. [23] developed an innovative image processing technique to determine the level of damage in greenhouse cucumber plants infected by this pest.
Red spider mite causes discolouration and desiccation when they feed the leaf, which, in most cases, results in yellowish spots and/or bulges in the upper side of the leaves [24]. The larva of Phyllocnistis citrella Stainton (Lepidoptera: Gracillariidae) feeds on the leaf in the area between the parenchyma and the cuticle. It traces a winding gallery that grows as the larva grows. The cuticle of the affected leaves breaks, causing water loss in the cells; consequently, the leaf coils dry and break [24]. Nutritional deficiencies in citrus leaves, when severe, are also manifested in symptoms that can be recognised visually [25]. Some symptoms can be similar in colour to the chlorotic spots caused by T. urticae. Nitrogen deficiency occurs in old leaves first and causes a significant yellowing in the veins. In contrast, iron deficiency occurs in recent leaves and produces a loss of their deep green colour that evolves into shades ranging from light green to pale yellow, depending on the intensity of the condition. However, the veins of the leaves characteristically remain dark green and appear marked on a lighter background, resembling a kind of mesh or lattice [26]. Manganese deficiency leads to chlorosis in the interveinal tissue of the leaves, but the veins remain dark green. Sometimes, Mn deficiency can be confused with Fe and Zn deficiency. Recent leaves usually show a reticulate pattern on a lighter green background that is less marked than in Zn or Fe deficiencies. The pattern becomes a green band along the midrib and the principal lateral veins in mature leaves, with light green areas between the veins [27].
Leaf characteristics can be linked to spectral features statistically. In hyperspectral remote sensing, spectral data are typically high-dimensional, fine spectral bands that are highly correlated with each other [28]. Hyperspectral imaging generates a massive amount of redundant and frequently highly correlated data that needs to be processed [29]. This fact may lead to multicollinearity problems and overfitting when using conventional multivariate regression for empirical modelling [30,31]. To handle such a large amount of data and extract useful information, computational statistical methods are needed. These methods connect original variables with the essential spectral information to classify and/or quantify important characteristics [32,33]. Partial Least Squares (PLS) is one of the most popular methods for constructing predictive models. This method is commonly used in hyperspectral imaging to extract and summarise spectral information from hyperspectral images, reduce the high dimensionality of the spectral data, and overcome the problem of multicollinearity [34]. PLS discriminant analysis (PLS-DA) is a variant of PLS regression in which the independent variable is categorical, expressing the class membership of the samples. It is performed to sharpen the separation between groups by maximising the covariance between the spectra and the independent variable, so that a maximum separation among classes is obtained.
This work aims to investigate the potential use of both colour and hyperspectral imaging as a practical tool to detect the presence and the age of the damage caused by T. urticae in tangerine leaves. Another goal is to discriminate this damage from that caused by other pests and from nutritional deficiencies.

2. Materials and Methods

2.1. Leaf Samples

A total of 142 tangerine (cv.‘Clemenules’) leaves were collected from two commercial orchards located in El Puig de Santa María and Chiva (Valencia, Spain) in September 2019. After collecting the leaves, they were stored in a cool chamber at 5 °C. The selection of the leaves was established as follows (Table 1).
Sixty leaves with visible damage caused by T. urticae and 60 leaves with no external symptoms of any damage were chosen to evaluate the ability of an automated system to detect the presence of damage caused by this pest in the leaves. Since recent damage occurs typically in recent leaves [24], to determine whether the damage corresponded to an active pest or an old one, half of the selected leaves, with damage or without, were recent, while the other half were old.
Twenty-two leaves were selected to test the ability to discriminate between T. urticae and other problems, 10 of which were affected by P. citrella and the remaining 12 were affected by various nutritional deficiencies whose aspect was compatible with N (6 leaves) and Fe, Mn, or Zn deficiencies (6 leaves) [35]. These leaves presented a discoloured appearance similar to the damage caused by T. urticae but with different geometrical patterns.
Another 20 leaves were selected, 10 with T. urticae damage and 10 with various deficiencies, to determine the geometric characteristics of the patterns caused by the damage and the deficiencies in the leaves and to tune the algorithm used to process the colour images.
The damage observed in the leaves had well-defined characteristics, such as colour and shape, which made it possible to draw a visual distinction among them. Figure 1 shows images of the leaf samples on both sides for each subset.

2.2. Detection of T. urticae Damage Using Colour Imaging

2.2.1. Colour Image Acquisition and Segmentation

Colour images with a resolution of 0.03 mm/pixel were captured using a digital camera (EOS 700D, Canon Inc, Tokio, Japan) arranged inside a square inspection chamber that included a calibrated and uniform illumination system composed of eight fluorescent tubes (BIOLUX 18 W/965, 6500 K, Osram GmbH, Germany). The angle between the lens axis and the illumination sources was approximately 45° [36], and cross-polarisation was used [37] to avoid direct reflections towards the camera. Images were captured on the day after leaf collection, and the samples were kept at room temperature (22–25 °C) for 30 min before acquiring the images. Images of the leaves were captured from both the upper side and the underside over a uniform white background.
The images were processed using customised software developed by our group at IVIA (FooColor-Inspector v4.0, available at http://www.cofilab.com). The processing consisted in performing an image segmentation based on colour features. However, the damage caused by T. urticae and the colour changes caused by the nutritional deficiencies cannot be differentiated by using the colour feature alone. Thus, a second step was carried out to classify the leaves according to some geometric features of the objects found, as the two types of damage have a very different appearance. Moreover, using only colour information, it is impossible to determine whether the damage caused by T. urticae is new or old, and therefore, the sets G2.1 and G.2.2 were joined together to form group G2.
In the segmentation based on colour features, four classes were predefined as follows: background, green area (which corresponds to the healthy part of the leaf), yellow area (which corresponds to T. urticae or deficiency spots), and brown area (which corresponds to P. citrella spots). Prior to the segmentation, a supervised training process was necessary. For this purpose, another set of 20 leaves, different from those described in Table 1, was used. The training consisted in manually selecting representative regions of interest (ROI) belonging to the predefined classes in the leaves used for this purpose. The colour values (RGB) of the pixels in each region were stored together with the class to which they belonged These values were later used as input to build a Bayesian linear discriminant analysis (LDA) [38]. This type of LDA relies on the Bayes theorem shown in the Equation (1):
P ( x | w i ) = p ( x | w i ) P w i j = 1 m p ( x | w j ) P w j ,   i = 1 , , m
where x was the three-dimensional observed vector (in our case, the average RGB values of an object), wi (i = 1,…,m) was one of the m different classes, m was the number of classes, P(x|wi) was the probability that the observed x belonged to class wi, P(wi) was the a priori probability of an object belonging to class wi (this probability was considered to be the same for each class), and p(x|wi) was the conditional density function of the RGB values in class wi.
The technique used for image segmentation was pixels-wise. Therefore, for each pixel in the image, the probability of belonging to each class was estimated, assigning the pixel to the class with the highest probability. After segmentation, all pixels found in the image were classified based on the predefined classes.

2.2.2. Definition of the Discrimination Parameters

As stated, the colour of the damage caused by the deficiencies and by T. urticae is similar. Therefore, the segmentation process could not separate them into different classes. However, the appearance and geometrical pattern of the damage were completely different. For these reasons, the decision was made to analyse some geometrical properties of the objects initially classified as T. urticae. In the analysis, a distinction was drawn between these objects from leaves damaged by T. urticae and leaves damaged by deficiencies. The purpose of this analysis was to determine the discriminative properties for identifying T. urticae damage, not the detection or identification of deficiencies. Taking into account that damage caused by T. urticae is generally detected as objects with an approximately round shape, the geometrical properties considered for the analysis were [39]:
  • The number of damaged areas detected per leaf.
  • The total damaged area (mm2) of the leaf, as the sum of the areas of all the objects found.
  • The area (A), roundness (R), compactness (C), perimeter (P), and elongation (E) of each object found in the leaf.
Each of these properties was analysed through an analysis of variance (ANOVA) to know whether there were significant differences between those corresponding to the damage actually caused by T. urticae and the discolourations due to deficiencies. Discriminative properties were included in the discrimination algorithm to separate between T. urticae and deficiencies.

2.3. Detection of T. urticae Damage Using Hyperspectral Imaging

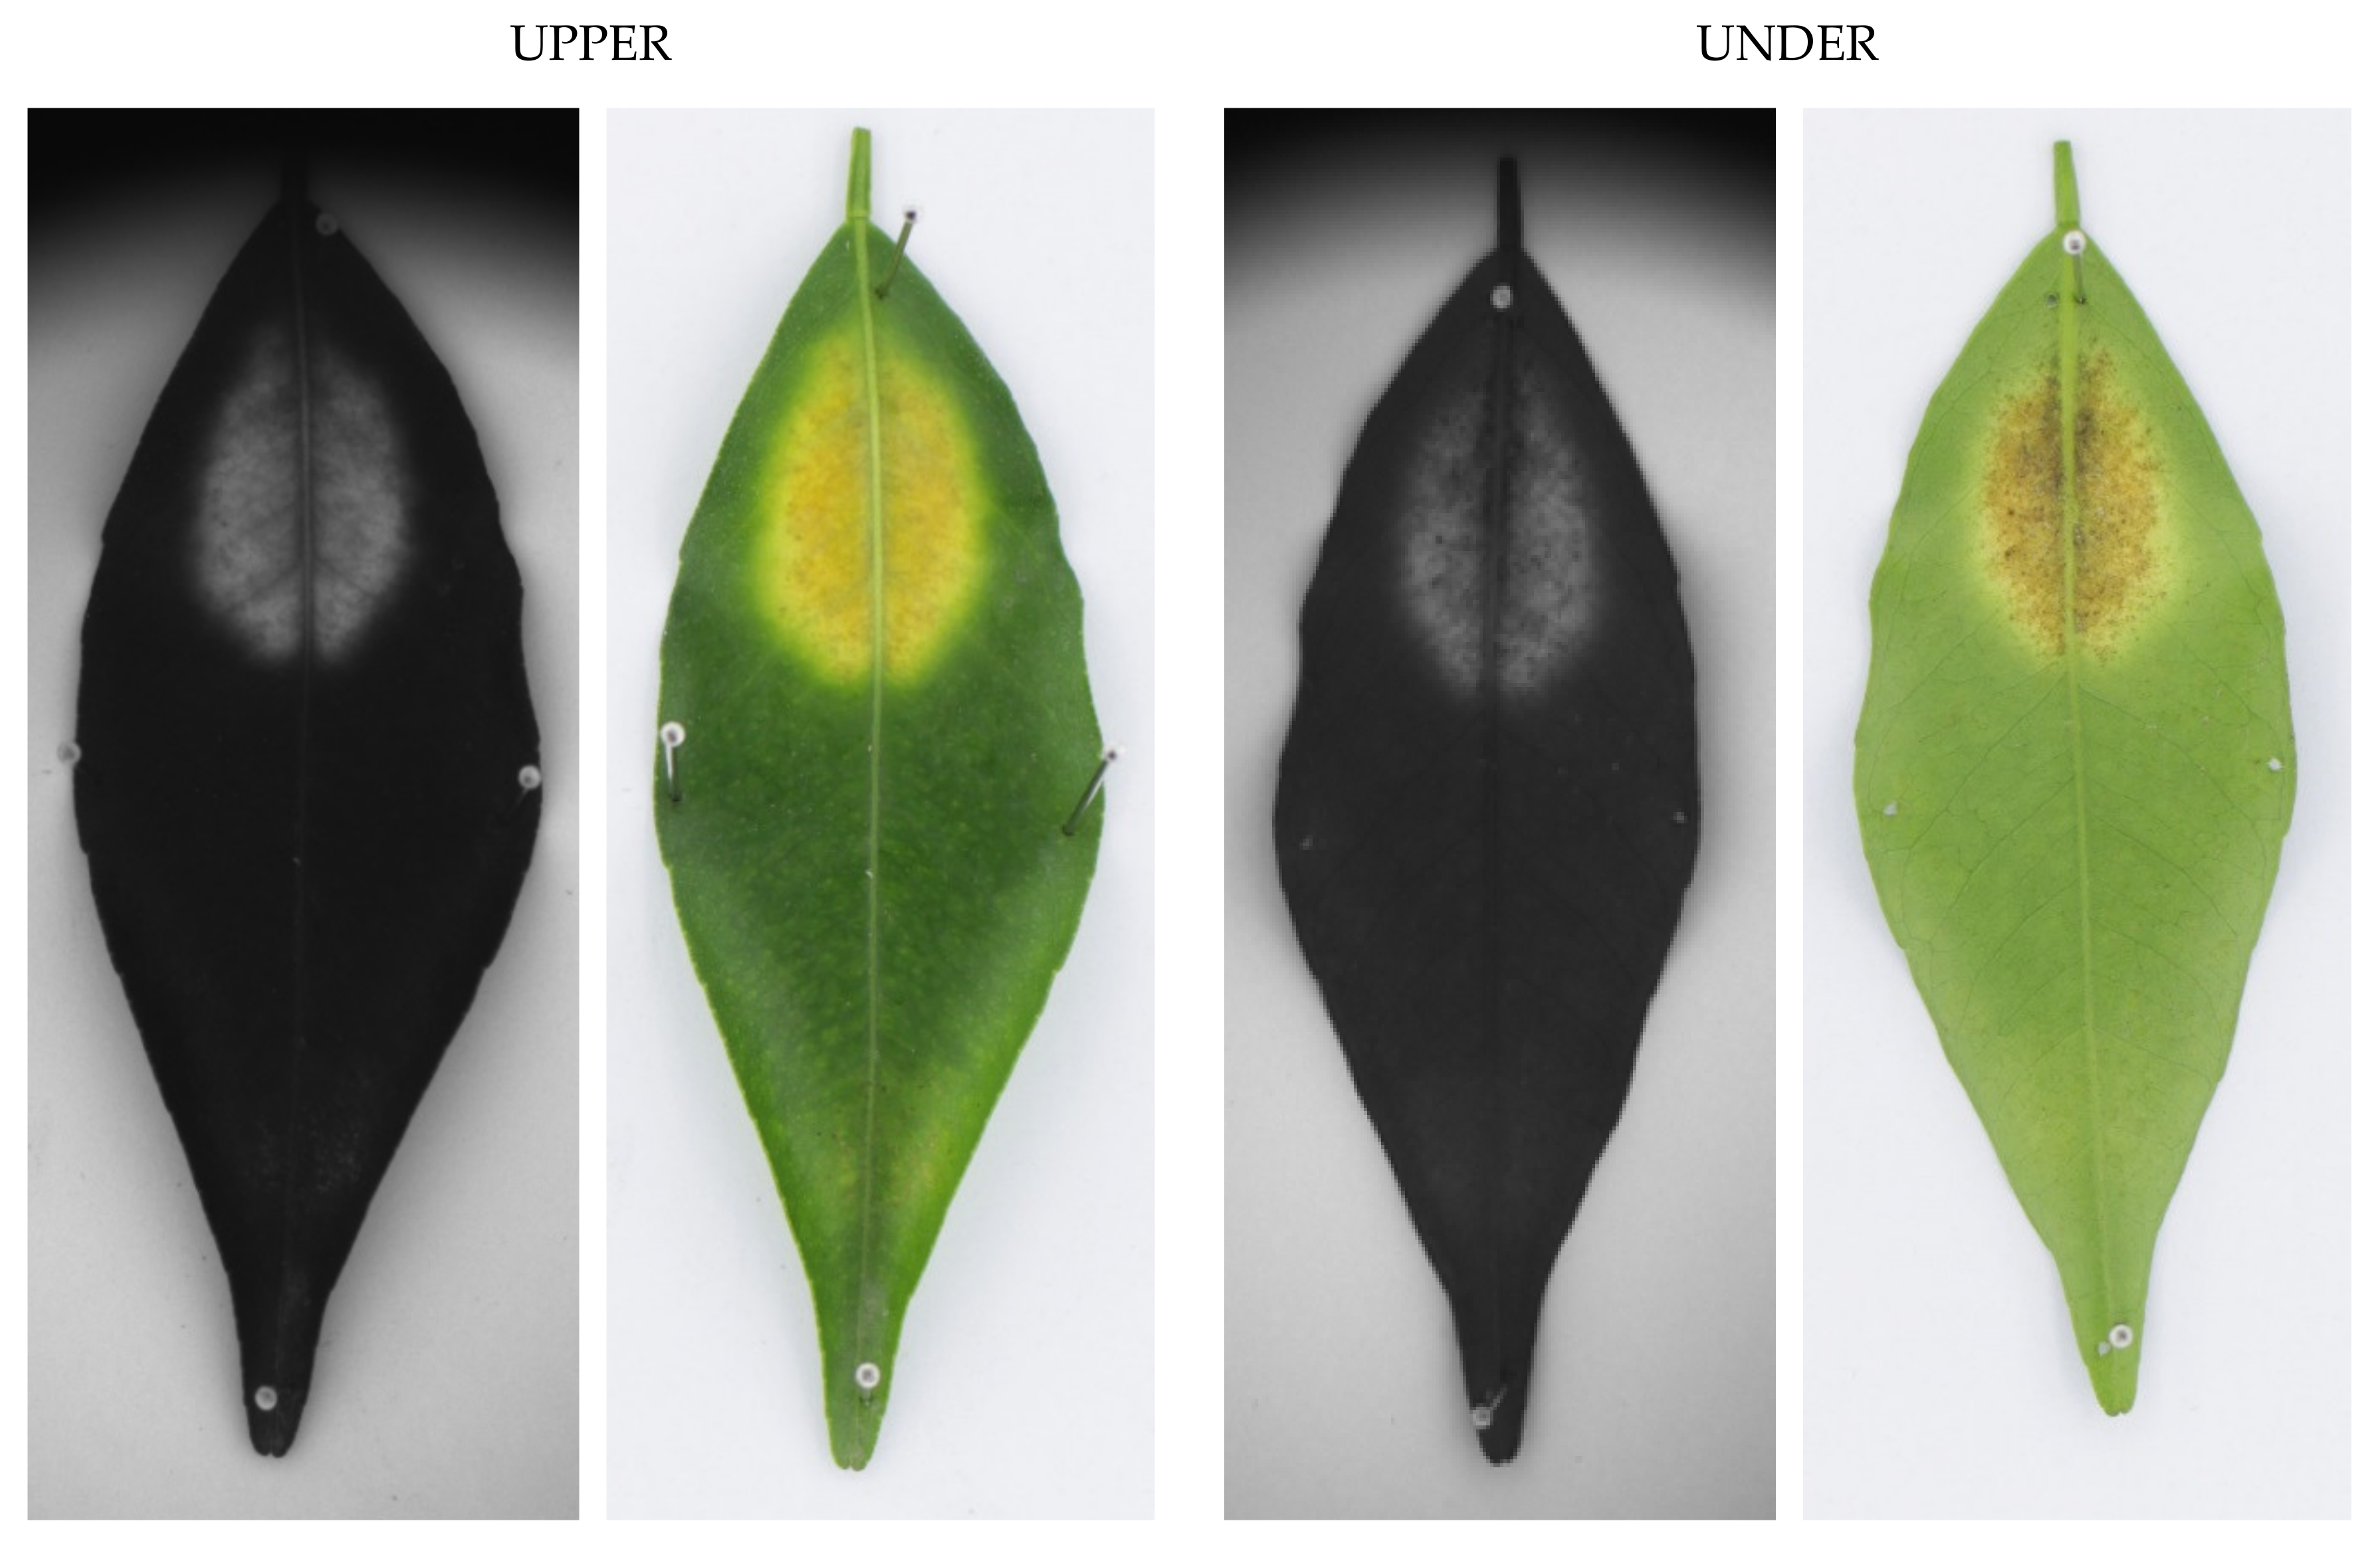
2.3.1. Hyperspectral Image Acquisition

The hyperspectral imaging system was composed of a camera (CoolSNAP ES, Photometrics, Tucson, AZ, USA) and a liquid crystal tuneable filter (Varispec NIR-07, Cambridge Research & Instrumentation, Inc., Hopkinton, MA, USA) that allowed images to be captured in the operating spectral range from 450 to 1000 nm. The camera was configured to acquire images with a size of 1392 × 1040 pixels and a spatial resolution of 0.14 mm/pixel. A total of 56 monochrome images were acquired for each side of the leaf in 10-nm intervals. To optimise the dynamic range of the camera, prevent saturated images, and correct the spectral sensitivity of the different elements of the system, a calibration of the integration time was performed for each band. This consisted in setting the individual integration time for each band required to obtain 90% of the reflectance of a white target reference (Spectralon 99%, Labsphere, Inc., NH, USA).
The scene was illuminated by twelve halogen spotlights (37 W) (Eurostar IR Halogen MR16. Ushio America, Inc., CA, USA) powered by direct current (12 V). The lamps were arranged equidistant from each other inside a hemispherical aluminium diffuser to illuminate the samples indirectly. Two images per leaf (upper and underside of the leaf) were acquired in reflectance mode using customised software developed at IVIA (Figure 2). The reflectance captured was corrected to obtain the relative reflectance using a dark and the white reference through Equation (2) [40]:
ρ x y x , y , λ = R a b s R w h i t e a b s = ρ R e f λ R x , y , λ R b l a c k x , y , λ R w h i t e x , y , λ R b l a c k x , y , λ
where ρRef (λ) is the standard reflectance of the white reference target (99% in this work), R (x, y, λ) is the reflectance of the fruit captured by the CCD sensor of the camera in the pixel located at (x, y) coordinates, Rwhite (x, y, λ) is the reflectance captured by the CCD of the white reference target, and Rblack (x, y, λ) is the reflectance captured by the CCD while avoiding any light source so as to be able to quantify the electronic noise of the CCD.
Therefore, a tagged database of 204 hyperspectral images was obtained (Table 2). Three ROIs with a size of 10 × 10 pixels were selected for each side of the leaf for the case of healthy leaves (G1), the leaves with P. citrella (G3), and the leaves with deficiencies (G4). In the leaves affected by T. urticae (G2), three ROIs were selected from the damaged area and another three were selected from the asymptomatic area for each side of the leaf. Thus, a total of 972 ROIs were obtained from both sides. These ROIs were considered to be the samples for the analysis.
The average reflectance spectrum of all pixels in each ROI was extracted and organised in a table with 56 columns corresponding to the reflectance value of each band and the class to which they belong. The use of adequate object features leads to more stable classification models, as the mean spectrum decreases the amount of data [41]. This approach prevents classification by pixels when objects from different classes contain many similar pixels and are easily wrongly assigned to the opposite class.

2.3.2. Multivariate Data Analysis

Three experiments were planned. The first one was conducted in order to know the ability of a model to discriminate between areas that are healthy and those damaged by T. urticae. Sets G1 and G2 were included in this experiment. The aim of the second experiment was to assess the ability of the model to discriminate between new and old damage, and therefore, subsets G2.1 and G2.2 were included. The third experiment explored the capability of the model to discriminate between T. urticae damage and damage caused by other problems in the leaves. Therefore, all the sets were used to build the models.
To perform the multivariate analysis, PLS-DA was used. In PLS-DA, the regression results are values of Y close to the values assigned to each class. In this analysis, the independent variables (X) were the spectrum of each sample, while the dependent variable Y was a categorical variable representing each class [42]. Thus, a numerical value was assigned to the variable Y representing the class. For the first experiment, to detect the damage caused by T. urticae, a value of 0 was set for damaged leaves and 1 was set for healthy ones. In the second experiment, which was conducted to differentiate between leaves with recent T. urticae and leaves with mature T. urticae damages, a value of 0 was assigned for recent and a value of 1 was set for mature leaves. Finally, in the third experiment, aimed at discriminating among all the different types of damage, the response values were set as 1, 2, 3, 4, and 5 for G1, G2, G4.1, G4.2, and G3, respectively.
In this study, the method used to reduce the huge amount of redundant and correlated data captured by the hyperspectral systems between contiguous wavelengths [33] and to select the optimal wavelengths was based on the vector of the regression coefficients. It measures the association between each variable and the response and selects variables in two steps: (i) the PLS model is fitted to the data, and (ii) the selection of variables is based on a threshold [43]. Variables with a high absolute value can be selected because they make the highest contribution to the classification, and those with a small absolute value can be ignored [44]. In this work, the regression coefficients were obtained from the PLS models.
In all cases, 70% of the samples were used to train and validate the model using cross-validation. The remaining 30% of the samples were used as an independent or prediction test set. Results are given for the test set.
The input spectra for the PLS-DA models were normalised using mean-centring [45]. A single 10-fold Venetian blind cross-validation (i.e., splitting the data evenly into 10 sets and leaving each of the sets out in each iteration of the validation procedure) was used to choose the optimal number of latent variables (LVs) as well as to obtain an estimate of the error rate of the PLS models [46]. Usually, the first latent variables explain most of the variance in the dependent variables, and thus, the dependent variables can be modelled by a reduced number of latent variables (LVs). In a PLS model, the explanatory power of the model increases as the number of PLS factors or variables increases. However, the prediction accuracy of the model may decrease with an increase in model complexity [47]. The software used to construct these PLS models was The Unscrambler X 10.4 (CAMO Software, Oslo, Norway).

2.3.3. Model Performance Evaluation

When a regression method is used to build a classification model, one of the most important parameters to define is the cut-off value, that is, the acceptance interval in which a new sample is considered correctly classified in the class. Similar to [48,49], the PLS-DA cut-off value for the discrimination of samples based on the presence of damage caused by T. urticae was set at 0.5. If the predicted value of a sample was less than 0.5, the sample was classified as damaged; otherwise, it was considered healthy. Likewise, in the second experiment to discriminate the age of the damage, those with a predicted value of 0.5 were deemed to be recent leaves, while those with higher values were considered to be mature leaves and hence old damage. The third experiment contained a higher number of classes, and therefore, intervals were set for each of them. The interval [0.5–1.5] corresponded to healthy leaves, [1.5–2.5] was set for T. urticae, [2.5–3.5] was set for N deficiency, [3.5–4.5] was set for other deficiencies, and [4.5–5.5] was set for damage caused by P. citrella.
For all cases, the results of the PLS-DA models were expressed as a percentage of correct classification. The precision and the predictive capacity of the PLS-DA models were evaluated using the coefficient of determination (R2). The root mean square error between the predicted and the measured values of the reference parameter in the test set (RMSEP) was used for calibration, cross-validation, and prediction.

3. Results and Discussion

3.1. Detection of T. urticae Damage Using Colour Imaging

3.1.1. Discrimination Parameters

In general, the defects caused by T. urticae and those found due to other problems, such as deficiencies, are very different (Figure 3). Although they could not be separated by colour, the geometrical properties allowed good discrimination to be achieved. Geometric properties were calculated for each defect found in the leaves. Furthermore, the total number of defects per leaf and the total damaged area were added together. One-factor analysis of variance [50] was used to know if these properties were significantly different in these two groups and could be used to separate true T. urticae from other damaged areas not caused by the pest. Table 3 shows that most properties were significantly different in the two groups (high F-score, p-value < 0.005). Hence, for the sake of simplicity, the amount of damage per leaf, the total area, and the individual area of the damage were considered in order to classify the leaf as affected by T. urticae or not. Therefore, if the area of the objects found, the amount of damage found in a leaf, and the total area of this damage were within the mean plus/minus the standard deviation of those corresponding to T. urticae, the leaf was considered to be affected by T. urticae.

3.1.2. Detection of the Damage

Table 4 shows the classification of the damage detected for each set and subset according to the side of the leaf. The method based on colour information correctly determined 100% of sound leaves in all cases, regardless of whether they were recent or old. The detection of T. urticae damage was also high in all cases, reaching an overall success rate of 92.5% (91.67% with the underside and 93.33% with the upper side of the leaf). Most errors were due to damage that went undetected, and only in two cases, in the underside of old leaves, were they confused with damage caused by P. citrella, which was probably due to browning caused by ageing of the T. urticae damage in the leaf. P. citrella was successfully discriminated in 100% of cases when the underside was examined, as this pest is located in this part of the leaves. Finally, the discrimination between damage due to deficiency was different depending on the nutrient. N deficiency could not be correctly discriminated as the main symptom was the lightening of the green colour, but it did not follow any particular pattern. The system was unable to establish a valid general threshold to determine when a leaf had N deficiency or was just light green. The case of other deficiencies performed better, but only in 50% of cases were they correctly discriminated from the damage caused by T. urticae. However, they were separated from T. urticae in 100% of the cases, despite the similarities in colour.

3.2. Detection of T. urticae Damage Using Hyperspectral Imaging

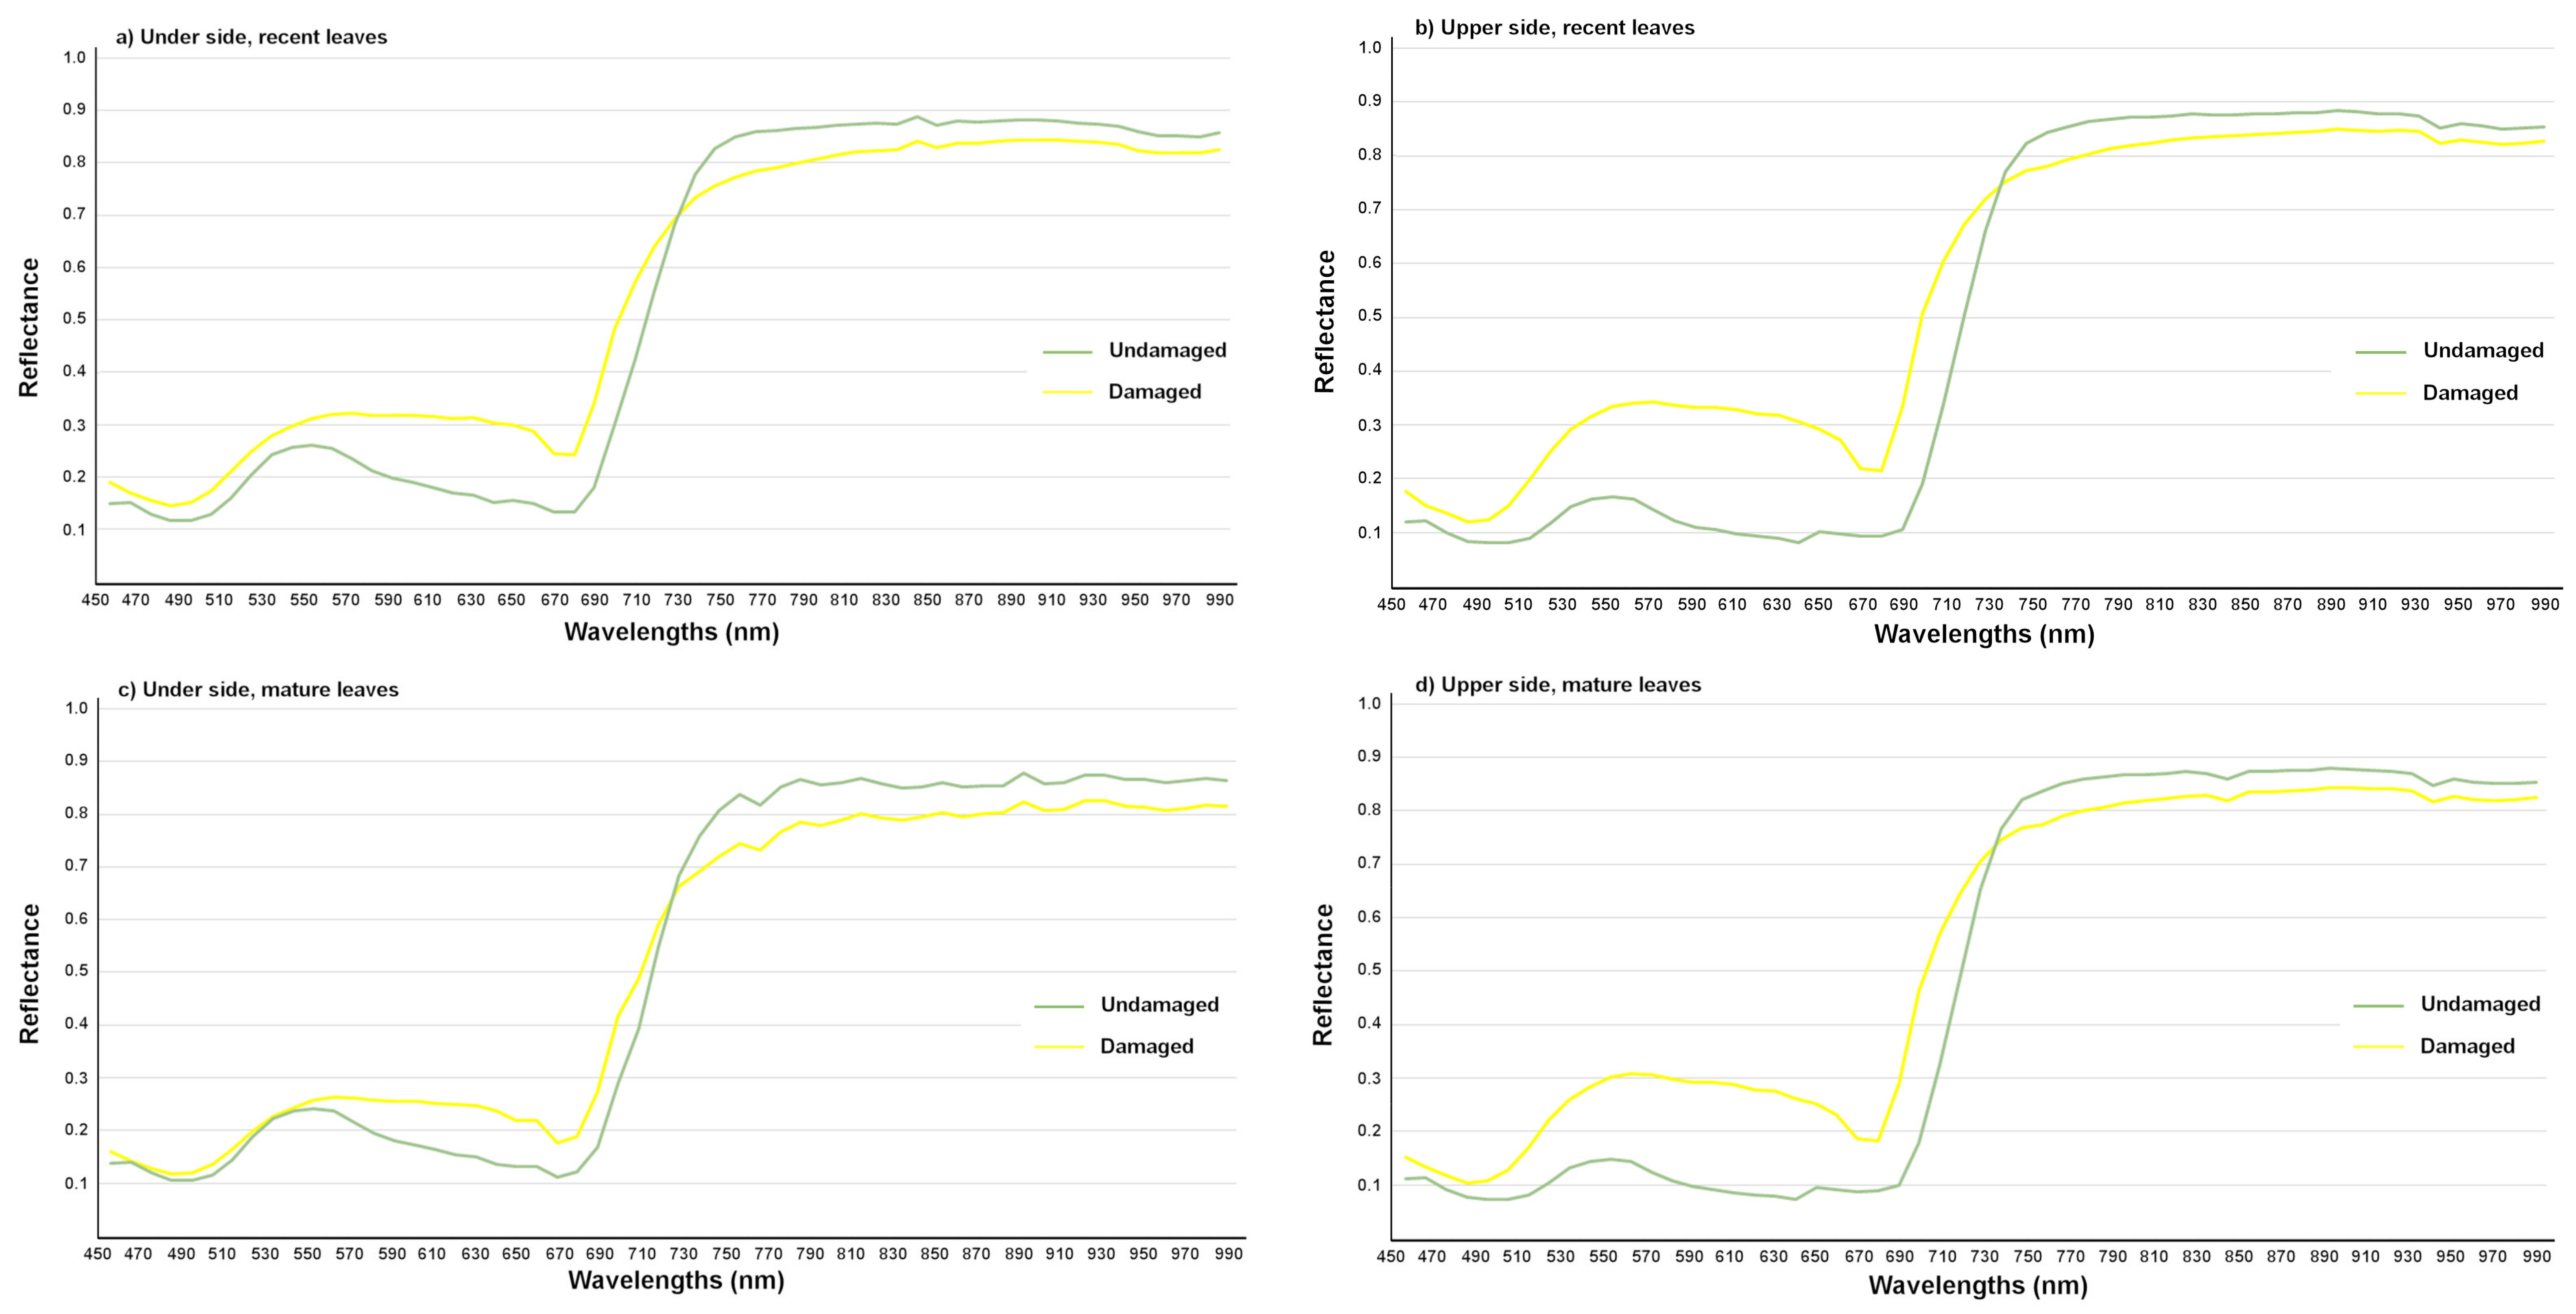
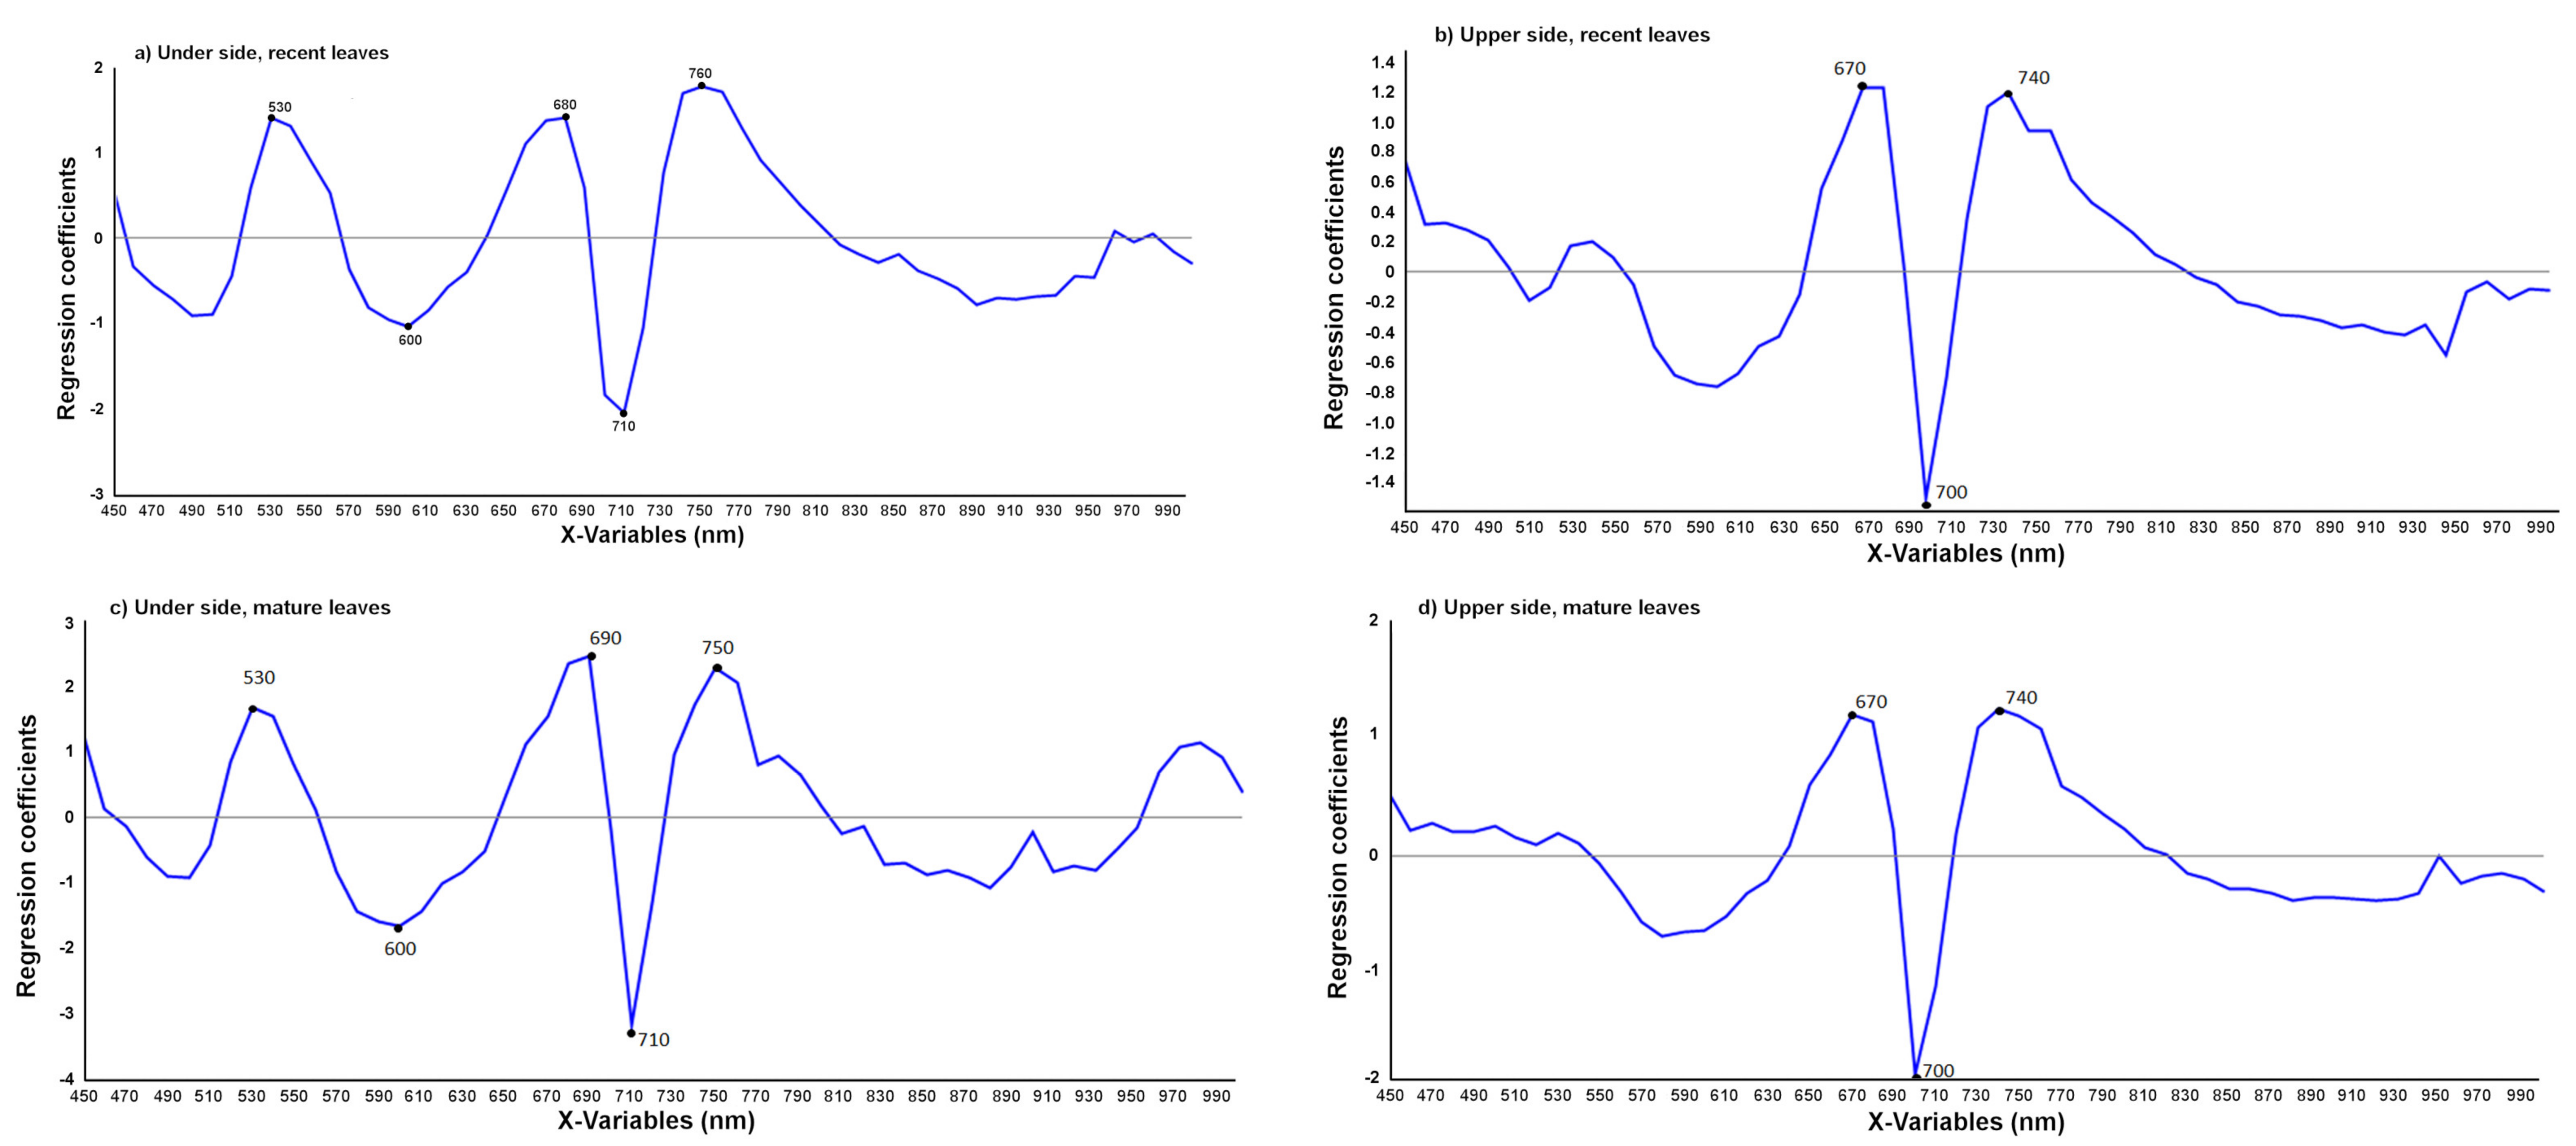
3.2.1. Detection of T. urticae Damage

Figure 4 shows the average reflectance spectra obtained from the upper side and the underside of healthy and damaged regions of sets G1 and G2 according to age. Both healthy and damaged spectra follow the typical pattern of the reflectance of healthy and stressed plants [51]. Most differences between healthy and damaged areas were found in the visible region due to changes in the colouration of the plants, as the damage by T. urticae causes a chlorotic spot characterised by a yellow discolouration. This discolouration is caused by a loss of pigments due to the effect of the pest. Leaf pigments (mainly chlorophyll, carotene, and xanthophyll) are an essential factor in energy absorption by leaves in the 400–700 nm region [52]. Specifically, for healthy areas, the absorption level in the 530–600 nm region was lower, and therefore, the reflectance was higher than in the adjacent blue and red regions, its highest point being around 550 nm [53]. This fact is responsible for the perception of the green colour in the leaves.
In contrast, the damaged regions did not show any peak around 550 nm due to discolouration on the leaf caused by the pest. In this case, the curve extended between the green and red regions in the visible spectrum, reaching its midpoint around 600 nm and showing the peak in different areas of this range of the spectrum. As of 700 nm, a transition was observed in the chlorophyll absorption zone with the progressive rise in the spectrum value to the 740–750 nm bands. This sharp rise in the curve between the red and the NIR region is known as red-edge. The slope and the red-edge position have been correlated with chlorophyll concentrations, and therefore, the position and slope of the red border also change in damaged leaves because healthy ones continue to have active photosynthesis [54].
Two classification models were built based on supervised PLS-DA using all of the 56 wavelengths in the spectral range 450–1000 nm and using only the selected wavelengths. Figure 5 shows the vector of regression coefficients on each side and for each age of the leaf. Those wavelengths with the highest absolute regression coefficients were selected as essential wavelengths. In the case of the upper side, apparent visual differences are observed between the green of the healthy regions (530 nm) and the yellow chlorotic spots of the damaged areas (600 nm). However, the most important wavelengths were three identified around the red and the red-edge regions (670, 700, and 740 nm).
Variations in spectral variables (X) and categorical variables (Y) were described by only seven LVs. This relatively small number of LVs suggests a low correlation in the spectra of different classes but similarities in the spectra within classes. Furthermore, the low number of LVs indicated the excellent differentiation between the classes that were constructed. Moreover, for the use of all and the selected wavelengths, the values of RMSEP did not show a great difference for calibration and validation, respectively, which exhibited good agreement, thus indicating that the calibration error is a reasonable estimation of the standard error of prediction observed in the test set. Furthermore, the test set yielded results similar to those of the calibration set, with an R2 greater than 0.87 in all cases, thus indicating the excellent performance of the model for the classification of damage. Indeed, the rate of successful classification achieved was 100% for all cases. The models could detect 100% of cases of damage by T. urticae in mature and recent leaves and on the upper and the undersides.

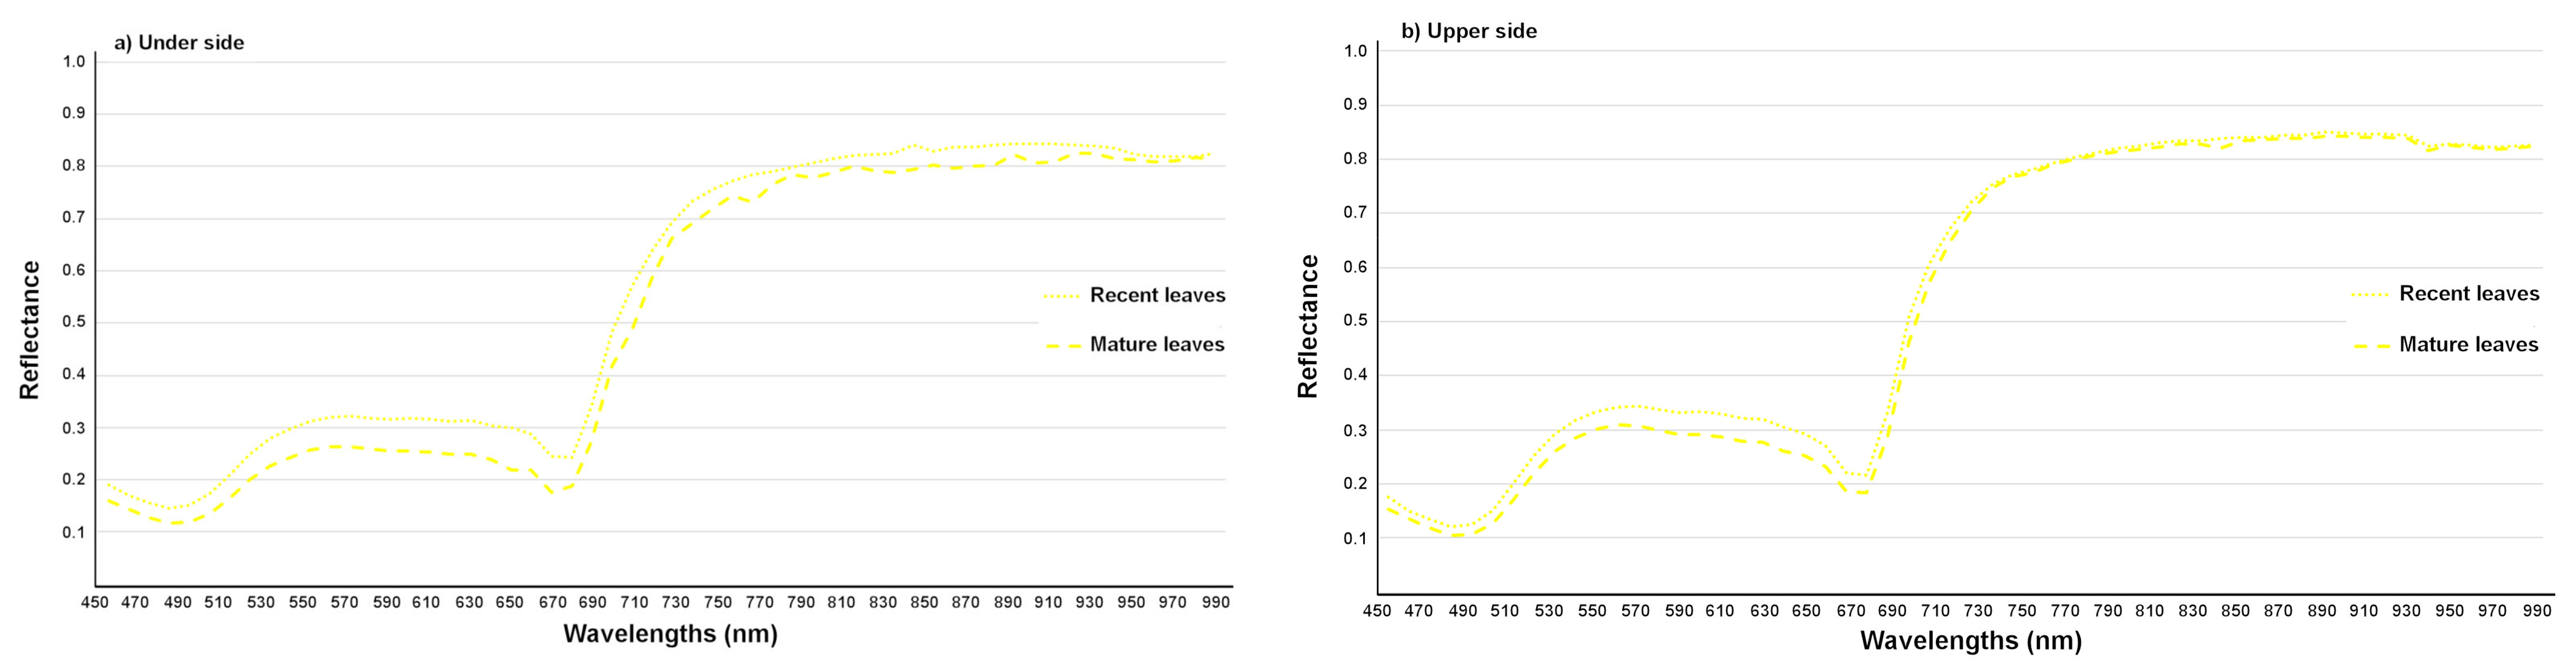
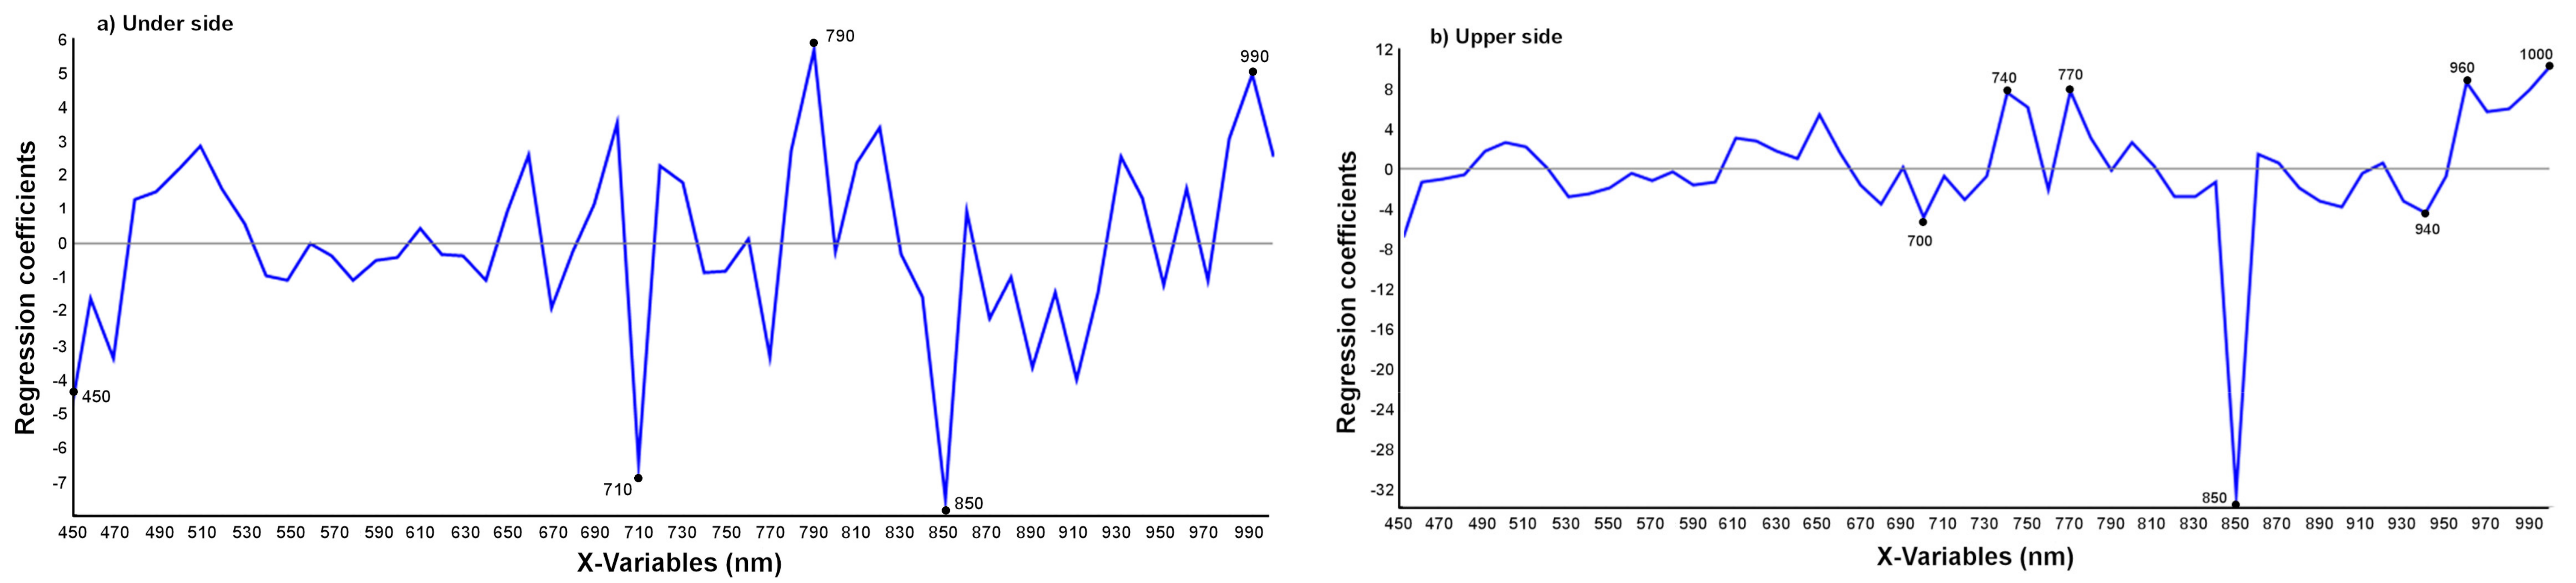
3.2.2. Detection of the Age of the T. urticae Damage

In order to determine whether the damage was caused by a recent or an old infestation of T. urticae, Figure 6 shows the mean spectral reflectance obtained from the damage caused by this pest for each side as a function of the age of the leaf. Some differences were observed between recent and mature leaves with damage on both sides of the leaves. The reflectance of the damage of the mature leaves is lower than the reflectance of recent leaves, especially in the visible part of the spectrum. This could be due to differences in the pigmentation. A low pigmentation content results in higher reflectance and vice versa. Therefore, in a recent leaf affected by T. urticae, the breaking down of chlorophylls causes the presence of carotenes and xanthophyll to be more evident, thus producing a sharp increase in the reflectance [55]. Another possible reason could be the changes in the spectral properties of plant leaves during the growing season. The very recent folded, compact, and underdeveloped leaves exhibit a lack of chlorophyll that increases the reflectance, while leaves with a brown appearance diminish the near-infrared reflectance [55].
Five wavelengths were obtained from the vector of regression coefficients per underside and seven per upper side of the leaf (Figure 7). The spectral bands selected as essential are mostly located behind the red-edge, the 850-nm spectral band being typical for both sides of the leaf.
Table 5 shows the results obtained for PLS-DA classification according to the age of the damage. For both models, a high percentage of damage was correctly classified according to the age of the damage (>92% for all cases). It is noticeable that the success rate of 100% was achieved for the underside, since it is the part of the leaf where the mite feeds and the damage is quite apparent.
For the underside, the RMSEP values obtained in the optimal wavelengths PLS model were higher compared to the model with all wavelengths. Both showed agreement between calibration and validation, also obtaining an R2 higher than 0.87 in all cases. On the other hand, the upper side of the leaf showed a very low R2 for prediction, with a value of 0.65 for the model based on all wavelengths.

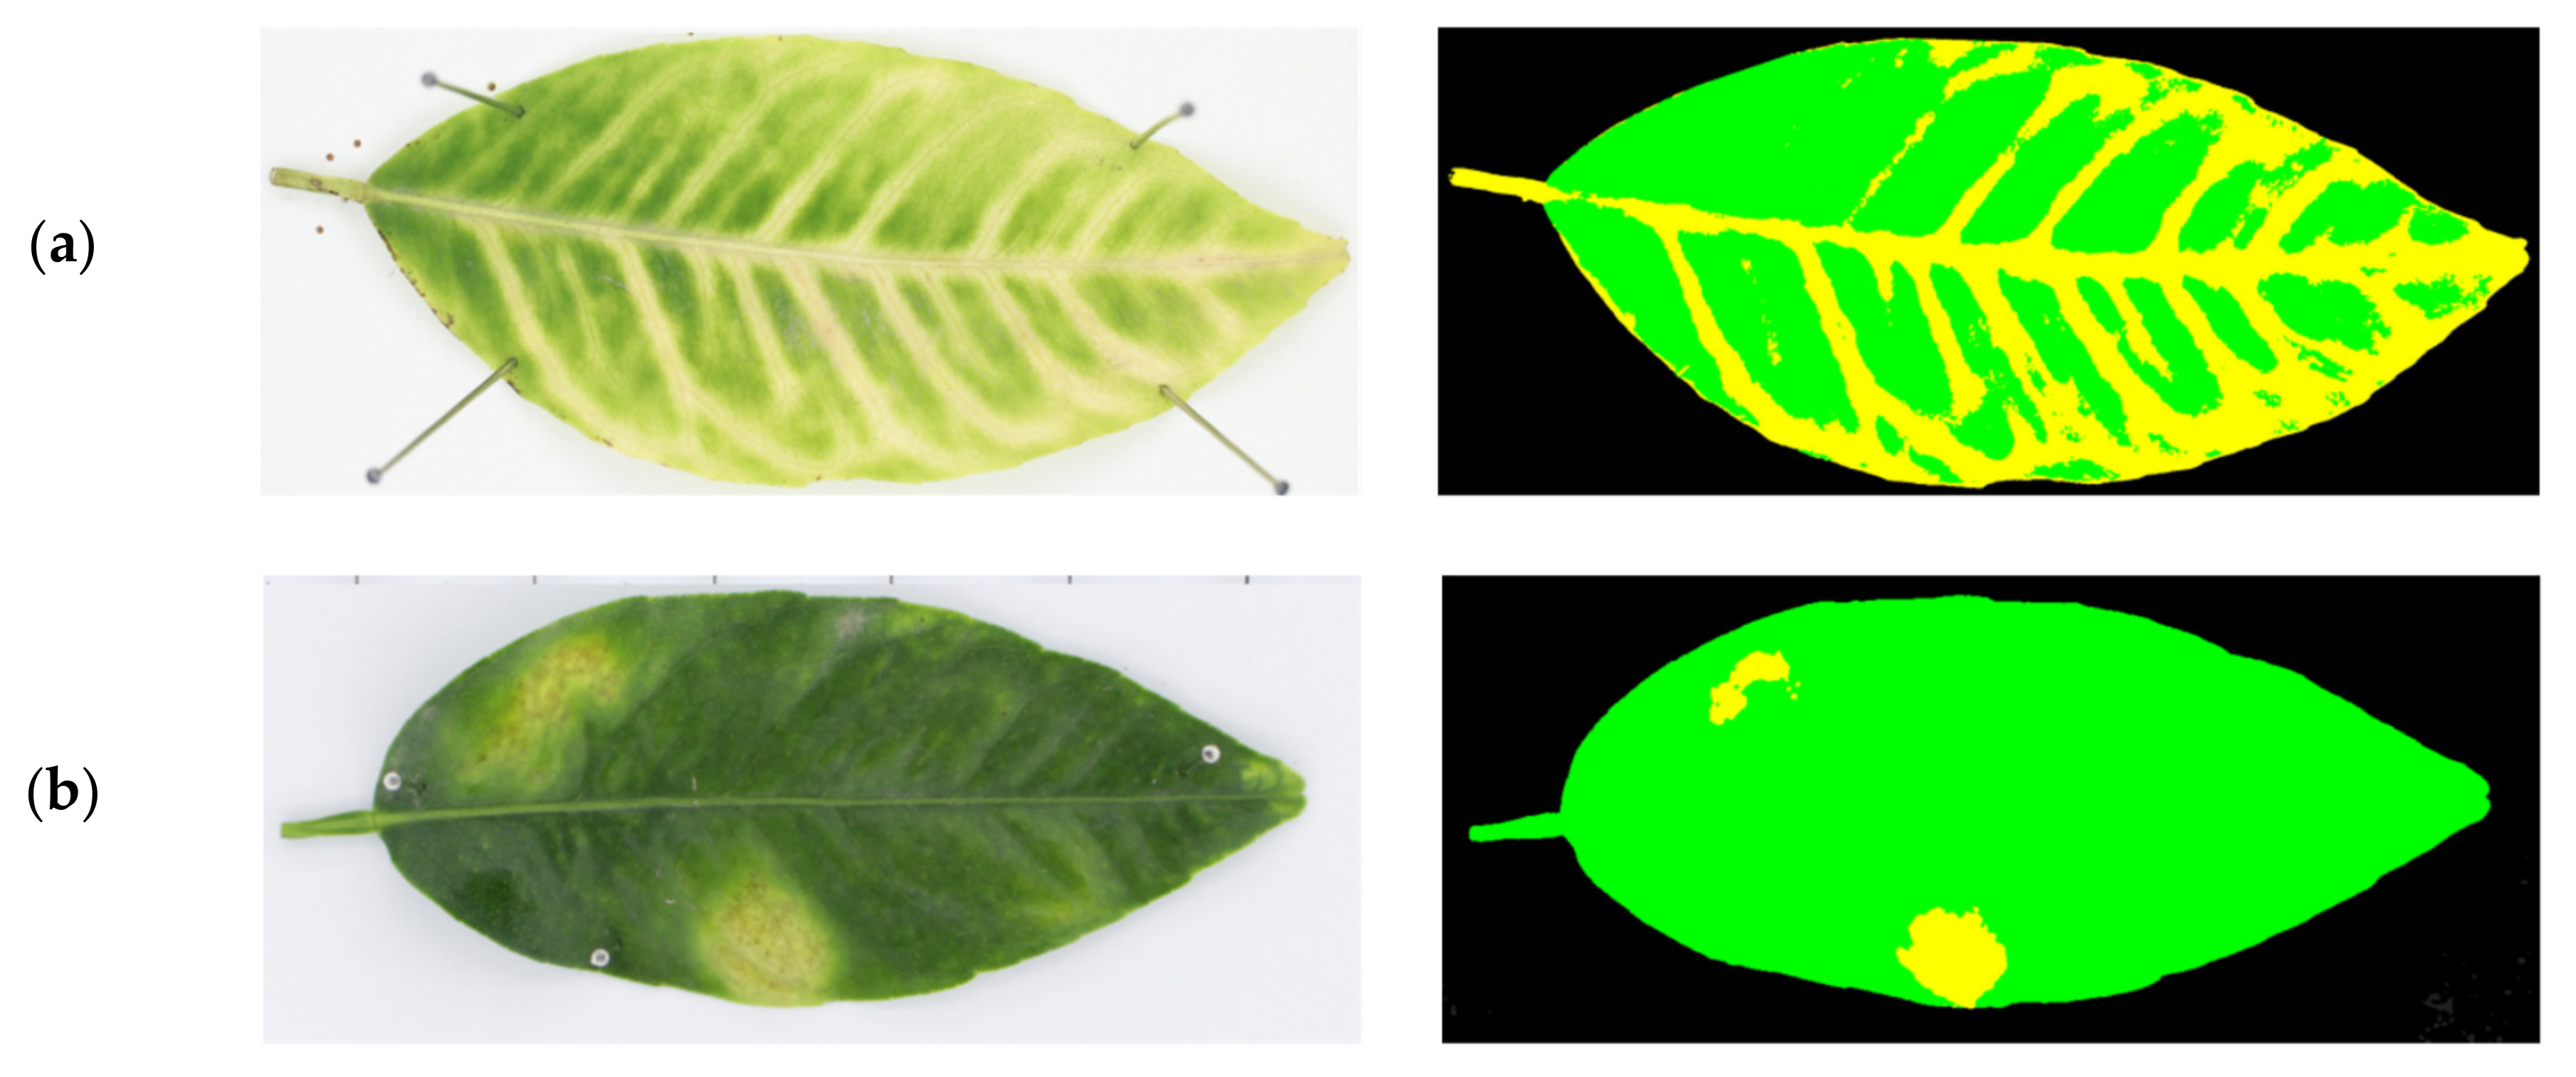
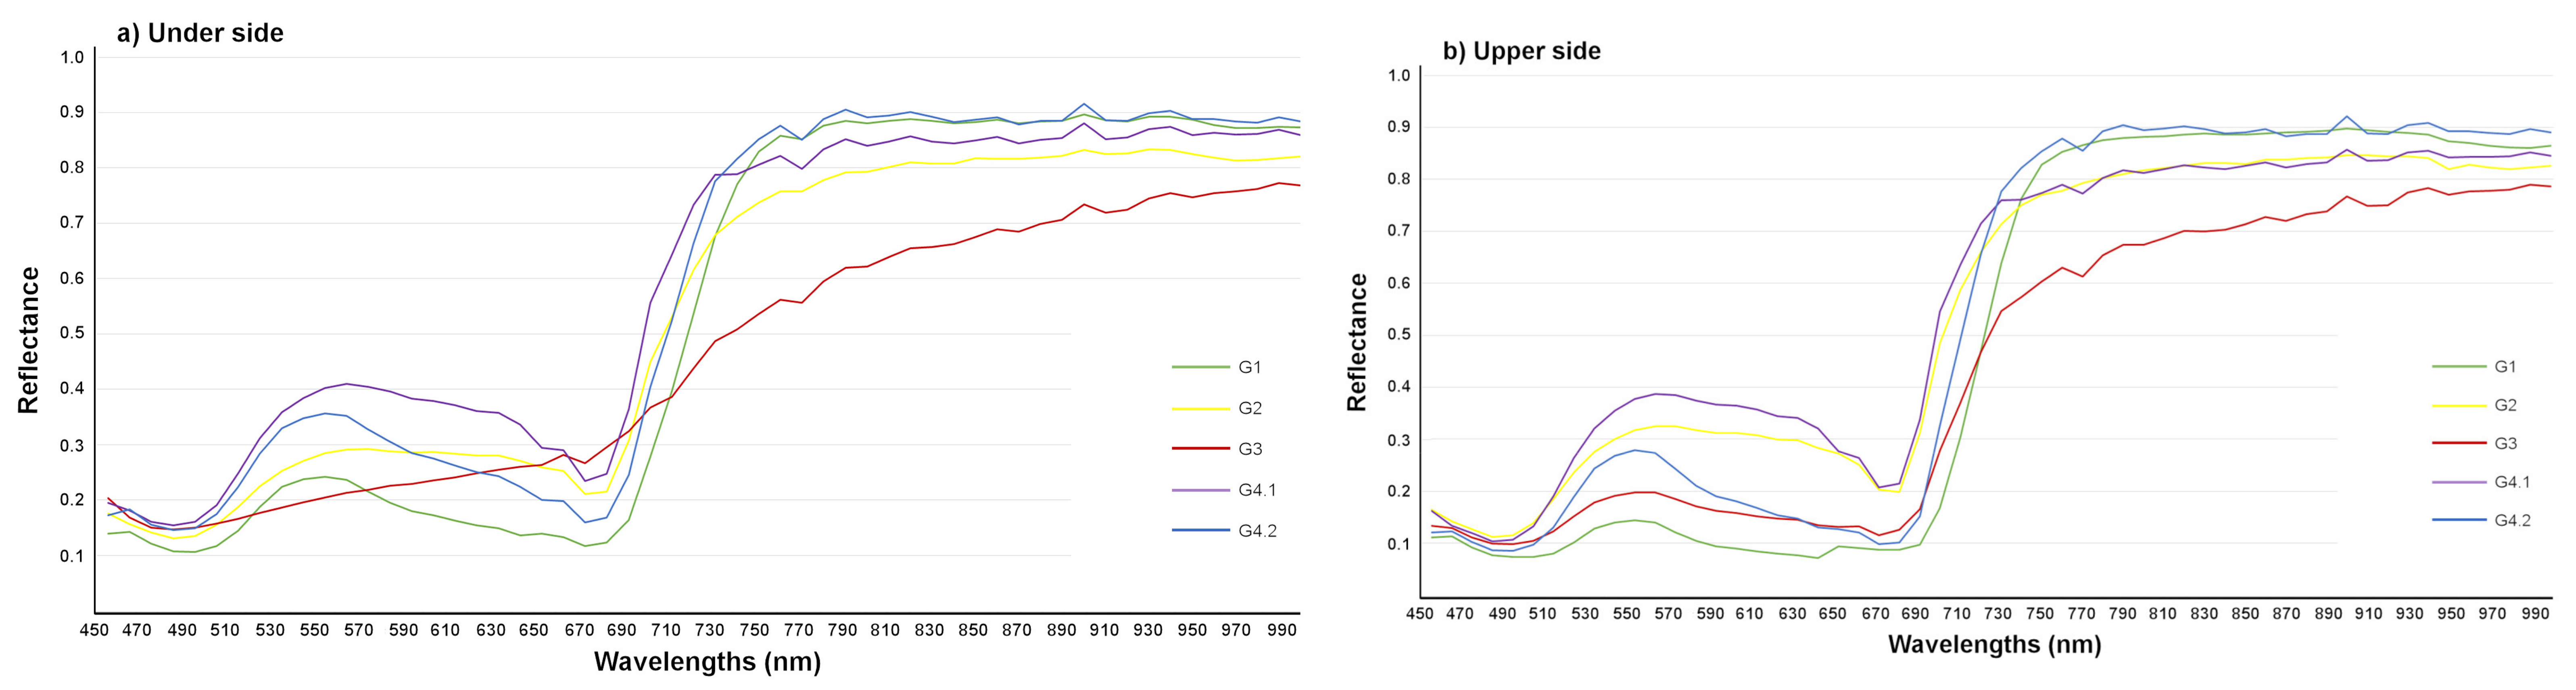
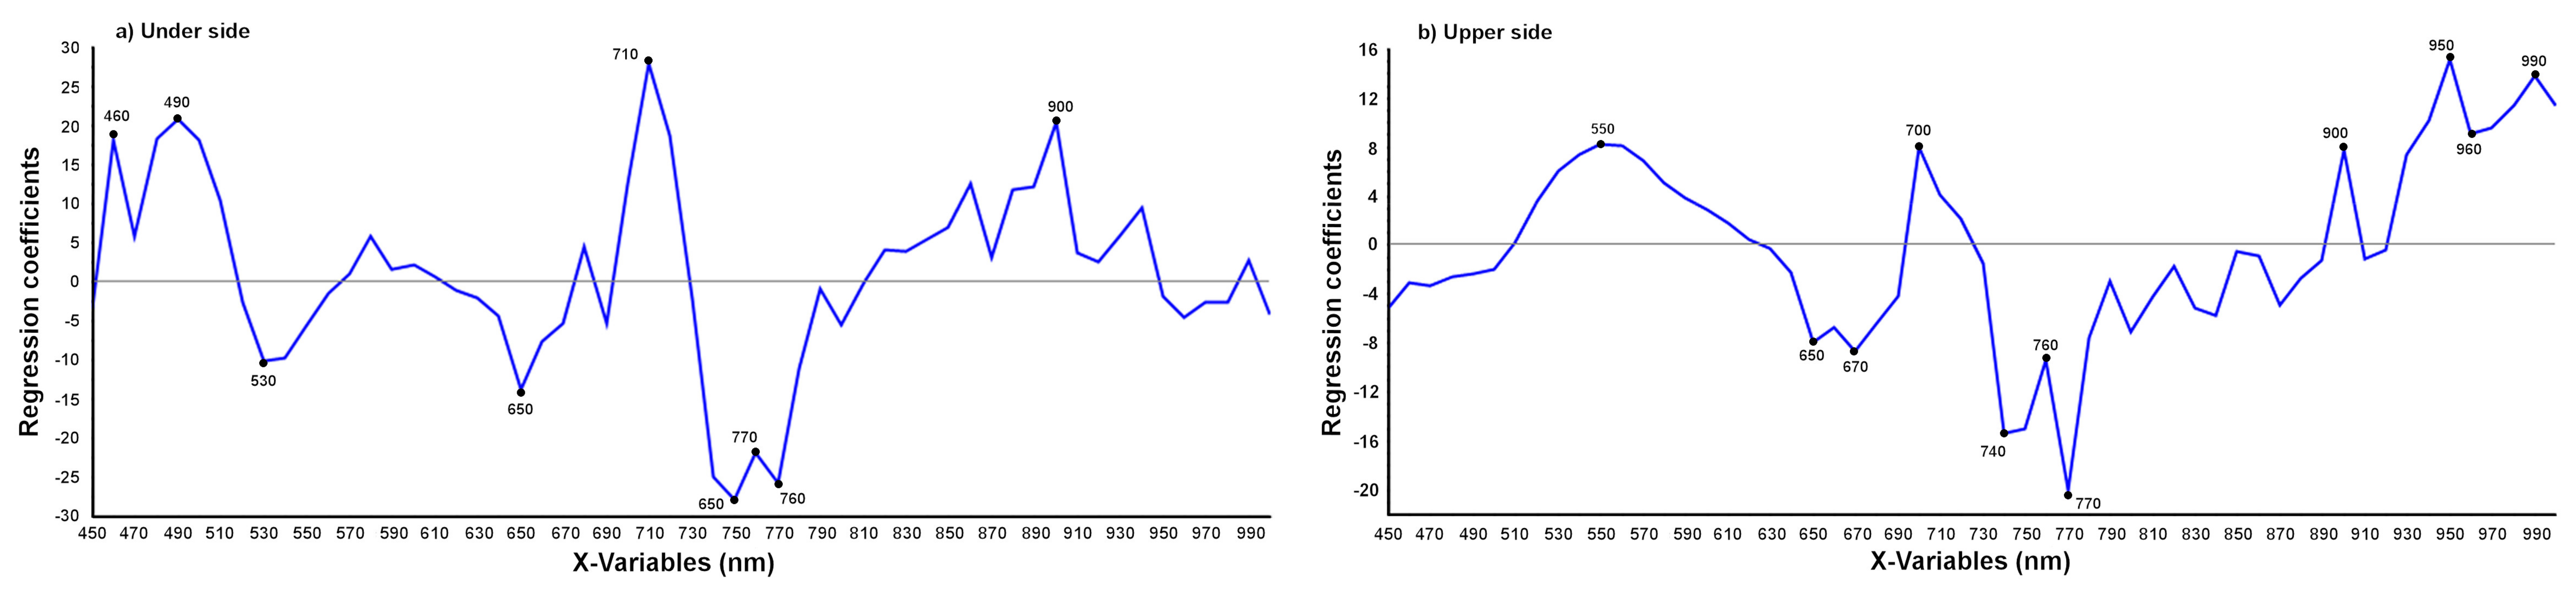
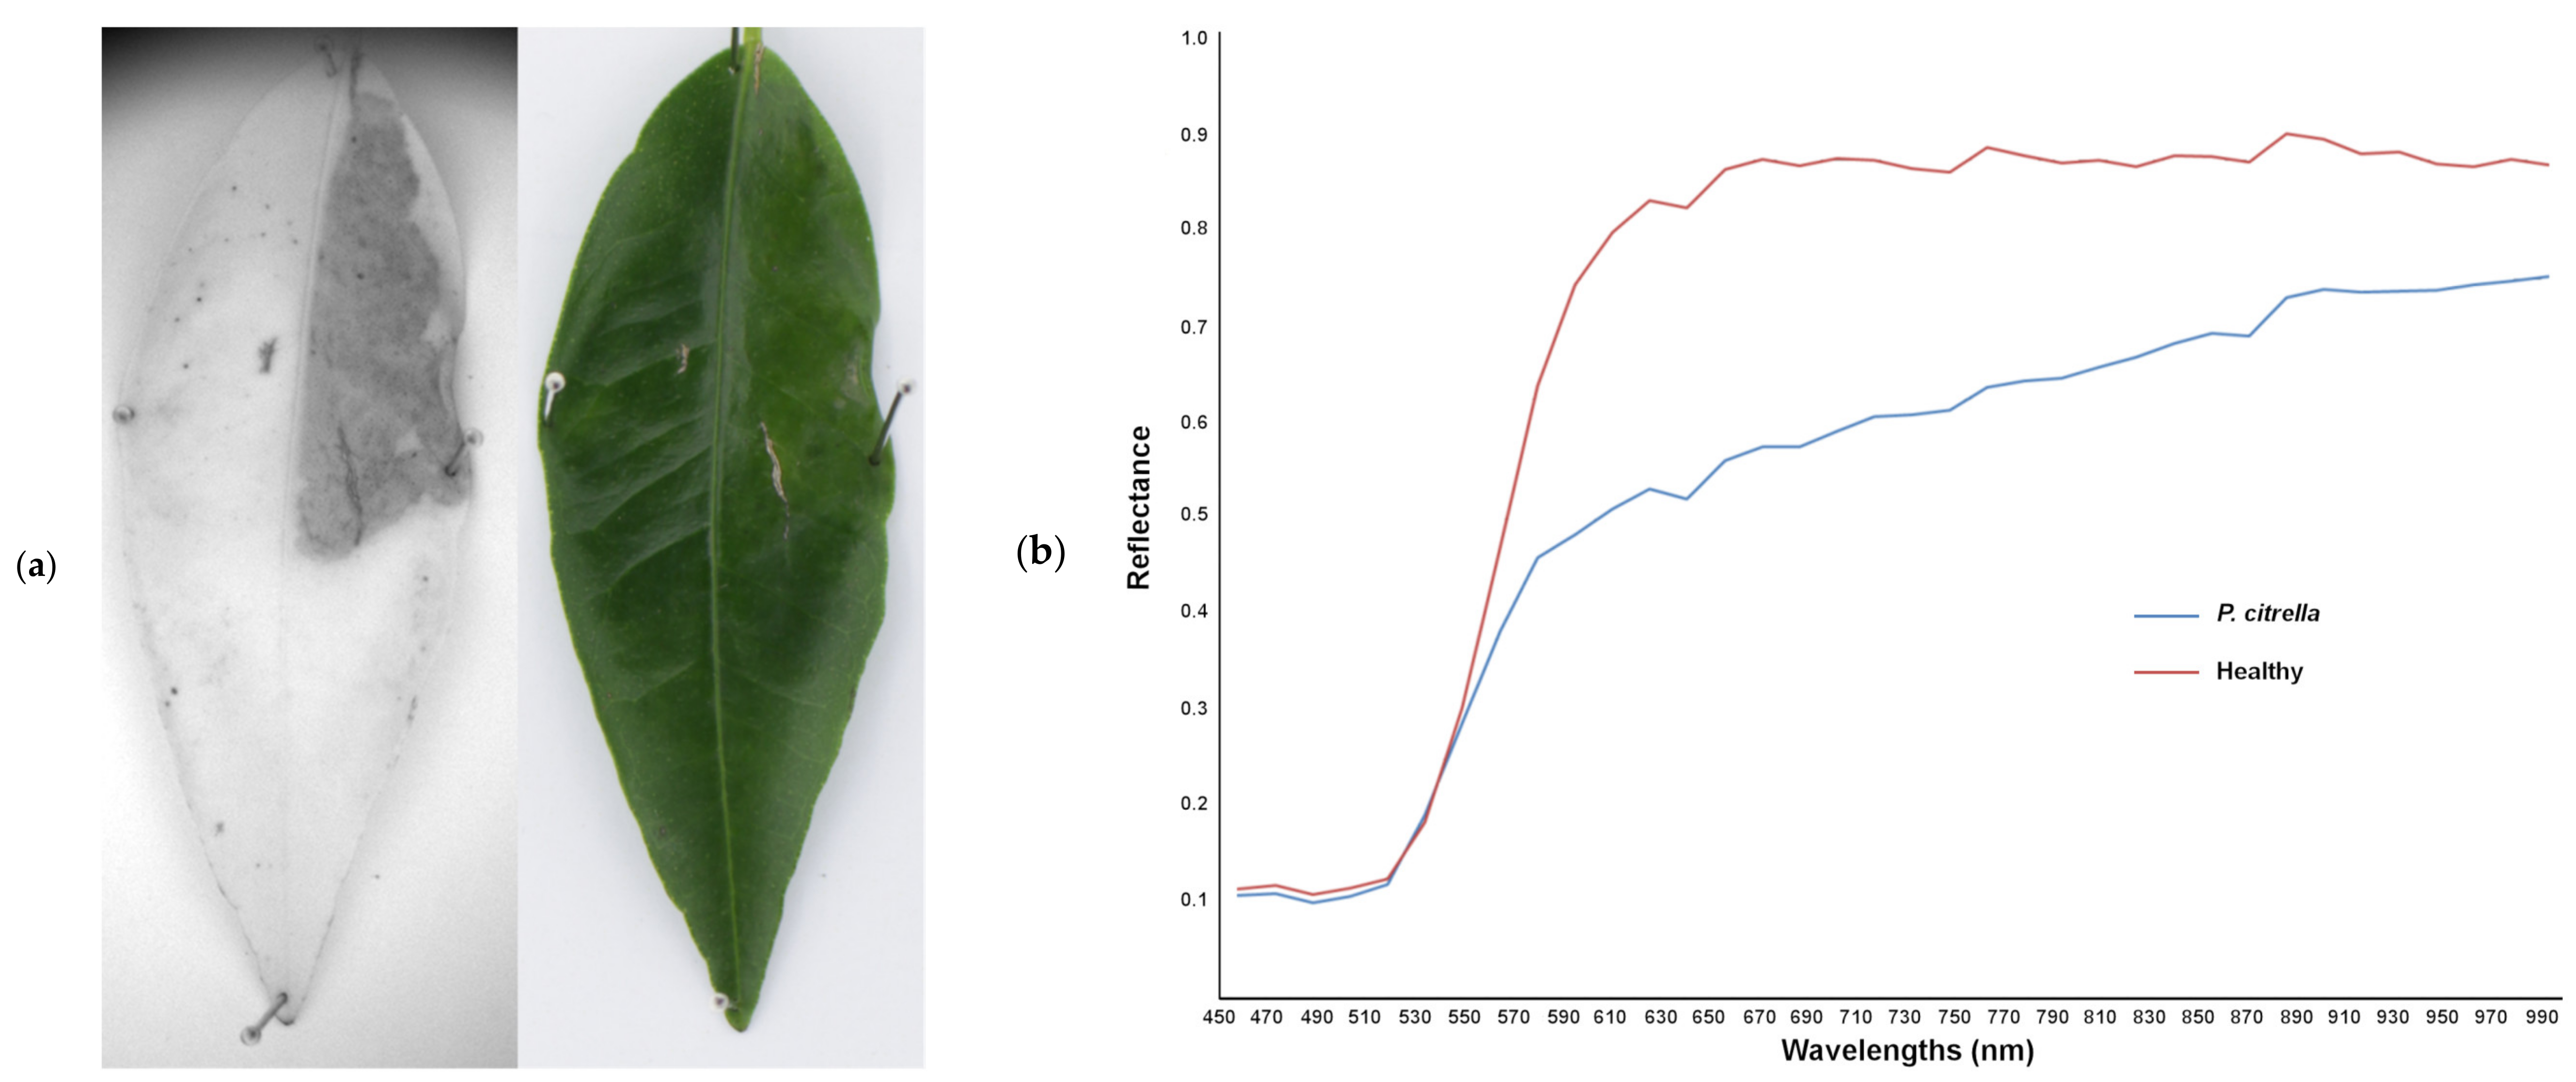
3.2.3. Discrimination between T. urticae and Other Damage

The mean reflectance spectra of healthy leaves, damage by T. urticae and P. citrella, and leaves with different deficiencies were evaluated for each side of the leaf (Figure 8).
In the spectral range from green to red, the differences could be observed between the various types of damage. The set G2 (T. urticae) and the subsets G4.1 (N deficiency) and G4.2 (damage due to other deficiencies) presented a peak at around 550–570 nm on both sides of the leaf, but with a level of a different intensity. On the other hand, the set G3 (P. citrella) presented a different behaviour depending on the side of the leaf, since the gallery created by the larva during its feeding is quite visible only on one side of the leaf.
The valley in the 670–690 nm region was marked in all cases, indicating the absorption of chlorophyll to a greater or lesser extent. In the 700 to 750 nm region, the spectrum value increased, but not with the same level of intensity for all cases. G3 obtained low reflectance values in the NIR for the other types of damage, which indicated that this vegetation was quite diseased or that it had a considerable lack of humidity. In this spectral region, valleys and peaks can be seen quite clearly in different spectral bands for each type of damage. On both sides of the leaf, the peak at 760 nm and the valley at 770 nm are typical for damage not caused by T. urticae. The same happened with the peak at 900 nm.
The wavelengths that made the biggest contribution to the classification were obtained through the regression coefficients from the PLS model (Figure 9). This vector of regression coefficients showed nine wavelengths on the underside and eleven on the upper side of the leaf.
The RMSEP values for calibration and validation in the models with the full spectrum and the selected wavelengths were similar. The prediction R2 for the two sides showed values of 0.85 and 0.84 using all the wavelengths and 0.80 and 0.86 using the selected wavelengths.
Table 6 shows the results obtained for the damage classification based on the groups of samples. All models, using all and the optimal wavelengths, showed a low percentage of correctly classified damage (<50%), with the lowest value for the damage caused by other deficiencies (0% on both models on each side of the leaf).
It is worth noting the potential of the system to detect damage caused by P. citrella that is almost invisible from the upper side of the leaves, as can be seen in Figure 1 and Figure 10a. Although this was not the aim of this research, which focused on damage caused by T. urticae, this finding is relevant. P. citrella is a severe and dangerous pest that is difficult for any automated surveillance system to detect, as the visible damage is caused in the underside. However, using a wavelength of 770 nm, which the PLS analysis identified as one of the most important for the problem, it was possible to see the damage that could not be detected using the colour vision system. Figure 10a shows the comparison between the upper side of a leaf photographed with a colour camera and in the 770 nm band. In general, as shown in Figure 10b, the damaged area presents a lower reflectance in the NIR region, which is in agreement with most scientific works on the reflectance of stressed plants.

4. Conclusions

Colour and VIS/NIR hyperspectral imaging were evaluated under laboratory conditions to detect the damage caused by T. urticae and if it is recent or old. Likewise, they were tested to determine their capacity to discriminate it from other damage, as the caused by P. citrella, and other nutritional deficiencies on tangerine leaves.
In colour imaging, a success rate of 100% was obtained to identify leaves without damages while the leaves with the presence of T. urticae were correctly identified in 92.5% of cases. Most errors were caused by confusion with some deficiencies. However, this method was not capable of discriminating between old and recent damage caused by T. urticae.
In hyperspectral imaging, the PLS-DA model was able to separate sound from damaged areas in 100% of cases. On the one hand, recent infestations were distinguished from old ones in 92% of cases, with a 100% success rate for the underside of the leaves, as the damage is more evident on this surface. On the other hand, the models for exploring their capability to discriminate between T. urticae and damage caused by other problems showed a percentage of correctly classified damage of less than 50%. More specifically, for the discrimination of damage caused by other deficiencies versus T. urticae, it was impossible to establish discriminatory differences.
Although it was not the objective of this research, a relevant finding has been the potential of hyperspectral systems to detect the damage caused by P. citrella. This pest is difficult to detect by any automatic surveillance system because the damage is hidden on the underside of the leaves, and hence, it is difficult to see beyond a certain distance.
The results indicated the potential of colour and hyperspectral imaging to detect the chlorotic spots caused by T. urticae in citrus leaves as fast and automatic techniques that represent an improvement on manual methods.

Author Contributions

Conceptualisation, J.B. and P.C.; Data curation, M.G.G.-G.; Formal analysis, M.G.G.-G.; Funding acquisition, J.B. and P.C.; Investigation, M.G.G.-G.; Methodology, J.B.; Project administration, P.C.; Software, J.B. and S.C.; Supervision, P.C.; Validation, S.C.; Writing—original draft, M.G.G.-G.; Writing—review and editing, J.B. and P.C. All authors have read and agreed to the published version of the manuscript.

Funding

This work was partially funded by the Generalitat Valenciana–Instituto Valenciano de Investigaciones Agrarias (GVA-IVIA) project 51918 and the European Regional Development Funds (ERDF). María Gyomar González-González thanks INIA for the FPI-INIA grant CPD2016-0007, partially supported by European Social Funds (FSE).

Acknowledgments

We thank Fontestad, S.A. (Museros, Valencia, Spain), and Revacitrus, S.L. (Almazora, Castellón, Spain) for providing the leaves and technical support, the staff at the Centro de Agroingeniería-IVIA for technical support, and Ana Quiñones (from CDAS-IVIA) for advice on nutritional deficiencies.

Conflicts of Interest

The authors declare no conflict of interest. The funders had no role in the design of the study; in the collection, analyses, or interpretation of data; in the writing of the manuscript, or in the decision to publish the results.

Abbreviations

ANOVAAnalysis of variance
CCalibration
CVCross-validation
CCDCharge-coupled device
LDALinear discriminant analysis
LVLatent variables
NIRNear-infrared
NP/NNDNo pest/No nutritional deficiencies
PPrediction
P/NDPest/Nutritional deficiencies
PCPrincipal component
PCAPrincipal component analysis
P.citrellaPhyllocnistis citrella
PLSPartial least squares
PLS-DAPartial least squares discriminant analysis
R2Coefficient of determination
RGBRed–Green–Blue
RMSERoot mean square error
ROIRegion of interest
T.urticaeTetranychus urticae
VISVisible
VNIRVisible and near infrared

References

  1. FAOSTAT. Food and agriculture organisation of the United Nations 2021. Available online: http://faostat.fao.org (accessed on 2 May 2021).
  2. Hare, J.D. Sampling Arthropod Pests in Citrus. In Handbook of Sampling Methods for Arthropods in Agriculture; Pedigo, L.P., Buntin, G.D., Eds.; CRC Press: Boca Raton, FL, USA, 1994; pp. 417–431. [Google Scholar]
  3. Jacas, J.A.; Urbaneja, A. Biological Control in Citrus in Spain: From Classical to Conservation Biological Control. In Integrated Management of Arthropod Pests and Insect Borne Diseases; Springer Science and Business Media LLC: Berlin/Heisenberg, Germany, 2010; pp. 61–72. [Google Scholar]
  4. Van Leeuwen, T.; Vontas, J.; Tsagkarakou, A.; Dermauw, W.; Tirry, L. Acaricide resistance mechanisms in the two-spotted spider mite Tetranychus urticae and other important Acari: A review. Insect Biochem. Mol. Biol. 2010, 40, 563–572. [Google Scholar] [CrossRef] [Green Version]
  5. Martínez-Ferrer, M.T.; Jacas, J.A.; Ripollés-Moles, J.L.; Aucejo-Romero, S. Approaches for Sampling the Twospotted Spider Mite (Acari: Tetranychidae) on Clementines in Spain. J. Econ. Èntomol. 2006, 99, 1490–1499. [Google Scholar] [CrossRef] [PubMed]
  6. Aucejo, S.; Foó, M.; Ramis, M.; Troncho, P.; Gómez-Cadenas, A.; Jacas, J.A. Evaluación de la eficacia de algunos acaricidas contra la araña roja, Tetranychus urticae Koch (Acari: Tetranychidae), en clementino. Bol. San. Veg. Plagas. 2003, 29, 453–459. [Google Scholar]
  7. Ansaloni, T.; Pascual-Ruiz, S.; Hurtado, M.A.; Jacas, J.A.; Jaques, J.A. Can summer and fall vegetative growth regulate the incidence of Tetranychus urticae Koch on clementine fruit? Crop. Prot. 2008, 27, 459–464. [Google Scholar] [CrossRef]
  8. Fenollosa, E.A.; Gual, M.V.I.; Ruiz, M.H.; Hurtado, M.; Jacas, J. Effect of ground-cover management on spider mites and their phytoseiid natural enemies in clementine mandarin orchards (I): Bottom-up regulation mechanisms. Biol. Control. 2011, 59, 158–170. [Google Scholar] [CrossRef]
  9. Aucejo-Romero, S.; Gómez-Cadenas, A.; Jacas-Miret, J.-A. Effects of NaCl-stressed citrus plants on life-history parameters of Tetranychus urticae (Acari: Tetranychidae). Exp. Appl. Acarol. 2004, 33, 55–67. [Google Scholar] [CrossRef] [PubMed]
  10. Pascual-Ruiz, S.; Aguilar-Fenollosa, E.; Ibáñez-Gual, V.; Hurtado-Ruiz, M.A.; Martínez-Ferrer, M.T.; Jacas, J.A.; Jaques, J.A. Economic threshold for Tetranychus urticae (Acari: Tetranychidae) in clementine mandarins Citrus clementina. Exp. Appl. Acarol. 2013, 62, 337–362. [Google Scholar] [CrossRef] [PubMed]
  11. Urbaneja, A.; Pascual-Ruiz, S.; Pina, T.; Abad-Moyano, R.; Vanaclocha, P.; Montón, H.; Dembilio, Ó.; Castañera, P.; Jacas, J.A.; Jaques, J.A. Efficacy of five selected acaricides against Tetranychus urticae (Acari: Tetranychidae) and their side effects on relevant natural enemies occurring in citrus orchards. Pest Manag. Sci. 2008, 64, 834–842. [Google Scholar] [CrossRef] [PubMed]
  12. Fonte, A.; Garcerá, C.; Tena, A.; Chueca, P. CitrusVol Validation for the Adjustment of Spray Volume in Treatments against Tetranychus urticae in Clementines. Agronomy 2019, 10, 32. [Google Scholar] [CrossRef] [Green Version]
  13. Soler-Salcedo, E.; Rodrigo, E.; Ferragut, F. Colonización, comportamiento alimenticio y producción de daños en las arañas rojas Tetranychus urticae y T. turkestani (Acari: Tetranychidae). Boletín Sanid. Veg. Plagas 2006, 32, 523–534. [Google Scholar]
  14. Jeppson, L.R.; Keifer, H.H.; Baker, E.W. Mites Injurious to Economic Plants; University of California Press: Berkeley, CA, USA, 1975. [Google Scholar]
  15. Chueca, P.; Garcerá, C.; Moltó, E.; Jacas, J.A.; Urbaneja, A.; Pina, T. Spray Deposition and Efficacy of Four Petroleum-Derived Oils Used Against Tetranychus urticae (Acari: Tetranychidae). J. Econ. Èntomol. 2010, 103, 386–393. [Google Scholar] [CrossRef]
  16. Rey, B.; Aleixos, N.; Cubero, S.; Blasco, J. Xf-Rovim. A Field Robot to Detect Olive Trees Infected by Xylella Fastidiosa Using Proximal Sensing. Remote. Sens. 2019, 11, 221. [Google Scholar] [CrossRef] [Green Version]
  17. Cubero, S.; Marco-Noales, E.; Aleixos, N.; Barbé, S.; Blasco, J. RobHortic: A Field Robot to Detect Pests and Diseases in Horticultural Crops by Proximal Sensing. Agriculture 2020, 10, 276. [Google Scholar] [CrossRef]
  18. Martin, D.E.; Latheef, M.A. Remote Sensing Evaluation of Two-spotted Spider Mite Damage on Greenhouse Cotton. J. Vis. Exp. 2017, 122, e54314. [Google Scholar] [CrossRef] [PubMed] [Green Version]
  19. Herrmann, I.; Berenstein, M.; Sade, A.; Karnieli, A.; Bonfil, D.J.; Weintraub, P.G. Spectral monitoring of two-spotted spider mite damage to pepper leaves. Remote. Sens. Lett. 2012, 3, 277–283. [Google Scholar] [CrossRef]
  20. Fraulo, A.B.; Cohen, M.; Liburd, O.E. Visible/near infrared reflectance (VNIR) spectroscopy for detecting twospotted spider mite (Acari: Tetranychidae) damage in strawberries. Environ. Èntomol. 2009, 38, 137–142. [Google Scholar] [CrossRef] [PubMed] [Green Version]
  21. Crockett, C.; Liburd, O.; Abd-Elrahman, A. Development of image based detection methods for two-spotted spider mite, Tetranychus urticae Koch, on strawberries. In Proceedings of the Entomological Society of America Annual Meeting 2014, Portland, OR, USA, 16–19 November 2014. [Google Scholar]
  22. Nieuwenhuizen, A.; Kool, J.; Suh, H.; Hemming, J. Automated spider mite damage detection on tomato leaves in greenhouses. Acta Hortic. 2020, 1268, 165–172. [Google Scholar] [CrossRef]
  23. Uygun, T.; Ozguven, M.M.; Yanar, D. A new approach to monitor and assess the damage caused by two-spotted spider mite. Exp. Appl. Acarol. 2020, 82, 335–346. [Google Scholar] [CrossRef]
  24. Urbaneja, A.; Catalán, J.; Tena, A.; Jacas, J.A. Plagas y Enfermedades. Tetraníquidos. Araña Roja. In Gestión Integrada de Plagas de Cítricos; Urbaneja, A., Catalán, J., Tena, A., Jacas, J.A., Eds.; IVIA: Moncada, Spain, 2020; Available online: http://gipcitricos.ivia.es/area/plagas-principales/tetraniquidos/arana-roja (accessed on 2 May 2021).
  25. Quiñones, A.; Martínez-Alcántara, B.; Primo-Millo, E.; Legaz, F. Fertigation: Concept and Application in Citrus. In Advances in Citrus Nutrition; Springer Science and Business Media LLC: Berlin/Heisenberg, Germany, 2012; pp. 281–301. [Google Scholar]
  26. Futch, S.H.; Tucker, D.P.H. A Guide to Citrus Nutritional Deficiency and Toxicity Identification. University of Florida IFAS Extension Publication HS-797. 2000. Available online: https://edis.ifas.ufl.edu/pdffiles/CH/CH14200.pdf (accessed on 2 May 2021).
  27. Zekri, M.; Obreza, T. Manganese (Mn) and Zinc (Zn) for Citrus Trees. Publication #SL403 of the Department of Soil and Wa-ter Sciences, UF/IFAS Extension. 2019. Available online: https://edis.ifas.ufl.edu/pdffiles/SS/SS61600.pdf (accessed on 2 May 2021).
  28. Landgrebe, D. Hyperspectral image data analysis. IEEE Signal Process. Mag. 2002, 19, 17–28. [Google Scholar] [CrossRef]
  29. Rivera, N.V.; Gómez-Sanchis, J.; Chanona-Pérez, J.; Carrasco, J.J.; Millán-Giraldo, M.; Lorente, D.; Cubero, S.; Blasco, J. Early detection of mechanical damage in mango using NIR hyperspectral images and machine learning. Biosyst. Eng. 2014, 122, 91–98. [Google Scholar] [CrossRef]
  30. Kumar, T.K. Multicollinearity in Regression Analysis. Rev. Econ. Stat. 1975, 57, 365. [Google Scholar] [CrossRef]
  31. Hawkins, D.M. The Problem of Overfitting. J. Chem. Inf. Comput. Sci. 2004, 44, 1–12. [Google Scholar] [CrossRef] [PubMed]
  32. Amigo, J.M.; Martí, I.; Gowen, A. Hyperspectral Imaging and Chemometrics. In Multivariate Pattern Recognition in Chemometrics, Illustrated by Case Studies; Elsevier BV: Amsterdam, The Netherlands, 2013; Volume 28, pp. 343–370. [Google Scholar]
  33. Lorente, D.; Aleixos, N.; Gomezsanchis, J.; Cubero, S.; García-Navarrete, O.L.; Blasco, J. Recent Advances and Applications of Hyperspectral Imaging for Fruit and Vegetable Quality Assessment. Food Bioprocess Technol. 2012, 5, 1121–1142. [Google Scholar] [CrossRef]
  34. Vinzi, V.E.; Chin, W.W.; Henseler, J.; Wang, H. Handbook of Partial Least Squares; Springer: Berlin/Heisenberg, Germany, 2010. [Google Scholar]
  35. Tagliavini, M.; Quiñones, A. Nutrizione e Concimazione. In Glo Agrumi; Tribulato, E., Inglese, P., Eds.; Bayer CroipScience: Milano, Italy, 2012; pp. 183–193. [Google Scholar]
  36. Diago, M.P.; Tardáguila, J.; Aleixos, N.; Millán, B.; Prats-Montalban, J.M.; Cubero, S.; Blasco, J. Assessment of cluster yield components by image analysis. J. Sci. Food Agric. 2014, 95, 1274–1282. [Google Scholar] [CrossRef] [PubMed] [Green Version]
  37. Elmasry, G.; Cubero, S.; Moltó, E.; Blasco, J. In-line sorting of irregular potatoes by using automated computer-based machine vision system. J. Food Eng. 2012, 112, 60–68. [Google Scholar] [CrossRef]
  38. Blasco, J.; Cubero, S.; Gómez-Sanchis, J.; Mira, P.; Moltó, E. Development of a machine for the automatic sorting of pomegranate (Punica granatum) arils based on computer vision. J. Food Eng. 2009, 90, 27–34. [Google Scholar] [CrossRef]
  39. Blasco, J.; Aleixos, N.; Cubero, S.; Gómez-Sanchís, J.; Moltó, E. Automatic sorting of satsuma (Citrus unshiu) segments using computer vision and morphological features. Comput. Electron. Agric. 2009, 66, 1–8. [Google Scholar] [CrossRef]
  40. Gat, N. Imaging spectroscopy using tunable filters: A review. Wavelet Appl. VII 2000, 4056, 50–65. [Google Scholar] [CrossRef] [Green Version]
  41. Williams, P.J.; Kucheryavskiy, S. Classification of maize kernels using NIR hyperspectral imaging. Food Chem. 2016, 209, 131–138. [Google Scholar] [CrossRef]
  42. Brereton, R.G. Applied Chemometrics for Scientists; Wiley: Hoboken, NJ, USA, 2007. [Google Scholar]
  43. Mehmood, T.; Liland, K.H.; Snipen, L.; Sæbø, S. A review of variable selection methods in Partial Least Squares Regression. Chemom. Intell. Lab. Syst. 2012, 118, 62–69. [Google Scholar] [CrossRef]
  44. Munera, S.; Amigo, J.M.; Aleixos, N.; Talens, P.; Cubero, S.; Blasco, J. Potential of VIS-NIR hyperspectral imaging and chemometric methods to identify similar cultivars of nectarine. Food Control. 2018, 86, 1–10. [Google Scholar] [CrossRef]
  45. Rinnan, Å.; Berg, F.V.D.; Engelsen, S.B. Review of the most common pre-processing techniques for near-infrared spectra. TrAC Trends Anal. Chem. 2009, 28, 1201–1222. [Google Scholar] [CrossRef]
  46. Hastie, T.; Friedman, J.; Tibshirani, R. Model Assessment and Selection. In Linear and Generalized Linear Mixed Models and Their Applications; Springer Science and Business Media LLC: Berlin, Germany, 2001; pp. 193–224. [Google Scholar]
  47. Kuhn, M.; Johnson, K. Applied Predictive Modeling 26; Springer: New York, NY, USA, 2013. [Google Scholar]
  48. Cortés, V.; Rodríguez, A.; Blasco, J.; Rey, B.; Besada, C.; Cubero, S.; Salvador, A.; Talens, P.; Aleixos, N. Prediction of the level of astringency in persimmon using visible and near-infrared spectroscopy. J. Food Eng. 2017, 204, 27–37. [Google Scholar] [CrossRef] [Green Version]
  49. Chen, Y.; Xie, M.-Y.; Yan, Y.; Zhu, S.-B.; Nie, S.-P.; Li, C.; Wang, Y.-X.; Gong, X.-F. Discrimination of Ganoderma lucidum according to geographical origin with near infrared diffuse reflectance spectroscopy and pattern recognition techniques. Anal. Chim. Acta 2008, 618, 121–130. [Google Scholar] [CrossRef]
  50. Snedecor, G.W.; Cochran, W.G. Statistical Methods, 8th ed.; Iowa State University Press: Ames, IA, USA, 1989. [Google Scholar]
  51. Reid, N.J. ES&T Views: Remote Sensing and Forest Damage. Environ. Sci. Technol. 1987, 21, 428–429. [Google Scholar] [CrossRef] [PubMed]
  52. Alonso, C.; Moreno, V.; Rodríguez, E. Determinación Experimental de la Firma Espectral de la Vegetación. Una Sencilla Práctica de itroducción a la teleetección. In TELEDETECCIÓN. Avances y Aplicaciones, Proceedings VIII Congreso Nacional de Teledetección, Albacete, Spain, 22–24 September 1999; Diputación de Albacete: Albacete, Spain, 1999; pp. 429–443. [Google Scholar]
  53. Arnon, D.I. The Light Reactions of Photosynthesis. Proc. Natl. Acad. Sci. USA 1971, 68, 2883–2892. [Google Scholar] [CrossRef] [PubMed] [Green Version]
  54. Rock, B.N.; Vogelmann, J.E.; Williams, D.L.; Hoshizaki, T. Remote Detection of Forest Damage. Bioscience 1986, 36, 439–445. [Google Scholar] [CrossRef]
  55. Roy, P.S. Spectral reflectance characteristics of vegetation and their use in estimating productive potential. Plant Sci. 1989, 99, 59–81. [Google Scholar] [CrossRef]
Figure 1. Images of the leaves (upper and underside of the leaf) for each subset.
Agronomy 11 01002 g001
Figure 2. Images captured at 650 nm and colour of the two sides of a leaf affected by T. urticae.
Agronomy 11 01002 g002
Figure 3. Examples of image segmentation of leaves. (a) Leaf with symptoms compatible with N deficiencies. (b) Leaf affected by T. urticae.
Agronomy 11 01002 g003
Figure 4. Mean spectra of healthy and damaged regions extracted from sets G1 (undamaged) and G2 (damaged) at each age and on (a) under side, recent leaves; (b) upper side recent leaves; (c) under side mature leaves, and (d) upper side mature leaves.
Agronomy 11 01002 g004
Figure 5. Vector of regression coefficients of the PLS model using mean spectra and with the optimal wavelengths selected at each age and on (a) under side, recent leaves; (b) upper side recent leaves; (c) under side, mature leaves; and (d) upper side mature leaves.
Agronomy 11 01002 g005
Figure 6. Mean spectra of damaged regions caused by T. urticae on (a) under side and (b) upper side of recent and mature leaves.
Agronomy 11 01002 g006
Figure 7. Vector of regression coefficients of the PLS model using mean spectra and with the optimal wavelengths selected on (a) under side and (b) upper side of the leaf.
Agronomy 11 01002 g007
Figure 8. Mean spectra of healthy leaves (G1), damage by T. urticae (G2) and P. citrella (G3), and leaves with N deficiency (G4.1) and with other deficiencies (G4.2) on (a) under and (b) upper side.
Agronomy 11 01002 g008
Figure 9. Vector of regression coefficients of the PLS model using mean spectra and with the optimal wavelengths selected on (a) under side and (b) upper side of the leaf.
Agronomy 11 01002 g009
Figure 10. (a) Comparison of the image of the upper side of a leaf captured at 700 nm with the hyperspectral camera and the image of the same leaf captured with the colour camera. (b) Spectra of the healthy and damaged regions of this leaf.
Agronomy 11 01002 g010
Table 1. Classification of the sets and subsets of the leaves for analysis.
Name of the SetName of the SubsetLeavesSymptomAge
G1G1.130HealthyRecent
G1.230HealthyMature
G2G2.130Tetranychus urticaeRecent
G2.230Tetranychus urticaeMature
G3G3.110Phyllocnistis citrellaRecent and mature
G4G4.16N deficiencyRecent and mature
G4.26Fe, Mn, or Zn deficiencyRecent and mature
Table 2. Classification of the tagged database for analysis.
SubsetLeavesNumber of Hyperspectral Images
(Both Sides of the Leaf)
Total Number of ROI
G1.1102060
G1.2102060
G2.13060360
G2.23060360
G3.1102060
G4.161236
G4.261236
TOTAL102204972
Table 3. Analysis of variance (ANOVA) of the geometrical properties of the objects found in the test images. The objects correspond to actual damages caused by T. urticae and nutritional deficiencies (not T. urticae).
True T. urticaeNot T. urticaeStatistical Parameters of ANOVA *
MeanTypical DeviationMeanTypical DeviationFp-Value
Elongation1.5390.2724.2304.5968.1610.0053
Roundness0.5060.1630.2520.15544.3620.0000
Individual area67,293.9439,350.89224,056.90233,071.559.4760.0036
Compactness34.9817.4183.8275.2915.0920.0002
Perimeter3260.062932.771848.612928.425.6990.0187
Damages per leaf1.690.8559.0006.89011.2080.0032
Total damaged area82,321.7535,703.981,176,298.75517,992.9183.6520.0000
* Degrees of freedom: 1, 95.
Table 4. Results of the detection of T. urticae damage on each side of the leaf using colour information.
Sets and SubsetsUnderside (%)Upperside (%)
G1G2G3G4.1G4.2G1G2G3G4.1G4.2
G110000001000000
G25.0091.673.33006.6793.33000
G3001000090.010.00000
G4.1100000083.330016.670
G4.241.6708.33050.050.000050.0
Table 5. Classification of age of T. urticae damage (%) for the validation set by PLS-DA using all and selected wavelengths on each side of the leaf.
Latent
Variables
Class
RecentMature
UndersideAll wavelengths7Recent1000
mature0100
Selected wavelengths5Recent1000
mature0100
Upper sideAll wavelengths7Recent88.8911.11
mature3.7096.30
Selected wavelengths5Recent86.7313.27
mature1.0298.98
Table 6. Damage classification according to the presence of different types of damage of the validation set by PLS-DA using all and selected wavelengths on each side of the leaf.
Latent
Variables
Class (%)
SetG1G2G3G4.1G4.2
UndersideAll wavelengths7G11000000
G2075.931.8516.675.56
G30010000
G4.1033.33066.670
G4.22080000
Selected wavelengths5G11000000
G2069.671.8522.925.56
G30010000
G4.1033.33066.670
G4.20100000
Upper sideAll wavelengths7G195.834.17000
G2081.481.8512.963.70
G30010000
G4.1016.6716.6766.670
G4.22080000
Selected wavelengths4G195.834.17000
G2094.201.853.950
G30010000
G4.1033.33066.670
G4.20100000
Publisher’s Note: MDPI stays neutral with regard to jurisdictional claims in published maps and institutional affiliations.

