Article

Impact of Leaf Occlusions on Yield Assessment by Computer Vision in Commercial Vineyards

1
Televitis Research Group, University of La Rioja, 26006 Logroño, Spain
2
Department of Computer Science and Artificial Intelligence, University of Granada, 18071 Granada, Spain
*
Author to whom correspondence should be addressed.
Agronomy 2021, 11(5), 1003; https://doi.org/10.3390/agronomy11051003
Submission received: 19 April 2021 / Revised: 11 May 2021 / Accepted: 12 May 2021 / Published: 18 May 2021
(This article belongs to the Special Issue Sustainable Viticulture Production and Vineyard Management Practices)

Abstract

:
Yield assessment has been identified as critical topic for grape and wine industry. Computer vision has been applied for assessing yield, but the accuracy was greatly affected by fruit occlusion affected by leaves and other plant organs. The objective of this work was the consistent, continuous evaluation of the impact of leaf occlusions in different commercial vineyard plots at different defoliation stages. RGB (red, green and blue) images from five Tempranillo (Vitis vinifera L.) vineyards were manually acquired using a digital camera under field conditions at three different levels of defoliation: no defoliation, partial defoliation and full defoliation. Computer vision was used for the automatic detection of different canopy features, and for the calibration of regression equations for the prediction of yield computed per vine segment. Leaf occlusion rate (berry occlusion affected by leaves) was computed by machine vision in no defoliated vineyards. As occlusion rate increased, R2 between bunch pixels and yield was gradually reduced, ranging from 0.77 in low occlusion, to 0.63.

1. Introduction

Grapevines are considered as important crops for economic relevance. The precise assessment of different relevant grapevine features would lead to better management and more sustainable practices. Considering this, the objective estimation of vine yield would be very valuable for growers and other actors in the industry [1]. While an accurate, objective and rapid estimation of the yield components is needed [2,3], conventional methods are destructive, labor-demanding, time-consuming and of low accuracy [2]. Accordingly, new methods for the yield assessment of grapevines are required to replace time-consuming and traditional procedures.
Computer vision systems are powerful tools to automate inspection tasks in agriculture [4,5,6,7,8,9,10,11]. Typical target applications of such systems include grading, quality estimation, yield prediction and monitoring, among others [6,7,8]. With computer vision techniques, a large set of samples can be automatically measured, saving time and providing more objective information [4,5,6,7]. The capabilities of an artificial vision system go beyond the limited human capacity to evaluate long-term processes objectively and provide valuable data to take decisions. Machine vision systems are being used to automate inspection tasks in agriculture and food processing [4,5,6,7,8,9].
Machine vision technology has allowed the automation of tasks in viticulture for different purposes, such as cluster compactness [6], pruning weight [7] or canopy features [8] assessments. Image analysis has been widely applied in viticulture for assessing crop yield [9,10,11,12,13,14,15]. Yield forecasting has been carried out at different phenological stages: Budburst [16], flowering [17], pea-size [10,13] and harvest [10,12]. Most of the previous works have focused on visible fruits. These works have suggested a procedure on yield forecasting for total or partial defoliated vineyards where the number of berries visible in the images was proportional to the total number of berries. However, the number of visible berries was only a part of the actual number of berries on the vine, and the percentage of exposed berries may vary beyond lineal relationships according to canopy conditions in the fruiting zone. Leaf and berry occlusions are the main challenges for yield forecasting in commercial vineyards [18].
Canopy features of the fruiting zone are related to fruit microclimate, fruit health status and grape composition [19,20]. Leaf removal is a common vineyard management practice to improve clusters’ light exposure and air circulation and to reduce the probability of disease incidence [20,21]. However, the elimination of a certain number of leaves around bunches increase fruit exposure, which may affect grape composition [20] but also fruit exposure [22,23]. Machine vision can be applied in viticulture as a rapid and practical method to estimate both for assessing yield [9] and for canopy features [8,24]. So, leaf and berry occlusions in commercial vineyards can be evaluated by image analysis and the effect on yield forecasting in commercial could be examined. Therefore, the aim of this work was to analyze the impact of leaf occlusion on yield components assessment using machine vision in commercial vineyards.

2. Materials and Methods

2.1. Experimental Layout

The experiments were conducted in 2020 in five commercial dry-farmed cv. Tempranillo (Vitis vinifera L.) vineyards located in Rioja wine appellation, Spain (Table 1). All vineyards were spur pruned and trained on a vertical shoot positioning trellis system with two pairs of movable wires. All vineyard plots were subject to similar standard cultural practices during the growing season: de-suckering, shoot positioning and shoot trimming. No defoliation was performed before image acquisition at harvest.
To study the impact of leaf and fruit occlusions on yield components assessment using machine vision, a detailed experimental setup for the acquisition of images was developed, based on successive defoliations steps of individual vines.

2.2. Assessment of Yield Components and Occlusion Rate

In each vineyard 25 vines were randomly chosen before harvest. All vines were divided into two segments and labelled accordingly. Two 0.5 m pieces of plastic labelling tape were positioned on both sides of each vine to delimitate the width of the region of interest (ROI) (Figure 1). The vine canopy was successively defoliated: first by removing the first four main basal leaves (partial defoliation), and then the remaining main leaves and laterals (full defoliation). Images were taken in the vineyard for each individual segment before each defoliation step.
Yield components were directly assessed in the vineyards. Bunches were harvested and counted, and then their total weight was recorded per each vine segment after image acquisition.

2.3. Image Acquisition and Processing

The images were taken manually, directly in the vineyard during a single session in September 2020 before harvest. For each individual segment vine, a total number of three images were taken: no defoliation, partial defoliation and full defoliation. Before any defoliation step, each vine (50 vines per vineyard) was photographed with a conventional RGB camera mounted on a tripod set normal to the canopy, at 1.0 m from row axis and 1.20 m aboveground, with no artificial illumination. A white screen was placed behind the canopy to remove the influence of background vegetation. Canopy images were acquired from the lateral canopy side using a Canon EOS 5D Mark IV RGB camera (Canon Inc. Tokyo, Japan) equipping a full-frame CMOS sensor (30.4 MP) equipped with a Canon EF 20 mm F/2.8 USM lens, using Aperture-priority AE (Av) mode fixing the aperture on F/5.6, enabling an adequate focus over the whole canopy and low noise due to the good lightning conditions. Images were saved in JPG format with the highest quality setting available in the camera. The full image size was 6720 × 4480 pixels for all the images.
Prior to image analysis, ROI delineation was required to analyze the canopy status parameters for every plant and defoliation level. The ROI selection was performed manually, selecting a rectangle fulfilling the conditions stated in the manuscript (0.5 m over basal wire vertically, and from one marker to the next horizontally). [24]. The image analysis algorithm was developed using C++ programming language and OpenCV (Open Source Computer Vision Library, Version 4.1) for image reading and manipulation. The aforementioned algorithm is based previous works [8,24], and utilizes Mahalanobis distance to classify every pixel of an image based on its color. The Mahalanobis distance is a multi-dimensional scale invariant measure, whose main advantage over Euclidean distance is that it accounts for correlations inside the training dataset, enabling a more precise classification. These properties make this clustering algorithm ideal for image segmentation under uncontrolled conditions, especially when illumination varies among images, because this distance can compensate that lightning variations in a transparent manner. The algorithm uses a known sample of color values to classify an unknown batch of pixels into groups or classes based on a characteristic vector (the color values of each pixel).
The image segmentation algorithm was trained using supervised learning. For that, the following five classes covering the expected objects in the images were defined: ‘bunch’, ‘trunk’, ‘shoot’, ‘leaf’, ‘gap’ and ‘trellis’. Then, the classifier was trained by manually selecting 500 pixel samples per class (3000 training instances in total), carefully covering as much variability as possible for every set. Mathematically, a pixel pi was defined by the following five-dimensional vector:
p i = R i , G i , B i , H i , S i
Ri, Gi and Bi correspond to the pixel’s red, green and blue values according to the RGB color space, respectively. Furthermore, Hi, and Si stand for the pixel’s hue and saturation in the hue saturation value (HSV) color space, obtained by means of space conversion [25]. Note that the value component of the HSV color space was deliberately left out, in order to favor similar tones in the comparison, as opposed to brightness changes that can be caused by the natural lightning variation in the image. The transformation between these two color spaces is nonlinear, and results were more consistent during the experiment using the same color seeds as opposed to using only the RGB color space or the 6 components of RGB + HSV color spaces combined.
To further improve the quality of the segmentation, mathematical morphology techniques were applied to the binary mask corresponding to the resulting classes that exhibited more classification errors. The isolated pixels of some of the defined classes (like shadowed pixels on the background that have a color which closely resembles epicuticular wax on some of the berries) were filtered by applying a morphological erosion operation [26] on the classified image, in order to remove isolated points and small connected components. In order to restore all the information of the group that is lost with this operation, morphological reconstruction was applied by using dilation on the same group.
With this approach, a single training set was used to evaluate three plots. Since images on the other two plots exhibited severe changes in the lightning conditions when compared to the correctly segmented images, the training set of the algorithm was enriched introducing more pixel values from images showing the most differences in light and color to have a proper segmentation for all the plots.

2.4. Leaf Occlusion Rate and Canopy Features by Image Analysis

The leaf occlusion rate (bunch occlusion by leaves) was calculated for each no defoliation and partial defoliation images using the following equation:
O R i % = B p i F D B p i B p i F D × 100
where:
  • O R i ( % ) = Leaf   occlusion   rate   percentage   for   image   i   at   respectively   partial / no   defoliation
  • B p i F D = Number   of   bunch   pixels   for   image   i   at   full   defoliation
  • B p i = Number   of   bunch   pixels   for   image   i   at   respectively   partial / no   defoliation
Additionally, levels of porosity, leaf exposure and bunch exposure were computed by a previously tested methodology described by [8,24].

2.5. Statistical Analysis

Descriptive statistical analysis was performed using Infostat (InfoStat version 2020. Universidad Nacional de Córdoba, Argentina). Mean, minimum, maximum, standard deviation, variation coefficient, skewness, kurtosis and histograms were computed for yield components and canopy status parameters.
Linear regression analysis was performed between fruit pixel count obtained from image analysis and yield for each defoliation step, and the determination coefficients (R2) were computed.

3. Results and Discussion

3.1. Yield Components

Table 2 shows different statistical values for yield components in five Tempranillo commercial vineyards plots. The coefficient of variation of yield exhibited considerable differences between different segments in the same plot, and this behavior was also represented in the minimum and maximum yield values, oscillating between 0 to 6.63 kg·m−1. Furthermore, high yield variability among plots was also observed, with mean yield values between 1.96 and 2.82 kg·m−1. Variation coefficients in excess of 40% in every plot and reaching 53.26% globally show high intra plot and inter plot variability, also reflected in the minimum and maximum values which oscillate from near 0 to 5.3 kg·m−1. These results indicate that a high number of samples per plot are needed for accurate yield assessment according to high variability observed within vineyard plots.
Other yield components such as bunch number per meter were more homogeneous between the plots, with approximately 9 bunches per meter in all the cases and a mean coefficient of variation of 42.41%, This coefficient represents the high variability of number of bunches in each segment, which ranges from 0 to 20. In relation to bunch weight, 0.28 kg was the global average when taking into account the measurements for all the considered plots. Major differences were observed on this as well, with plots A and B exhibiting the lowest mean bunch weight of the study group, with 0.23 kg per bunch, due to the small size of their bunches, as opposed to the remaining plots which showed higher weights on average. This feature is linked to yield, where it was also observed that the plots with smaller bunches had less yield as expected. Furthermore, a considerable variability in the bunch weight was also observed, with a mean coefficient of variation of 38.87%.

3.2. Canopy Status

The canopy images obtained were processed with computer vision using the same ROI for all subsequent defoliation steps to obtain values of porosity, leaf exposure and bunch exposure. Descriptive statistics of these canopy features are displayed in Table 3, Table 4 and Table 5.
In the no defoliated vineyards, canopy porosity, leaf exposure and bunch exposure exhibited high variability. All these parameters showed high variation coefficients. Regarding bunch exposure, high variability within plots was also observed. On the other hand, leaf exposure was the most stable parameter between plots in the no defoliated vineyards. In a recent work on fruit occlusions, [27] observed that the canopy features in no defoliated vineyards was affected by the grapevine cultivar. Those conclusions added to our results suggesting that, in commercial vineyards, the level of variability is increased due to the influence of the variety and also by the location of vineyards of the same grapevine variety and grown under the same conditions (as described in Section 2.1). Canopy porosity has been previously studied by [24] too, and their measurements also exhibited large variation of canopy features in commercial vineyards planted with different varieties in several countries.
After leaf removal, canopy porosity (number of gap pixels) improved strongly from an average of 20% in no defoliated vineyards, to 35% in partial defoliation and 54% in full defoliated plots (Table 3). With partial and full defoliation, leaf exposure decreased sharply in contrast with no defoliated vines (Table 4). Leaf removal provoked a notable increase in bunch exposure, from 11% in no defoliated to 18% in full defoliated vine (Table 5). Huge variation of canopy features was induced by leaf removal in a commercial Tempranillo vineyard [8,22].

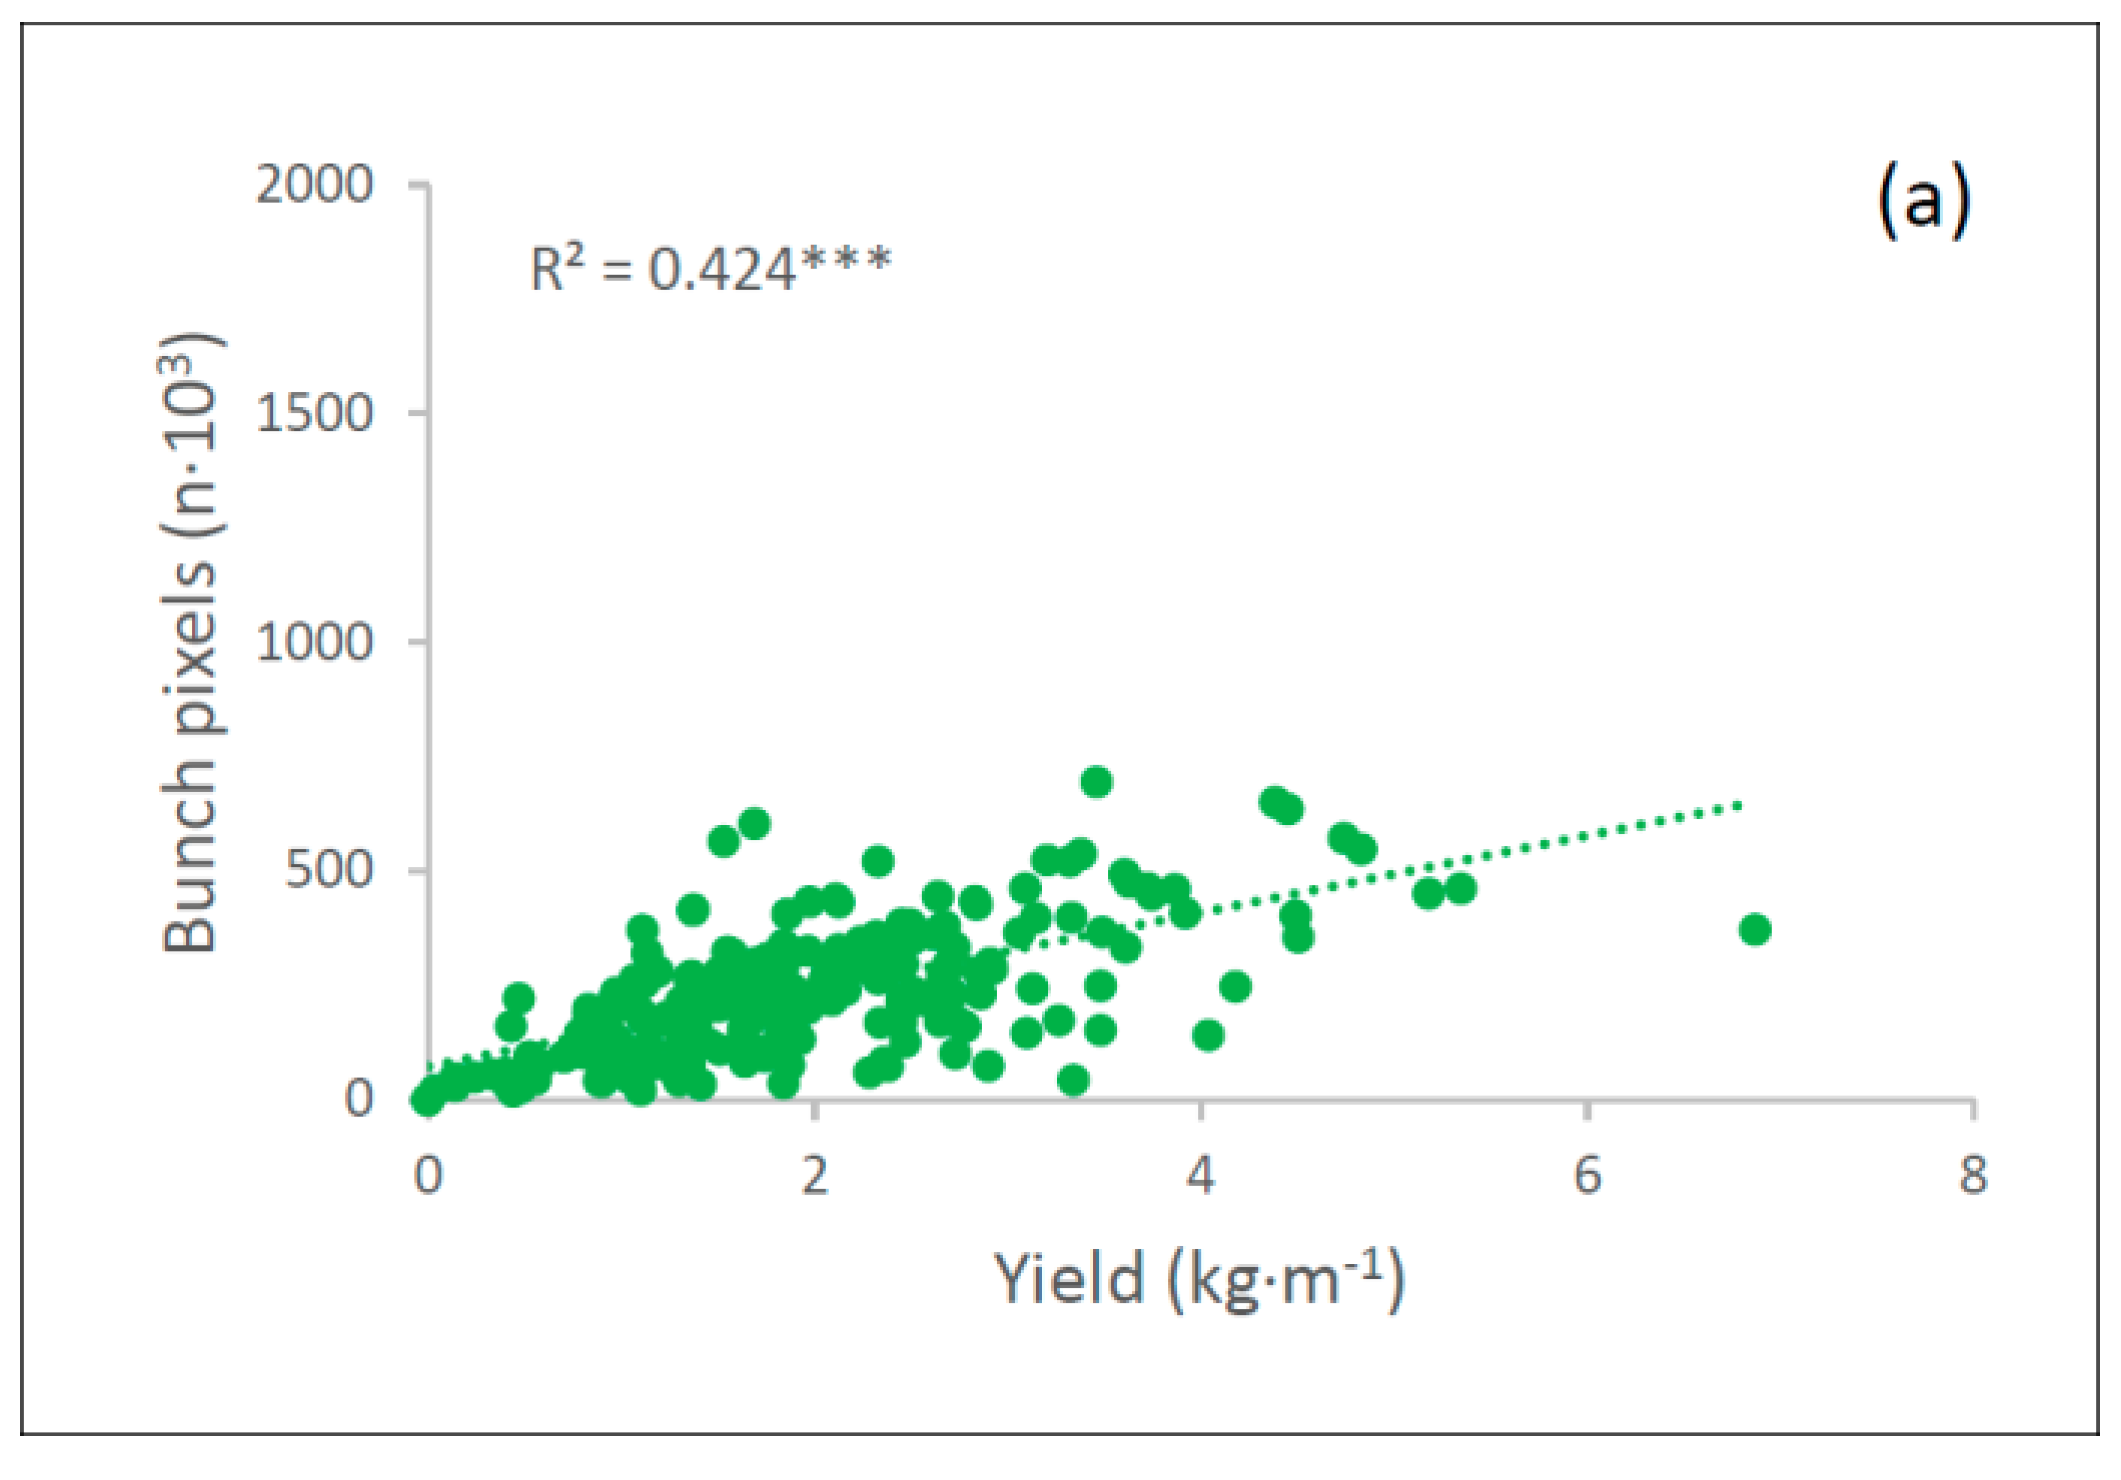
3.3. Yield Estimation

The in-field yield assessment using computer vision was unsuccessful or challenging in several no defoliated plots (first column in Figure 2), confirming that, as it would have occurred with a human visual inspection, the predominant presence of leaves prevents bunch exposure to correlate with the actual plant yield. Leaf removal improved the correlation between the number of bunch pixels and the yield. This improvement was remarkable for vineyards A and B, where determination coefficient (R2) values of 0.10* and 0.22* were obtained at no defoliation, and R2 of 0.69*** and 0.70*** were achieved after full defoliation. Vineyards C, D and E showed little improvement of R2 in yield assessment, that suggests that the amount of leaves was considerably lower in C, D and E and therefore there was little difference between the partial and the full defoliation. This was confirmed in the visual inspection of all vineyard plots. This can even be more clearly observed in vineyard D, where very similar R2 values were found among the three stages. Full leaf removal resulted in higher correlations in regressions from vineyards A and B (last column in Figure 2), while the rest showed lower improvements. This, nevertheless, is in agreement with the fact that the correlation from vineyard plots C, D and E were already higher that other plots after partial defoliation.
The results for the combination of all vineyards into one dataset are presented in Figure 3. The R2 from the regression between bunch pixels and yield increased consistently as leaf removal advanced. In general, defoliation enhanced fruit exposure and improved the vineyard canopy conditions for an accurate yield estimation using machine vision.
Leaf occlusion rate (fruit occlusion affected by leaves) was determined by machine vision in vineyards with no canopy defoliation, defining three levels of leaf occlusion rate: Low (<30%), intermediate (31–60%) and high leaf occlusion (>61%). The impact of leaf occlusion on yield assessment is showed in Figure 4. As occlusion rate increased, R2 between bunch pixels and yield was gradually reduced, ranging from 0.77 in low occlusion, to 0.63 in medium occlusion, and finally to 0.33 in high occlusion level. These results indicate that leaf occlusion rate had a very notable impact in the yield assessment by image analysis in commercial vineyards. Yield assessment was accurate in vines showing low leaf occlusion rate, as would be expected, but the assessment results from vines showing medium occlusion levels could be also considered as satisfactory (Figure 4b). Only with high occlusion was harder to effectively estimate yield, since too many leaves were hiding a big part of the bunches. In fact, in high leaf occlusion vineyards, high vigorous and high yield vines can exhibit a similar amount of visible bunch pixels than low yield defoliated vines, making the linear correlations between the number of fruit pixels and the total yield to fail. These results seem to be in concordance with works from other authors, in which the bunch exposure area was significant correlated with yield in no defoliated vines [9,12,23]. Additionally, the lack of correlation between exposed fruit and actual yield in non-defoliated vines was confirmed by [27] too. These authors also observed that the linear regression between yield and visible bunch area was affected by the grapevine variety and phenological stage.
Our results can also be compared with several works from other authors. [10] reported R2 values between 0.60 and 0.73, with models individually calibrated per grapevine variety and phenological stage. In all cases, the correlation between the number of detected berries and the yield on vines were obtained after severe leaf removal. [23] applied an approach similar to the one presented in this work for predicting yield: a Mahalanobis color segmentation for the extraction of bunch pixels. Linear regressions were also employed to estimate the yield from the fruit pixels, achieving R2 values up to 0.73, higher than the R2 obtained for the no defoliation and partial defoliation steps, and lower than the results obtained after full defoliation in Figure 3. Reference [13] reported R2 values from the correlation of the number of detected berries and the actual yield of 0.74 on fully defoliated vines. These results were also lower than our work in full defoliated vines (R2 of 0.86, Figure 3), but may be explained as, in that work, image acquisition was performed at pea-size stage, in contrast to the images used in this work, acquired close to harvest.
Our results, aligned with previous, similar works [27], indicate that leaf occlusion in vineyards is a challenge to overcome for yield assessment methods-based on computer vision and linear relationships, and that depending on the vigor of the vineyard, a greater or lesser number of leaves will occlude the clusters and prevent visual exposure to correlate with actual yield. In this work we tried to consistently confirm this with a continuous vineyard monitoring at several levels of occlusion. For accurate yield estimation using machine vision procedures a low leaf occlusion is needed if only linear relationships are considered, that have the advantage do not need for heavy computational modelling. Furthermore, leaf removal is a common practice in viticulture, it improves fruit health and fruit composition [20,21]. Yield assessment can also be beneficed by this practice to reduce the fruit occlusion affected by leaves. The image acquisition could be carried out on-the-go by mobile sensing platforms moving at conventional tractor speed in in vineyards trained to a vertical shoot position (VSP) system [8,17], allowing for a rapid image processing for determining leaf occlusion rate and/or yield. The next steps towards the automation of vineyard canopy assessment using new proximal sensors were recently shown; a new system equipped with matrix-based optical RGB sensors was mounted in a tractor to assess the leaf layer number and vineyard canopy gaps [28].
Future work would involve analyzing the impact of other canopy vineyard elements that affect bunch occlusion (berries, shoots, cordon and trellis elements), and discovering non-linear latent features between those canopy features and yield. Machine and deep learning techniques could be very beneficial for this modelling, to quantify the number of actual berries (visible and not visible) as an early yield indicator and, potentially, at later stages if non-linear relationships can be modelled.

4. Conclusions

In this work, a consistent, continuous evaluation of the impact of leaf occlusions on yield assessment from computer vision was presented, considering three different levels of defoliation over five different commercial vineyard plots. Our results, aligned with other previous works, strongly suggest that occlusions over the fruit present in the vines do affect the capability of machine vision of automatically assess the total yield of grapevine plants. Although this assessment was unsuccessful in non-defoliated vineyards, it showed promising in partially defoliated stages, and strongly feasible in defoliated vineyards, that are not rare in the current practice. The outcomes presented in this paper also point out that high differences in canopy conditions and features can be found for vineyards that are from even the same variety and wine region, but, if this variability is considered during the development of the regression equations, an automated system based on computer vision can perform successfully in the task of yield assessment after an usual stage of defoliation.

Author Contributions

Conceptualization, J.T.; methodology, J.T., R.Í., F.P., I.H., I.B. and S.G; formal analysis, R.Í.; investigation, J.T., R.Í., F.P., I.H, I.B. and S.G; data curation, R.Í., F.P. and S.G.; writing—original draft preparation, J.T., R.Í., F.P., I.H, I.B. and S.G; writing—review and editing, J.T., R.Í., F.P., I.H, I.B. and S.G; visualization, R.Í., F.P., I.H., I.B. and S.G; supervision, J.T.; funding acquisition, J.T. All authors have read and agreed to the published version of the manuscript.

Funding

This research was funded by University of La Rioja.

Institutional Review Board Statement

Not applicable.

Informed Consent Statement

Not applicable.

Conflicts of Interest

The authors declare no conflict of interest.

References

  1. Dunn, G.; Martin, S. The Current Status of Crop Forecasting in the Australian Wine Industry. In Proceedings of the ASVO Seminar Series: Grapegrowing at the Edge, Tanunda, Australia, 10–11 July 2003; Australian Society of Viticulture and Oenology: Tanunda, Australia, 2003; pp. 4–8. [Google Scholar]
  2. Martin, S.; Dunstone, R.; Dunn, G. How to Forecast Wine Grape Deliveries Using Grape Forecaster Excel Workbook Version 7; Department of Primary Industries: Adelaide, Australia, 2003. [Google Scholar]
  3. Taylor, J.A.; Tisseyre, B.; Leroux, C. A simple index to determine if within-field spatial production variation exhibits potential management effects: Application in vineyards using yield monitor data. Precis. Agric. 2018, 20, 880–895. [Google Scholar] [CrossRef]
  4. Cubero, S.; Aleixos, N.; Moltó, E.; Gómez-Sanchis, J.; Blasco, J. Advances in Machine Vision Applications for Automatic Inspection and Quality Evaluation of Fruits and Vegetables. Food Bioprocess Technol. 2011, 4, 487–504. [Google Scholar] [CrossRef]
  5. Lorente, D.; Aleixos, N.; Gomezsanchis, J.; Cubero, S.; García-Navarrete, O.L.; Blasco, J. Recent Advances and Applications of Hyperspectral Imaging for Fruit and Vegetable Quality Assessment. Food Bioprocess Technol. 2012, 5, 1121–1142. [Google Scholar] [CrossRef]
  6. Palacios, F.; Diago, M.P.; Tardaguila, J. A Non-Invasive Method Based on Computer Vision for Grapevine Cluster Compactness Assessment Using a Mobile Sensing Platform under Field Conditions. Sensors 2019, 19, 3799. [Google Scholar] [CrossRef] [PubMed] [Green Version]
  7. Millan, B.; Diago, M.P.; Aquino, A.; Palacios, F.; Tardaguila, J. Vineyard pruning weight assessment by machine vision: Towards an on-the-go measurement system. OENO One 2019, 53, 307–319. [Google Scholar] [CrossRef]
  8. Diago, M.; Aquino, A.; Millan, B.; Palacios, F.; Tardaguila, J. On-the-go assessment of vineyard canopy porosity, bunch and leaf exposure by image analysis. Aust. J. Grape Wine Res. 2019, 25, 363–374. [Google Scholar] [CrossRef]
  9. Dunn, G.M.; Martin, S.R. Yield prediction from digital image analysis: A technique with potential for vineyard assessments prior to harvest. Aust. J. Grape Wine Res. 2008, 10, 196–198. [Google Scholar] [CrossRef]
  10. Nuske, S.; Wilshusen, K.; Achar, S.; Yoder, L.; Narasimhan, S.; Singh, S. Automated Visual Yield Estimation in Vineyards. J. Field Robot. 2014, 31, 837–860. [Google Scholar] [CrossRef]
  11. Kicherer, A.; Klodt, M.; Sharifzadeh, S.; Cremers, D.; Töpfer, R.; Herzog, K. Automatic image-based determination of pruning mass as a determinant for yield potential in grapevine management and breeding. Aust. J. Grape Wine Res. 2017, 23, 120–124. [Google Scholar] [CrossRef]
  12. Millan, B.; Velasco-Forero, S.; Aquino, A.; Tardaguila, J. On-the-Go Grapevine Yield Estimation Using Image Analysis and Boolean Model. J. Sensors 2018, 2018, 1–14. [Google Scholar] [CrossRef]
  13. Aquino, A.; Millan, B.; Diago, M.-P.; Tardaguila, J. Automated early yield prediction in vineyards from on-the-go image acquisition. Comput. Electron. Agric. 2018, 144, 26–36. [Google Scholar] [CrossRef]
  14. Grimm, J.; Herzog, K.; Rist, F.; Kicherer, A.; Töpfer, R.; Steinhage, V. An adaptable approach to automated visual detection of plant organs with applications in grapevine breeding. Biosyst. Eng. 2019, 183, 170–183. [Google Scholar] [CrossRef]
  15. Zabawa, L.; Kicherer, A.; Klingbeil, L.; Töpfer, R.; Kuhlmann, H.; Roscher, R. Counting of grapevine berries in images via semantic segmentation using convolutional neural networks. ISPRS J. Photogramm. Remote Sens. 2020, 164, 73–83. [Google Scholar] [CrossRef]
  16. Liu, S.; Li, X.; Wu, H.; Xin, B.; Tang, J.; Petrie, P.R.; Whitty, M. A robust automated flower estimation system for grape vines. Biosyst. Eng. 2018, 172, 110–123. [Google Scholar] [CrossRef]
  17. Palacios, F.; Bueno, G.; Salido, J.; Diago, M.P.; Hernández, I.; Tardaguila, J. Automated grapevine flower detection and quantification method based on computer vision and deep learning from on-the-go imaging using a mobile sensing platform under field conditions. Comput. Electron. Agric. 2020, 178, 105796. [Google Scholar] [CrossRef]
  18. Palacios, F.; Melo-Pinto, P.; Diago, M.P.; Tardaguila, J. Deep Learning and Computer Vision for Assessing the Number of Total Berries and Yield in Commercial Vineyards. Comput. Electron. Agric. under review.
  19. Smart, R.; Robinson, M. Sunlight into Wine: A Handbook for Winegrape Canopy Management; Winetitles: Adelaide, Australia, 1991; 88p. [Google Scholar]
  20. Pastore, C.; Allegro, G.; Valentini, G.; Muzzi, E.; Filippetti, I. Anthocyanin and flavonol composition response to veraison leaf removal on Cabernet Sauvignon, Nero d’Avola, Raboso Piave and Sangiovese Vitis vinifera L. cultivars. Sci. Hortic. 2017, 218, 147–155. [Google Scholar] [CrossRef]
  21. Austin, C.N.; Wilcox, W.F. Effects of Sunlight Exposure on Grapevine Powdery Mildew Development. Phytopathology. 2012, 102, 857–866. [Google Scholar] [CrossRef] [Green Version]
  22. Tardaguila, J.; De Toda, F.M.; Poni, S.; Diago, M.P. Impact of Early Leaf Removal on Yield and Fruit and Wine Composition of Vitis Vinifera L. Graciano and Carignan. Am. J. Enol. Vitic. 2010, 61, 372–381. [Google Scholar]
  23. Diago, M.-P.; Correa, C.; Millán, B.; Barreiro, P.; Valero, C.; Tardaguila, J. Grapevine Yield and Leaf Area Estimation Using Supervised Classification Methodology on RGB Images Taken under Field Conditions. Sensors 2012, 12, 16988–17006. [Google Scholar] [CrossRef] [Green Version]
  24. Diago, M.P.; Krasnow, M.; Bubola, M.; Millán, B.; Tardaguila, J. Assessment of Vineyard Canopy Porosity Using Machine Vision. Am. J. Enol. Vitic. 2016, 67, 229–238. [Google Scholar] [CrossRef] [Green Version]
  25. Agoston, M.K. Computer Graphics and Geometric Modeling: Implementation and Algo-rithms; Springer: London, UK, 2005. [Google Scholar]
  26. Soille, P. Erosion and Dilation. In Morphological Image Analysis; Springer Science and Business Media LLC: London, UK, 2004; pp. 63–103. [Google Scholar]
  27. Victorino, G.F.; Braga, R.; Santos-Victor, J.; Lopes, C.M. Yield components detection and image-based indicators for non-invasive grapevine yield prediction at different phenological phases. OENO One 2020, 54, 833–848. [Google Scholar] [CrossRef]
  28. Gatti, M.; Dosso, P.; Maurino, M.; Merli, M.C.; Bernizzoni, F.; Pirez, F.J.; Platè, B.; Bertuzzi, G.C.; Poni, S. MECS-VINE®: A New Proximal Sensor for Segmented Mapping of Vigor and Yield Parameters on Vineyard Rows. Sensors 2016, 16, 2009. [Google Scholar] [CrossRef] [PubMed] [Green Version]
Figure 1. Example of a vine segment after the defoliation process and image processing by the computer vision algorithm from [8,24]. Images on the left correspond to the in-field acquired pictures (no defoliated, (a0,a1); partially defoliated, (b0,b1); and fully defoliated, (c0,c1). Images on the right represent the processed output of the computer vision algorithm.
Agronomy 11 01003 g001
Figure 2. Linear regressions between the number of fruit pixels computed by machine vision and yield in five Tempranillo commercial vineyard plots (labelled from (A) to (E) and described in Table 1) under three defoliation practices: no defoliation, partial defoliation and full defoliation. Determination coefficients (R2) were significant at p = 0.05 (*) and p = 0.001 (***).
Agronomy 11 01003 g002aAgronomy 11 01003 g002b
Figure 3. Linear regressions between the number of fruit pixels computed by machine vision and yield in no defoliated (a), partial defoliated (b) and full defoliated (c) Tempranillo vines. All determination coefficients (R2) were significant at p = 0.001 (***).
Agronomy 11 01003 g003aAgronomy 11 01003 g003b
Figure 4. Linear regressions between the number of fruit pixels computed by machine vision and yield in Tempranillo vines under three levels of leaf occlusion (fruit occlusion affected by leaves) rate: (a), Low (<30%); (b), intermediate (30–60%); and (c), high leaf occlusion (>60%). All determination coefficients (R2) were significant at p = 0.001 (***).
Agronomy 11 01003 g004
Table 1. Description of the five Tempranillo vineyard plots analyzed in this study located in Rioja wine appellation, Spain.
Vineyard PlotCordonRow Spacing (m)Vine Spacing (m)Altitude (m)Row Orientation
ASingle3.01.0700NE–SW
BSingle3.01.0680NE–SW
CDouble2.51.20510E–W
DDouble2.51.20500NE–SW
EDouble2.51.10555N–S
Table 2. Descriptive statistics for yield components (yield, bunch number and bunch weight) in five Tempranillo vineyard plots analyzed in this study.
PlotMeanSDCVMinMaxSkewnessKurtosis
Yield
(kg·m−1)
A2.330.9741.680.584.04−0.02−0.93
B1.961.0251.770.195.340.861.68
C2.821.2444.070.526.630.600.29
D2.791.6659.510.006.200.23−0.45
E2.601.4756.670.006.180.52−0.02
ALL2.531.3553.260.006.630.560.30
Bunch Number (Number per
Meter)
A9.782.9430.044.4115.45−0.12−0.89
B8.703.4840.011.3315.520.01−0.51
C9.513.3635.311.5917.65−0.22−0.20
D9.004.7652.850.0020.00−0.10−0.40
E8.364.1649.720.0017.190.16−0.84
ALL9.063.8442.410.0020.00−0.11−0.30
Bunch Weight
(kg)
A0.230.0521.790.120.31−0.47−0.57
B0.230.0939.640.070.581.804.87
C0.300.0928.990.180.712.137.53
D0.280.1344.890.000.58−0.540.54
E0.350.1234.080.000.65−0.361.81
ALL0.280.1138.870.000.710.643.26
SD: standard deviation; CV: variation coefficient; Min: minimum; Max: maximum.
Table 3. Descriptive statistics for canopy porosity (percentage of gap pixels) computed by machine vision in five Tempranillo vineyard plots (individually and all together) under three defoliation practices: no defoliation, partial defoliation and full defoliation.
PlotMean (%)SDCVMinMaxSkewnessKurtosis
No Defoliation A16.319.4157.724.2443.881.130.66
B7.627.4697.930.3429.711.451.27
C21.789.3642.987.5050.140.670.44
D24.4012.4851.155.7768.881.312.32
E25.7510.0439.004.7245.38−0.14−0.56
ALL19.8011.8159.650.3468.880.650.65
Partial DefoliationA25.7311.3444.088.8450.540.57−0.62
B12.678.9470.601.1242.941.391.88
C31.7312.3738.998.4163.900.440.07
D34.2112.3336.059.9670.760.640.83
E35.3811.9733.8413.4762.830.06−0.70
ALL28.7114.0148.811.1270.760.26−0.35
Full DefoliationA60.766.6510.9541.3277.46−0.310.80
B40.519.3823.1415.7960.00−0.400.12
C55.449.8617.7932.3476.51−0.36−0.50
D60.1310.3017.1343.6189.050.750.10
E53.959.0816.8330.0971.27−0.46−0.31
ALL54.4711.4821.0815.7989.05−0.330.38
SD: standard deviation; CV: variation coefficient; Min: minimum; Max: maximum.
Table 4. Descriptive statistics for the leaf exposure (percentage of leaf pixels) computed by machine vision in five Tempranillo vineyard plots (individually and all together) under three defoliation practices: no defoliation, partial defoliation and full defoliation.
PlotMean (%)SDCVMinMaxSkewnessKurtosis
No DefoliationA60.1715.0625.0212.1682.27−1.021.26
B54.6215.1227.6919.1682.32−0.56−0.27
C28.5112.0342.207.4460.720.31−0.30
D41.4615.4237.213.1771.70−0.64−0.17
E32.9213.4740.919.6572.210.280.03
ALL42.3318.4843.653.1782.320.07−0.78
Partial DefoliationA41.6012.8230.829.6166.00−0.62−0.14
B36.4212.9035.4110.1061.000.04−0.75
C17.018.8251.833.4744.660.720.54
D28.3711.3640.042.5652.92−0.27−0.59
E19.489.9050.812.3148.990.380.17
ALL27.6714.4452.172.3166.000.35−0.66
Full DefoliationA0.620.2410.560.010.860.37−0.50
B0.350.1210.570.020.660.940.14
C0.480.2522.520.010.740.330.91
D0.070.1046.420.000.230.980.56
E0.560.1446.180.000.760.920.70
ALL0.420.1724.800.010.861.201.15
SD: standard deviation; CV: variation coefficient; Min: minimum; Max: maximum.
Table 5. Descriptive statistics for the bunch exposure (percentage of fruit pixels) computed by machine vision in five Tempranillo vineyard plots (individually and all together) under three defoliation practices: no defoliation, partial defoliation and full defoliation.
PlotMean (%)SDCVMinMaxSkewnessKurtosis
No DefoliationA5.493.2859.730.9014.690.850.09
B5.883.5961.051.0014.960.990.45
C11.886.0350.791.1928.600.530.27
D13.037.1855.080.9332.080.18−0.58
E15.125.5636.773.1029.480.310.21
ALL10.686.6362.100.9032.080.60−0.21
Partial DefoliationA11.153.2028.683.9517.02−0.31−0.42
B11.515.1344.583.0023.470.16−0.52
C15.816.6041.724.1030.140.28−0.51
D16.487.8647.680.9736.47−0.14−0.18
E19.156.6734.805.9837.160.700.40
ALL15.126.8845.500.9737.160.500.30
Full DefoliationA17.574.1223.455.6026.24−0.370.76
B17.666.4036.265.3132.590.18−0.13
C19.187.3038.075.2332.730.01−0.88
D19.108.8446.260.9237.35−0.59−0.14
E20.547.4936.486.0744.740.831.05
ALL18.917.1537.830.9244.740.090.55
SD: standard deviation; CV: variation coefficient; Min: minimum; Max: maximum.
Publisher’s Note: MDPI stays neutral with regard to jurisdictional claims in published maps and institutional affiliations.

