Article

The Soil Organic Matter in Connection with Soil Properties and Soil Inputs

by
Václav Voltr
1,*,
Ladislav Menšík
2,
Lukáš Hlisnikovský
2,
Martin Hruška
1,
Eduard Pokorný
1 and
Lubica Pospíšilová
3
1
Institute of Agricultural Economics and Information, Mánesova 1453/75, 120 00 Praha 2, Ruzyně, Czech Republic
2
Crop Research Institute, Division of Crop Management Systems, Drnovská 507/73, 161 06 Praha 6, Ruzyně, Czech Republic
3
Department of Agrochemistry, Soil Science, Microbiology and Plant Nutrients, Faculty of AgriSciences, Mendel University in Brno, Zemědělská 1, 613 00 Brno, South Moravian, Czech Republic
*
Author to whom correspondence should be addressed.
Agronomy 2021, 11(4), 779; https://doi.org/10.3390/agronomy11040779
Submission received: 13 March 2021 / Revised: 10 April 2021 / Accepted: 14 April 2021 / Published: 15 April 2021
(This article belongs to the Special Issue Humic Substances: A Novel Eco-Friendly Fertilizer)

Abstract

:
The content of organic matter in the soil, its labile (hot water extractable carbon–HWEC) and stable (soil organic carbon–SOC) form is a fundamental factor affecting soil productivity and health. The current research in soil organic matter (SOM) is focused on individual fragmented approaches and comprehensive evaluation of HWEC and SOC changes. The present state of the soil together with soil’s management practices are usually monitoring today but there has not been any common model for both that has been published. Our approach should help to assess the changes in HWEC and SOC content depending on the physico-chemical properties and soil´s management practices (e.g., digestate application, livestock and mineral fertilisers, post-harvest residues, etc.). The one- and multidimensional linear regressions were used. Data were obtained from the various soil´s climatic conditions (68 localities) of the Czech Republic. The Czech farms in operating conditions were observed during the period 2008–2018. The obtained results of ll monitored experimental sites showed increasing in the SOC content, while the HWEC content has decreased. Furthermore, a decline in pH and soil´s saturation was documented by regression modelling. Mainly digestate application was responsible for this negative consequence across all soils in studied climatic regions. The multivariate linear regression models (MLR) also showed that HWEC content is significantly affected by natural soil fertility (soil type), phosphorus content (−30%), digestate application (+29%), saturation of the soil sorption complex (SEBCT, 21%) and the dose of total nitrogen (N) applied into the soil (−20%). Here we report that the labile forms (HWEC) are affected by the application of digestate (15%), the soil saturation (37%), the application of mineral potassium (−7%), soil pH (−14%) and the overall condition of the soil (−27%). The stable components (SOM) are affected by the content of HWEC (17%), soil texture 0.01–0.001mm (10%), and input of organic matter and nutrients from animal production (10%). Results also showed that the mineral fertilization has a negative effect (−14%), together with the soil depth (−11%), and the soil texture 0.25–2 mm (−21%) on SOM. Using modern statistical procedures (MRLs) it was confirmed that SOM plays an important role in maintaining resp. improving soil physical, biochemical and biological properties, which is particularly important to ensure the productivity of agroecosystems (soil quality and health) and to future food security.

1. Introduction

Today’s conventional agriculture faces many challenges. The most significant is the growing demand for food and changing climatic conditions. Quality crop production is based on sufficient soil fertility. However, ensuring soil fertility must not be associated with a negative impact on the environment. One of the basic approaches to ensure this compliance is to increase the organic matter in the soil, which helps to ensure soil multifunctionality [1,2,3] and support soil living conditions [1,2].
High yields are currently ensured via the application of mineral fertilisers and irrigation [3]. All forms of fertilisers (mineral and organic fertilisers, organic manures) have a great impact on soil fertility and soil properties [4]. While organic manures generally increase the pool of soil organic carbon (SOC) and N [5,6,7], mineral fertilisers increase carbon (C) inputs indirectly through higher production of crops and post-harvesting residues. On the other hand, the mineral N fertilisers significantly promote decomposition processes and may cause depletion of the SOC over time [8]. The agricultural approaches depending only on mineral fertilisers (without the use of organic manures) often lead to degradation of the soil environment, such as soil pH decrease, reduction of the SOC and soil organic matter (SOM) content or reduced availability of nutrients [9,10,11,12]. The SOM is crucial for the processes improving soil physical properties, such as maintaining a suitable soil structure, the thermal regime or the water dynamics in the soil [13]. The SOM also significantly affects the biochemical processes, such as nutrient cycling, binding and decomposition of hazardous substances and elements [14,15,16], and biological properties of the soil [17,18]. The high SOM content increases the nutrient supply [19] and soil buffering capacity [10,12]. Increasing the SOM content contributes also to the higher C sequestration in the soil [20,21]. Consequently, the loss of topsoil by erosion is minimised [22]. Therefore, the maintenance or increase of the SOM content is particularly important for maintaining the productivity of the agroecosystems [23] and for ensuring food safety in the future [24,25].
Agriculture in the Czech Republic is undergoing constant changes. Especially after 1990, the year of transformation from the planned to a market economy, we record the occurrence of negative phenomena, such as reduced crop rotations, reduced forage area (−35%) at the expense of cereals (+84%) and winter rapeseed (+343%). Another problem is the reduction of animal husbandry (cattle by 50%, pigs by 31%, sheep by 50%) and the associated reduction of organic manures—lower inputs of OM [11].
One of the ways to increase SOM and ensure the inputs of organic substances and nutrients into the soil is the application of organic fertilisers, compost and digestate [26,27]. Digestate is a by-product of biogas plants, which has an unprecedented boom, especially in Europe [28]. Digestate is an excellent fertiliser, providing a high amount of plant-available N and P in the short term, enhancing the biological properties of the soil, and providing high yields of spring crops when compared with mineral fertilisers [29]. The average dry matter content of the digestate is very low, ranging between 1.5% and 46% [29]. However, the lower value is the most common. Digestate positively affects primarily biological soil properties [30] and topsoil physiological properties [31]. Application of the solid part of the digestate can increase the soil quality, including soil C pool, significantly, while the effect of the liquid part on the soil properties is lower [32]. The effect of digestate on the SOC content can be positive [33,34] or neutral [30].
Modelling can be used for a deeper analysis of SOC behaviour in soil, based on a wide range of variables. There are several ways to analyse and model the behaviour of SOC in soil. One of the possibilities is, for example, the CENTURY Soil Organic Matter Model Environment. The CENTURY model is a general FORTRAN model of the plant-soil ecosystem that has been used to represent C and nutrient dynamics for different types of ecosystems (grasslands, forest, crops, and savannas) [35,36]. Another well-known model is the EPIC model, which is a process-based model describing the interactions between the climate and soil [37,38]. The model RothC-26.3 is focused on the turnover of organic C in non-waterlogged soils that allow analysing the effects of soil type, temperature, moisture content and plant cover on the turnover process [39,40]. There were also developed many other models [41,42,43]. Available models need different types of input information (e.g., weather, sowing procedure, plan of work on the field, fertilisation, etc.) and are based on different algorithms. A very good approximation for water regime modelling was achieved by the STIC model [44]. On the other hand, there are no models available for modelling the soil properties after digestate application. Furthermore, using the multiple linear regression (MLR) there is possible to see the relationship between the SOC stock and other soil´s properties [45,46,47]. Many of the MLR studies are focused on SOC stock modelling on large scale (e.g., large areas of individual states or continents, etc.) [48,49,50,51]. In the present study the multidimensional linear regression–MLR analysis is aimed at the relationship between the labile C forms (HWEC), soil properties and management practices (e.g., texture, pH, SOM content, nutrients, a dosage of fertilisers and digestate effect, etc.).
The main goal is to show the comprehensive approach to the problem of long-term digestate application and SOC stocks in various soil-climatic conditions. Furthermore, the relationship between HWEC and digestate application was observed. In this paper we comment on the main issues: In which cases is SOC increasing? Is the SOC decrease caused by tillage system? How is fertilising affecting the amount of SOC and HWEC? During two comprehensive surveys conducted by the Institute of Agricultural Economics and Information (2008 and 2018), a large number of soil samples and information were obtained directly from agricultural farms that operate biogas plants and regularly apply digestate to the soil. These data were used as an input dataset for the analysis (modelling which uses the multidimensional linear regression—MLR) and contribute to a better understanding of SOM changes at various agricultural management practices.

2. Materials and Methods

The general principle of the investigation was based on the assessment of the soil´s parameters in relationship with the amount of applied organic matter, crops yields, and management technology (evaluation of soil samples according to the supply of organic matter, technologies used and crops, see Figure 1). The research was realised at 68 localities in the Czech Republic, on the real farms running the biogas stations (the digestate was applied regularly on the fields), during 2008 and 2018.
The analysed fields are located in the climatic regions 2 (10 localities), 3 (26 localities), 5 (20 localities), 6 (1 locality) and 7 (11 localities) (Table 1). The soil types represented are: Chernozems, Luvisols, Cambisols, Fluvisols and Planosols (51). The specific input description of SOC and HWEC is given in the Supplementary Materials (Scheme S1). Results were grouped with regards to soil types according to the tables in Supplementary Materials (Tables S1 and S2).
The different types of soil´s management, including ploughing, were used on the selected farms. The soil samples for chemical analysis were taken from the topsoil (Ap 0–30 cm) and subsoil (30–60 cm). Soil sampling was performed at each experimental site. A rectangle with a side length of 25 × 40 m (1000 m2 totally) was marked on the field, and the samples were taken in diagonals (16 samples were performed on each diagonal; 32 soil probes totally). From each field, a mixed sample was created from all soil probes. Furthermore, a disturbed soil sample was taken from every experimental field for the analysis of soil physical properties.
The soil reaction (pH) was determined by the potentiometric method using 50 mL of 1.0 mol/L KCl /1:2.5 w/v; 10:25/ (inoLab pH 730, WTW, Germany). The SOC content was analysed colourimetrically according to [52], and also by oxidimetric titration method according to [53]. Determination of hot water-soluble C (HWEC) was based on the Körchens method [54,55]. In short, 10 g of air-dried soil sample were put into a 1000 mL flat-bottomed flask (Schott AG, Mainz) and varying amounts of TOC-free water (H2O) were added. All flasks were heated on a boiling apparatus (Gerhardt GmbH, Königswinter) and kept weakly, boiling under reflux for 60 min. After cooling down to room temperature, all extracts were centrifuged for 10 min (2600 g). The supernatants were carefully decanted. HWEC content was determined by oxidimetric titration method. Using the method of [56], the soil sorption complex characteristics (S—base content, T—cation exchangeable capacity, V—sorption complex base saturation) were measured [57]. The grain composition of the soil (individual grain fractions—up to 0.001 mm, from 0.001 to 0.01 mm, 0.01–0.05 mm, 0.05–0.25 and 0.25–2.00 mm) were determined according to [58]. Results (mean values of the soil chemical, physical and biological properties) are given in Supplementary Materials (Table S3).
A comprehensive data evaluation was performed according to soil samples and other production identifiers. The basic approach was to evaluate the changes and relationship between SOM, SOC determined by combustion and HWEC (during 2008 and 2018). Complex data on land in a given range of years were used to evaluate the changes (see Figure 2). The year 2016 was added to the monitoring scheme because the medium-term effect of fertilisers (2016 to 2018) was determined this year.
Together with soil samples, other additional information about the fields were collected: cultivated crops, the yields of the main and by-products, tillage measurements (classical tillage vs. no-till), and the form and doses of fertilisers (Results—mean values of the crops—are given in Supplementary Materials Table S4). The doses of process water and digestate from the biogas stations were specifically monitored on each farm. All applied fertilisers were converted into nutrients (N, P2O5, K2O) and the values of organic manures were converted into organic matter according to [59]. All fields were also grouped according to their stoniness and slope. The inputs and outputs from the crop production were evaluated according to [59,60,61]. The main yield was measured according to the weight and moisture. Due to partial use of by-product as organic C source on the place, all by-products were calculated [60], for local soil-climatic conditions with the standard share of by-product to the main product. In this article, the effects of digestate and process water application on the formation of HWEC and SOC were assessed. Further analyses of the effects of nutrient and process water recycling in the area will be carried out in follow-up research.
All statistical analyses, including the graphical outputs, were performed in IBM SPSS Statistics 27 (IBM, Armonk, New York, USA), QC Expert 3.3 Pro (TriloByte Statistical Software, Ltd., Pardubice, the Czech Republic, 2018), OriginPro 2018b (OriginLab Corporation, Northampton, MA, USA) and NCSS 12 Statistical Software (2018, NCSS, LLC. Kaysville, Utah, USA, ncss.com/software/ncss.). Techniques of exploratory analysis of one-dimensional data, factor analysis of physical properties of soils (not selected in the final solution), linear regression—construction of a multidimensional linear regression model by regression triplet, etc. were used [62]. The proposed multidimensional linear model was further refined by a procedure called regression model search by regression triplet and it consisted of the following steps: (1) model design; (2) preliminary data analysis (multicollinearity, heteroskedasticity, autocorrelation and influence points); (3) estimation of parameters using the classical least squares method (LSM) and subsequent testing of the significance of parameters using the Student’s t-test, mean square error of prediction, and Akaik information criterion (AIC); (4) regression diagnostics—identification of influence points and verification of the LSM assumptions; (5) construction of the refined model: the parameters of the refined model are estimated using: (a) the weighted least squares method (WLSM) with non-constant variance, (b) the generalised LSM for autocorrelation, (c) the conditional LSM with constraints on parameters, (d) methods of rational ranks in multicollinearity, (e) methods of extended least squares for the case, that all variables are burdened with random errors, and (f) robust methods for distributions other than normal and data with deviating values and extremes [62]. Statistical significance was tested at a significance level of p = 0.05.

3. Results

The data set was acquired under the operating conditions of agricultural farms at 68 localities (experimental fields) in the Czech Republic (CR) during the period 2008–2018. All variable and abbreviation are given in Supplementary Materials (Table S5). The most represented soil types were as follows: Chernozem (28 localities), Haplic Luvisol—in the graph marked as Luvisol—(13 localities), Cambisol (11 localities), Albic Luvisol (8 localities), Fluvisol (6 localities) and Planosols (2 localities).

3.1. Basic Physio-Chemical Parameters of Experimental Fields (Localities) and Nutrient Inputs to the Soil

The average values of individual parameters of database items are described in Table S3—Mean values of the soil chemical, physical and biological properties (see Supplementary Materials Table S3).
The diagrams (Figure 3) show the relationship between the pH, SOC, HWEC and SEBCT on studied soils. The exchangeable soil reaction (pH/KCl) in soils varied from 4.7 to 7.5 (in 2018). The highest average pH was in Chernozem (6.59) and the lowest in Planosol (5.42); see Figure 3. There was observed a decrease in pH at all monitored experimental localities; see Figure 3. The SOC content in 2018 ranged from 1.04% to 2.84%. The highest average SOC content was in Chernozem (1.92%), and the lowest in Albic Luvisol and Plansol (both 1.14%) (Figure 3). The average difference in SOC content (2018 minus 2008, which means SOC content at the end of the experiment minus the SOC content at the beginning of the experiment) ranged from 0.06% (Planosol) to 0.20% (Chernozem). At all monitored experimental sites, there was observed an increase in SOC; see Figure 3. The HWEC content was analysed in 2008 and 2018. The HWEC content in the experimental fields in 2018 ranged from 225 to 666 mg kg−1. According to the soil type, the mean values ranged from 335 mg kg−1 (Albic Luvisol) to 500 mg kg−1 (Planosol). The average difference in HWEC content (2018 minus 2008) ranged from −38 mg kg−1 (Planosol) to −178 mg kg−1 (Fluvisol). On average, there was a decrease in HWEC content in all monitored soil types; see Figure 4. The average saturation of the soil sorption complex (SEBCT %) during 2008–2018 ranged from 63% (Planosol) to 93% (Fluvisol, Chernozem). The average SEBCT was higher than 50%; the soils were from medium to highly saturated.
According to the individual soil types, the average soil granularity (%) ranged from 13.7% (Albic Luvisol) to 24.8% (Planosol) in the first category (0.001–0.01 mm). In the second category (0.25–2.00 mm), the average values ranged from 1.3% to 3.9% (Chernozem, Albic Luvisol, Haplic Luvisol, Fluvisol), and the last category ranged from 16.4% to 20.7% (Planosol, Cambisol); see Supplementary Materials (Figure S1). The average annual doses of N, applied in fertilisers for the period 2008–2018 ranged from 121.2 kg ha−1 (Planosol) to 157.2 kg ha−1 (Luvisol) at all localities. The N applied in the form of mineral fertilisers is similar to the total N. The average input of total P into the soil in fertilisers ranged from 19.7 kg ha−1 (Fluvisol) to 47.6 kg ha−1 (Chernozem). The average input of total K ranged from 12.0 kg ha−1 (Cambisol) to 69.1 kg ha−1 (Luvisol). The highest average input P was recorded on the soil type Planosol (186.5 kg ha−1); see Supplementary Materials (Figures S2 and S3).

3.2. Basic Relationship between the Soil Parameters (Simple Linear Regression)

Based on regression modelling, a model of the dependence of the pH difference between 2008 and 2018 (pH 2018 minus pH 2008) on the doses of organic material (OM) applied in digestate for the experimental field across soil types was developed. The modelling confirmed that the increase of digestate caused the pH decline; see Figure 3 (Box-Plot). Parameters of the model were as follows: the equation of the straight-line relating Difference pH 2018–2008 and Digestate OM, estimated as pH difference 2018–2008 = (−0.0373) + (−0.5490) * Digestate OM using the 60 observations in this dataset. The y-intercept, the estimated value of the Difference pH 2018–2008 when Digestate OM is zero, is −0.0373 with a standard error of 0.0956. The slope, the estimated change in the Difference pH 2018–2008 per unit change in Digestate OM, is −0.5490 with a standard error of 0.1829. The value of R-Squared, the proportion of the variation in Difference pH 2018–2008 that can be accounted for by variation in Digestate OM, is 0.1344. The correlation between the Difference pH 2018–2008 and Digestate OM is −0.3666. A significance test that the slope is zero resulted in the t-value of −3.0011. The significance level of this t-test is 0.0040. Since 0.0040 < 0.0500, the hypothesis that the slope is zero is rejected. The estimated slope is −0.5490. The lower limit of the 95% confidence interval for the slope is −0.9151 and the upper limit is −0.1828. The estimated intercept is −0.0373. The lower limit of the 95% confidence interval for the intercept is −0.2287 and the upper limit is 0.1540; see Figure 4.
Decreasing of soil reaction (pH/KCl) caused the changes in the sorption complex. These changes are expressed by parameter Diff SEBCT (Difference SEBCT: SEBCT 2018 minus SEBCT 2008) as a function of OM doses in digestate for the experimental field across soil types; see Figure 4. The model has the following parameters: the equation of the straight line relating Diff SEBCT and Digestate OM is estimated as: Diff SEBCT = (10.3980) + (−19.8819) * Digestate OM using the 55 observations in this dataset. The y-intercept, the estimated value of Diff SEBCT when Digestate OM is zero, is 10.3980 with a standard error of 2.9603. The slope, the estimated change in Diff SEBCT per unit change in Digestate OM, is −19.8819 with a standard error of 6.0755. The value of R-Squared, the proportion of the variation in Diff SEBCT that can be accounted for by variation in Digestate OM, is 0.1681. The correlation between Diff SEBCT and Digestate OM is −0.4100. A significance test that the slope is zero resulted in the t-value of −3.2725. The significance level of this t-test is 0.0019. Since 0.0019 < 0.0500, the hypothesis that the slope is zero is rejected. The estimated slope is −19.8819. The lower limit of the 95% confidence interval for the slope is −32.0678 and the upper limit is −7.6960. The estimated intercept is 10.3980. The lower limit of the 95% confidence interval for the intercept is 4.4604 and the upper limit is 16.3355.

3.3. The Multidimensional Linear Regression Models

Based on the results (see Section 3.1.), three multidimensional linear regression models were constructed for the parameters: (1) HWEC OM inputs 2018; (2) HWEC 2018–2008 with OM inputs between 2016 and 2018, and (3) SOC difference between 2008 and 2018. To determine the regression equations, the Backward method was used, which gradually took away insignificant variables. In the case of the HWEC 2018–2008 difference, the Forward method was used. The final three models were further refined using regression diagnostics, the so-called regression triplet (Meloun, Militký 2012). The IRWLS exp (−e) method was used to refine the models. This is a robust regression method from the class of M-estimates, in which the square of weighted normalised residues w (eni) with weights w (e) = exp (−e) is minimised. Iteratively Re-Weighted Least Squares method was used for the calculation.

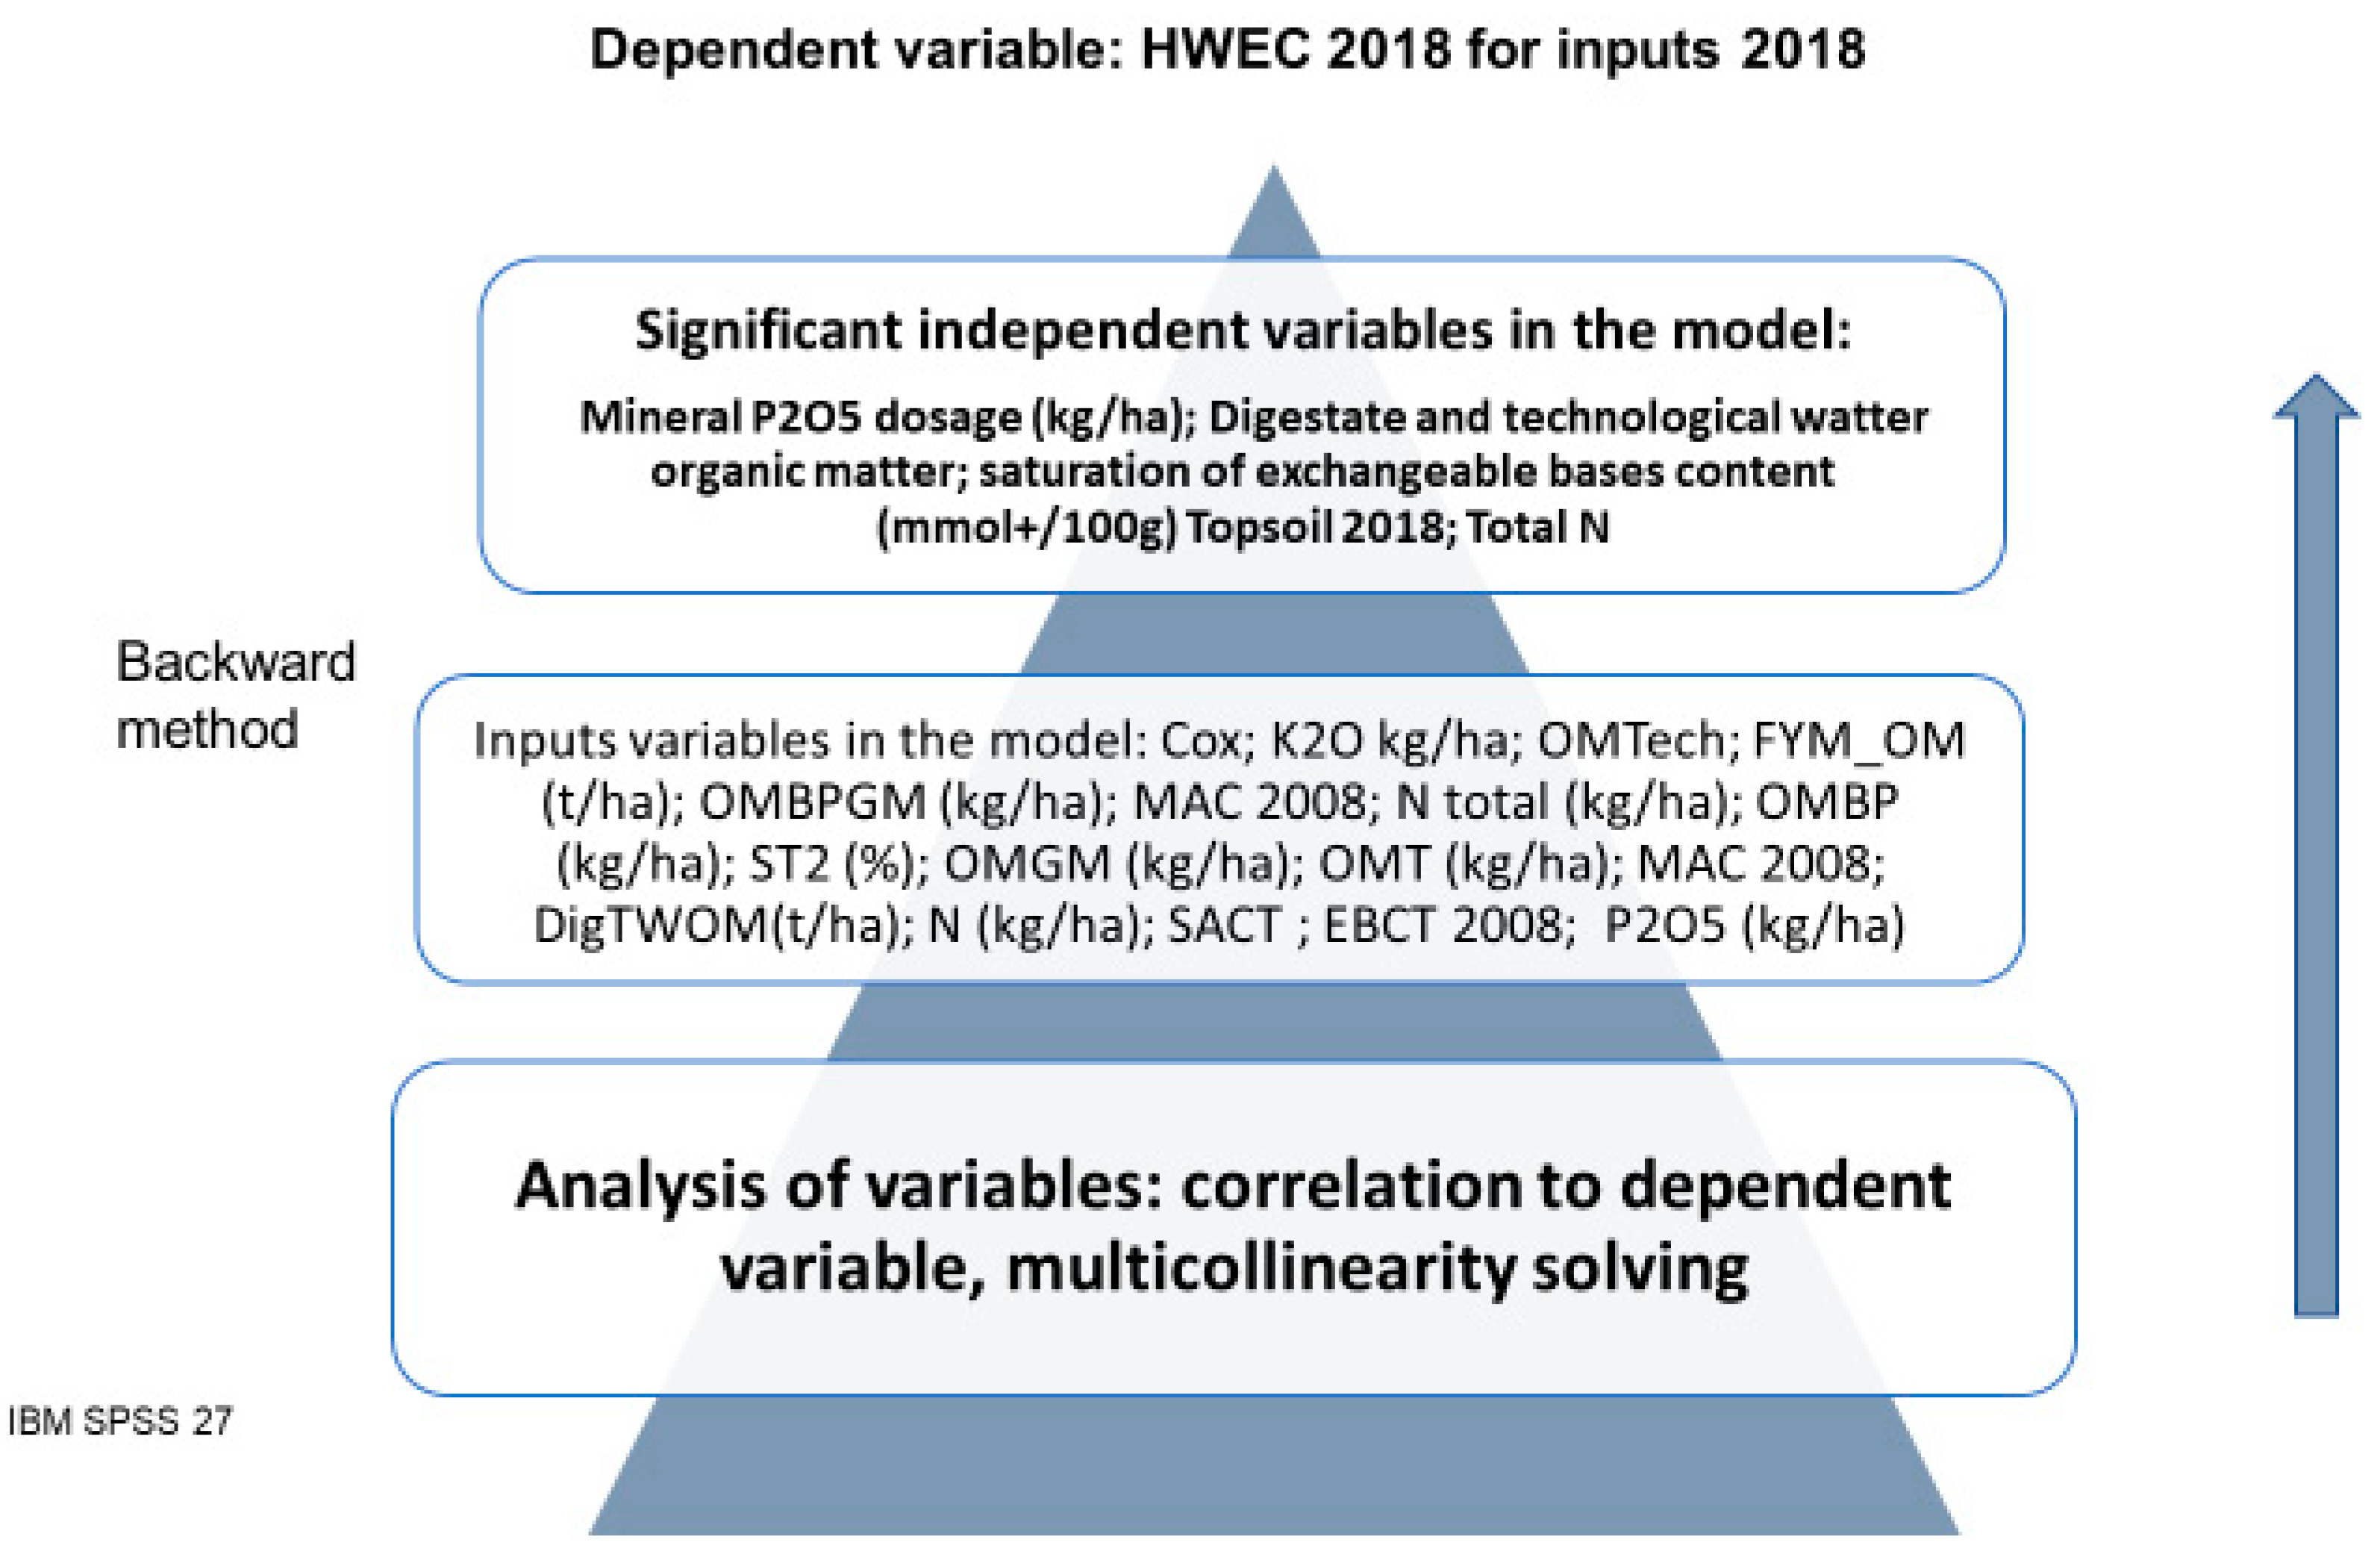
3.3.1. Model 1: HWEC OM Inputs 2018

The model was developed based on the scheme shown in Figure 5. The final model (there were a total of 11 models) for the HWEC content in 2018 reached the coefficient of determination R2 = 0.3460. The results of the final model are shown in Supplementary Materials (Table S5). The VIF collinearity statistics showed a value slightly over 1, proving mutually independent data.
The final multidimensional linear regression model for the dependence of the HWEC content (mg kg−1) in the soil for the model year 2018 was further refined using regression diagnostics and the so-called regression triplet. The refined model has an equation:
HWEC (2018) = −800.3514012 −0.62886 × Mineral P2O5 dosage (kg/ha) + 166.8419 × OM from digestate and technological water + 13.77858 × Saturation of exchangeable bases content (mmol+/100g) −0.31541 × Total N.
The statistical characteristics of the regression are as follows: R = 0.8782, R2 = 0.7712, MEP = 9688.4603, AIC = 270.2502. The model is significant according to the Fisher-Snedecor model significance test (F = 24.4474, quantile F = 2.7013, p = 0.0000). The model is correct according to Scott’s criterion of multicollinearity (SC = 0.1503). Residues show homoskedasticity (Cook-Weisberg heteroskedasticity test). Residues have a normal distribution (Jarque-Berr normality test). Residues are negatively autocorrelated (Durbin-Watson autocorrelation test). There is no trend in residues (Signed residue test); see Supplementary Materials (Table S6; Figure S4).

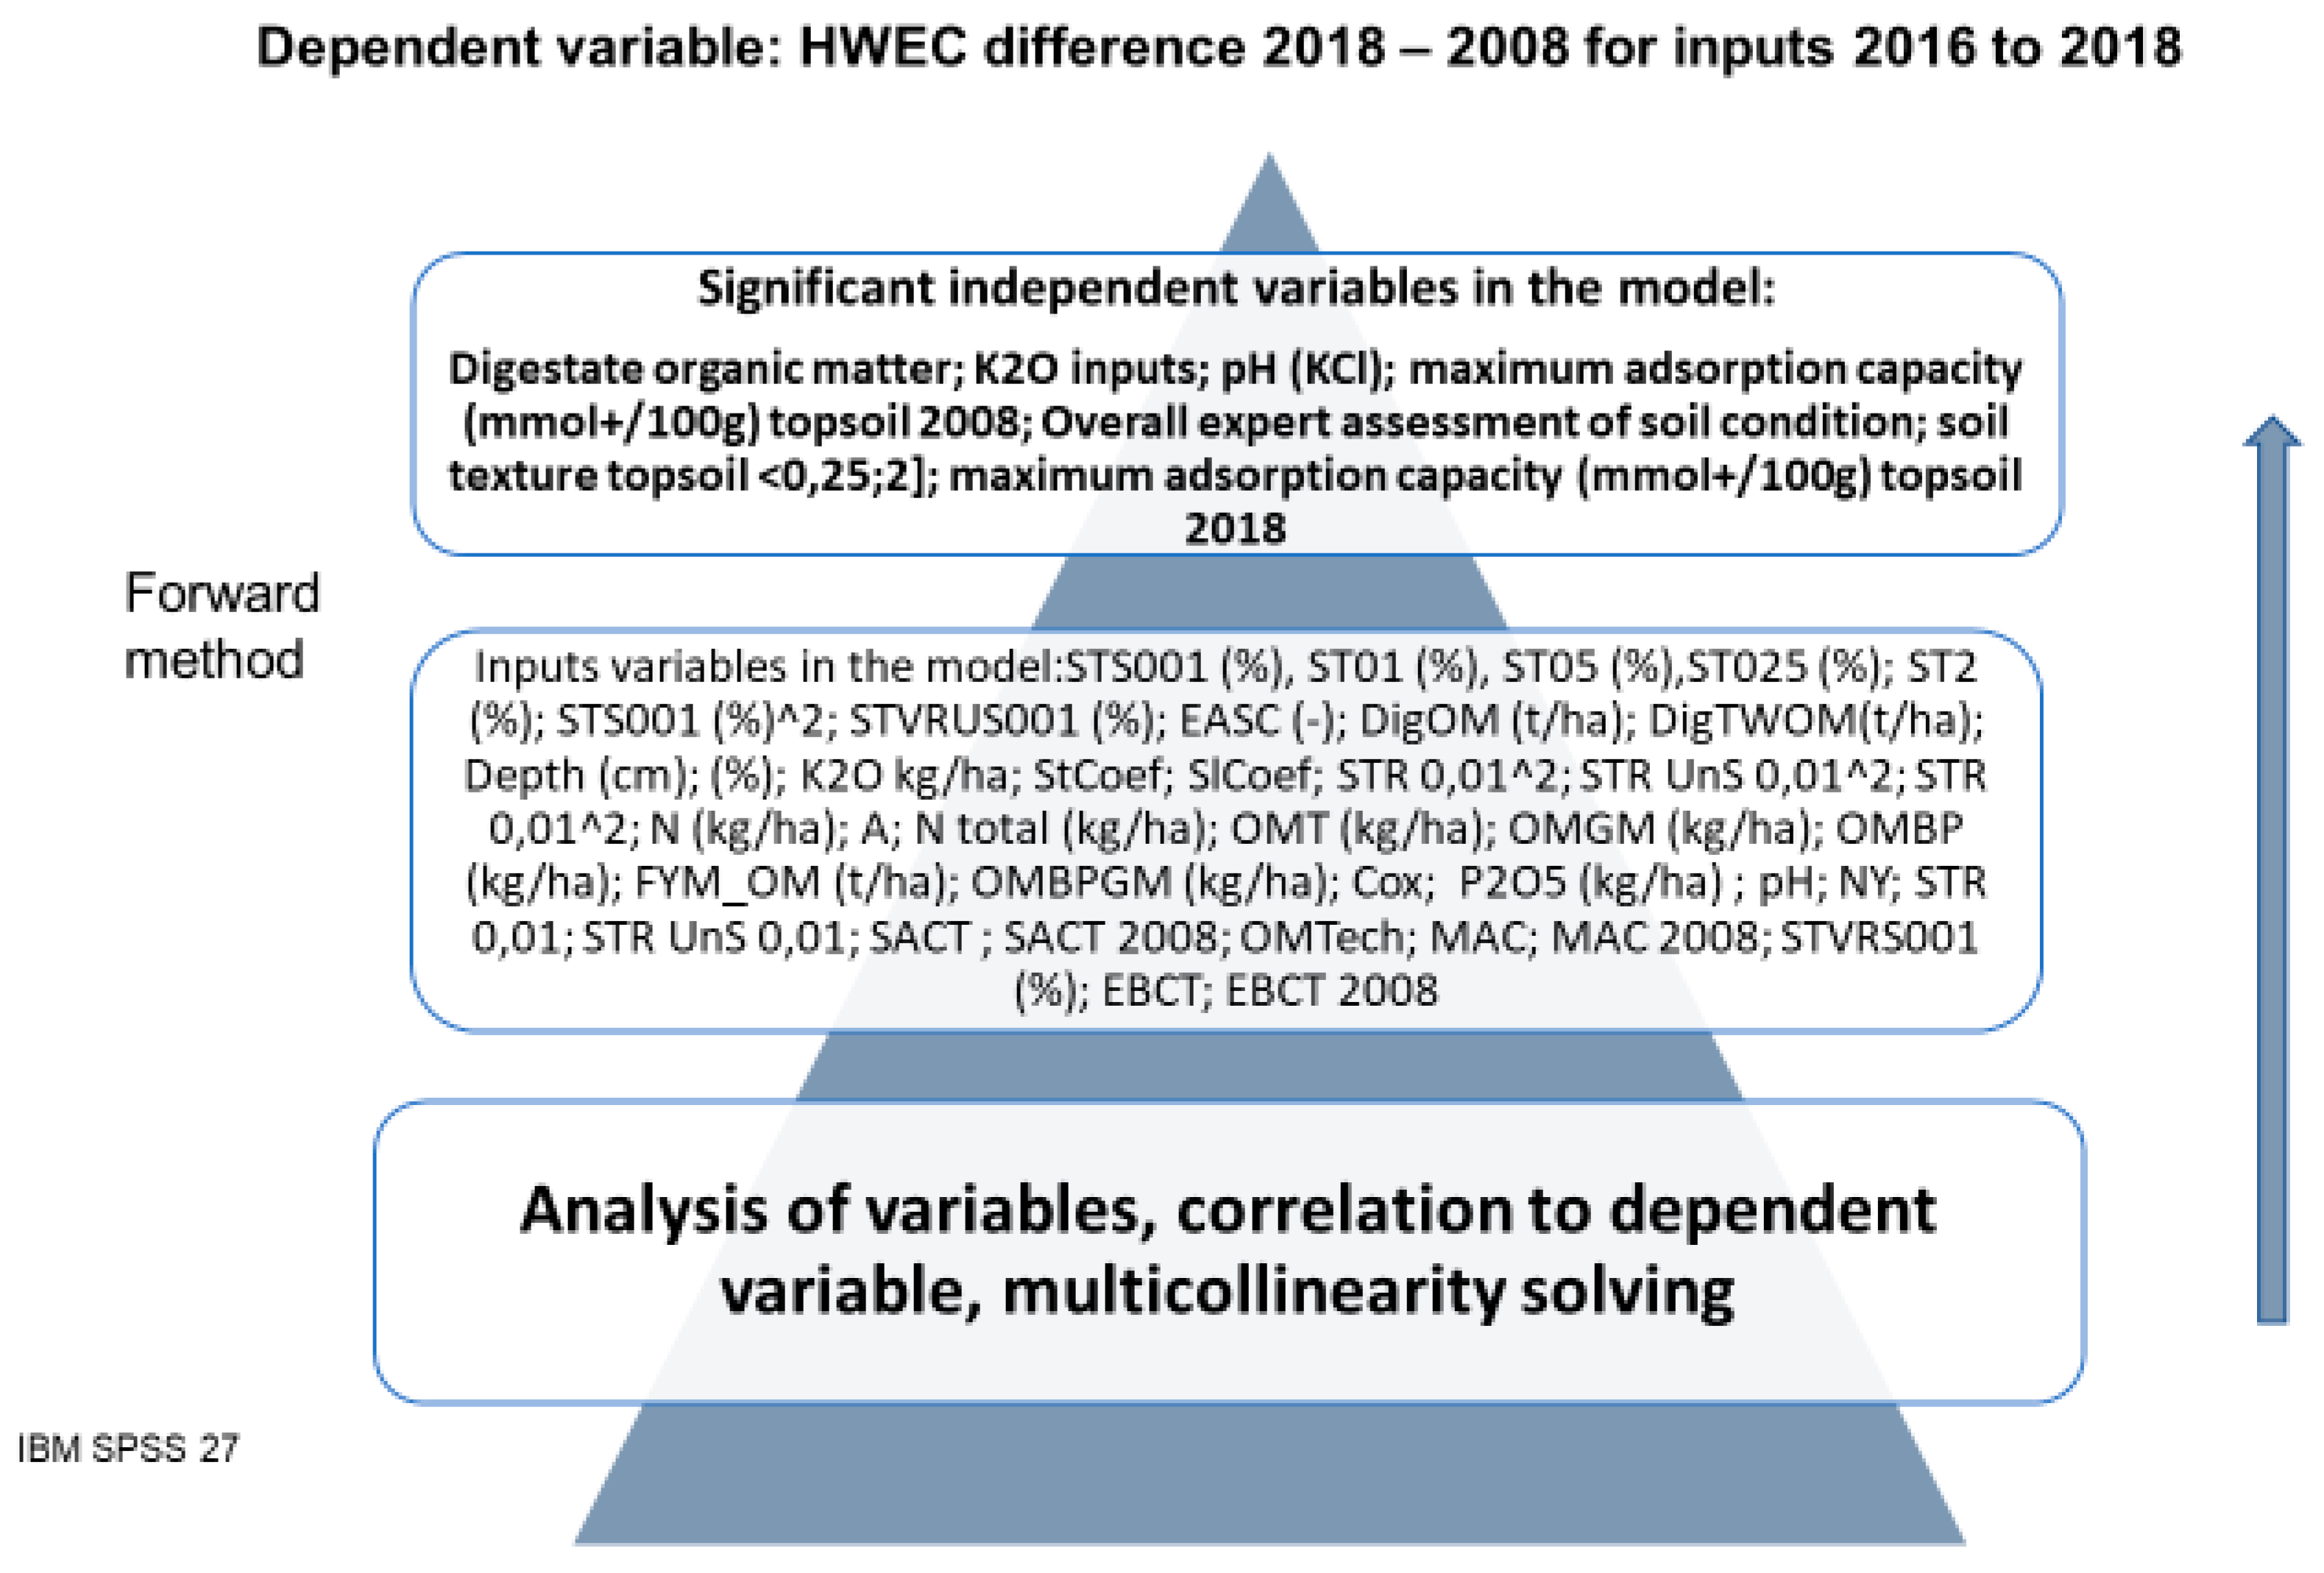
3.3.2. Model 2: Difference of HWEC Content (2008–2018)

The model was developed based on the scheme shown in Figure 6. The final model (there were a total of seven models) for HWEC difference reached the coefficient of determination R2 = 0.3791. The results of the final model are shown in Supplementary Materials (Table S7). The VIF collinearity statistics showed a value slightly over 1, proving mutually independent data.
The multidimensional linear regression model for the HWEC difference (period 2018–2008) was further refined using regression diagnostics and the so-called regression triplet. The refined model has an equation:
HWEC difference = 542.6295 +156.3642 × Digestate organic matter −0.1025 × K2O inputs −114.4247 × pH (KCl) + 1.6734 × Maximum adsorption capacity (mmol+ 100g−1) of the topsoil 2008−37.8306 × Overall expert assessment of soil condition y + 2.3033 × Saturation of adsorption capacity (mmol+ 100g−1)of the topsoil 2018.
In the parameter estimates the parameters K2O inputs, Maximum adsorption capacity (mmol + 100g−1) in the topsoil 2008 and Soil texture of the topsoil (0,25; 2) are not statistically significant and therefore have been removed. The final multidimensional regression model has the equation:
HWEC difference = 542.6295 +156.3642 × Digestate organic matter −0.1025 × pH (KCl) −37.8306 × Overall expert assessment of soil condition y + 0.9948 × Soil texture topsoil (<0,25;2) + 2.3033 × Saturation of adsorption capacity (mmol+/100g) topsoil 2018.
The statistical characteristics of the regression are as follows: R = 0.9053, R2 = 0.8195, MEP = 12003.1472, AIC = 976.6503. The model is significant according to the Fisher-Snedecor model significance test (F = 74.6373, quantile F = 2.0901, p = 8.55465E−40). The model is correct according to Scott’s criterion of multicollinearity (SC = 0.1137). Residues show heteroskedasticity (Cook-Weisberg heteroskedasticity test). Residues have a normal distribution (Jarque-Berr normality test). Residues are negatively autocorrelated (Durbin-Watson autocorrelation test). There is no trend in residues (Signed residue test); see Supplementary Materials (Table S8; Figure S5).

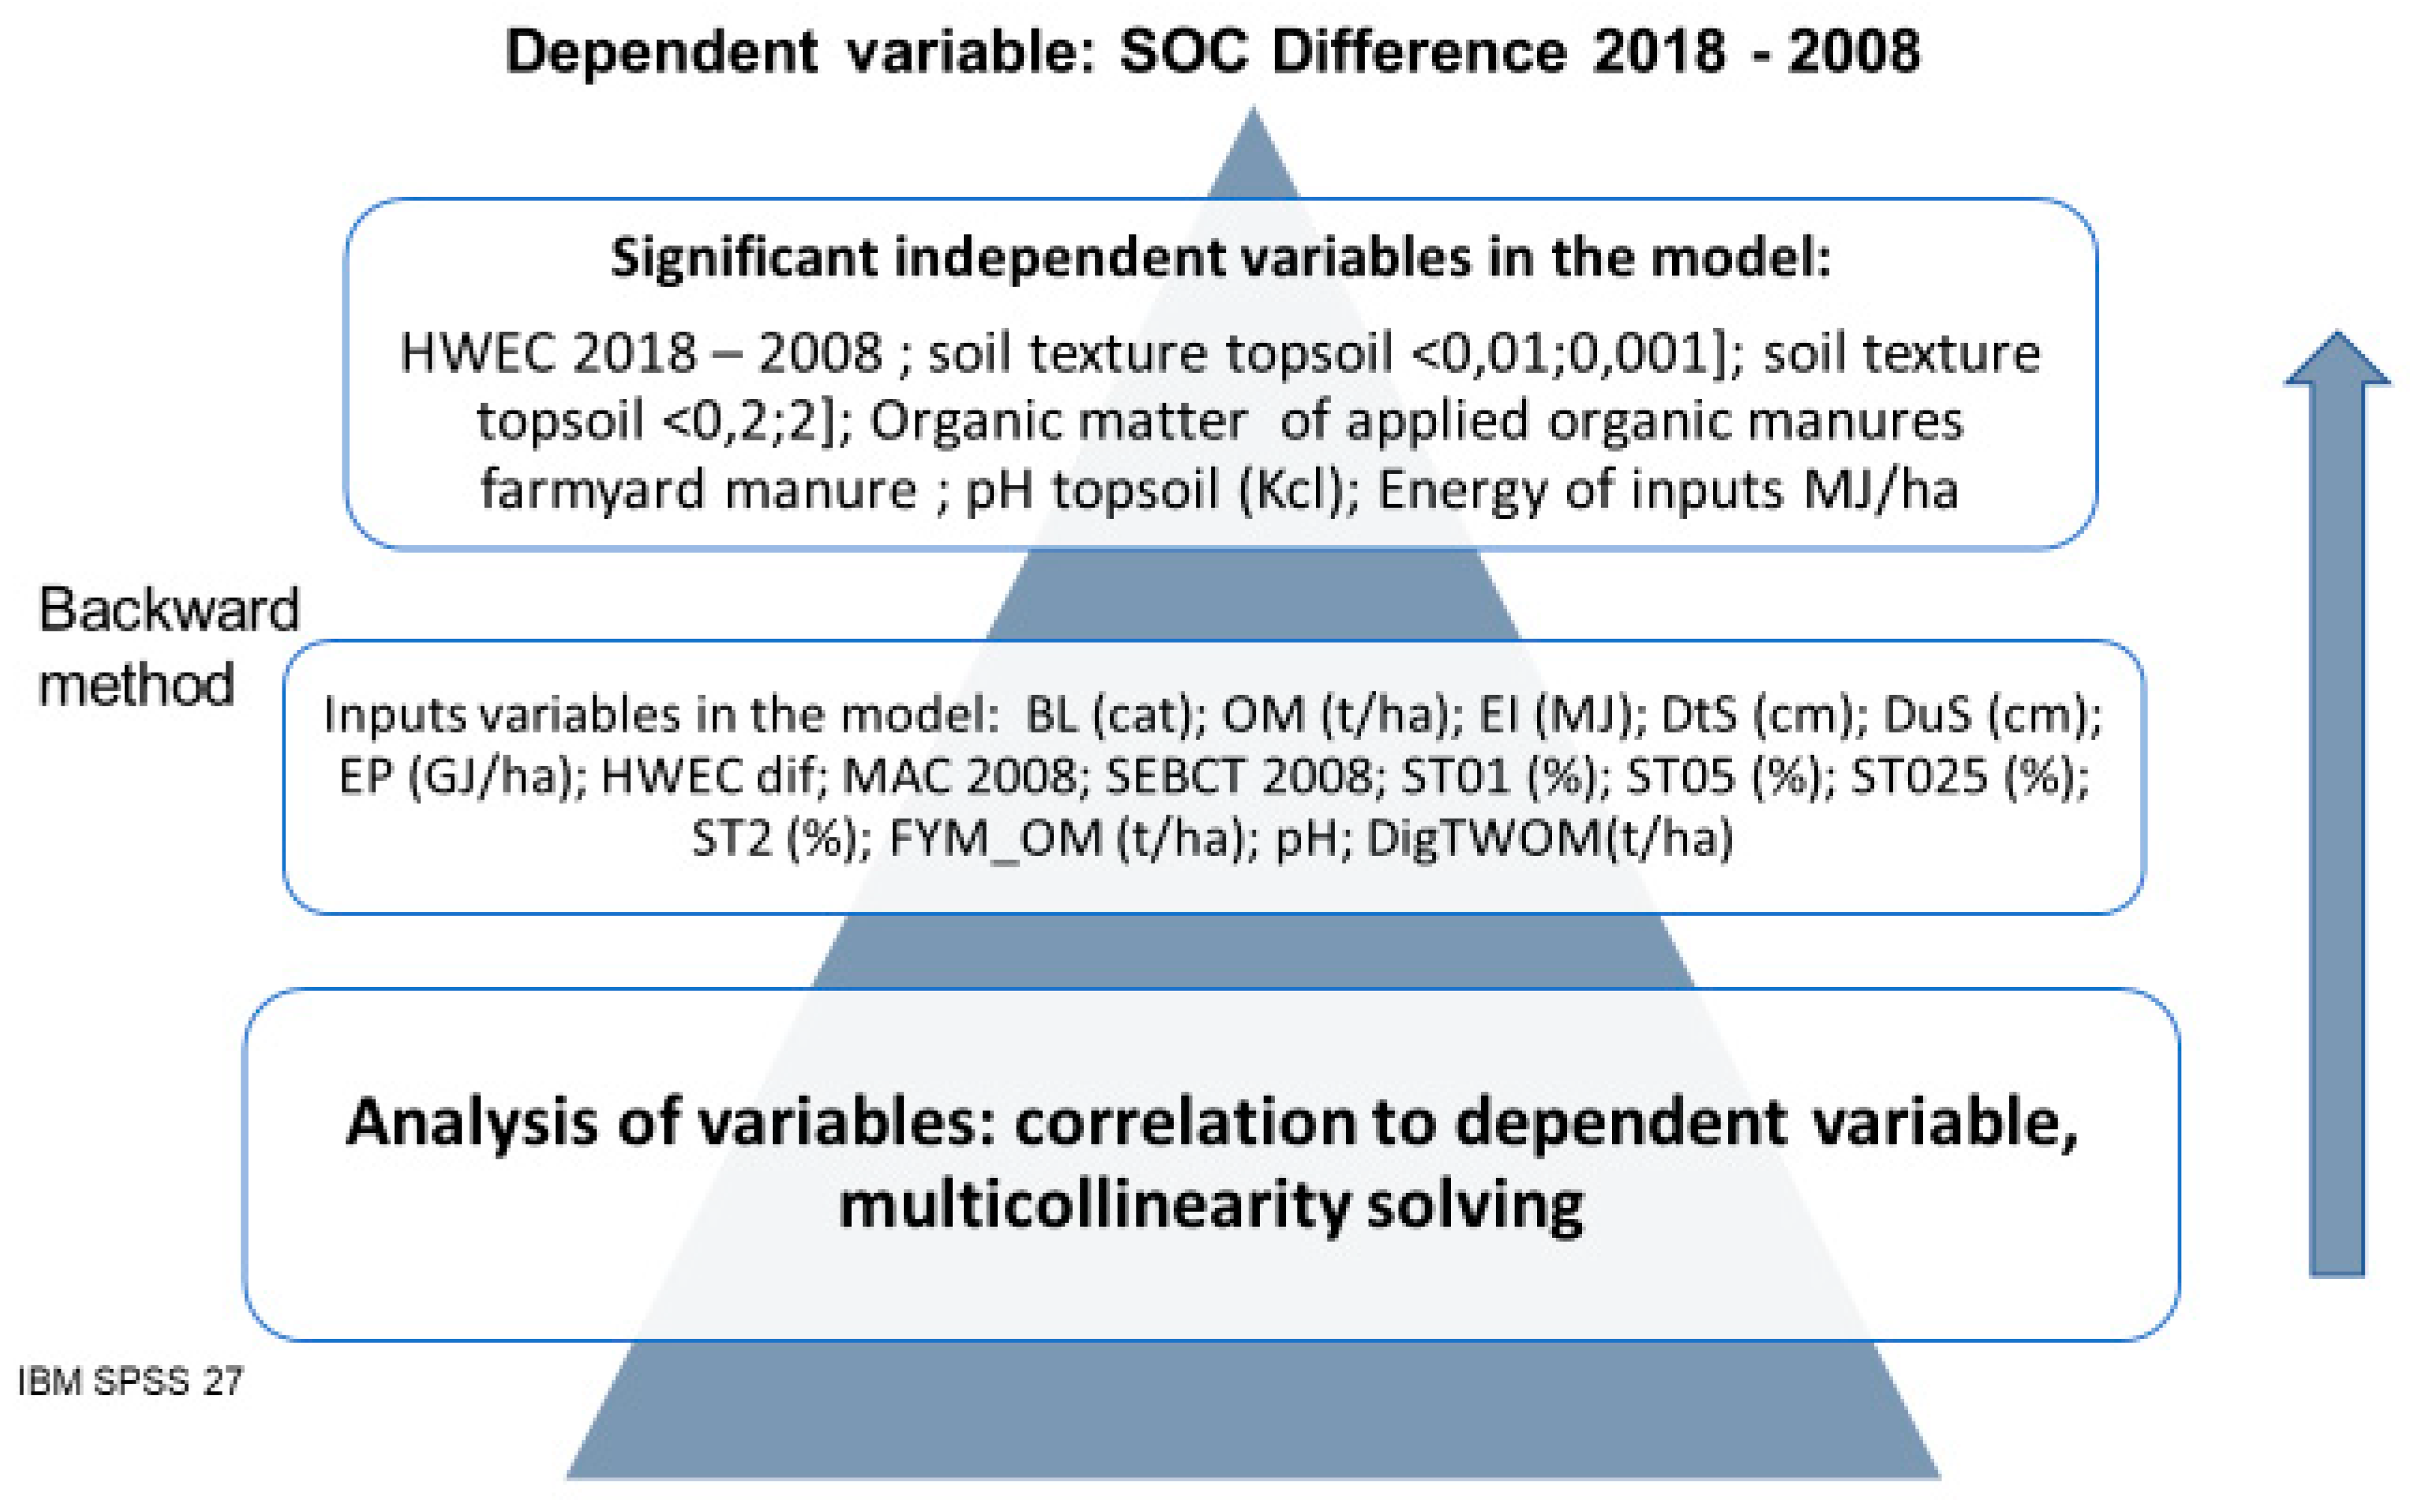
3.3.3. Model 3: SOC Difference between the Years 2018 and 2008

A multidimensional linear regression model for the dependence of the SOC Difference (HD) between the years 2008 and 2018 was developed (SOC content was calculated as SOC * 1,721088). The model was developed based on the scheme shown in Figure 7. The final model (there were a total of 10 models) for the HD reached the coefficient of determination R2 = 0.3910, with a Durbin-Watson value of 2.2630. The results of the final model are shown in Supplementary Materials (Table S9). The collinearity statistics showed a value slightly over 1, proving mutually independent data.
The refined model has the equation:
SOC Difference 2018–2008 = 1.2494 + 0.0003 × Difference HWEC −0.0122 × ST01%−0.0138 × ST2 (%) + 0.0091 × FYM_OM (t / ha) −0.0676 × pH (KCl) −3.68E-07 × ENPKB (MJ ha−1) −0.0053 × SSD (cm) (Table S7).
The statistical characteristics of the regression are as follows: R = 0.9295, R2 = 0.8639, MEP = 0.0361, AIC = −288.5250. The model is significant according to the Fisher-Snedecor model significance test (F = 45.3747, quantile F = 2.1992, p = 1.71E-19). The model is correct according to Scott’s criterion of multicollinearity (SC = −0.0471). Residues show heteroskedasticity (Cook-Weisberg heteroskedasticity test). Residues do have a normal distribution (Jarque-Berr normality test). Residues are negatively autocorrelated (Durbin-Watson autocorrelation test). There is no trend in residues (Signed residue test); see Supplementary Materials (Table S10; Figure S6).

3.3.4. Model 1–3: Summary

HWEC as an indicator influencing the current soil fertility is a very important characteristic for the development of SOC content in the soil.
HWEC is affected both by the environment with a direct impact on its absolute value and by other indicators that affect its change over time. According to the regression analysis (see Figure 8), the absolute fertility of the soil is mainly influenced by the phosphorus content, as an initiator of soil biological activity (−30%), and acts in the opposite direction to the digestate dose (+29%). The HWEC content is also positively affected by SEBCT, which affects its size by about 21%, as well as the N dose (−20%). Together, these components form a balanced level of positive and negative influences. The predominant development of HWEC is given by other parameters (see Figure 8). Digestate has a positive effect on the HWEC content in the longer term, but to a lesser extent (15%). Saturation of adsorption capacity (37%) has a similar positive effect. The components influencing the biological development, i.e., the potassium dose (−7%), the soil pH (−14%) and especially the overall soil condition (−27%), have a negative effect, causing the HWEC decomposition.
The humus (SOC) is affected by the HWEC increase (17%)—the organic matter from the HWEC (a labile form of C) has been transformed into the SOC (a stable form of C); see Figure 9.
The digestate has a positive effect on the SOC content, but only if a sufficient amount of organic matter in the form of manure is applied. If a small amount of organic matter in the form of manure is applied, the SOC content decreases significantly. This is also confirmed by the construction of a regression model, in which the digestate was removed from the model in the penultimate step—an insignificant variable. Subsequently, a more accurate model confirmed this. The SOC content is further positively stimulated by soil texture (0.01–0.001 mm) (10%) and more strongly by soil texture (0.25–2.00 mm) (−21%). Larger particles (0.25–2.00 mm) affect the SOC content more significantly than the content of fine particles. The input of organic matter and nutrients from animal production (10%) is also significantly promoted in the results. Regular fertilisation in the soil creates a better environment for the decomposition of organic matter. Consequently, soils of lower quality contain more undecomposed organic matter. This points to the trend of increasing total organic matter content after amending soil with organic manure, which is mainly given by increasing HWEC in the soil. The intensification of agricultural production is also connected with a high dosage of fertilisers and the accelerating of biological processes in the soils (−14%). On the other hand, there was observed a decrease in pH (see Figure 3) and in the saturation of the soil sorption complex (SEBCT), see Figure 3. This was due to the replacement of basic cations with hydrogen ions (H+) and Al3+. The application of digestate gave also a significant contribution to soil acidification (Figure 3). The soil depth (topsoil and subsoil) was significant in the fertile soils of the agriculturally intensive areas, which are typical by a high biological activity (−11%).

4. Discussion

Due to the currently changing environmental conditions, we can expect a significant change in the agroecosystems. These changes will be subsequently reflected in human society, landscape and environment, including the soils [63,64,65,66]. Changing environmental conditions in the different parts of the world (including Europe) currently brings considerable uncertainty to the variability of the environment and the soil-plant-atmosphere system [67]. Because most of the agricultural soils lose the SOM the great emphasis must be given to all measures of the SOM increasing [68]. It should be stressed that SOM has a major impact on the proper functioning of the soil agroecosystem, including soil quality and health [69].
Our results from 68 localities proved that the application of farmyard manure (FYM) maintains or even increases the SOC and HWEC pools (see Section 3.3.). These findings are in agreement with similar studies focused on the effect of FYM on soil quality (the SOC and SOM content) [66,70,71,72].
Several long-term experiments in Europe showed that the speed of the SOC sequestration is higher if organic manures (FYM) are applying regularly [73]. The effect of organic manures indicated a 10% increase in the topsoil layer in the last 100 years in Denmark [74], a 22% increase in the last 90 years in Germany [73] and a 100% increase in the last 144 years in the United Kingdom [75]. A favourable dosage according to [76] is about 10 t ha−1 of organic manure to arable land in Europe, which could increase the SOC stock by 5.5% in 100 years. Similar results are reported by [11] and the significant influence of the long-term application of FYM and NPK on soil quality parameters (pH, SOC content, fractionation of humic substances and nutrient status) is stressed. They also showed that the application of the FYM together with the mineral fertilisers significantly increased soil fertility (SOC and nutrients content), decreased soil acidity and ensured stable production. Regular application of organic manures can achieve long-stable yields while maintaining soil quality/health [11,77]. The effect of the type tillage affects the SOC content [78,79,80]. The influence of tillage technology (ploughing/no-till) affects the absolute value of SOC in the soil when due to aeration of the soil during ploughing, its accelerated oxidation/loss occurs. Due to the management of land with the same management of companies, the effect of tillage on the SOC content between 2008 and 2018 did not manifest itself.
All of the studied experimental farms were running by the biogas stations. Produced digestate is considered an organic fertiliser in the Czech Republic. The high development of biogas stations in the Czech Republic is unprecedented. In 2019, a total of 302 installed MW of agricultural biogas plants were in operation with yearly inputs of 1 814 thousand dry matter tons of fodder crops. As mentioned above, a major problem of Czech agriculture is also the disruption of crop rotation systems, and a significant reduction of animal husbandry and thus the sources of organic manures, which have an irreplaceable role in soil care and are partially replaced by the composts. The Ministry of Agriculture solves the disruption between animal and crop production as one of the main problems. The application of organic manures and straw represents the possible ways to add organic matter to the soil. Digestates contain many valuable nutrients, such as N, P and K [26]. As the main aim of the biogas stations is producing the biogas, consisting mainly of methane, the C content is not a strong side of the digestate when compared with compost and organic manures [81,82]. As it was shown, the application of digestate can positively affect the SOM and SOC content only if a sufficient amount of organic manures is applied. Without other organic manures, or the amount of applied manures contribution of digestate is low, and the SOC content decreases significantly in the long-term period (see Section 3.3., Model 3). In comparison with organic manures, the long-term field trials have not yet shown any negative impacts of digestate on the SOC content [26,83]. The long-term effects of digestate on the environment, soil and human health have been still studied [29]. Maintaining an adequate level of SOC content during long-term application of digestate requires the supply of additional sources of organic C, which should come from post-harvest residues, including straw, as was also published by [26,84]. They studied the effect of different organic manures, digestate, digestate+straw and NPK on the SOM, N content and content of available nutrients, and they did not reveal any significant differences in the analysed parameters. However, this study was a short-term experiment and the long-term effect was not observed. A decrease of SOC in PGs under intensive permanent grassland (with four cuts per year) after digestate application was reported by [85]. PGs generally have higher SOC or SOM contents to compared with arable land.
The regression model analysis of the dependences of the soil SOC development in the field conditions clarifies the basic soil properties as the most important factor. The available humus content models refer mainly to the SOC and soil total nitrogen (STN) assessments [86,87,88], and the time of sampling [89]. Malkina-Pykh [90] investigated the behaviour of humus in the Sod-Podzolic soils. Her evaluation included various fertiliser treatments, including irrigation, but the results do not show the resulting regression model [91]. De Willigen [92] investigated various models of humus behaviour over a longer period, but only based on organic input materials. Other models involve predictions of organic matter behaviour rather than their statistical dependence on a complex environment [2]. The achieved model of humus content development clarifies the role of soil texture in humus formation, which is the most important in terms of the significance of the obtained model and reduces soil humus growth, as well as soil input energy in mineral fertilisers, soil pH and soil depth. Depth of soil can signal cultivated soils with high production capacity, in which there is a rapid loss of humus. The role of tillage was not demonstrated in the model and the variable with the indication of ploughing was excluded from the model due to great insignificance. The achieved model is processed for several soil types (Albic Luvisol, Luvisol, Fluvisol, Cambisol, Chernozem, Planosol). Obtained results are stable in this respect (Section 3.3.). The significance of the model lies primarily in taking into account the possible development of humus (SOC) in individual soil conditions and depending on soil management (soil fertilization, organic fertiliser supply and ensuring a constant cycle of organic matter in the soil.
The main contribution of the article lies in the evaluation of the soil environmental and agrotechnical processes in field conditions. The effect of organic and mineral fertilisers and digestate application on SOM status and HWEC was documented using multidimensional linear regression (MLR). The importance of organic fertilisers application, especially livestock, together with digestate is stressed. The SOM stock, according to our results, is affected by the soil type, soil properties such as texture (a grain content up to 0.01 mm and up to 2 mm), pH and the soil depth. Therefore, for future stable yields, it is crucial to maintain or increase the content of SOM in agricultural soils. In this way, soils are protected from deterioration and can fulfil their main functions in the environment [69,93,94]. A better understanding of the SOM biogeochemistry needs multidisciplinary cooperation (the study of dynamic processes, multicriteria evaluation, multidimensional linear or nonlinear statistical recession models, etc.) because it is necessary to know how the system is functioning under the currently changing climate [21,95].

5. Conclusions

The content of SOC has a major impact on the whole condition and productivity of the soil. Our comprehensive study has evaluated the status and changes of SOC (stable form C) and HWEC (labile form C) during 2008–2018. The relationship between soil physico-chemical properties (pH, sorption complex, physical properties of the soil, etc.) and management practices (application of manure, digestate and mineral NPK fertilisers, management of post-harvest residues, etc.) is documented. The modern statistical procedures (MLR) were used for modelling. A total of 68 sites in different soil-climatic conditions (soil types: Chernozem, Luvisol, Cambisol, Fluvisol, etc.; climatic regions 2, 3, 5, 6 and 7) of the Czech Republic were compared.
The results showed:
-
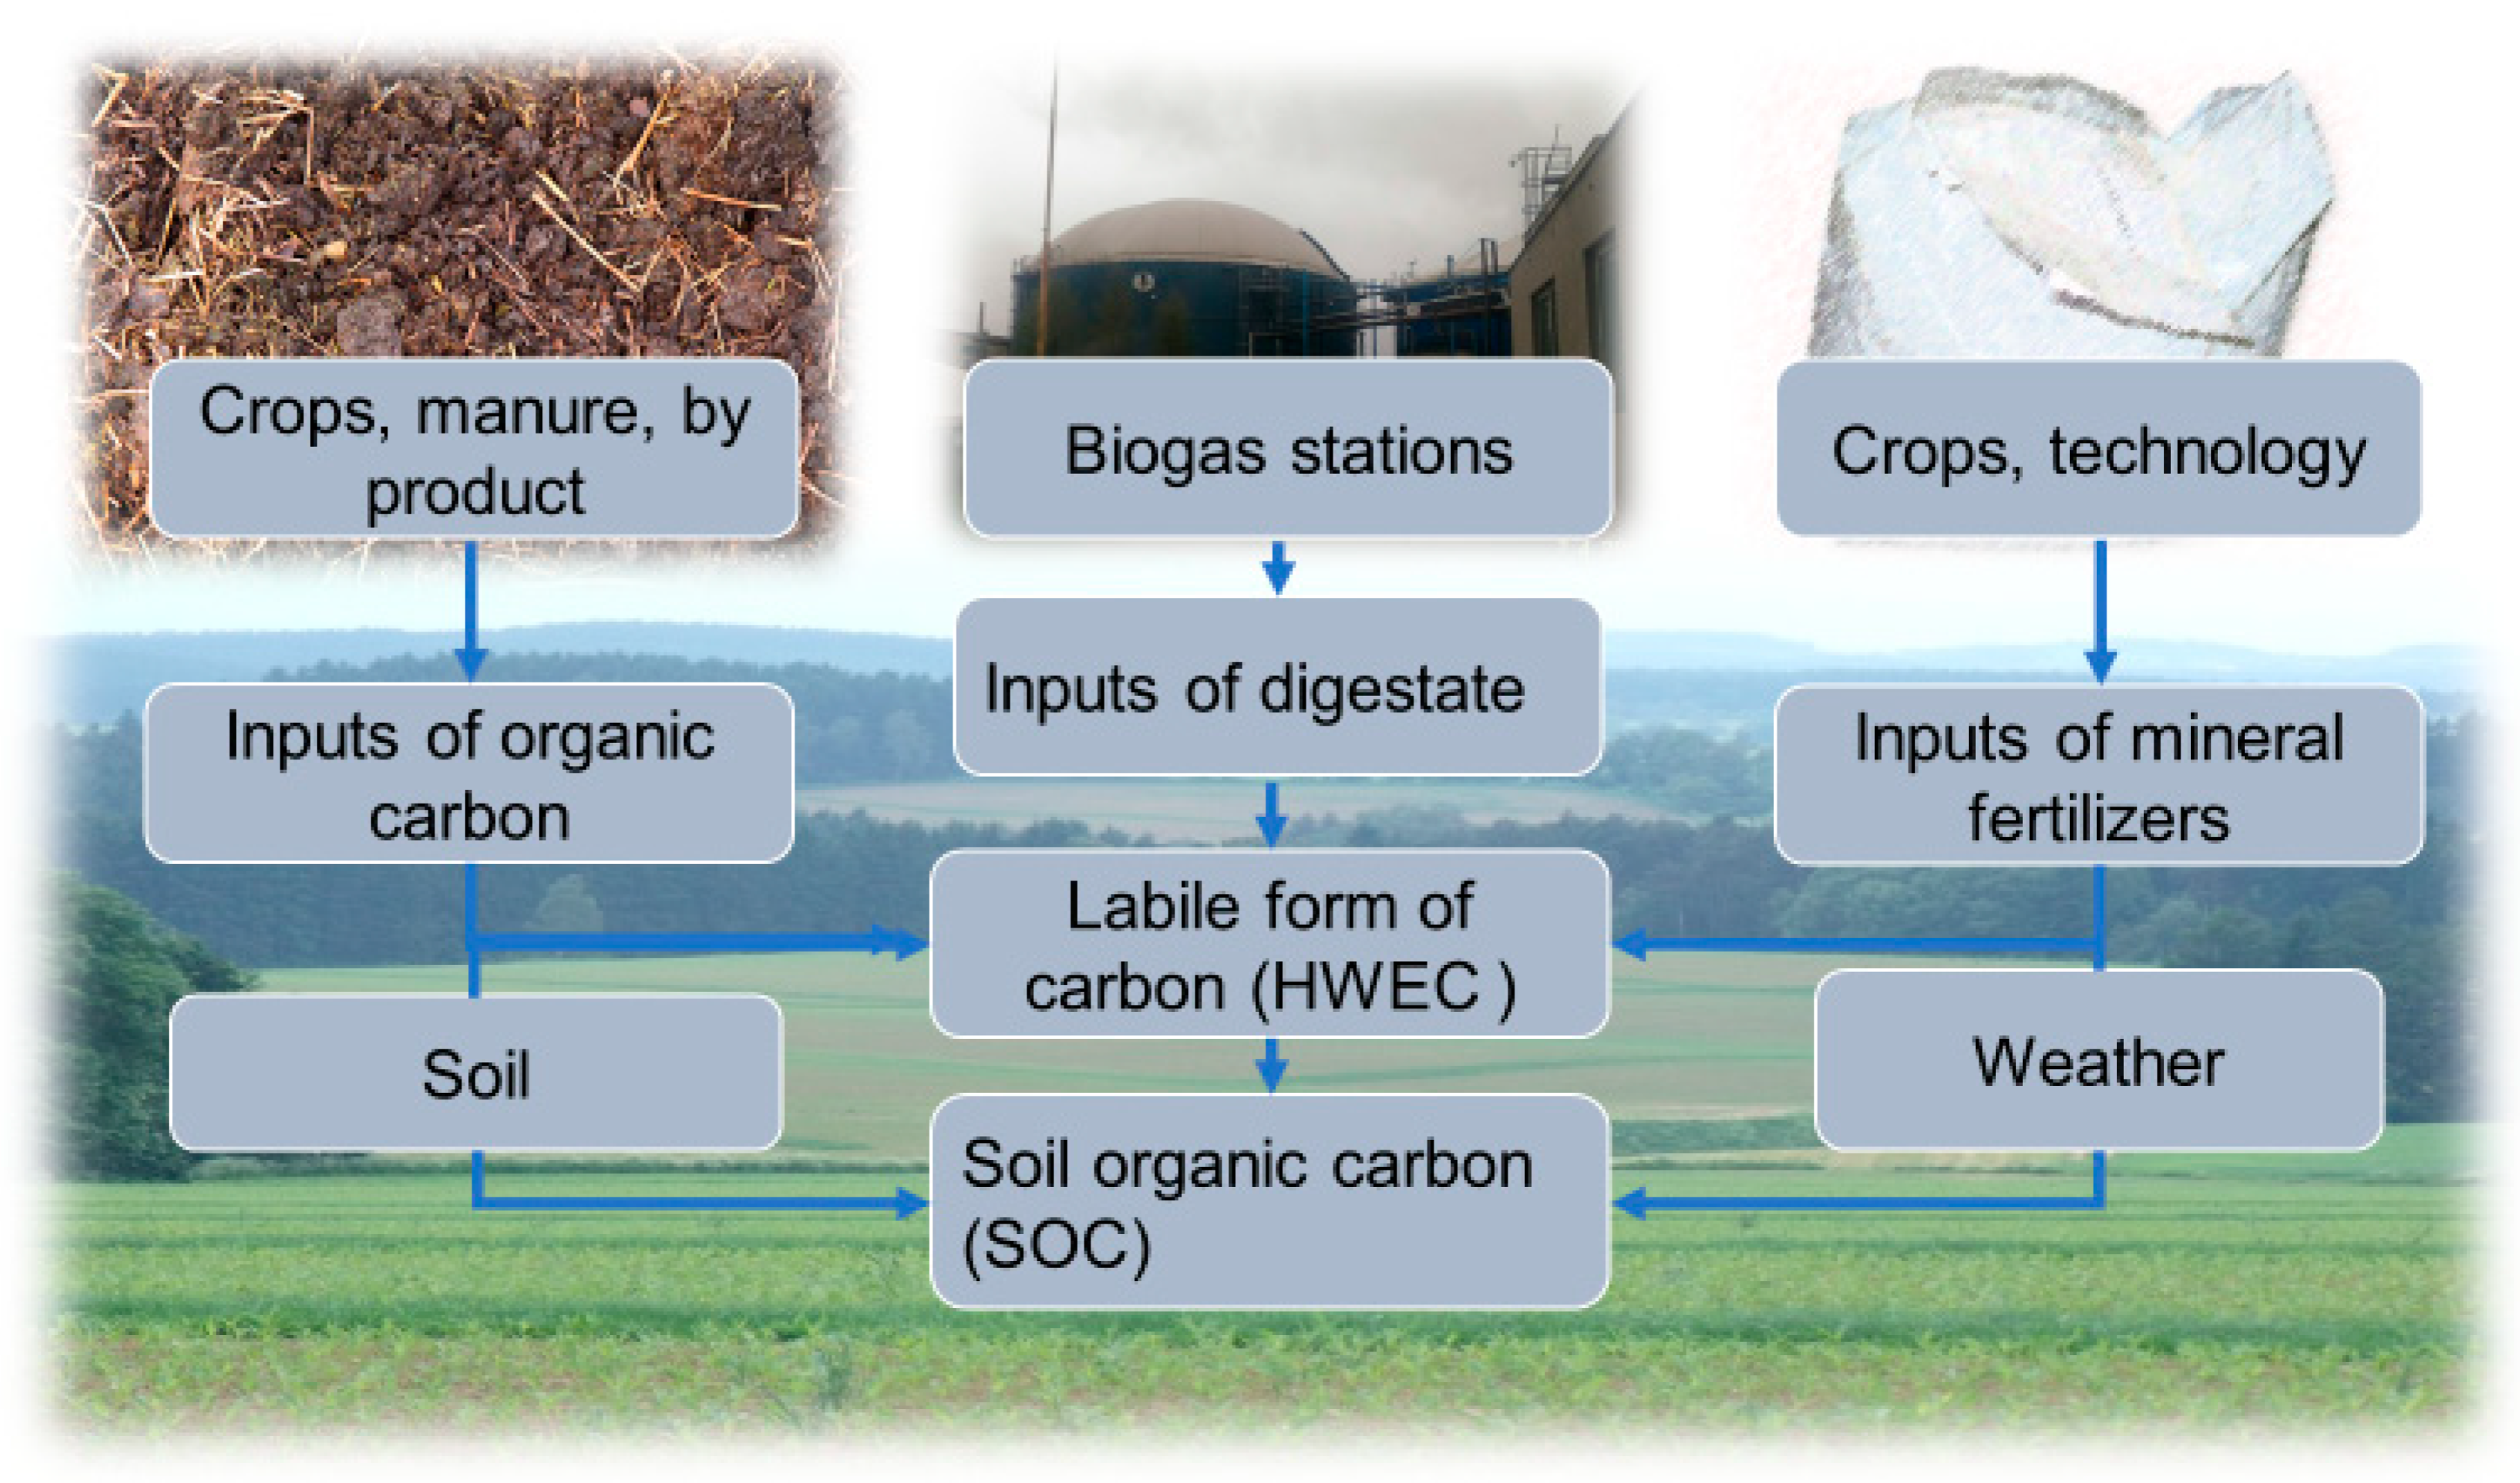
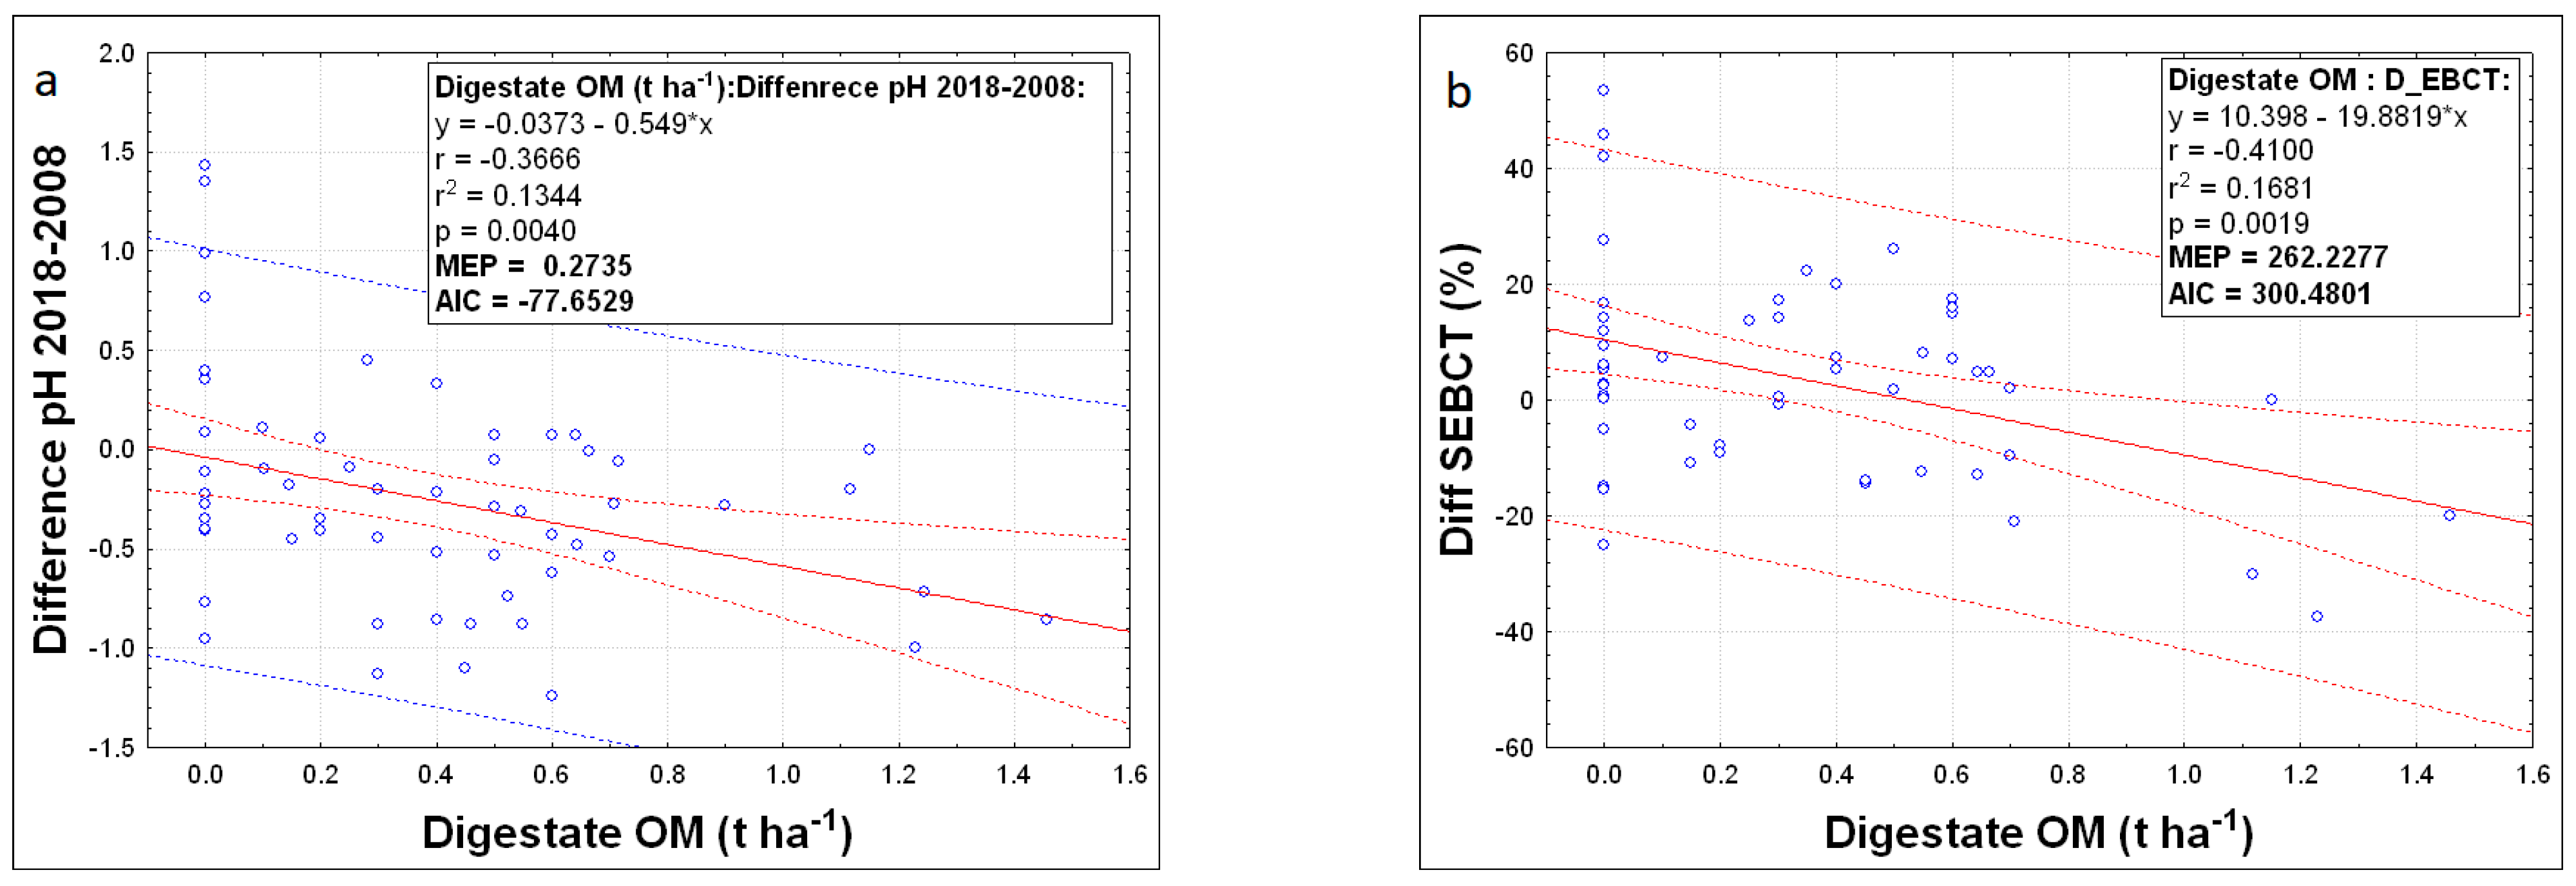
At all monitored experimental sites in the period 2008–2018, both average SOC content and the HWEC content increased. Similarly to our results, other authors [96,97] quoted that this depends on agricultural management, fertilising, tillage system, crop rotation system and plant residues input, etc. The SOC increase may be achieved also by the combination of organic and mineral fertilisers application [11,77]. Our research also showed that organic fertilising and texture (increasing of ST01 and ST2 particles) lead to SOC and HWEC increase. On the other hand, SOC stocks decreased with soil depth, pH decline and increase of NPK. The decrease in pH and saturation of the sorption complex (SEBCT) was due to the application of digestate. This is true across soil-climatic conditions—intensification of agricultural production increases biological processes in the soil, mainly due to fertilisation with mineral fertilisers. On the other hand, there is a decrease in pH (see Figure 1) and saturation of sorption complex (SEBCT), and the application of digestate also contributes to this (Figure 7 and Figure 8).
-
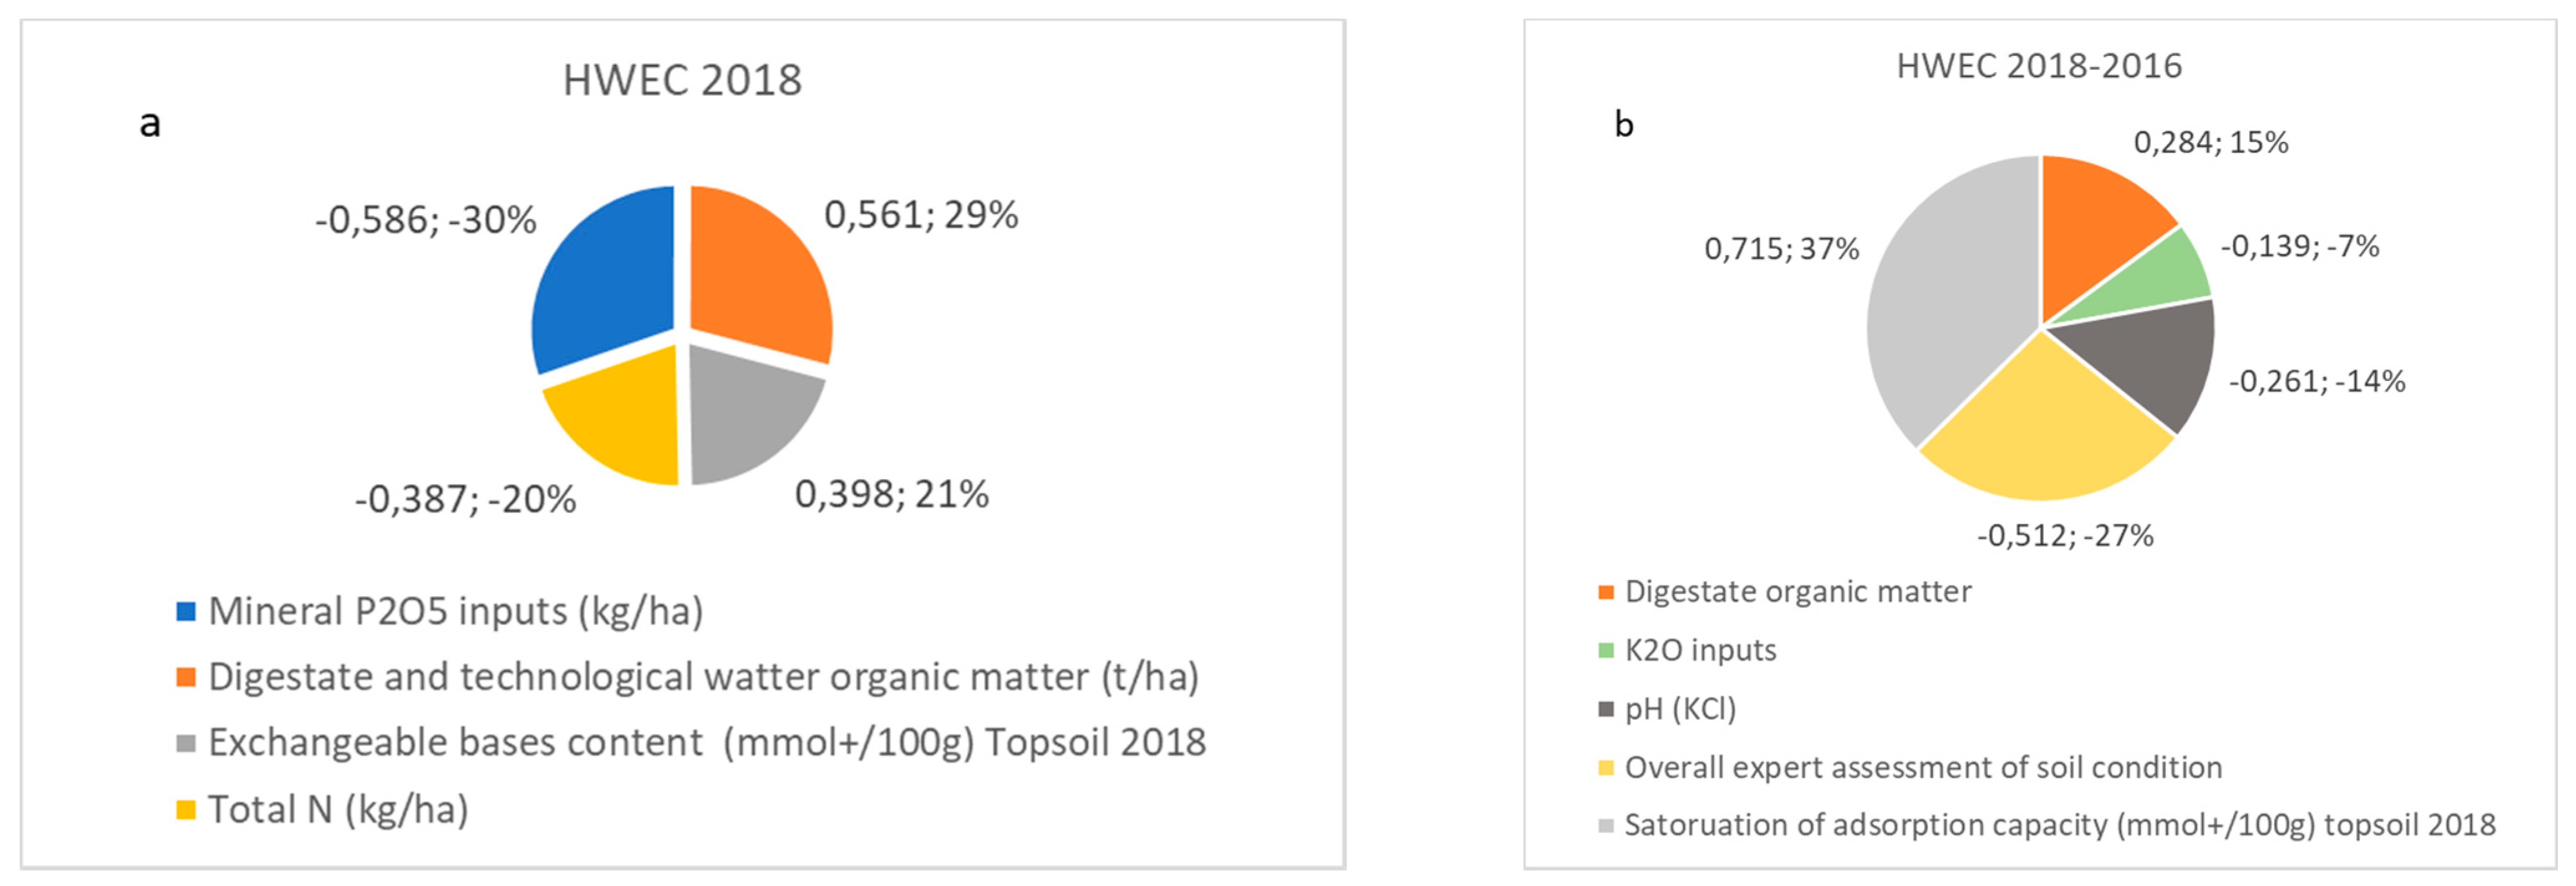
HWEC is significantly affected by phosphorus content (−30%), digestate application (+29%), SEBCT (21%) and the dose of total applied N to the soil (−20%). In the middle term, the HWEC content in the soil is affected by the application of digestate (15%), and the saturation of adsorption capacity (37%). The application of mineral potassium (−7%), soil pH (−14%) and the overall condition of the soil (−27%) have a negative effect (Section 3.3.); SOC changes occur over a longer time horizon (more than 5 to 10 years). It is clear from the HWEC production models that digestate is gaining ground in the short term (29%), its influence is weakening in the medium term (15%) and is no longer enforced in the model in the ten-year cycle. In the short term, the effect of phosphorus (P2O5) fertilisation on HWEC (−30%) and nitrogen (N) (−20%), which support biological activity in the soil, is evident. The effect of mineral fertilisation is also negatively reflected in the change of SOC, the aggregate indicator of energy of mineral fertilisation (NPK) together with plant residues.
-
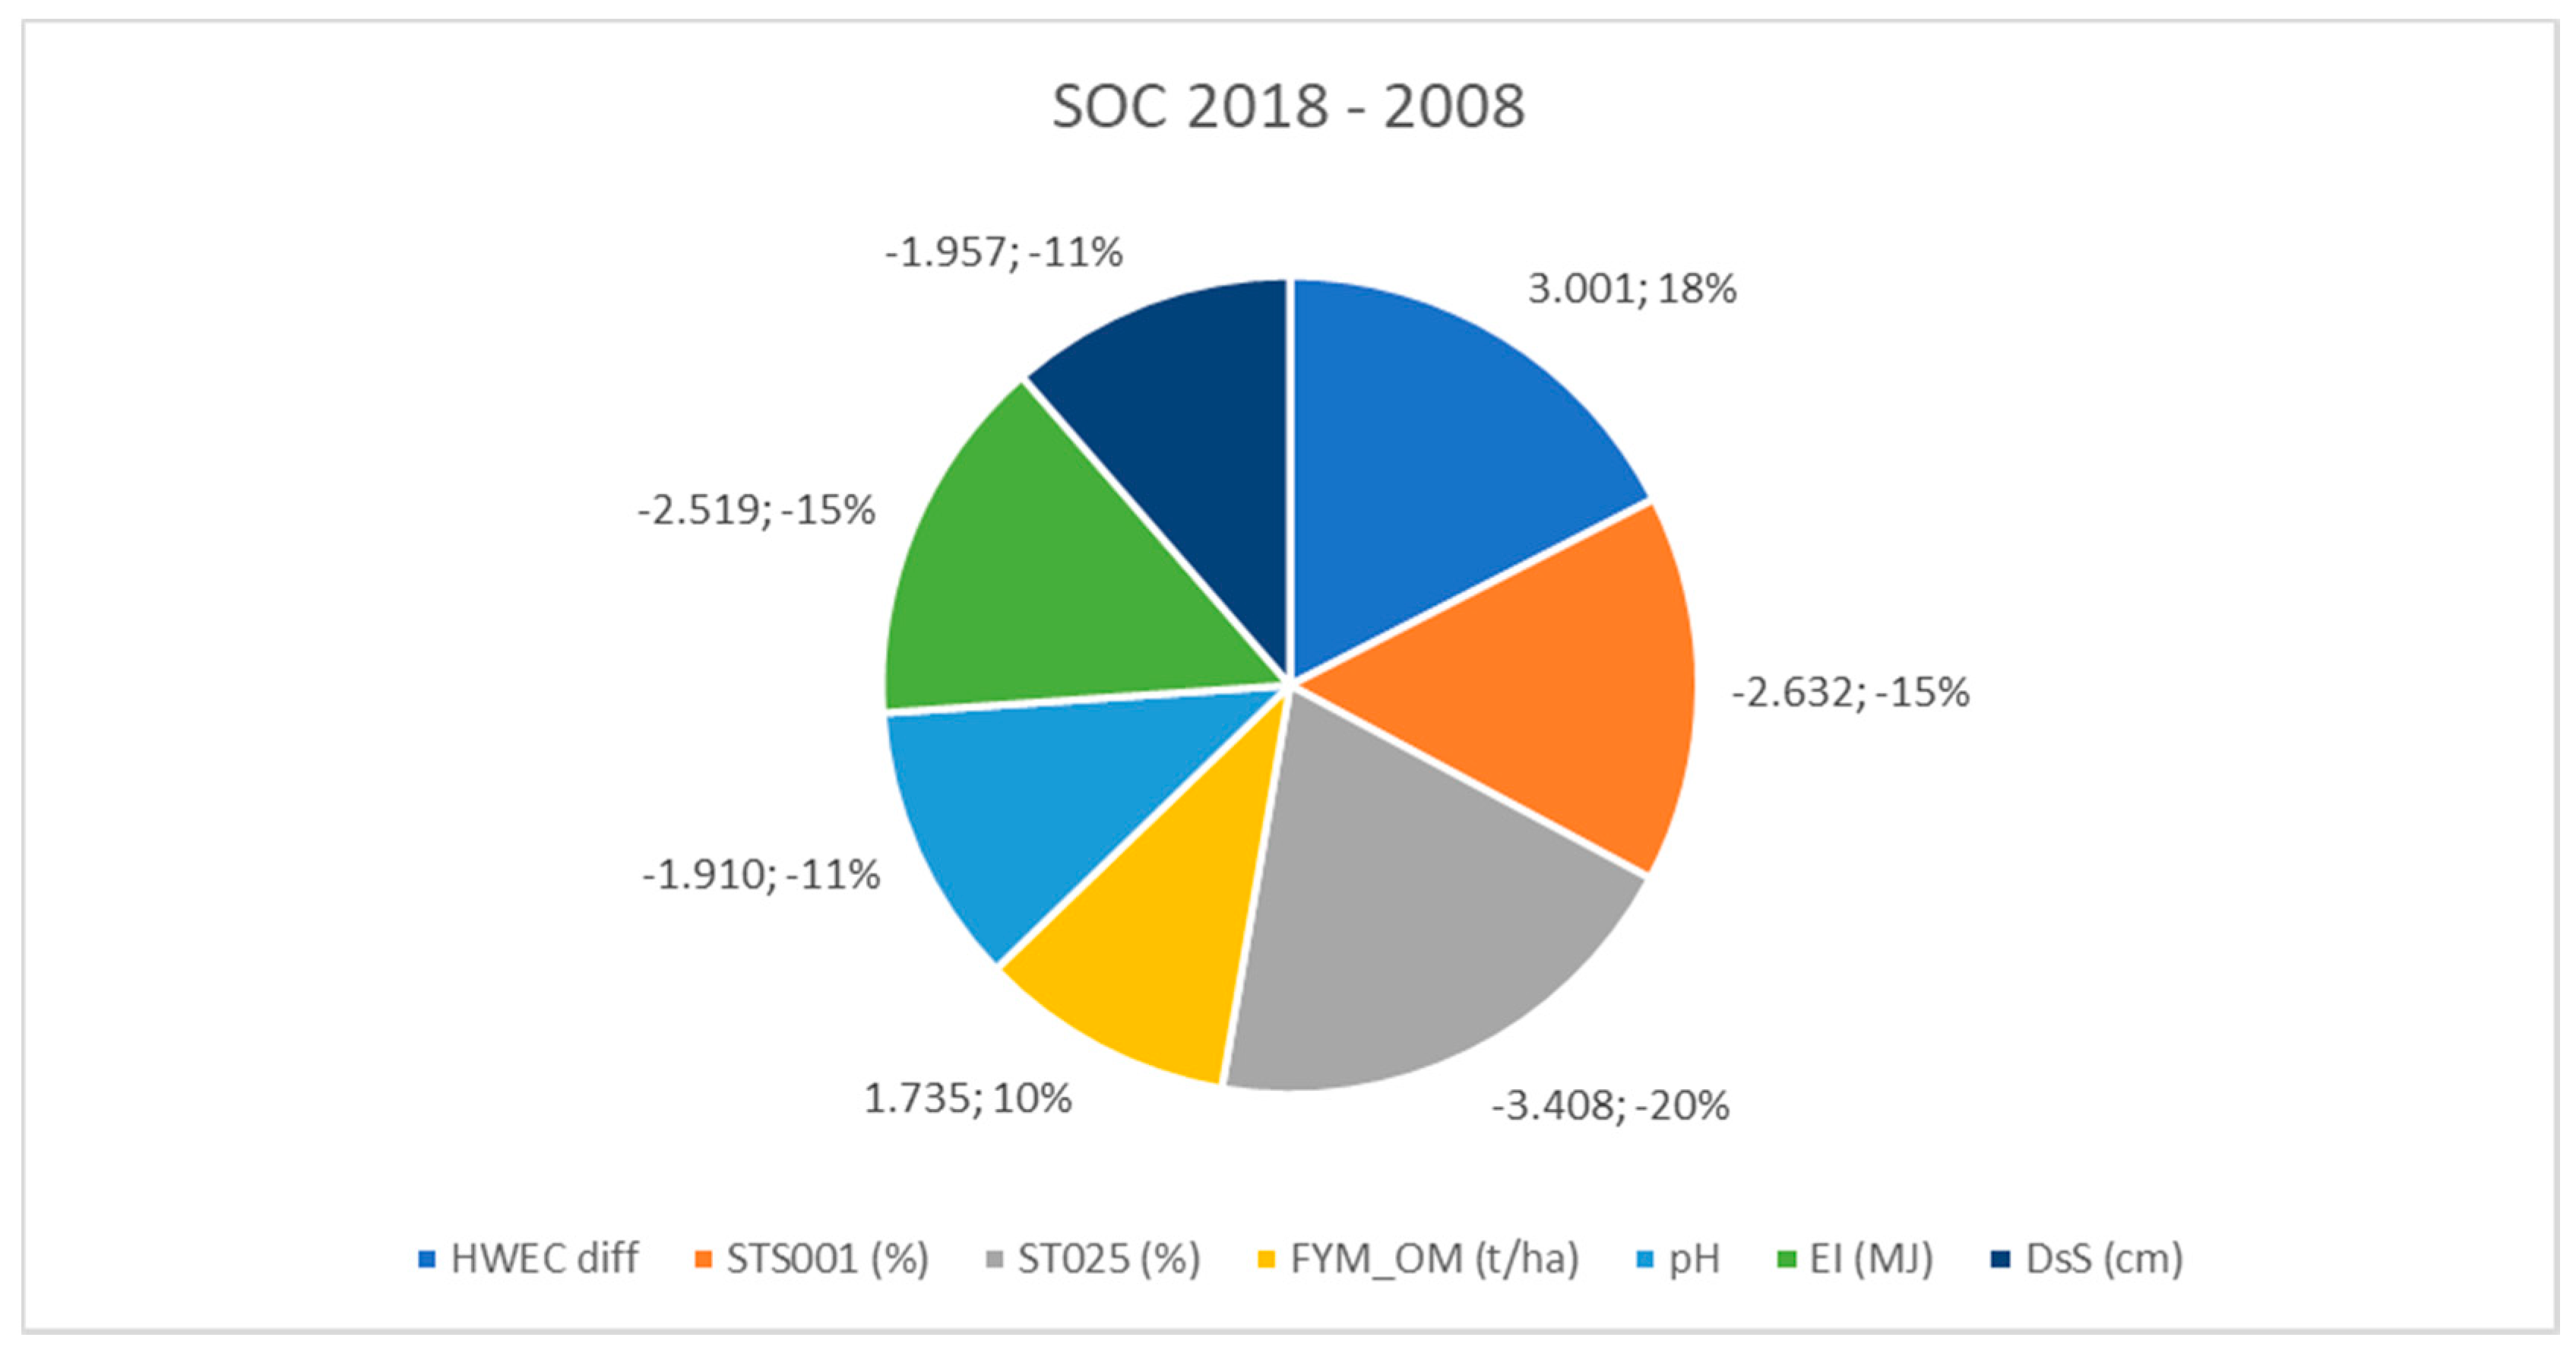
SOC (humus, the stable component of SOC) is affected by the HWEC content (18%). Organic matter from HWEC ( the labile form of C) was transformed into stable SOC. It is also affected by soil texture 0.01–0.001 mm (15%), and the input of organic matter and nutrients from animal production (10%). Mineral fertilisation (−15%), soil depth in the subsoil (−11%) and soil texture 0.25–2 mm (−20%) have a negative effect (Section 3.3.).
-
By application of farmyard manure, we maintain or increase the content of SOC and HWEC in the soil. Digestate can positively influence the SOC content, but only if a sufficient amount of organic matter is co-applied, for example in the form of manure. If the organic matter in the co-applied organic manures is applied in an insufficient amount, the humus content in the soil decreases significantly. This was also confirmed by the regression model Humus Difference between the years 2018 and 2008 when the digestate was removed from the model in the penultimate step as an insignificant variable.
-
The results confirmed the importance of monitoring both the stable (SOC) and labile (HWCE) components of SOM in relationship to the physicochemical and biological properties of the soil, but also in a relationship with the soil management systems. Regular fertilising with organic manure and fertilisers creates better environmental conditions for soil biota. SOM decomposition accelerates and as a result, low-quality soils have more undecomposed materials; consequently, HWEC and SOM content increases (statistically significant). Maintaining and improving soil physical, biochemical and biological properties (maintaining or increasing SOM content) is important for maintaining high productivity and food security.
-
Several authors reported a decrease in SOM content in the case of ploughing [98,99]. We concluded that soil tillage is not the only factor influencing the SOC stocks. Similarly, it was shown [100] that, without external organic matter input, usually SOC stocks declined and no good agricultural practices can be achieved. Therefore, it is recommended to combine occasional tillage and no-tillage systems in agricultural practice. Menšík et al. [11,77] confirmed that ploughing with a combination of farmyard manure can even increase the SOC stocks over a longer period. No statistically significant relationship between tillage and SOC stocks (difference of SOC) was determined in the studied fields with the stable farming systems (see Model 3).

Supplementary Materials

The following are available online at https://www.mdpi.com/article/10.3390/agronomy11040779/s1 Scheme S1: Description of the test plots. Table S1: Average values of SOC according to the type of soil. Table S2: The organic inputs to the soil as a by-product and organic matter of organic fertilisers and digestate. Table S3: Mean values of the soil chemical, physical and biological properties. Table S4: Mean values of the crops. Table S5: Multidimensional linear regression model for HWEC content (the year 2018). Table S6: Refined multidimensional linear regression model for HWEC in 2018. Table S7: Multidimensional linear regression model for HWEC difference (period 2018–2008). Table S8: Refined multidimensional linear regression model for HWEC Difference (period 2018–2008). Table S9: The multidimensional linear regression model for the model SOC Difference between the years 2018 and 2008. Table S10: Refined multidimensional linear regression model for the dependence of the model SOC Difference between the years 2018 and 2008. Figure S1: The average soil texture (%) according to the soil type (2008–2018). Figure S2: Average input of N (total and mineral) into the soil in fertilisers for the period 2008–2018 and individual soil types. Figure S3: Average input of P and K (total and mineral) into the soil in fertilisers for the period 2008–2018 and individual soil types. Figure S4: The residual analysis for multidimensional linear regression model by (a) L-R plot, (b) Pregibon, (c) Jackknife residues and (d) predicted residues after data filtering. The HWEC soil content in 2018 model. Figure S5: The residual analysis for multidimensional linear regression model by (a) L-R plot, (b) Pregibon, (c) Jackknife residues and (d) predicted residues after data filtering (the HWEC difference 2008–2018). Figure S6: The residual analysis for multidimensional linear regression model by (a) L-R plot, (b) Pregibon, (c) Jackknife residues and (d) predicted residues after data filtering (Model: SOC Difference between the years 2018 and 2008). Text S1: Expert assessment of the level of soil care for land monitored.

Author Contributions

Conceptualization, V.V. and E.P.; methodology, V.V., E.P., L.M. and L.P.; software, V.V. and L.M.; formal analysis, V.V. and E.P.; investigation, V.V., E.P., L.M., L.H., M.H. and L.P.; resources, V.V. and L.M.; writing—original draft preparation, V.V. and L.M.; writing—review and editing, V.V., E.P., L.M., L.H., M.H. and L.P.; visualization, V.V. and L.M.; supervision, V.V; project administration, V.V., funding acquisition, V.V. and L.M. All authors have read and agreed to the published version of the manuscript.

Funding

The study was created thanks to the support of the Czech National Agency for Agricultural Research—project no QK1710307, QK21010124 and research plan of the Ministry of Agriculture of the Czech Republic—RO0418.

Institutional Review Board Statement

Not applicable.

Informed Consent Statement

Not applicable.

Data Availability Statement

Data sharing not applicable.

Acknowledgments

The paper was elaborated in the framework of the project of MoA QK1710307 “Economic support for strategic and decision-making processes at national and regional level leading to the optimal use of renewable energy sources, especially biomass while respecting food self-sufficiency and soil protection”. The authors acknowledge the support of the projects.

Conflicts of Interest

The authors declare no conflict of interest.

Abbrevations

Variable and abbreviation.
VariableAbbreviation
Soil texture topsoil <0,001STS001 (%)
Soil texture topsoil <0,01;0,001]ST01 (%)
Soil texture topsoil <0,05;0,01]ST05 (%)
Soil texture topsoil <0,25;0,05]ST025 (%)
Soil texture topsoil <0,2;2]ST2 (%)
Biological life in soil BL (cat)
Organic matter total OM (t/ha)
Overall expert assessment of soil conditionEASC (-)
Digestate organic matterDigOM (t/ha)
Digestate and technological watter organic matterDigTWOM(t/ha)
Energy of inputs EI (MJ)
Depth of the topsoil DtS (cm)
Depth of soil Depth (cm)
Depth of the subsoil DsS (cm)
Humus content(%)
K2O inputsK2O kg/ha
Coefficient of stoninessStCoef
Coefficient of slopeSlCoef
Soil texture topsoil spread <0,001, powerSTR 0,01^2
Soil texture topsoil spread <0,01;0,001] powerSTR UnS 0,01^2
Soil texture topsoil <0,001, powerSTS001 (%)^2
Soil texture topsoil <0,001, powerSTR 0,01^2
Mineral N N (kg/ha)
AltitudeA
Total NN total (kg/ha)
Organic matter totalOMT (kg/ha)
Organic matter of green manureOMGM (kg/ha)
Organic matter of byproductOMBP (kg/ha)
Organic matter of animal originFYM_OM (t/ha)
Organic matter of by-products and green manureOMBPGM (kg/ha)
Soil organic carbonSOC
Mineral P2O5 dosage P2O5 (kg/ha)
pH (KCl)pH
Number of Years before 2018, 2018 = 1NY
HWEC 2018–2008HWEC diff
Soil texture range in topsoil, <0,01 mmSTR 0,01
Soil texture range in undersoil, <0,01 mmSTR UnS 0,01
Soil adsorption complex characteristics (%)Topsoil 2008SACT 2008
Soil adsorption complex characteristics (%) 2018SACT
Maximum adsorption capacity (mmol+/100g) topsoil 2008MAC 2008
Technological and organic matterOMTech
Maximum adsorption capacity (mmol+/100g) topsoil 2018MAC
Saturation of exchangeable bases content (mmol+/100g) Topsoil 2008SEBCT 2008
Variation range of soil particles topsoil up to001mmSTVRS001 (%)
Variation range of soil texture undersoil <0,001,STVRUS001 (%)
Saturation of exchangeable bases content (mmol+/100g) Topsoil 2018SEBCT
Texture of soil grain six rangesText6

References

  1. Bentsen, N.S.; Larsen, S.; Stupak, I. Sustainability governance of the Danish bioeconomy—The case of bioenergy and biomaterials from agriculture. Energy Sustain. Soc. 2019, 9, 40. [Google Scholar] [CrossRef]
  2. Skrypchuk, P.; Zhukovskyy, V.; Shpak, H.; Zhukovska, N.; Krupko, H. Applied Aspects of Humus Balance Modelling in the Rivne Region of Ukraine. J. Ecol. Eng. 2020, 21, 42–52. [Google Scholar] [CrossRef]
  3. Oldfield, E.E.; Bradford, M.A.; Wood, S.A. Global meta-analysis of the relationship between soil organic matter and crop yields. Soil 2019, 5, 15–32. [Google Scholar] [CrossRef] [Green Version]
  4. Šimon, T.; Madaras, M. Chemical and Spectroscopic Parameters Are Equally Sensitive in Describing Soil Organic Matter Changes after Decades of Different Fertilization. Agriculture 2020, 10, 422. [Google Scholar] [CrossRef]
  5. Maillard, É.; Angers, D.A. Animal manure application and soil organic carbon stocks: A meta-analysis. Glob. Chang. Biol. 2014, 20, 666–679. [Google Scholar] [CrossRef] [PubMed]
  6. Wang, P.; Wang, J.; Zhang, H.; Dong, Y.; Zhang, Y. The role of iron oxides in the preservation of soil organic matter under long-term fertilization. J. Soils Sediments 2019, 19, 588–598. [Google Scholar] [CrossRef]
  7. Zhang, X.; Fang, Q.; Zhang, T.; Ma, W.; Velthof, G.L.; Hou, Y.; Oenema, O.; Zhang, F. Benefits and trade-offs of replacing synthetic fertilizers by animal manures in crop production in China: A meta-analysis. Glob. Chang. Biol. 2020, 26, 888–900. [Google Scholar] [CrossRef] [PubMed]
  8. Moeskops, B.; Buchan, D.; Van Beneden, S.; Fievez, V.; Sleutel, S.; Gasper, M.S.; D’Hose, T.; De Neve, S. The impact of exogenous organic matter on SOM contents and microbial soil quality. Pedobiologia 2012, 55, 175–184. [Google Scholar] [CrossRef]
  9. Matějková, Š.; Kumhálová, J.; Lipavský, J. Evaluation of crop yield under different nitrogen doses of mineral fertilization. Plant Soil Environ. 2010, 56, 163–167. [Google Scholar] [CrossRef] [Green Version]
  10. Rao, C.S.; Indoria, A.K.; Sharma, K.L. Effective Management Practices for Improving Soil Organic Matter for Increasing Crop Productivity in Rainfed Agroecology of India. Curr. Sci. 2017, 112, 1497–1504. [Google Scholar] [CrossRef]
  11. Menšík, L.; Hlisnikovský, L.; Pospíšilová, L.; Kunzová, E. The effect of application of organic manures and mineral fertilizers on the state of soil organic matter and nutrients in the long-term field experiment. J. Soils Sediments 2018, 18, 2813–2822. [Google Scholar] [CrossRef]
  12. Shi, R.-Y.; Liu, Z.-D.; Li, Y.; Jiang, T.; Xu, M.; Li, J.-Y.; Xu, R.-K. Mechanisms for increasing soil resistance to acidification by long-term manure application. Soil Tillage Res. 2019, 185, 77–84. [Google Scholar] [CrossRef]
  13. Franzluebbers, A.J. Soil organic matter stratification ratio as an indicator of soil quality. Soil Tillage Res. 2002, 66, 95–106. [Google Scholar] [CrossRef]
  14. Stockmann, U.; Adams, M.A.; Crawford, J.W.; Field, D.J.; Henakaarchchi, N.; Jenkins, M.; Minasny, B.; McBratney, A.B.; de Courcelles, V.D.R.; Singh, K.; et al. The knowns, known unknowns and unknowns of sequestration of soil organic carbon. Agric. Ecosyst. Environ. 2013, 164, 80–99. [Google Scholar] [CrossRef]
  15. Zhao, S.; Li, K.; Zhou, W.; Qiu, S.; Huang, S.; He, P. Changes in soil microbial community, enzyme activities and organic matter fractions under long-term straw return in north-central China. Agric. Ecosyst. Environ. 2016, 216, 82–88. [Google Scholar] [CrossRef]
  16. Yang, F.; Tian, J.; Fang, H.; Gao, Y.; Xu, M.; Lou, Y.; Zhou, B.; Kuzyakov, Y. Functional Soil Organic Matter Fractions, Microbial Community, and Enzyme Activities in a Mollisol Under 35 Years Manure and Mineral Fertilization. J. Soil Sci. Plant Nutr. 2019, 19, 430–439. [Google Scholar] [CrossRef]
  17. Gong, W.; Yan, X.; Wang, J.; Hu, T.; Gong, Y. Long-term manure and fertilizer effects on soil organic matter fractions and microbes under a wheat–maize cropping system in northern China. Geoderma 2009, 149, 318–324. [Google Scholar] [CrossRef]
  18. Harden, J.W.; Hugelius, G.; Ahlström, A.; Blankinship, J.C.; Bond-Lamberty, B.; Lawrence, C.R.; Loisel, J.; Malhotra, A.; Jackson, R.B.; Ogle, S.; et al. Networking our science to characterize the state, vulnerabilities, and management opportunities of soil organic matter. Glob. Chang. Biol. 2017, 24, e705–e718. [Google Scholar] [CrossRef] [Green Version]
  19. Rochette, P.; Angers, D.A.; Flanagan, L.B. Maize Residue Decomposition Measurement Using Soil Surface Carbon Dioxide Fluxes and Natural Abundance of Carbon-13. Soil Sci. Soc. Am. J. 1999, 63, 1385–1396. [Google Scholar] [CrossRef]
  20. Lal, R. Soil Carbon Sequestration Impacts on Global Climate Change and Food Security. Science 2004, 304, 1623–1627. [Google Scholar] [CrossRef] [PubMed] [Green Version]
  21. LoLorenz, K.; Lal, R. Carbon Sequestration in Agricultural Ecosystems, 1st ed.; Springer: Cham, Switzerland, 2018; ISBN 978-3-319-92317-8. [Google Scholar]
  22. Reeves, D.W. The role of soil organic matter in maintaining soil quality in continuous cropping systems. Soil Tillage Res. 1997, 43, 131–167. [Google Scholar] [CrossRef]
  23. Schmidt, M.W.I.; Torn, M.S.; Abiven, S.; Dittmar, T.; Guggenberger, G.; Janssens, I.A.; Kleber, M.; Kögel-Knabner, I.; Lehmann, J.; Manning, D.A.C.; et al. Persistence of soil organic matter as an ecosystem property. Nature 2011, 478, 49–56. [Google Scholar] [CrossRef] [Green Version]
  24. Terry, R.L.; Ryan, J. Soil and Food Security. Better Crop. 2015, 99, 4–6. [Google Scholar]
  25. Stavi, I.; Bel, G.; Zaady, E. Soil functions and ecosystem services in conventional, conservation, and integrated agricultural systems. A review. Agron. Sustain. Dev. 2016, 36, 1–12. [Google Scholar] [CrossRef] [Green Version]
  26. Barłóg, P.; Hlisnikovský, L.; Kunzová, E. Effect of Digestate on Soil Organic Carbon and Plant-Available Nutrient Content Compared to Cattle Slurry and Mineral Fertilization. Agronomy 2020, 10, 379. [Google Scholar] [CrossRef] [Green Version]
  27. Baştabak, B.; Koçar, G. A review of the biogas digestate in agricultural framework. J. Mater. Cycles Waste Manag. 2020, 22, 1318–1327. [Google Scholar] [CrossRef]
  28. Scarlat, N.; Dallemand, J.-F.; Fahl, F. Biogas: Developments and perspectives in Europe. Renew. Energy 2018, 129, 457–472. [Google Scholar] [CrossRef]
  29. Nkoa, R. Agricultural benefits and environmental risks of soil fertilization with anaerobic digestates: A review. Agron. Sustain. Dev. 2014, 34, 473–492. [Google Scholar] [CrossRef] [Green Version]
  30. Simon, T.; Kunzová, E.; Friedlová, M. The effect of digestate, cattle slurry and mineral fertilization on the winter wheat yield and soil quality parameters. Plant Soil Environ. 2015, 61, 522–527. [Google Scholar] [CrossRef] [Green Version]
  31. Garg, R.N.; Pathak, H.; Das, D.K.; Tomar, R.K. Use of Flyash and Biogas Slurry for Improving Wheat Yield and Physical Properties of Soil. Environ. Monit. Assess. 2005, 107, 1–9. [Google Scholar] [CrossRef]
  32. Slepetiene, A.; Volungevicius, J.; Jurgutis, L.; Liaudanskiene, I.; Amaleviciute-Volunge, K.; Slepetys, J.; Ceseviciene, J. The potential of digestate as a biofertilizer in eroded soils of Lithuania. Waste Manag. 2020, 102, 441–451. [Google Scholar] [CrossRef] [PubMed]
  33. Wysocka-Czubaszek, A. Effect of digestate, liquid and solid manure application on chemical properties of soil. Polish J. Nat. Sci. 2019, 34, 337–354. [Google Scholar]
  34. García-Sánchez, M.; Siles, J.A.; Cajthaml, T.; García-Romera, I.; Tlustoš, P.; Száková, J. Effect of digestate and fly ash applications on soil functional properties and microbial communities. Eur. J. Soil Biol. 2015, 71, 1–12. [Google Scholar] [CrossRef]
  35. Parton, W.J.; Schimel, D.S.; Cole, C.V.; Ojima, D.S. Analysis of Factors Controlling Soil Organic Matter Levels in Great Plains Grasslands. Soil Sci. Soc. Am. J. 1987, 51, 1173–1179. [Google Scholar] [CrossRef]
  36. Parton, W.J.; Stewart, J.W.B.; Cole, C.V. Dynamics of C, N, P and S in grassland soils: A model. Biogeochemistry 1988, 5, 109–131. [Google Scholar] [CrossRef]
  37. Jones, C.A.; Dyke, P.T.; Williams, J.R.; Kiniry, J.R.; Benson, V.W.; Griggs, R.H. EPIC: An operational model for evaluation of agricultural sustainability. Agric. Syst. 1991, 37, 341–350. [Google Scholar] [CrossRef]
  38. Balkovič, J.; Madaras, M.; Skalský, R.; Folberth, C.; Smatanová, M.; Schmid, E.; Van Der Velde, M.; Kraxner, F.; Obersteiner, M. Verifiable soil organic carbon modelling to facilitate regional reporting of cropland carbon change: A test case in the Czech Republic. J. Environ. Manag. 2020, 274, 111206. [Google Scholar] [CrossRef]
  39. Coleman, K.; Jenkinson, D.S. RothC-26.3—A Model for the turnover of carbon in soil. In Evaluation of Soil Organic Matter Models; Powlson, D.S., Smith, P., Smith, J.U., Eds.; NATO ASI Series (Series I: Global Environmental Change); Springer: Berlin/Heidelberg, Germany, 1996; pp. 237–246. [Google Scholar] [CrossRef]
  40. Hábová, M.; Pospíšilová, L.; Hlavinka, P.; Trnka, M.; Barančíková, G.; Tarasovičová, Z.; Takáč, J.; Koco, Š.; Menšík, L.; Nerušil, P. Carbon pool in soil under organic and conventional farming systems. Soil Water Res. 2019, 14, 145–152. [Google Scholar] [CrossRef]
  41. Li-Xia, Y.; Jian-Jun, P. Dynamics models of soil organic carbon. J. For. Res. 2003, 14, 323–330. [Google Scholar] [CrossRef]
  42. Xiong, X.; Grunwald, S.; Myers, D.B.; Kim, J.; Harris, W.G.; Comerford, N.B. Holistic environmental soil-landscape modeling of soil organic carbon. Environ. Model. Softw. 2014, 57, 202–215. [Google Scholar] [CrossRef]
  43. Escalona, Y.; Petrov, D.; Oostenbrink, C. Vienna soil organic matter modeler 2 (VSOMM2). J. Mol. Graph. Model. 2021, 103, 107817. [Google Scholar] [CrossRef] [PubMed]
  44. Ellili-Bargaoui, Y.; Walter, C.; Lemercier, B.; Michot, D. Assessment of six soil ecosystem services by coupling simulation modelling and field measurement of soil properties. Ecol. Indic. 2021, 121, 107211. [Google Scholar] [CrossRef]
  45. Meersmans, J.; De Ridder, F.; Canters, F.; De Baets, S.; Van Molle, M. A multiple regression approach to assess the spatial distribution of Soil Organic Carbon (SOC) at the regional scale (Flanders, Belgium). Geoderma 2008, 143, 1–13. [Google Scholar] [CrossRef]
  46. Liu, S.; An, N.; Yang, J.; Dong, S.; Wang, C.; Yin, Y. Prediction of soil organic matter variability associated with different land use types in mountainous landscape in southwestern Yunnan province, China. Catena 2015, 133, 137–144. [Google Scholar] [CrossRef]
  47. John, K.; Isong, I.A.; Kebonye, N.M.; Ayito, E.O.; Agyeman, P.C.; Afu, S.M. Using Machine Learning Algorithms to Estimate Soil Organic Carbon Variability with Environmental Variables and Soil Nutrient Indicators in an Alluvial Soil. Land 2020, 9, 487. [Google Scholar] [CrossRef]
  48. Lentzsch, P.; Wieland, R.; Wirth, S. Application of multiple regression and neural network approaches for landscape-scale assessment of soil microbial biomass. Soil Biol. Biochem. 2005, 37, 1577–1580. [Google Scholar] [CrossRef]
  49. Ebrahimi, M.; Sinegani, A.A.S.; Sarikhani, M.R.; Mohammadi, S.A. Comparison of artificial neural network and multivariate regression models for prediction of Azotobacteria population in soil under different land uses. Comput. Electron. Agric. 2017, 140, 409–421. [Google Scholar] [CrossRef]
  50. Forkuor, G.; Hounkpatin, O.K.L.; Welp, G.; Thiel, M. High Resolution Mapping of Soil Properties Using Remote Sensing Variables in South-Western Burkina Faso: A Comparison of Machine Learning and Multiple Linear Regression Models. PLoS ONE 2017, 12, e0170478. [Google Scholar] [CrossRef] [PubMed]
  51. Vohland, M.; Ludwig, M.; Thiele-Bruhn, S.; Ludwig, B. Quantification of Soil Properties with Hyperspectral Data: Selecting Spectral Variables with Different Methods to Improve Accuracies and Analyze Prediction Mechanisms. Remote Sens. 2017, 9, 1103. [Google Scholar] [CrossRef] [Green Version]
  52. Sims, J.R.; Haby, V.A. Simplified colorimetric determination of soil organic matter. Soil Sci. 1971, 112, 137–141. [Google Scholar] [CrossRef]
  53. Nelson, D.W.; Sommers, L.E. Total Carbon, Organic Carbon, and Organic Matter. In Methods of Soil Analysis Part 3—Chemical Methods; Sparks, D.L., Page, A.L., Helmke, P.A., Loeppert, R.H., Soltanpour, P.N., Tabatabai, M.A., Johnston, C.T., Summer, M.E., Eds.; Soil Science Society of America: Madison, WI, USA; American Society of Agronomy: Madison, WI, USA, 1996; pp. 961–1010. [Google Scholar]
  54. Körschens, M.; Schulz, E.; Behm, R. Heißwasserlöslicher C und N im boden als kriterium für das N-Nachlieferungsvermögen. Zentralblatt für Mikrobiologie 1990, 145, 305–311. [Google Scholar] [CrossRef]
  55. Heller, C.; Weiß, K. Approaching a Standardized Method for the Hot-Water Extraction of Peat Material to Determine Labile SOM in Organic Soils. Commun. Soil Sci. Plant Anal. 2015, 46, 1044–1060. [Google Scholar] [CrossRef]
  56. Kappen, H. Die Bodenazidität; Springer: Berlin, Germany, 1929; 363p. [Google Scholar]
  57. Zbíral, J.; Honsa, I.; Malý, S. Analýza půd III. Jednotné Pracovní Postupy (Soil Analysis III.); ÚKZÚZ (Central Institute for Supervising and Testing in Agriculture): Brno, Czech Republic, 1997. [Google Scholar]
  58. Lal, R.; Shukla, M.K. Principles of Soil Physics; Marcel Dekker, Inc.: New York, NY, USA, 2004; ISBN 0824753240. [Google Scholar]
  59. Klír, J.; Kunzová, E.; Čermák, P. Rámcová Metodika Výživy Rostlin a Hnojení (Framework Methodology Plant Nutrition and Fertilization); Crop Research Institute: Prague, Czech Republic, 2008; ISBN 978-80-87011-61-4. [Google Scholar]
  60. Voltr, V.; Hruška, M.; Havelka, F. Comparison of the energy and economic balance of crop production. CIGR J. 2020, 22, 138–150. [Google Scholar]
  61. Voltr, V.; Hruška, M.; Nobilis, L.; Fuksa, P.; Pokorný, J. Procedure of Economic, Energy and Environmental Evaluation of Crop Production in the Czech Republic. In Proceedings of the 28th European Biomass Conference and Exhibition, Virtual, 6–9 July 2020; pp. 55–61. [Google Scholar] [CrossRef]
  62. Meloun, M.; Militký, J. Statistical Data Analysis, A Practical Guide with 1250 Exercises and Answer Key on CD; Woodhead Publishing: New Delhi, India, 2011; ISBN 978-93-80308-11-1. [Google Scholar]
  63. Steenwerth, K.L.; Reynolds, M.P.; Solis, S.S.; Sischo, W.M.; Lubell, M.N.; Msangi, S.; Prabhu, R.; Springborn, M.; Wollenberg, E.K.; Jarvis, L.S.; et al. Climate-smart agriculture global research agenda: Scientific basis for action. Agric. food Secur. 2014, 3, 56. [Google Scholar] [CrossRef] [Green Version]
  64. IPCC. IPCC Climate Change 2014: Mitigation of Climate Change. In Contribution of Working Group III to the Fifth Assessment Report of the Intergovernmental Panel on Climate Change; Cambridge University Press: Cambridge, UK; New York, NY, USA, 2014. [Google Scholar]
  65. Srivastava, P.; Singh, R.; Tripathi, S.; Singh, H.; Raghubanshi, A.S. Soil carbon dynamics and climate change: Current agro-environmental perspectives and future dimensions. Energy Ecol. Environ. 2016, 1, 315–322. [Google Scholar] [CrossRef] [Green Version]
  66. Naikwade, P.V. Soil Organic Carbon Sequestration by Long-Term Application of Manures Prepared fromTrianthema portulacastrurm Linn. Commun. Soil Sci. Plant Anal. 2019, 50, 2579–2592. [Google Scholar] [CrossRef]
  67. Trnka, M.; Brázdil, R.; Dubrovský, M.; Semerádová, D.; Štěpánek, P.; Dobrovolný, P.; Možný, M.; Eitzinger, J.; Málek, J.; Formayer, H.; et al. A 200-year climate record in Central Europe: Implications for agriculture. Agron. Sustain. Dev. 2011, 31, 631–641. [Google Scholar] [CrossRef] [Green Version]
  68. Banwart, S.A.; Black, H.; Cai, Z.; Gicheru, P.T.; Joosten, H.; Victoria, R.L.; Milne, E.; Noellemeyer, E.; Pascual, U. The global challenge for soil carbon. In Soil Carbon: Science, Management and Policy for Multiple Benefits; CABI: Wallingford, UK, 2014; pp. 1–9. ISBN 978-1-78064-532-2. [Google Scholar]
  69. Lal, R. Soil organic matter content and crop yield. J. Soil Water Conserv. 2020, 75, 27A–32A. [Google Scholar] [CrossRef] [Green Version]
  70. Macholdt, J.; Piepho, H.-P.; Honermeier, B. Mineral NPK and manure fertilisation affecting the yield stability of winter wheat: Results from a long-term field experiment. Eur. J. Agron. 2019, 102, 14–22. [Google Scholar] [CrossRef]
  71. Meena, H.M.; Sharma, R.P. Long-Term Effect of Fertilizers and Amendments on Different Fractions of Organic Matter in an Acid Alfisol. Commun. Soil Sci. Plant Anal. 2016, 47, 1430–1440. [Google Scholar] [CrossRef]
  72. Maltas, A.; Kebli, H.; Oberholzer, H.R.; Weisskopf, P.; Sinaj, S. The effects of organic and mineral fertilizers on carbon sequestration, soil properties, and crop yields from a long-term field experiment under a Swiss conventional farming system. Land Degrad. Dev. 2018, 29, 926–938. [Google Scholar] [CrossRef]
  73. Körschens, M.; Müller, A. The Static Experiment Bad Lauchstädt, Germany. In Evaluation of Soil Organic Matter Models; Powlson, D.S., Smith, P., Smith, J.U., Eds.; NATO ASI Series (Series I: Global Environmental Change); Springer: Berlin/Heidelberg, Germany, 1996; Volume 38, pp. 369–376. [Google Scholar]
  74. Christensen, B.T. The Askov Long-Term Experiments on Animal Manure and Mineral Fertilizers. In Evaluation of Soil Organic Matter Models; Powlson, D.S., Smith, P., Smith, J.U., Eds.; NATO ASI Series (Series I: Global Environmental Change); Springer: Berlin/Heidelberg, Germany, 1996; Volume 38, pp. 301–312. [Google Scholar]
  75. Jenkinson, D.S.; Adams, D.E.; Wild, A.L. Model estimates of CO2 emissions from soil in response to global warming. Nature 1991, 351, 304–306. [Google Scholar] [CrossRef]
  76. Smith, P.; Powlson, D.; Glendining, M.; Smith, J. Potential for carbon sequestration in European soils: Preliminary estimates for five scenarios using results from long-term experiments. Glob. Chang. Biol. 1997, 3, 67–79. [Google Scholar] [CrossRef]
  77. Menšík, L.; Hlisnikovský, L.; Kunzová, E. The State of the Soil Organic Matter and Nutrients in the Long-Term Field Experiments with Application of Organic and Mineral Fertilizers in Different Soil-Climate Conditions in the View of Expecting Climate Change. In Organic Fertilizers—History, Production and Applications; Larramendy, M.L., Soloneski, S., Eds.; IntechOpen: London, UK, 2019; pp. 23–42. [Google Scholar]
  78. Laudicina, V.A.; Badalucco, L.; Palazzolo, E. Effects of compost input and tillage intensity on soil microbial biomass and activity under Mediterranean conditions. Biol. Fertil. Soils 2011, 47, 63–70. [Google Scholar] [CrossRef]
  79. Nunes, M.R.; van Es, H.M.; Veum, K.S.; Amsili, J.P.; Karlen, D.L. Anthropogenic and Inherent Effects on Soil Organic Carbon across the U.S. Sustainability 2020, 12, 5695. [Google Scholar] [CrossRef]
  80. Haddaway, N.R.; Hedlund, K.; Jackson, L.E.; Kätterer, T.; Lugato, E.; Thomsen, I.K.; Jørgensen, H.B.; Isberg, P.-E. How does tillage intensity affect soil organic carbon? A systematic review protocol. Environ. Evid. 2016, 5, 1. [Google Scholar] [CrossRef] [Green Version]
  81. Möller, K.; Müller, T. Effects of anaerobic digestion on digestate nutrient availability and crop growth: A review. Eng. Life Sci. 2012, 12, 242–257. [Google Scholar] [CrossRef]
  82. Möller, K. Effects of anaerobic digestion on soil carbon and nitrogen turnover, N emissions, and soil biological activity. A review. Agron. Sustain. Dev. 2015, 35, 1021–1041. [Google Scholar] [CrossRef]
  83. Thomsen, I.K.; Olesen, J.E.; Møller, H.B.; Sørensen, P.; Christensen, B.T. Carbon dynamics and retention in soil after anaerobic digestion of dairy cattle feed and faeces. Soil Biol. Biochem. 2013, 58, 82–87. [Google Scholar] [CrossRef]
  84. Tiwari, V.N.; Tiwari, K.N.; Upadhyay, R.M. Effect of crop residues and biogas slurry incorporation in wheat on yield and soil fertility. J. Indian Soc. Soil Sci. 2000, 48, 515–520. [Google Scholar]
  85. Menšík, L.; Nerušil, P. Production, Qualitative and Stand Changes of Permanent Grassland in Relation to the Intensity of Utilization and Fertilization Level in the Malá Haná Region; Crop Research Institute: Prague, Czech Republic, 2019; ISBN 978-80-7427-319-3. [Google Scholar]
  86. Knebl, L.; Leithold, G.; Brock, C. Improving minimum detectable differences in the assessment of soil organic matter change in short-term field experiments. J. Plant Nutr. Soil Sci. 2015, 178, 35–42. [Google Scholar] [CrossRef]
  87. Brock, C.; Hoyer, U.; Leithold, G.; Hülsbergen, K.-J. The humus balance model (HU-MOD): A simple tool for the assessment of management change impact on soil organic matter levels in arable soils. Nutr. Cycl. Agroecosyst. 2012, 92, 239–254. [Google Scholar] [CrossRef]
  88. Campbell, E.E.; Paustian, K. Current developments in soil organic matter modeling and the expansion of model applications: A review. Environ. Res. Lett. 2015, 10, 123004. [Google Scholar] [CrossRef]
  89. Rosa, E.; Debska, B. Seasonal changes in the content of dissolved organic matter in arable soils. J. Soils Sediments 2018, 18, 2703–2714. [Google Scholar] [CrossRef] [Green Version]
  90. Pykh, Y.A.; Malkina-Pykh, I.G. POLMOD.PEST—The model of pesticides dynamics in the elementary ecosystems. Ecol. Model. 1997, 98, 215–236. [Google Scholar] [CrossRef]
  91. Styles, D.; Gibbons, J.; Williams, A.P.; Dauber, J.; Stichnothe, H.; Urban, B.; Chadwick, D.R.; Jones, D.L. Consequential life cycle assessment of biogas, biofuel and biomass energy options within an arable crop rotation. GCB Bioenergy 2015, 7, 1305–1320. [Google Scholar] [CrossRef] [Green Version]
  92. De Willigen, P.; Janssen, B.H.; Heesmans, H.I.M.; Conijn, J.G.; Velthof, G.J.; Chardon, W.J. Decomposition and Accumulation of Organic Matter in Soil; Comparison of Some Models; Alterra: Wagenigen, The Netherlands, 2008. [Google Scholar]
  93. Ren, T.; Wang, J.; Chen, Q.; Zhang, F.; Lu, S. The Effects of Manure and Nitrogen Fertilizer Applications on Soil Organic Carbon and Nitrogen in a High-Input Cropping System. PLoS ONE 2014, 9, e97732. [Google Scholar] [CrossRef]
  94. Li, M.; Hu, H.; He, X.; Jia, J.; Drosos, M.; Wang, G.; Liu, F.; Hu, Z.; Xi, B. Organic Carbon Sequestration in Soil Humic Substances As Affected by Application of Different Nitrogen Fertilizers in a Vegetable-Rotation Cropping System. J. Agric. Food Chem. 2019, 67, 3106–3113. [Google Scholar] [CrossRef]
  95. Ondrasek, G.; Begić, H.B.; Zovko, M.; Filipović, L.; Meriño-Gergichevich, C.; Savić, R.; Rengel, Z. Biogeochemistry of soil organic matter in agroecosystems & environmental implications. Sci. Total Environ. 2019, 658, 1559–1573. [Google Scholar] [CrossRef]
  96. Smith, P.; Goulding, K.W.; Smith, K.A.; Powlson, D.S.; Smith, J.U.; Falloon, P.; Coleman, K. Enhancing the carbon sink in European agricultural soils: Including trace gas fluxes in estimates of carbon mitigation potential. Nutr. Cycl. Agroecosyst. 2001, 60, 237–252. [Google Scholar] [CrossRef]
  97. Leifeld, J.; Fuhrer, J. Organic Farming and Soil Carbon Sequestration: What Do We Really Know About the Benefits? Ambio 2010, 39, 585–599. [Google Scholar] [CrossRef] [PubMed] [Green Version]
  98. Singh, S.; Nouri, A.; Singh, S.; Anapalli, S.; Lee, J.; Arelli, P.; Jagadamma, S. Soil organic carbon and aggregation in response to thirty-nine years of tillage management in the southeastern US. Soil Tillage Res. 2020, 197, 104523. [Google Scholar] [CrossRef]
  99. Xu, J.; Han, H.; Ning, T.; Li, Z.; Lal, R. Long-term effects of tillage and straw management on soil organic carbon, crop yield, and yield stability in a wheat-maize system. Field Crop. Res. 2019, 233, 33–40. [Google Scholar] [CrossRef]
  100. Mukumbuta, I.; Hatano, R. Do tillage and conversion of grassland to cropland always deplete soil organic carbon? Soil Sci. Plant Nutr. 2019, 66, 76–83. [Google Scholar] [CrossRef]
Figure 1. General scheme of SOC and HWEC formation.
Agronomy 11 00779 g001
Figure 2. Principles of evaluation of SOM in fields.
Agronomy 11 00779 g002
Figure 3. The values of the (a) pH (KCl), (b) SOC, (c) HWEC and (d) SEBCT in 2008 and 2018 according to the soil type.
Agronomy 11 00779 g003
Figure 4. Dependence of (a) pH and (b) SEBCT difference (2018–2008) on OM dose applied in digestate.
Agronomy 11 00779 g004
Figure 5. Model 1: HWEC content in soil (the year 2018).
Agronomy 11 00779 g005
Figure 6. Model 2: Difference of HWEC content (2008–2018).
Agronomy 11 00779 g006
Figure 7. Model 3: SOC Difference between the years 2018 and 2008.
Agronomy 11 00779 g007
Figure 8. Importance of variables for model (a) HWEC 2018 and (b) HWEC Difference 2018–2008, (inputs 2016–2018).
Agronomy 11 00779 g008
Figure 9. Importance of variables for model SOC Difference between the years 2018 and 2008.
Agronomy 11 00779 g009
Table 1. The basic characteristics of the climate regions in the Czech Republic.
Region CodeThe Sum of Temp.(°C)Up-to-Date the Sum of Temp. (°C)Mean
Temp. (°C)
Up-to-Date Mean Temp. (°C)Mean Ann. Precipitation (mm)Dry Year Risk FactorMoister Security (1—Minimal, 10 Maximal)
2270034308.509.405500.253
3265033808.509.266000.155.5
5235030807.508.446000.237
6260033308.009.128000.0510
7230030306.508.307000.1010
Publisher’s Note: MDPI stays neutral with regard to jurisdictional claims in published maps and institutional affiliations.

