Article

Pea Breeding Lines Adapted to Autumn Sowings in Broomrape Prone Mediterranean Environments

by
Diego Rubiales
1,*,
Salvador Osuna-Caballero
1,
María J. González-Bernal
1,
María J. Cobos
1 and
Fernando Flores
2
1
Institute for Sustainable Agriculture, CSIC, Avda. Menéndez Pidal s/n, 14004 Córdoba, Spain
2
Departamento de Ciencias Agroforestales. E.T.S.I. Campus El Carmen, Universidad de Huelva, Avda. Fuerzas Armadas S/N, 21007 Huelva, Spain
*
Author to whom correspondence should be addressed.
Agronomy 2021, 11(4), 769; https://doi.org/10.3390/agronomy11040769
Submission received: 5 February 2021 / Revised: 6 April 2021 / Accepted: 10 April 2021 / Published: 14 April 2021

Abstract

:
In Mediterranean environments, with mild winters and dry summers, peas are planted in autumn or early winter to profit from winter rain and to avoid terminal drought and high summer temperatures. The root parasitic weed broomrape (Orobanche crenata) appears as a major limiting factor under these conditions. To address such specific growing conditions and associated constraints, targeted breeding is needed. We present here recent achievements in the development of pea lines arising from a wide hybridization program incorporating resistance to broomrape and to powdery mildew (Erysiphe pisi) from landraces and wild relatives. Their adaption to autumn sowings under Mediterranean rain fed conditions, and their agronomic performance and resistance to prevailing diseases is compared with those of check cultivars in a multi-environment field test with nine trials performed over three seasons. HA-GGE biplots were a powerful tool for comparison among accessions in terms of performance and stability for each trait assessed. Like this, breeding lines NS22, NS34, NS8, NS39, NS35, NS21 and NS83 over-yielded all check cultivars. Grain yield was strongly affected by broomrape infection, with little influence of powdery mildew and ascochyta blight. All breeding lines studied showed high to moderate resistance to broomrape, whereas all check cultivars were severely infected. Broomrape infection was not correlated with days to flowering, whereas powdery mildew infection was favored by long cycles. Broomrape infection was enhanced by mild winter temperatures before flowering and spring rain, whereas high spring temperatures hampered broomrape development.

1. Introduction

Grain legumes are multifunctional annual crops with extraordinary historical importance for the agriculture and the environment. They improve soil fertility and minimize the use of nitrogen fertilizers, contributing to a sustainable agriculture [1,2]. Pea (Pisum sativum L.) is a widely grown temperate grain legume with over 10 Mha grown in 2019 worldwide, including both dry and green peas [3]. Pea represents a versatile and inexpensive protein source both for animal feed and human food, increasingly used as an ingredient in the food industry [4].
Overall productivity of dry pea is mainly approached through breeding for tailoring plant types (especially lodging resistance and plant height) and resistances to key biotic and abiotic stresses [5]. Significant efforts have been made in spring pea breeding targeting continental and oceanic regions [6]. Autumn sown pea in these regions is promising, but winter hardiness should be improved [7]. In areas with mild winters and dry springs, like Mediterranean environments, spring pea types are autumn-sown in an attempt to profit from winter rains and avoid the summer heat and drought [8]. Unfortunately, little effort has been made so far in pea breeding for constraints typical of these environments.
Pea cultivation is strongly hampered in Mediterranean and Middle East farming systems by the occurrence of the weedy root parasite broomrape (Orobanche crenata Forsk.) [9] Strategies for broomrape control have been developed, including cultural practices and chemical control; however, all have met with limited success [10]. Unfortunately, little genetic resistance was available within available cultivars but was identified in landraces and wild Pisum [11]. These sources of resistance were incorporated in a pea breeding program with resistance to broomrape as the first priority. By selection under heavy broomrape pressure, the progenies from crosses with resistant landrances (P. sativum ssp. sativum Ps423, Ps656 and Ps624) or wild relatives (P. sativum ssp. syriacum P665, P. sativum ssp. elatius Pe675 and P. fulvum Pf660), we succeeded in selecting a number of resistant breeding lines [9,12,13] that over-yielded the parent pea cultivar when broomrape infection was high. However, standing ability was not good enough, and in the absence of broomrape infection, those lines did not stand out. The best of such breeding lines (J4 and J20) identified before 2010 [12,13] were then crossed with elite cultivars. After several seasons of selection for resistance and standing ability and yield we succeeded in selecting the new breeding lines described here.
Yield, drought tolerance and resistance to broomrape and to ascochyta blight (Peyronellaea pinodes (Berk. and A. Bloxam) Avesk., Gruy. and Verkl.; anamorph: Ascochyta pinodes L.K. Jones) are traits highly influenced by the environment [14,15,16,17]. On the contrary, resistance to powdery mildew (Erysiphe pisi D.C.) used in pea breeding is largely monogenic (commonly er1 gene), although we cannot exclude additional levels of quantitative resistance [18,19]. The effect of genotype by environment interactions (G × E) attenuates the association between genotype and phenotype, making more difficult the selection of the best genotypes. GGE biplot analysis (genotype plus genotype-by-environment interaction) removes the statistical main effect of the environment and focuses on the genotype and genotype by environment interaction, the most relevant components of cultivar selection, thus avoiding the noise caused by the environment [20]. GGE has been successfully applied to study the stability of yield and adaptation to autumn sowing in various legume crops [12,21,22,23].
In this study, some breeding lines obtained from the breeding program mentioned above were tested in nine environments affected by different constraints. GGE biplot analysis was applied to identify the best and most stable pea breeding lines in terms of resistances and yield, compared to cultivars grown in the region.

2. Materials and Methods

2.1. Plant Material and Experimental Design

The pea network was made up of 19 breeding lines developed at the IAS-CSIC breeding program, together with 6 cultivars, recommended for cultivation in the area [24] (Table 1). The peas were grown over three crop seasons (2017–2018, 2018–2019 and 2019–2020) at 3 sites at Córdoba, Spain (Table 2), selected for their known differential incidence of broomrape. An environment was defined as the combination of a year and a site. At each site, a randomized complete block design with three replications was used. The experimental unit consisted of three parallel 1 m long rows per accession separated by 35 cm, with 10 plants per row. Sowings were carried out between November and December according to local practice, differing a few weeks among sites within the same season. Weeds were controlled by pre-emergence aclonifen 60% all seasons. This was followed by bentazona 48% + imazamox 2.24% and cicloxidim 10% post-emergence during 2018 and 2019, but not on 2020, when only hand weeding was practiced. The harvest of the plants took place by late May to early June, depending on the environment.

2.2. Assessments

Days to flowering (dtf) was estimated in nine of the environments by weekly recording the date in which 50% of the plants of each plot had at least one fully opened flower. “Crop stature” and “crop appearance” were two complex traits agreed after discussions with participatory farmers on the type of crop they would select for. These were assessed at two week intervals starting at full flowering. Crop stature is not the maximum plant length, but stature is maintained by the plot at each scoring date, the resulting effect being of plant height and lodging. The convenience of an additional assessment that we called “crop appearance”, according to farmers’ appreciation, was identified by the fact that they tended to like or dislike our lines based on this, irrespective of the yield obtained. Therefore, we defined this 0–5 index, which would be the result of crop biomass and standing ability, in a way that 0 = plots with poor biomass and fully flat; 5 = plots vigorous and fully erect. According to this, an ideal pea crop according to farmers’ appreciation would have a high crop stature and a nice crop appearance. We therefore recorded these traits and looked for their correlation with yield and biomass. The presence of naturally occurring diseases like powdery mildew (all seasons) and ascochyta blight (occurring only on 2018) was also recorded, estimating Disease Severity (DS) as the percentage of canopy coverage by symptoms. At the end of the crop cycle, the number of emerged broomrape (O. crenata) shoots per pea plant (Oc/pl) was scored by counting the total number of pea plants and the total number of emerged broomrape shoots per plot. The plots were harvested manually at full maturity by late April, early May, depending on the environment. Harvested dry biomass was recorded, and then seeds were then threshed and grain yields were recorded.

2.3. Statistical Analysis

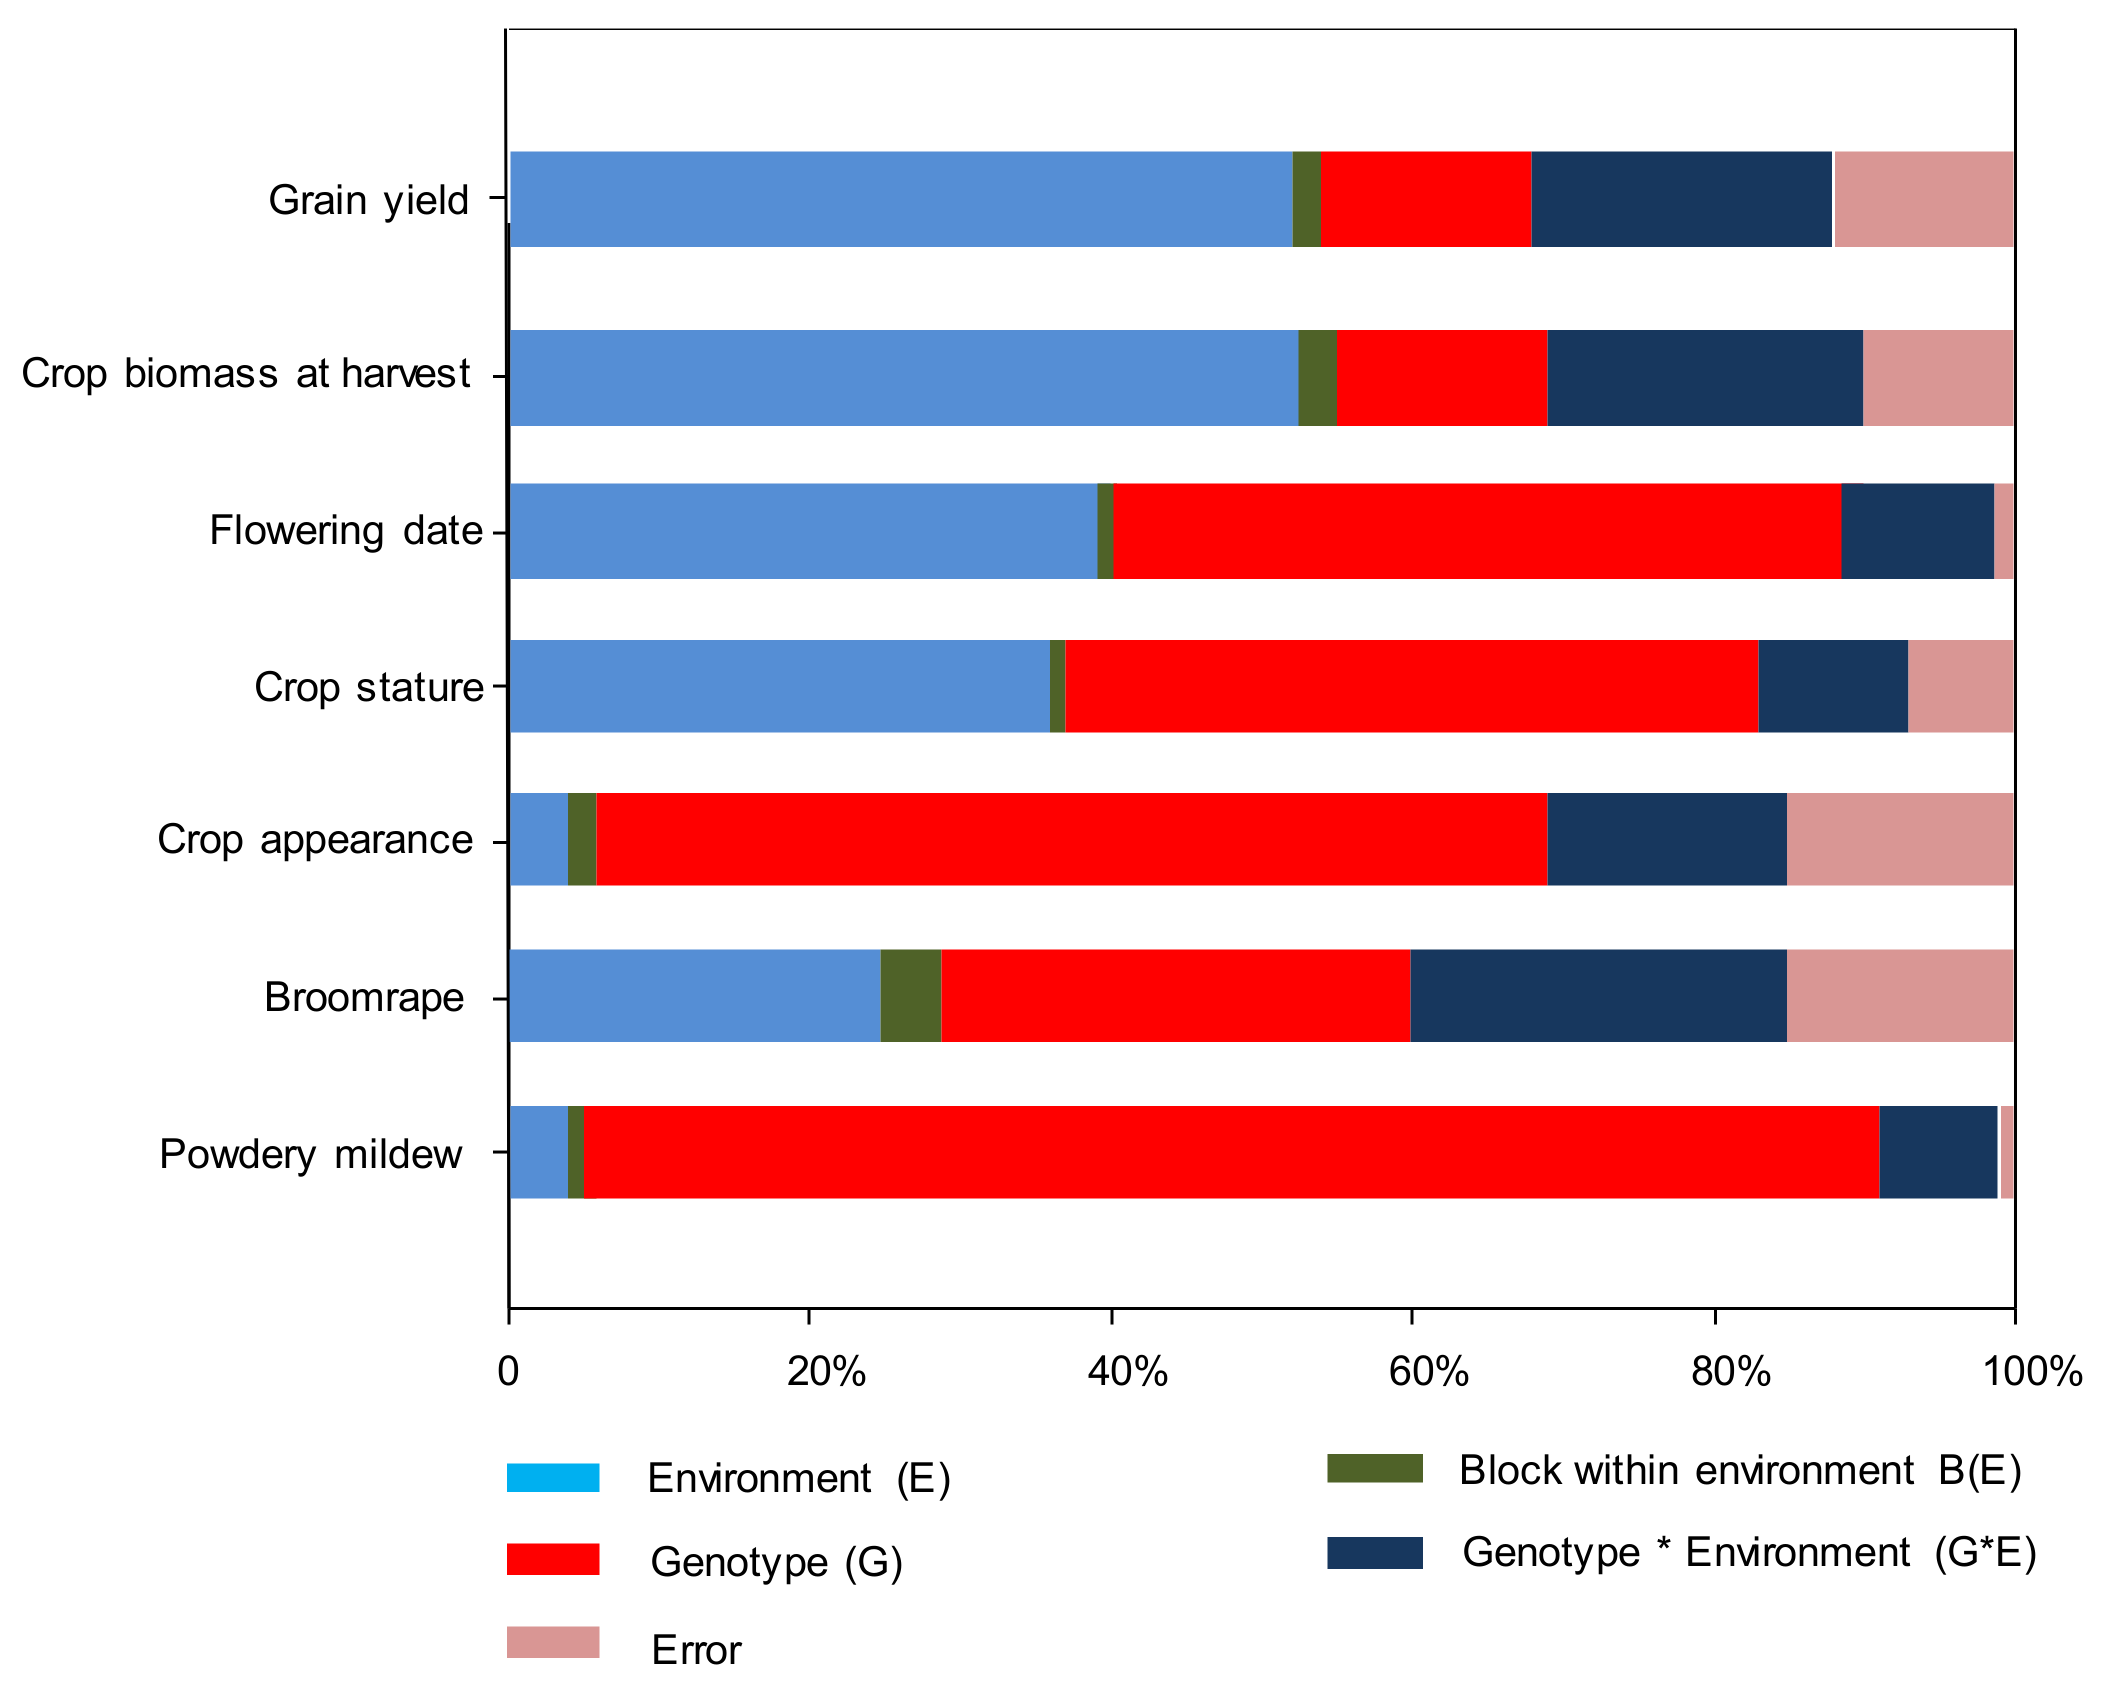
2.3.1. Variances Analyses

A combined ANOVA for randomized complete-block designs was carried out using SAS®9.3 (SAS Institute Inc., Cary, NC, USA) for all traits with genotype and environment as fixed effects. Prior to each ANOVA, tests for normality and equality of variance were conducted for each dependent variable. Arcsine transformations of data not conforming conditions of normality and homogeneity (i.e., powdery mildew data) were performed to conform to the assumptions of ANOVA analysis. F-ratios used to test the effects of randomized complete block experiments combining field-year environments were determined according to McIntosh [26].

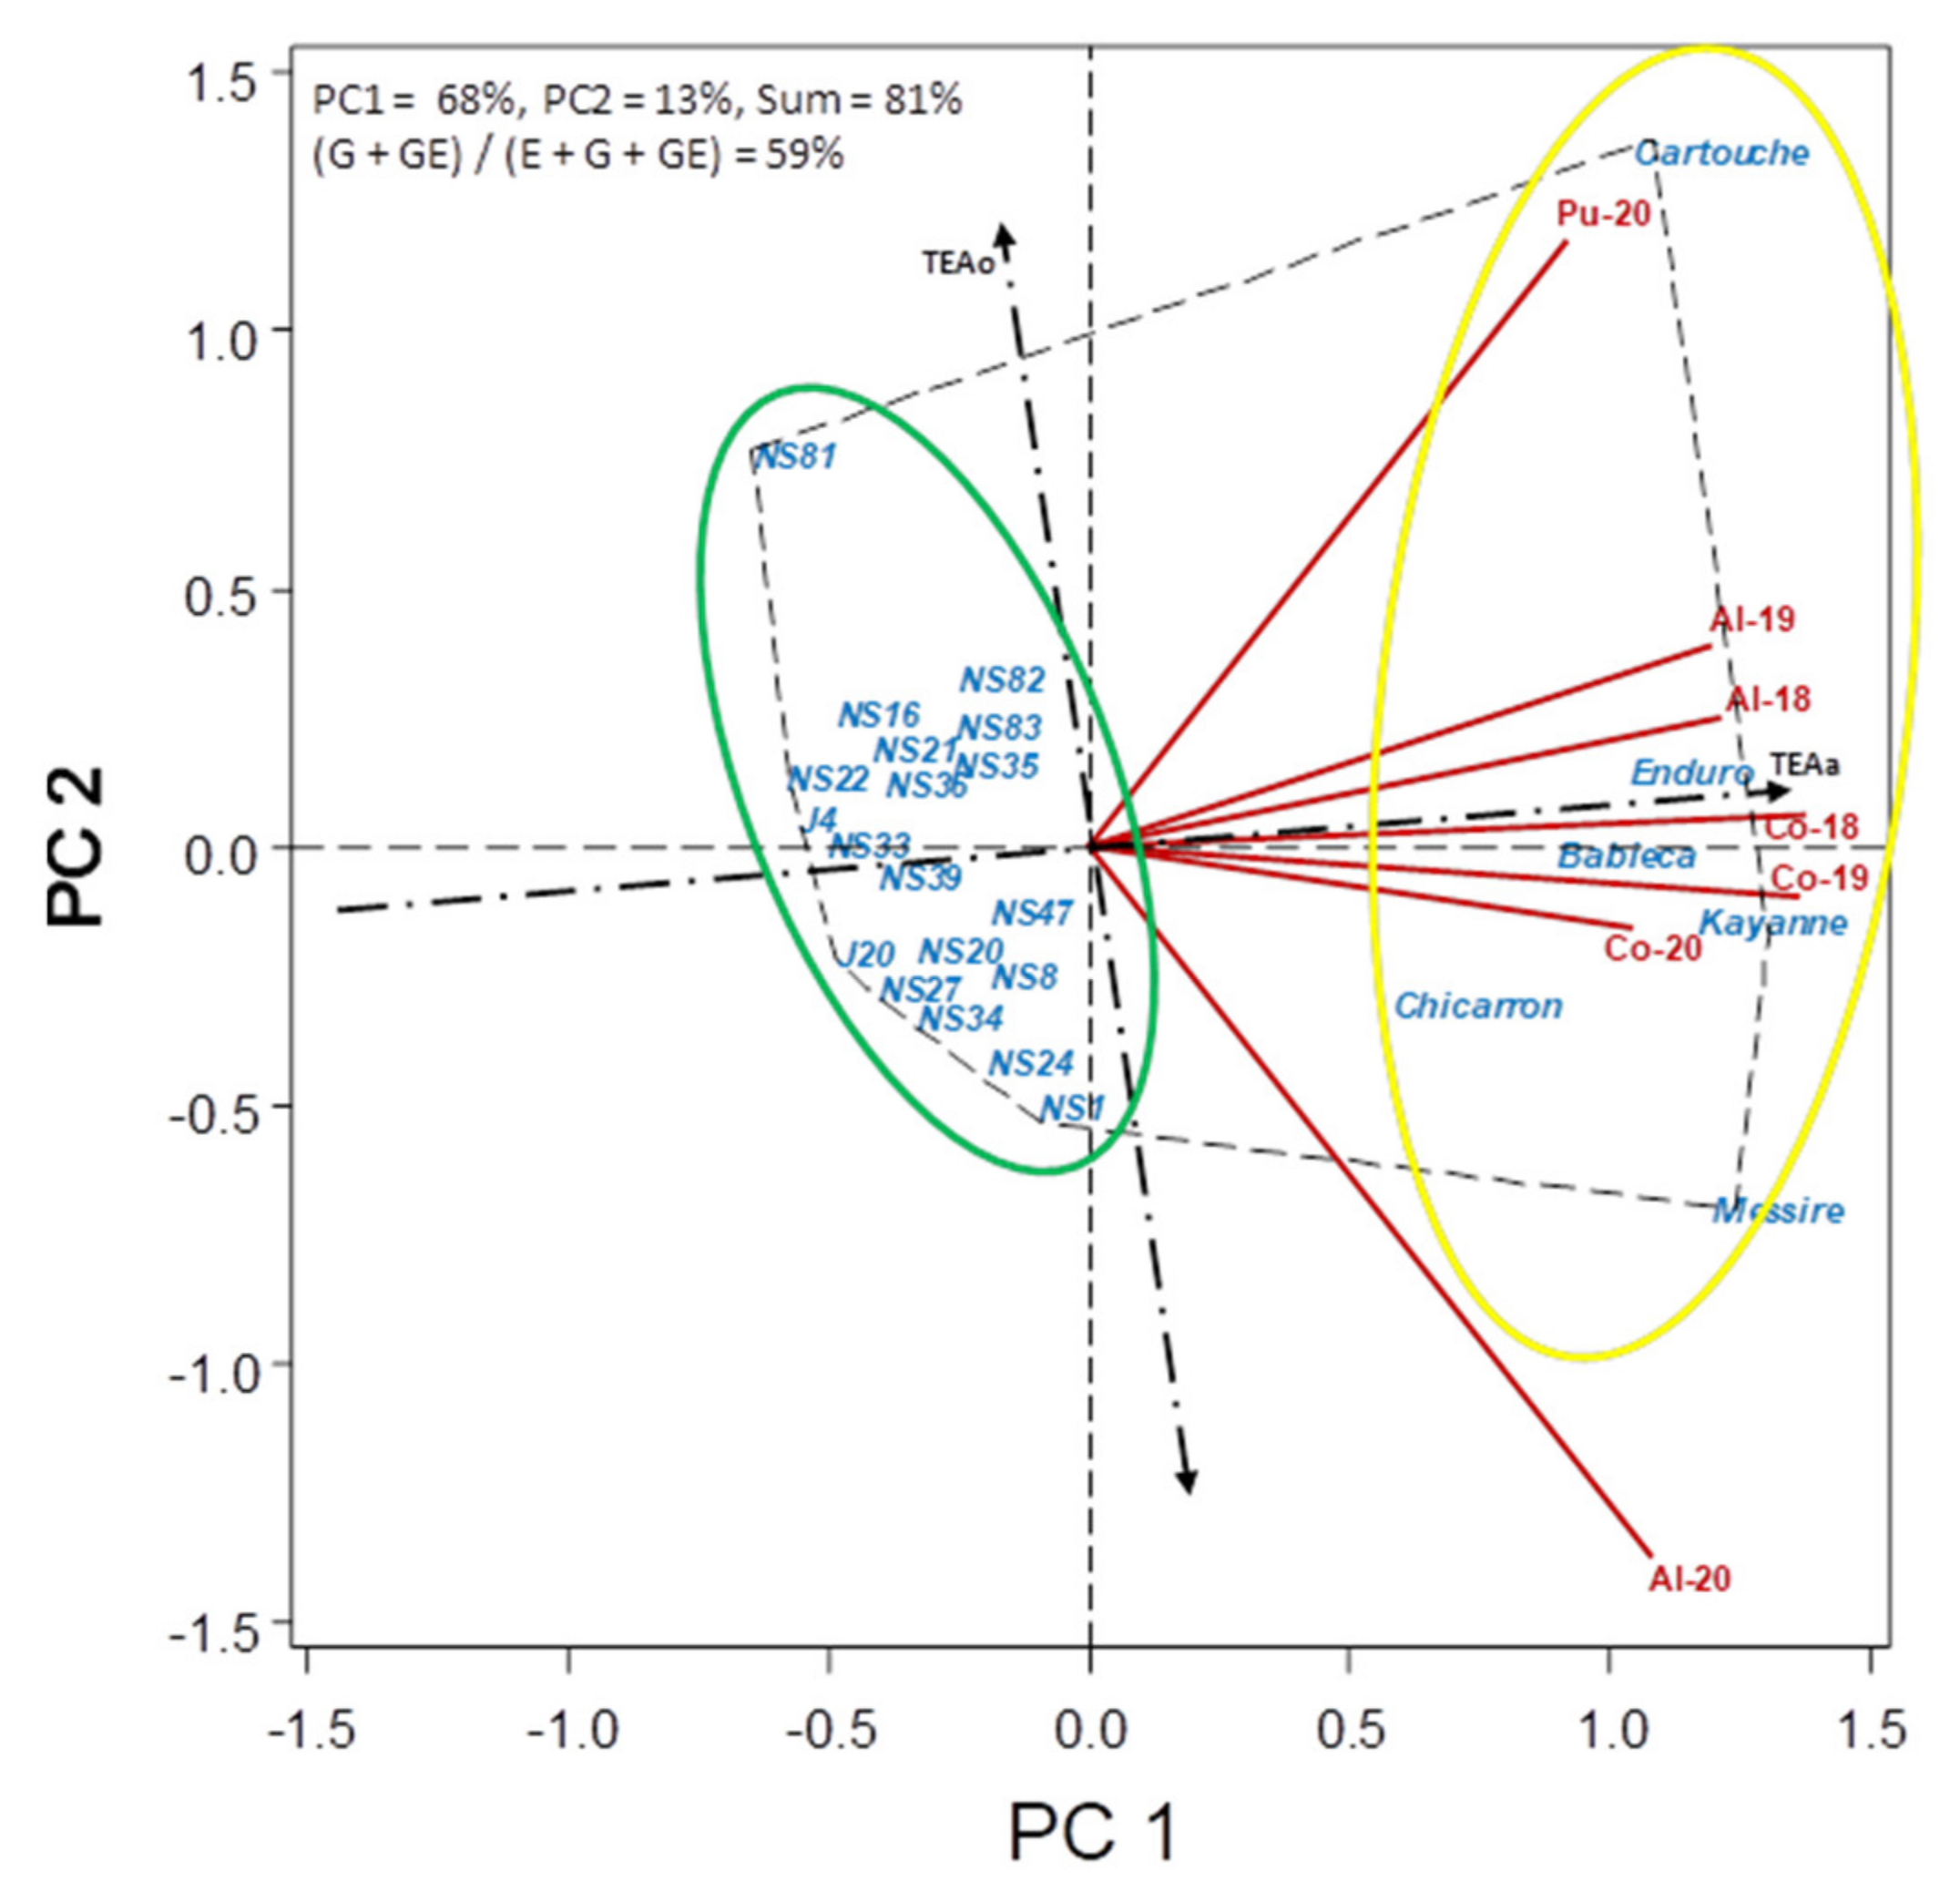
2.3.2. Heritability-Adjusted GGE Biplot (HA-GGE)

The HA-GGE biplot takes into consideration any heterogeneity among environments by giving weights to the test environments proportional to their root square heritability and is therefore appropriate for visual evaluation of the test environments and genotypes [12,20,21,22,23,27]. Analyses were made with the SAS®9.3 program developed by Burgueño et al. [28] to graph the GGE biplots. The target environment axis is represented by a corresponding straight line drawn through the biplot origin and the target environment axis abscissa (TEAa) defines the mean ordinates of all environments in the biplot. Genotypes located on the polygon vertices reveal the best or the poorest for a particular environment.

2.3.3. Multi-Trait Stability Index (MTSI) Based on Factor Analysis

A Multi-Trait Stability Index (MTSI) [29] is used to allow simultaneous selection for stability and mean performance based on several traits (grain yield, biomass, broomrape per plant, crop stature, crop appearance and powdery mildew). Simultaneous selection for performance and stability was performed by using the weighted average of absolute scores and response variable (WAASBY) index, which allows weighting between mean performance (Y) and stability with the weighted average of absolute scores (WAASB) [29]. The WAASBY assumes values in the range of 0−100, with 100 being assigned to the ideotype, i.e., the genotype that was most stable and that best performed on average among those considered in the test environments.
M T S I i = j = 1 f F i j F j 2 0.5
where the MTSI is the multi-trait stability index for the ith genotype, F is a g × f matrix with the factorial scores being the number of genotypes (g) and the number of factors (f), Fij is the jth score of the ith genotype, and Fj is the jth score of ideotype. The genotype with the lowest MTSI is then closer to the ideotype and therefore presents a high mean performance and stability for all the analyzed variables. Analyses were made with the R package “metan” [30].

2.3.4. Non-Metric Multi-Dimensional Scaling Ordination (NMDS)

In order to assess the influence of environmental factors on broomrape infection and on grain yield, 27 climate variables (Table S1) were subjected to non-metric multi-dimensional scaling ordination (NMDS) [31]. These climate variables were obtained from the Junta de Andalucía [25] (and included maximum, minimum and average temperature, maximum, minimum and average humidity, accumulated radiation, evapotranspiration and accumulated rain during pre-flowering, at flowering and post-flowering period. To decrease the probability that the result of the NMDS analysis would reflect a local stress minimum rather than the overall minimum, we repeated the NMDS analysis 20 times, each time starting from a different random configuration, and selected the two-dimensional solution with the lowest stress. Analysis was made by PAST software [32].

3. Results

The results showed the impact of the environment on all assessed traits on pea accessions. The combined analysis of variance for all traits revealed that all main effects (environments (E), genotypes (G) and G × E interaction) were statistically significant (Table S2). Environmental effects were highest on grain yield and plant biomass, explaining 60–61% total variation, lowest on powdery mildew and standing ability (3%). G × E interaction for broomrape per plant was highest (33%) followed by grain yield (23%) and plant biomass (22%) (Figure 1). When fitting the HA-GGE model, the first two PCs, explained from 74% (for seed yield) to 97% (for powdery mildew) of total G + GE interaction, and (G + G × E)/(E + G + G × E) yielded a value from 38% (dry biomass) to 96% (%powdery mildew). This fulfilled the requirements of Yang et al. [33], who established that for a biplot to be useful, the first two PCs should be higher than 60% and (G + G × E)/(E + G + G × E) ratio should be higher than 10% (Table S2).
Grain yields are shown in Table 3. Global average for grain yield over environments and accessions was 3248 kg ha−1. Average yield over environments was highest for breeding lines NS22 (4593 kg ha−1) and NS34 (4445 kg ha−1), being superior than all studied cultivars, of which the best overall yielders were Messire (3572 kg ha−1) and Kayanne (3403 kg ha−1) and the worst ones Babieca (2081 kg ha−1), Enduro (2313 kg ha−1) and Cartouche (2360 kg ha−1). Average yield over accessions was highest at Pu-18 (4939 kg ha−1), Pu-19 (4726 kg ha−1) and Pu-20 (4696 kg ha−1), the environments with lowest broomrape infection, whereas was lowest at Co-20 (1437 kg ha−1) and Al-20 (1488 kg ha−1), the two environments with highest broomrape infection. In fact, grain yield was highly correlated (negatively) with broomrape infection over environments (r = −0.97, p < 0.0001).
The GGE biplot was used to study the performance of genotypes in each environment (Figure 2, Figure 3, Figure 4, Figure 5, Figure 6, Figure 7 and Figure 8). The biplots showed different groups of environment vectors positively correlated due to an acute angle. The presence of this close association among the test environments suggested that the same information about the genotype could be obtained from each group of test environments. Distinctive groups of environments we identified. In group 1 (Pu-18, Pu-19, Pu-20 and Al-18) are the environments in which highest seed yield and crop biomass were obtained, that coincided with the ones with the lowest broomrape infection. In group 2 are the remaining environments, which are those with higher broomrape (Figure 2 and Figure 7).
Biplots allow the comparison among accessions in terms of performance and dynamic stability for each trait assessed. Figure 2 shows, at the right of TEAo, the genotypes yielding above the average, with breeding lines NS22 and NS34 as the accessions with the highest seed yield (right corners of the polygon, higher projection on TEAa to the right). Breeding lines NS8, NS39 and NS35 were more dynamically stable over environments (closer to TEAa) and still yielding above the average (to the right of TEAo). On the contrary, lines J20, J4 and NS16 showed a more static stability for grain yield (as shown by the lowest S2xi values (Table 3)), but they were stable over environments in having low yields, which is of little interest to us. Breeding lines NS34, NS21 and NS83 performed well in the environments with more broomrape. Figure 2 also shows cvs. Messire, Kayanne and Chicarrón (green intermittent circle) yielding slightly over the average, yielding better in the environments with low broomrape infection (indicated by their proximity to vectors Pu-18 and Pu-19). Cultivars Cartouche, Enduro and Babieca and breeding line NS16 (solid yellow circle) yielded poorly. Breeding lines J4, J20 and NS20 and the other lines in the orange intermittent circle yielded below the average, although they performed slightly better in environments with a high broomrape infection.
Dry crop biomass at harvest before seed threshing is provided in Table S3. Average plant biomass over environments was again highest for breeding line NS22 (9502 kg ha−1). This was closely followed by breeding lines NS35 and NS36 (>8500 kg ha−1), and NS21, NS34, NS27 and NS81 (>8200 kg ha−1). Commercial cultivars gave only moderate dry crop biomass, in the range of 5594 (Enduro) to 7164 kg ha−1 (Kayanne). The average for plant biomass over accessions was highest at Pu-18 (10,819 kg ha−1) and Pu-19 (10,484 kg ha−1), the two environments with no broomrape infection, whereas was lowest was at Co-20 (3383 kg ha−1) and Al-20 (4628 kg ha−1), the two environments with the highest broomrape infection.
Figure 3 shows a similar picture of dry crop biomass at harvest before seed threshing. Accessions to the right of TEAo (green circle) are the ones with higher biomass, the more to the right (NS22, NS35, NS36, NS21) are the higher biomass, and the closer to TEAa (NS35, NS81), the more dynamically stable. Lines J4, J20 and NS1 were more statically stable showing the lowest environmental variance (Table S3), although their yield biomass was poor. Breeding lines NS21, NS36, NS27, NS82 and NS83 outstood in the environments with more broomrape. Cultivars Chicarrón, Messire and Kayanne yielded moderately, just on the average (close to TEAo), but with little dynamic stability (far from TEAa), performing better at Pu-18 and Pu-19, the environments with a lower broomrape infection.
As seen is Table S4, breeding lines can be grouped according to flowering date into early (<105 dtf; including lines J20, NS1, J4, NS39, NS34, NS33, NS8 and NS20, similar to cvs. Messire and Kayanne), intermediate (105–110 dtf; including lines NS24 and NS47, similar to cvs. Chicarrón and Enduro) and late (>110 dtf, including lines NS16, NS83, NS21, NS35, NS27, NS81, NS22, NS36 and NS82, similar to cvs. Babieca and Cartouche). Dtf was not correlated with grain yield and broomrape infection, but was correlated with powdery mildew infection (r = 0.63, p < 0.001). This continuous gradation in flowering time is also shown by Figure 4 with the earlier accessions to the left, being rather dynamically stable over the environments. Only for the later accessions was there an environmental effect associated with the year.
The average crop stature (Table S5) varied largely among breeding lines, with J4, NS47 and J20 being particularly short (<50 cm), whereas most lines were in the range of the check cultivars (65–82 cm) or even taller, with NS81, NS82, NS36, NS35, NS83 and NS27 having an average stature in the range of 85–91 cm. Confirming data on Table S5, Figure 5 shows a continuous variation for crop stature, with J4, NS47 and J20 being by far the shorter accessions (yellow circle). Breeding lines NS35, NS36, NS83, NS27 and NS82 (green circle) maintained a higher crop stature, followed by NS81 and NS34. Check cultivars Kayanne, Chicarrón and Babieca performed slightly over the average but with little dynamic stability (far from TEAa), performing better in the environments with low broomrape.
“Normal leaf” accessions (lines J4 and J20, and cv. Messire) suffered from poor standing ability and were among those with worse crop appearance (<3) (Table S6). This was also rather poor (<3) for cv. Babieca and for semi-leafless breeding lines NS47, NS24, NS34, NS33 and NS1). Apart from these lines, the crop aspect of remaining breeding lines was similar to that of the best cvs. (Enduro, Kayanne and Chicarrón, 3.4–3.9) or even better (>4.2, for lines NS81, NS36, NS21, NS27, NS35, NS83, NS39 and NS22). Figure 6 shows the HA-GGE biplot for crop appearance, with lines to the right of TEAo showing better appearance. Breeding lines NS81, NS36, NS35, NS21, NS83 and NS22 (green circle) were the lines with the best and dynamically stable appearance. Breeding line NS27 also showed a good aspect, but was less stable. Cultivars Kayanne, Cartouche, Chicarrón and Enduro showed an overall good appearance, but was less stable over environments, performing better in the environments with a low broomrape infection. Lines J4, J20, NS47 and cvs. Babieca and Messire (yellow circle) showed the worst crop appearance.
The level of O. crenata infection varied among environments (Table 4). In fact, sites were selected based on their history of broomrape infestation in the soil, known to be high at Al- and CO- and low at Pu-. In addition to broomrape seed bank in the soil, broomrape infection is affected by environmental conditions. As a result, infection was highest at Al-20 and Co-20 with average 1.24 and 1.14 O. crenata emerged per plant (Oc/pl). It was moderate at C0-18 and Co-19 (with 0.57 and 0.68 Oc/pl, respectively), low at Al-18, Al-19 and Pu-20 (0.24, 0.35 and 0.14 Oc/pl, respectively) and absent at Pu-18 and Pu-19. Overall, broomrape infection of accessions over environments was high (>0.9 broomrapes per pea plant) for all check cultivars studied, and ranged from very low (<0.3, lines NS22, J4, NS16, J20, NS33, NS27 and NS81) to moderate (0.3–0.42, NS39, NS20, NS36, NS21, NS8, NS24, NS47, NS34, NS35, NS82, NS1 and NS83) for the breeding lines. Figure 7 shows, on the left of TEAo, the lines with the lowest broomrape infection. NS22 showed the lowest level infection across the environments (further to TEAo on the left). All other breeding lines (green circle, left of TEAo) also showed broomrape infection below the average, being the ones closer to TEAa more dynamically stable across environments (J4, NS33, NS39, NS36), and those with lower S2xi (Table 4, NS22, J4, NS16, NS33), the more statically stable. On the contrary, all tested cvs. (yellow circle) were at the right of TEAo, indicative of high broomrape infection.
Powdery mildew and ascochyta blight were the only fungal diseases observed on the plots. Heavy powdery mildew infection was observed at all environments (Table S7). Although infections appeared rather late in the growth cycle, they reached very high levels in all the environments. The response of all studied lines was very clear cut and constant among environments, the accessions being either very highly infected (all check cvs. and most breeding lines, with accession disease severity (DS) averages >90%, over environments) or very low (breeding lines NS1, NS8, NS20, NS34, NS47 and J20 (DS < 5%). Figure 8 shows two clear groups for powdery mildew infection, the resistant lines (NS47, NS1, NS20, NS8, J20 and NS34) to the left of TEAo indicative of low infection (green circle) and the remaining ones to the right (yellow circle). The response to powdery mildew was quite stable over the environments for most lines (close to TEAa).
Ascochyta blight occurred only during 2018, being negligible in 2019 and 2020. The average infection during spring 2018 varied from low to high both in breeding lines and check cultivars (Table S8), being higher (>40% leaf canopy covered with lesions) on breeding lines J20 and J4 and on cv. Messire, the ones with normal leaf and therefore with a lower standing ability and worse crop appearance. Ascochyta blight severity was highly negatively correlated with crop stature (r = −0.75, p < 0.0001) and crop appearance (r = −0.79, p < 0.0001).

3.1. Multi-Trait Stability Index (MTSI)

Simultaneous selection for performance and stability was performed by using the weighted average of absolute scores and a response variable (WAASBY) index. We assigned a weight of 70% to the mean response, and consequently 30% for the stability (70–30) for grain yield, dry biomass, number of broomrape per plant and crop appearance. The use of an MTSI index [29] (the lower the index, the better the genotype) allowed selecting breeding lines NS81, NS21, NS35, NS83, NS22 and NS82 as the best genotypes in the environments evaluated by employing information from a set of four traits (Figure 9), establishing 1.35 as the critical value (see Table S9) for a 25% intensity of selection. All breeding lines gave a lower index than the check cultivars.
One principal component was retained, and the accumulated variance in this component was 60.3% (data not shown). After varimax rotation factorial loadings obtained in the factor analysis, were −0.85 (Grain Yield), −0.96 (Dry Biomass), −0.45 (Broomrapes per plant) and −0.75 (Crop appearance). The values of WAASBY in each one of the 4 traits were grouped in one factor (FA1) (Table 5 and Table S10). The selection practiced in Figure 9 was used as a basis to estimate a series of genetic parameters for each analyzed trait considering a selection index of 25%, as shown in Table 5. For plant desirable traits, the six selected genotypes (XS) gave higher values than the original average (XO), which includes all 25 genotypes in six environments. These values were lower for the undesirable trait broomrape infection. The magnitude of this increment is given by SD. The heritability values were higher than 75%, indicating success with superior genotype selection for all evaluated traits. The genetic gain was always positive, ranging from 16.43% for grain yield to 26.93% for crop appearance, revealing the feasibility of obtaining gain with selection on all traits measured.

3.2. Correlations between Traits and Non-Metric Multi-Dimensional Scaling Ordination (NMDS)

Grain yield was highly correlated (Table 6) with dry biomass, and they both were highly correlated positively with crop appearance, and negatively with broomrape infection. They both were not, or slightly correlated with dtf, crop stature, powdery mildew and ascochyta blight infection. Dtf was correlated positively with crop stature and powdery mildew infection, and negatively with ascochyta blight.
The influence of environmental factors on broomrape infection and on grain yield was studied by non-metric multi-dimensional scaling ordination (NMDS) analysis (Figure 10 and Figure 11). Biplots gave a stress value of 0.022 and 0.053 for broomrape infection and grain yield, respectively, indicative of an excellent fit [31], which allowed a nice separation of the environments with a clear gradation fitting level of each trait. Figure 10 shows the influence of climatic variables on broomrape infection. Environments to the left (coordinate 1) are those with the highest broomrape infection. Length and direction of the vectors indicate their influence on broomrape infection. The longer the vector, the bigger the influence on infection, being negative when pointing down or positive when pointing up. Like this, broomrape infection is enhanced by mild winter temperatures before flowering (higher PreTMin and PreTAve) and spring rain (higher PostRain and PostH), whereas high spring temperatures hamper broomrape development.
Figure 11 shows the combined effect of climatic parameters (green vectors) and traits assessed (blue vectors) on grain yield. Coordinate 1 separates the environments with higher average grain yields (Pu-18, Pu-19, Pu-20) to the right and those with lower yields (Co-18, Co-19, Co20, Al-20) to the left. Length and direction of the vectors indicate their negative (pointing left) or positive (pointing right) influence on yield, the longer the vector, the bigger the influence. Like this, the traits with the largest effect on grain yield are broomrape infection (negative effect, long blue vector to the left) and crop appearance and biomass (positive effects, long blue vectors to the right). Powdery mildew infection and dtf limited yields are less influential. Higher plant stature was also beneficial, but to a lesser extent. Climatic factors had contradictory effects on the various traits, with spring rain favoring broomrape (Figure 10) and hampering crop appearance (not shown), and thus, being negative to the yield, are contrary to what would be expected. Environments to the left (lower yields: Co-18, Co-19, Co-20, Al-20) are close to the coordinate 2 origin, indicating a lower influence of climatic parameters, whereas those to the right (higher yield) are clearly separated by coordinate 2, with Pu-19 and Pu-20 up and Pu-18 down. At Pu-19 and Pu-20, the climatic parameters having a higher influence (longer green vectors) on grain yield were the temperatures during the vegetative and flowering stage (PreTmax and FlowTMax) and radiation at flowering. At Pu-18, rain and mild minimum temperatures were more influential on the yield.

4. Discussion

Pea is the temperate grain legume most cultivated in Europe, and the second most in the world after chickpea. However, pea is less cultivated in the Mediterranean Basin and the Near East, which is somehow surprising as this is the primary center of diversity for pea, where wild forms of P. fulvum and P. sativum ssp. elatius can still be found growing today [34]. An explanation for this might be in the poor adaptation of modern cultivars to Mediterranean environments as a result of little breeding efforts and the largest modern pea breeding programs targeted at other environments [8,35]. In spite of this current neglect, there is huge potential for pea revalorization in Mediterranean agriculture; both for dry and green pea, but efforts are needed for adjusting agronomic practices and developing cultivars specifically adapted to Mediterranean constraints. Such an increase in pea production could contribute to alleviate the inability of local forage and feed production to keep pace with the increasing demand, leading to alarming levels of feed imports.
As with any other crop, pea can be constrained by a number of pests and diseases, whose incidence and relative importance varies with the agroecological conditions and cropping practices [6,35]. The Mediterranean Basin and Middle East are peculiar for the widespread occurrence of the weedy root parasite broomrape (Orobanche crenata), which is the greater constraint for pea cultivation in the region [36]. In fact, we found broomrape infection to be the factor with the greatest (negative) effect on grain yield. In spite of this burden for pea in Mediterranean environments, little attention has been paid to broomrape resistance in pea, as O. crenata is so far not a problem for other pea-growing areas. However, O. crenata is expanding into southern African areas such as Ethiopia and Sudan, and into northern European areas such as Central Spain or even South-Eastern England [37,38,39]. Modelling studies [40] suggest that climatically suitable regions for the establishment of O. crenata include all Mediterranean climate areas and part of the monsoon, savanna and winter-dry climate regions at all the continents, which can be enlarged with predicted global warming. This reinforces the need to monitor its spread and to integrate resistance breeding to management packages in affected areas. Moreover, areas not yet affected should consider starting pre-emptive breeding as a cost-effective way to manage the potential incursions of broomrape.
Little genetic resistance is available within the current cultivars but is available in landraces and wild Pisum [9,11,41]. By crossing and selection, this resistance was efficiently incorporated into advanced breeding lines [12,13], which still suffered from relatively poor standing ability and a low yield. These deficiencies, which we addressed in the last years, and the resulting breeding lines are presented here.
In the Mediterranean basin, early maturity is commonly regarded as a desirable trait favoring escape to terminal drought and to broomrape infection. Conversely, precocity might limit the potential yield in optimal growing conditions [9,35]. In the absence of resistance cultivars, early sowing or the use of early cultivars are among the few recommendations we can make to farmers to reduce broomrape infection in most legume crops [9,22,42,43,44]. The fact that in our study precocity was not correlated with broomrape infection confirms that the reduced infection was due to true resistance and not just to escape due to precocity. Having a range of broomrape resistant lines of all maturity types, from very early to very late offers alternatives to farmers to adjust the growing cycle profiting from the long growth cycle when needed.
In addition to the host, the infection severity of broomrape strongly depends on parasitic seedbank density and on environmental factors. In fact, thermal time has been proposed as a tool for predicting broomrape growth and establishment [45,46]. We found that mild temperatures and rain were the climatic factors most influential on broomrape infection. Mild temperatures before crop flowering enhance broomrape seed germination and establishment, and rain and fresh temperatures at spring rain allows broomrape development and emergence [46,47].
Existing genetic studies are limited to a single bi-parental RIL population in which the resistant parent was P. sativum ssp. syriacum P665 [14]. This study pointed towards quantitative inheritance governed by several QTLs of a rather small effect, which precluded the development of the markers to be used in Marker Assisted Selection (MAS). Still, by classical field selection from crosses with resistant landraces, we succeeded in selecting before 2010 a number of resistant lines [9,12,13] that over-yielded the parent pea cultivar when broomrape infection was high. However, standing ability was not good enough, and in the absence of broomrape infection, those lines did not outstand. In fact, the best of such breeding lines were J4 and J20, included in the current study that were indeed among the most resistant ones, but were only moderate in terms of yield. In order to improve agronomic performance, the previously identified resistant lines were crossed with elite cultivars and selected for resistance and standing ability and yield over several seasons. We succeeded in selecting the new breeding lines (NS-numbers) described here that clearly over-yielded the check cultivars and the previous breeding lines (J4 and J20). No genetic study has so far been performed including the major donors of the resistance described here. It will be interesting to develop RIL from crosses involving the most resistance donor P. sativum ssp. sativum Ps624 and P. fulvum Pf660, among others. We are currently studying the response to O. crenata of a pea panel consisting of 320 accessions from worldwide origins, including all pea subspecies, to be used in Genome-Wide Association Analysis. Hopefully this will deliver molecular markers that will speed-up resistant breeding. We are also starting the development of a Nested Association Mapping Population [48], aiming to estimate wild allele effects in adapted backgrounds.
The situation is similar for faba bean (Vicia faba L.) in which a number of studies have reported quantitative inheritance governed by a number of QTLs explaining rather little phenotypic variation [49] and therefore not yet used in MAS, which has retarded, but not prevented, efficient breeding and release of resistant cultivars. In spite of those reports, resistant breeding lines have been effectively selected [50,51]. In addition, resistance based on low germination induction of broomrape seed germination has been identified [52], which might be of simple inheritance [39]. Such a trait was already shown to be relevant for the success of sorghum breeding for resistance to Striga hermonthica [53] and is controlled by a single recessive gene [54]. This “low germination induction” trait is not present in the progenies [13] from which the advanced pea breeding lines described here originated, but is available in other germplasms [42,55] and might have a single genetic control [39,56], which would facilitate the incorporation of the trait into the breeding program.
Resistance to powdery mildew appeared clear-cut, with lines being either very susceptible or very resistant, with no intermediate instances. Among the susceptible accessions (which included all checks cvs. studied), the ones with a longer growth cycle suffered higher infection as expected, as early sowings and the use of early cultivars is a widely adopted practice to escape from powdery mildew infection [19]. In spite of the high levels of powdery mildew infections suffered at all sites, this had limited effect on grain yield, probably because infection occurred rather late, with the pod already maturing. Still, care should be taken in monitoring infection and the eventual need for chemical control. The availability of highly resistant lines offers an alternative in powdery mildew-prone environments. We did not attempt to discern the genetic basis of the resistance to powdery of the reported accessions, but it is worth noticing that all resistant lines derive from crosses involving the resistant P. fulvum Pf660 carrying Er3 gene [57]. We cannot exclude the occurrence of the er1 gene in some of the lines, as it has been postulated in some of the parental lines in their pedigree. This deserves further attention, as combining resistances that act as limiting the colony establishment (typical of er1 gene) [58] with a hypersensitive response (typical of Er3 gene) [19,57] would provide a double barrier to powdery mildew likely to enhance the durability of the resistance offered by either gene alone.
Only moderate levels of incomplete resistance of polygenic inheritance are available in pea against ascochyta blight [15,16,59]. Therefore, a promising strategy might be to combine the available moderate levels of resistance with changes in plant architecture that hamper fungal progress. This can be achieved by selecting for semi-leafless and strong-stemmed genotypes whose open canopy helps to reduce secondary infections and overall disease severity [16,60]. Improved standing ability is therefore a major goal of any pea breeding program. More upright crops tend to result in a less conducive environment for ascochyta development, but also, and more importantly, facilitate harvest [60]. Ascochyta blight was recorded only in the 2018 season and was therefore not included in most of the analysis. However, it was possible to observe some tendencies, allowing discrimination among accessions with high and moderate infection. Accessions with normal leaf type (J4, J20 and Messire) suffered higher ascochyta blight severity than semi-leafless accessions (remaining ones) because of their lower standing ability.
Simultaneous selection for stability and mean performance on all assessed traits based on MTSI calculations [29] pointed NS81, NS21, NS35, NS83, NS22 and NS82 as the breeding lines closer to the ideotype for the four traits with the higher influence on yield. This index is useful to discern the stability of all traits combined, allowing the weighting performance and stability of each trait. However, we missed the possibility of weighting the relative influence of each particular trait. In our experiments, crop appearance had a much greater effect on yield than precocity, for instance, and broomrape than powdery mildew infection. It is therefore up to the breeder to complement the information on stability and mean performance of all the traits provided by MTSI with the relative weight of each trait for specific needs.
The value of farmer acceptability scores in pea breeding has recently been shown [61]. This is online, with our results showing the value of incorporating the farmer’s appreciation-derived traits in selection. After consultations with farmers, we adopted a rather subjective assessment of combined standing ability and biomass that we called “crop appearance”. According to our results, a simple visual estimation of crop appearance at the pod maturing stage turned out to be very easy to asses and was highly correlated with yield, which was the most effective in selection.
The accelerated progress in the genomic and biotechnological research currently happening in pea [34,62,63], will soon facilitate gene discovery and the development of breeder’s friendly molecular markers allowing efficient marker assisted selection, as has already been achieved in sunflower breeding for O. cumana resistance [64]. We are hungry to apply these developments into pea breeding for O. crenata resistance. Meanwhile, we progressed in identifying a range of sources of resistance and in introducing them into adapted pea backgrounds by sexual crossing and yearly field selection.

Supplementary Materials

The following are available online at https://www.mdpi.com/article/10.3390/agronomy11040769/s1, Table S1. Climate variables including: maximum temperature (Tmax), minimum temperature (Tmin), average temperature (TAve), maximum humidity (Hmax), minimum humidity (Hmin), average humidity (HAve), Radiation (Rad), rain and Evapotranspiration (ETo) during different growing stages pre-flowering (Pre), flowering (Flow) and post-flowering (Post) characterizing the 9 environments (combination of location and season) of the trials. Table S2. Genotype (G), field-year environment (E) and genotype by field-year environment interaction (G*E) terms for grain yield, number of broomrapes per plant, days to flowering, biomass, plant height, powdery mildew percentage, and standing ability for the winter pea performance trials, from 2018 to 2020. Table S3. Mean dry crop biomass at harvest (kg ha−1), of 19 breeding lines and 6 check cultivars grown at 9 location–year environments. Table S4. Mean flowering date (dtf) of 19 breeding lines and 6 check cultivars grown at 9 location–year environments. Table S5. Crop stature (cm) of 19 pea landraces and 6 check cultivars grown at 9 location–year environments. Table S6. Crop appearance (1–5 scale) of 19 pea landraces and 6 check cultivars grown at 6 location–year environments. Table S7. Mean percentage of powdery mildew (%) of 19 pea breeding lines and 6 check cultivars grown at 9 location–year environments. Table S8. Mean percentage of ascochyta blight (%) of 14 pea breeding lines and 4 check elite cultivars accessed at 3 locations during 2017–2018 season. Table S9. Multitrait stability index. Table S10. Scores factor analysis for genotypes-ideotypes.

Author Contributions

D.R., M.J.G.-B., S.O.-C. and M.J.C. designed and performed the trials; D.R. and F.F. analyzed the data. D.R. wrote the manuscript. All authors have read and agreed to the published version of the manuscript.

Funding

This research was funded by the Spanish Agencia Estatal de Investigación (AEI) grant AGL2017-82019.

Institutional Review Board Statement

Not applicable.

Informed Consent Statement

Not applicable.

Acknowledgments

The authors are deeply indebted to the late Anita Moral, whose enthusiasm was crucial to the success of the breeding and selection program.

Conflicts of Interest

The authors declare no conflict of interest.

References

  1. Stagnari, F.; Maggio, A.; Galieni, A.; Pisante, M. Multiple benefits of legumes for agriculture sustainability: An overview. Chem. Biol. Technol. Agric. 2017, 4, 2. [Google Scholar] [CrossRef] [Green Version]
  2. Guinet, M.; Nicolardot, B.; Voisin, A.S. Nitrogen benefits of ten legume pre-crops for wheat assessed by field measurements and modelling. Eur. J. Agron. 2020, 120, 126–151. [Google Scholar] [CrossRef]
  3. FAOSTAT 2020. Available online: http://www.fao.org/faostat (accessed on 4 February 2021).
  4. Tulbek, M.C.; Lam, R.S.H.; Wang, Y.C.; Asavajaru, P.; Lam, A. Chapter 9—Pea: A Sustainable Vegetable Protein Crop. In Sustainable protein sources; Nadathur, S.R., Wanasundara, J.P.D., Scanlin, L., Eds.; Academis Press: Cambridge, MA, USA, 2017; pp. 145–164. [Google Scholar] [CrossRef]
  5. Parihar, A.K.; Dixit, G.P.; Bohra, A.; Gupta, D.S.; Singh, A.K.; Kumar, N.; Singh, D.; Singh, N.P. Genetic Advancement in Dry Pea (Pisum sativum L.): Retrospect and Prospect. In Accelerated Plant Breeding; Gosal, S.S., Wani, S.H., Eds.; Springer Nature: Cham, Switzerland, 2020; Volume 3. [Google Scholar] [CrossRef]
  6. Rubiales, D.; Fondevilla, S.; Chen, W.; Gentzbittel, L.; Higgins, T.J.V.; Castillejo, M.A.; Singh, K.B.; Rispail, N. Achievements and challenges in legume breeding for pest and disease resistance. Crit. Rev. Plant Sci. 2015, 34, 195–236. [Google Scholar] [CrossRef] [Green Version]
  7. Neugschwandtner, R.W.; Bernhuber, A.; Kammlander, S.; Wagentristl, H.; Klimek-Kopyra, A.; Kaul, H.P. Yield structure components of autumn- and spring-sown pea (Pisum sativum L.). Acta Agric. Scand. Sect. B—Soil Plant Sci 2020, 70, 109–116. [Google Scholar] [CrossRef]
  8. Rubiales, D.; Fernández-Aparicio, M.; Moral, A.; Barilli, E.; Sillero, J.C.; Fondevilla, S. Disease resistance in pea (Pisum sativum L.) types for autumn sowings in Mediterranean environments. Czech. J. Genet. Plant Breed. 2009, 45, 135–142. [Google Scholar] [CrossRef] [Green Version]
  9. Rubiales, D.; Fernández-Aparicio, M.; Pérez-De-Luque, A.; Castillejo, M.A.; Prats, E.; Sillero, J.C.; Rispail, N.; Fondevilla, S. Breeding approaches for crenate broomrape (Orobanche crenata Forsk.) management in pea (Pisum sativum L.). Pest. Manag. Sci. 2009, 65, 553–559. [Google Scholar] [CrossRef] [PubMed]
  10. Rubiales, D.; Fernández-Aparicio, M. Innovations in parasitic weeds management in legume crops. A review. Agron. Sustain. Dev. 2011, 32, 433–449. [Google Scholar] [CrossRef]
  11. Rubiales, D.; Moreno, M.T.; Sillero, J.C. Search for Resistance to Crenate Broomrape (Orobanche crenata Forsk.) in Pea Germplasm. Genet. Resour. Crop Evol. 2005, 52, 853–861. [Google Scholar] [CrossRef]
  12. Fondevilla, S.; Flores, F.; Emeran, A.A.; Kharrat, M.; Rubiales, D. High productivity of dry pea genotypes resistant to crenate broomrape in Mediterranean environments. Agron. Sustain. Dev. 2017, 37, 61. [Google Scholar] [CrossRef] [Green Version]
  13. Rubiales, D.; Fondevilla, S.; Fernández-Aparicio, M. Development of Pea Breeding Lines with Resistance to Orobanche crenata Derived from Pea Landraces and Wild Pisum spp. Agronomy 2021, 11, 36. [Google Scholar] [CrossRef]
  14. Fondevilla, S.; Fernández-Aparicio, M.; Satovic, Z.; Emeran, A.A.; Torres, A.M.; Moreno, M.T.; Rubiales, D. Identification of quantitative trait loci for specific mechanisms of resistance to Orobanche crenata in pea. Mol. Breed. 2010, 25, 259–272. [Google Scholar] [CrossRef] [Green Version]
  15. Rubiales, D.; Fondevilla, S. Future prospects for ascochyta blight resistance breeding in cool season food legumes. Front. Plant Sci. 2012, 3, 1–5. [Google Scholar] [CrossRef] [PubMed] [Green Version]
  16. Khan, T.; Timmerman-Vaughan, G.; Rubiales, D.; Warkentin, T.; Siddique, K.; Erskine, W.; Barbetti, M. Didymella pinodes and its management in field pea: Challenges and opportunities. Field Crop Res. 2013, 148, 61–77. [Google Scholar] [CrossRef] [Green Version]
  17. Iglesias-García, R.; Prats, E.; Fondevilla, S.; Satovic, Z.; Rubiales, D. Quantitative Trait Loci Associated to Drought Adaptation in Pea (Pisum sativum L.). Plant Mol. Biol. Rep. 2015, 33, 1768–1778. [Google Scholar] [CrossRef] [Green Version]
  18. Tiwari, K.R.; Penner, G.A.; Warkentin, T.D. Inheritance of powdery mildew resistance in pea. Can. J. Plant Sci. 1997, 77, 307–310. [Google Scholar] [CrossRef] [Green Version]
  19. Fondevilla, S.; Rubiales, D. Powdery mildew control in pea. A review. Agron. Sustain. Dev. 2011, 32, 401–409. [Google Scholar] [CrossRef] [Green Version]
  20. Yan, W.; Holland, J.B. A heritability-adjusted GGE biplot for test environment evaluation. Euphytica 2009, 171, 355–369. [Google Scholar] [CrossRef] [Green Version]
  21. Flores, F.; Nadal, S.; Solis, I.; Winkler, J.; Sass, O.; Stoddard, F.L.; Link, W.; Raffiot, B.; Muel, F.; Rubiales, D.; et al. Faba bean adaptation to autumn sowing under European climates. Agron. Sustain. Dev. 2012, 32, 727–734. [Google Scholar] [CrossRef] [Green Version]
  22. Iglesias-García, R.; Prats, E.; Flores, F.; Amri, M.; Mikić, A.; Rubiales, D. Assessment of field pea (Pisum sativum L.) grain yield, aerial biomass and flowering date stability in Mediterranean environments. Crop Pasture Sci. 2017, 68, 915–923. [Google Scholar] [CrossRef] [Green Version]
  23. Rubiales, D.; Emeran, A.A.; Flores, F. Adaptation of Grass Pea (Lathyrus sativus) to Mediterranean Environments. Agronomy 2020, 10, 1295. [Google Scholar] [CrossRef]
  24. RAEA. Resultados de Ensayos de Variedades de Guisantes Proteaginosos en Andalucía. Campaña 2014/2015. 2015. Available online: File:///E:/Descargas/RAEA%20Resultados%20guisantes%2014-15%20 (accessed on 21 December 2020).
  25. Red de Información Agroclimática de Andalucía (RIA). Available online: https://www.juntadeandalucia.es/agriculturaypesca/ifapa/riaweb/web/ (accessed on 21 December 2020).
  26. McIntosh, M.S. Analysis of combined experiments. Agron. J. 1983, 75, 153–155. [Google Scholar] [CrossRef]
  27. Aznar-Fernández, T.; Carrillo-Perdomo, E.; Flores, F.; Rubiales, D. Identification and multi-environment validation of resistance to pea weevil (Bruchus pisorum) in Pisum germplasm. J. Pest Sci. 2018, 91, 505–514. [Google Scholar] [CrossRef]
  28. Burgueño, J.; Crossa, J.; Vargas, M. SAS Programs for Graphing GE and GGE Biplots; CIMMYT: El Batan, Mexico, 2003. [Google Scholar]
  29. Olivoto, T.; Lúcio, A.D.C.; Da Silva, J.A.G.; Sari, B.G.; Diel, M.I. Mean Performance and Stability in Multi-Environment Trials II: Selection Based on Multiple Traits. Agron. J. 2019, 111, 2961–2969. [Google Scholar] [CrossRef]
  30. Olivoto, T.; Lúcio, A.D. metan: An R package for multi-environment trial analysis. Methods Ecol. Evol. 2020, 11, 783–789. [Google Scholar] [CrossRef]
  31. Kruskal, J.B. Multidimensional scaling by optimizing goodness of fit to a nonmetric hypothesis. Psychometrika 1964, 29, 1–27. [Google Scholar] [CrossRef]
  32. Hammer, Ø.; Harper, D.A.T.; Ryan, P.D. PAST: Paleontological statistics software package for education and data analysis. Palaeontol. Electron. 2001, 4, 1–9. [Google Scholar]
  33. Yang, R.-C.; Crossa, J.; Cornelius, P.L.; Burgueño, J. Biplot Analysis of Genotype × Environment Interaction: Proceed with Caution. Crop Sci. 2009, 49, 1564–1576. [Google Scholar] [CrossRef] [Green Version]
  34. Smykal, P.; Aubert, G.; Burstin, J.; Coyne, C.J.; Ellis, N.T.H.; Flavell, A.J.; Ford, R.; Hýbl, M.; Macas, J.; Neumann, P.; et al. Pea (Pisum sativum L.) in the Genomic Era. Agronomy 2012, 2, 74–115. [Google Scholar] [CrossRef]
  35. Rubiales, D.; González-Bernal, M.J.; Warkentin, T.; Bueckert, R.; VazPatto, M.C.; McPhee, K.; McGee, R.; Smýkal, P. CH20—Advances in breeding of peas. In Achieving Sustainable Cultivation of Vegetables; Hochmuth, G., Ed.; Burleig Dodds Science Publishing Limited: Cambridge, UK, 2019. [Google Scholar]
  36. Fernández-Aparicio, M.; Flores, F.; Rubiales, D. The Effect of Orobanche crenata Infection Severity in Faba Bean, Field Pea, and Grass Pea Productivity. Front. Plant Sci. 2016, 7, 1409. [Google Scholar] [CrossRef] [Green Version]
  37. Parker, C. Parasitic Weeds: A World Challenge. Weed Sci. 2012, 60, 269–276. [Google Scholar] [CrossRef]
  38. Parker, C. Orobanche crenata in UK—An update. Haustorium 2014, 65, 5–6. [Google Scholar]
  39. Rubiales, D. Can we breed for durable resistance to broomrapes? Phytopathol. Mediterr. 2018, 57, 170–185. [Google Scholar]
  40. Grenz, J.; Sauerborn, J. Mechanisms limiting the geographical range of the parasitic weed Orobanche crenata. Agric. Ecosyst. Environ. 2007, 122, 275–281. [Google Scholar] [CrossRef]
  41. Pérez-De-Luque, A.; Jorrín, J.; Cubero, J.I.; Rubiales, D. Orobanche crenata resistance and avoidance in pea (Pisum spp.) operate at different developmental stages of the parasite. Weed Res. 2005, 45, 379–387. [Google Scholar] [CrossRef]
  42. Pérez-De-Luque, A.; Sillero, J.C.; Moral, A.; Cubero, J.I.; Rubiales, D. Effect of sowing date and host resistance on the establishment and development of Orobanche crenata in faba bean and common vetch. Weed Res. 2004, 44, 282–288. [Google Scholar] [CrossRef]
  43. Rubiales, D.; Alcántara, C.; Pérez-De-Luque, A.; Gil, J.; Sillero, J.C. Infection of chickpea (Cicer arietinum) by crenate broomrape (Orobanche crenata) as influenced by sowing date and weather conditions. Agrononie 2003, 23, 359–362. [Google Scholar] [CrossRef]
  44. Fernández-Aparicio, M.; Flores, F.; Rubiales, D. Escape and true resistance to crenate broomrape (Orobanche crenata Forsk.) in grass pea (Lathyrus sativus L.) germplasm. Field Crops Res. 2012, 125, 92–97. [Google Scholar] [CrossRef]
  45. Moral, J.; Lozano-Baena, M.D.; Rubiales, D. Temperature and water stress during conditioning and incubation phase affecting Orobanche crenata seed germination and radicle growth. Front. Plant Sci. 2015, 6, 408. [Google Scholar] [CrossRef] [Green Version]
  46. Pérez-De-Luque, A.; Flores, F.; Rubiales, D. Differences in Crenate Broomrape Parasitism Dynamics on Three Legume Crops Using a Thermal Time Model. Front. Plant Sci. 2016, 7, 1910. [Google Scholar] [CrossRef] [PubMed] [Green Version]
  47. Rubiales, D.; Barilli, E.; Flores, F. Broomrape (Orobanche crenata) as a major constraint for grass pea (Lathyrus sativus) production in Mediterranean rain-fed environments. Agronomy 2020, 10, 1931. [Google Scholar] [CrossRef]
  48. Yu, J.; Holland, J.B.; McMullen, M.D.; Buckler, E.S. Genetic Design and Statistical Power of Nested Association Mapping in Maize. Genetics 2008, 178, 539–551. [Google Scholar] [CrossRef] [Green Version]
  49. Gutiérrez, N.; Palomino, C.; Šatović, Z.; Ruiz-Rodríguez, M.D.; Vitale, S.; Gutiérrez, M.V.; Rubiales, D.; Kharrat, M.; Amri, M.; Emeran, A.A.; et al. QTLs for Orobanche spp. resistance in faba bean: Identification and validation across different environments. Mol. Breed. 2013, 32, 909–922. [Google Scholar] [CrossRef]
  50. Maalouf, F.; Khalil, S.; Ahmed, S.; Akintunde, A.N.; Kharrat, M.; El Shama’A, K.; Hajjar, S.; Malhotra, R.S. Yield stability of faba bean lines under diverse broomrape prone production environments. Field Crops Res. 2011, 124, 288–294. [Google Scholar] [CrossRef]
  51. Rubiales, D.; Flores, F.; Emeran, A.A.; Kharrat, M.; Amri, M.; Rojas-Molina, M.M.; Sillero, J.C. Identification and multi-environment validation of resistance against broomrapes (Orobanche crenata and O. foetida) in faba bean (Vicia faba). Field Crops Res. 2014, 166, 58–65. [Google Scholar] [CrossRef] [Green Version]
  52. Fernández-Aparicio, M.; Moral, A.; Kharrat, M.; Rubiales, D. Resistance against broomrapes (Orobanche and Phelipanche spp.) in faba bean (Vicia faba) based in low induction of broomrape seed germination. Euphytica 2012, 186, 897–905. [Google Scholar] [CrossRef]
  53. Ejeta, G. Breeding for Striga Resistance in Sorghum: Exploitation of an Intricate Host-Parasite Biology. Crop Sci. 2007, 47, S216–S227. [Google Scholar] [CrossRef]
  54. Vogler, R.K.; Ejeta, G.; Butler, L.G. Inheritance of Low Production of Striga Germination Stimulant in Sorghum. Crop Sci. 1996, 36, 1185–1191. [Google Scholar] [CrossRef]
  55. Pavan, S.; Schiavulli, A.; Marcotrigiano, A.R.; Bardaro, N.; Bracuto, V.; Ricciardi, F.; Charnikhova, T.; Lotti, C.; Bouwmeester, H.; Ricciardi, L. Characterization of Low-Strigolactone Germplasm in Pea (Pisum sativum L.) Resistant to Crenate Broomrape (Orobanche crenata Forsk.). Mol. Plant-Microbe Interact. 2016, 29, 743–749. [Google Scholar] [CrossRef] [PubMed] [Green Version]
  56. Bardaro, N.; Marcotrigiano, A.R.; Bracuto, V.; Mazzeo, R.; Ricciardi, F.; Lotti, C.; Pavan, S.; Ricciardi, L. Genetic analysis of resistance to Orobanche crenata (Forsk.) in a pea (Pisum sativum L.) low-strigolactone line. J. Plant Pathol. 2016, 98, 671–675. [Google Scholar]
  57. Fondevilla, S.; Torres, A.M.; Moreno, M.T.; Rubiales, D. Identification of a New Gene for Resistance to Powdery Mildew in Pisum fulvum, a Wild Relative of Pea. Breed. Sci. 2007, 57, 181–184. [Google Scholar] [CrossRef] [Green Version]
  58. Iglesias-García, R.; Rubiales, D.; Fondevilla, S. Penetration resistance to Erysiphe pisi in pea mediated by er1 gene is associated with protein cross-linking but not with callose apposition or hypersensitive response. Euphytica 2015, 201, 381–387. [Google Scholar] [CrossRef] [Green Version]
  59. Carrillo, E.; Satovic, Z.; Aubert, G.; Boucherot, K.; Rubiales, D.; Fondevilla, S. Identification of quantitative trait loci and candidate genes for specific cellular resistance responses against Didymella pinodes in pea. Plant Cell Rep. 2014, 33, 1133–1145. [Google Scholar] [CrossRef]
  60. Banniza, S.; Hashemi, P.; Warkentin, T.D.; Vandenberg, A.; Davis, A.R. The relationships among lodging, stem anatomy, degree of lignification, and resistance to mycosphaerella blight in field pea (Pisum sativum). Can. J. Bot. 2005, 83, 954–967. [Google Scholar] [CrossRef]
  61. Annicchiarico, P.; Russi, L.; Romani, M.; Pecetti, L.; Nazzicari, N. Farmer-participatory vs. conventional market-oriented breeding of inbred crops using phenotypic and genome-enabled approaches: A pea case study. Field Crops Res. 2019, 232, 30–39. [Google Scholar] [CrossRef]
  62. Tayeh, N.; Klein, A.; Le Paslier, M.C.; Jacquin, F.; Houtin, H.; Rond, C.; Chabert-Martinello, M.; Magnin-Robert, J.B.; Marget, P.; Aubert, G.; et al. Genomic prediction in pea: Effect of marker density and training population size and composition on prediction accuracy. Front. Plant Sci. 2015, 6, 941. [Google Scholar] [CrossRef] [PubMed] [Green Version]
  63. Pandey, A.K.; Rubiales, D.; Wang, Y.; Fang, P.; Sun, T.; Liu, N.; Xu, P. Omics resources and omics-enabled approaches for achieving high productivity and improved quality in pea (Pisum sativum L.). Theor. Appl. Genet. 2021, 134, 755–776. [Google Scholar] [CrossRef]
  64. Cvejić, S.; Radanović, A.; Dedić, B.; Jocković, M.; Jocić, S.; Miladinović, D. Genetic and Genomic Tools in Sunflower Breeding for Broomrape Resistance. Genes 2020, 11, 152. [Google Scholar] [CrossRef] [PubMed] [Green Version]
Figure 1. Proportion of variance associated (Eta2 %) with genotype, environment and genotype by environment interaction and errors in ANOVA to general parameter variability in pea.
Agronomy 11 00769 g001
Figure 2. HA-GGE biplot based on the grain yield (kg ha−1) of 19 pea breeding lines and 6 check cultivars grown at 9 field-year environments, from 2018 to 2020.
Agronomy 11 00769 g002
Figure 3. HA-GGE biplot based on dry crop biomass at harvest (kg ha−1) of 19 pea accessions and 6 cultivars grown at 9 field-year environments, from 2018 to 2020.
Agronomy 11 00769 g003
Figure 4. HA-GGE biplot based on flowering date (dtf) of 19 pea accessions and 6 check cultivars grown at 9 field-year environments, from 2018 to 2020.
Agronomy 11 00769 g004
Figure 5. HA-GGE biplot based on crop stature (cm) of 19 pea breeding lines and 6 check cultivars grown at 9 field-year environments, from 2018 to 2020.
Agronomy 11 00769 g005
Figure 6. HA-GGE biplot based on crop appearance (1–5 scale) of 19 pea breeding lines and 6 check cultivars grown at 6 field-year environments, from 2019 to 2020.
Agronomy 11 00769 g006
Figure 7. HA-GGE biplot based on the number of broomrape per plant (Oc/pl) of 26 pea accessions grown at 9 field-year environments, from 2018 to 2020.
Agronomy 11 00769 g007
Figure 8. HA-GGE biplot based on powdery mildew infection (%) of 19 pea breeding lines and 6 check cultivars grown at 6 field-year environments, from 2018 to 2020.
Agronomy 11 00769 g008
Figure 9. Selected genotypes for the multi-trait stability index applied on traits assessed (grain yield, dry, biomass, crop appearance and broomrape infection considering a selection intensity of 25%.
Agronomy 11 00769 g009
Figure 10. NMDS analysis of climate variables including: maximum temperature (Tmax), minimum temperature (Tmin), maximum humidity (Hmax), minimum humidity (Hmin), accumulate Radiation (Ra), Evapotranspiration (ETo) and rain during different growing stages (pre-flowering (Pre), flowering (Flow), post-flowering (Post)) characterizing the nine environments used for phenotyping broomrape infection.
Agronomy 11 00769 g010
Figure 11. NMDS combined analysis of climate variables and traits assessed on grain yield.
Agronomy 11 00769 g011
Table 1. Breeding lines and check cultivars included in the study.
AccessionDerived from Cross * or ObtentorProgeny
Breeding linesJ4Ps624 × MessirePs624/Messire
J20[(Messire × Pf660) × Messire] × BalletMessire/Pf660//Ballet
NS1J20 × J23Messire/Pf660/Ballet//Ps624/Ps423/Radley
NS8[(3070 × J4) × (3054 × J20)] × ViriatoFranklin/Ps624/Messire//B99-100/Messire/Pf660/Ballet//Viriato
NS16J2 × CartouchePs624/Messire//Cartouche
NS203062 × J203062//Messire/Pf660/Ballet
NS213066 × J43066//Ps624/Messire
NS223066 × J43066//Ps624/Messire
NS24Baccara × J6Baccara//Ps565/Ps624
NS273066 × J43066//Ps624/Messire
NS33J4 × J23Ps624/Messire//Ps423/Radley
NS343064 × J203064//Messire/Pf660/Ballet
NS353066 × J43066//Ps624/Messire
NS363066 × J43066//Ps624/Messire
NS39(J4 × Baccara) × ChicarrónPs624/Messire/Baccara//Chicarron
NS47[3070 × (6NIL × Baccara)] × (J22 × RMS1)Franklin//6NIL/Baccara/Messire/Pf660/P665/RMS1
NS813071 × (6NIL × Baccara)Lifter//Messire/Pf660/Baccara
NS823066 × J43066//Ps624/Messire
NS833066 × J43066//Ps624/Messire/
Check cultivarsMessireSERASEM, France
KayanneMOMONT, France
ChicarrónITACyL, Spain
CartoucheSERASEM, France
EnduroFLORIM. D., France
BabiecaINIA, Spain
* J-number lines (i.e., J4, J20, J22, J23) were obtained before 2010 [12,13]; NS-number lines (i.e., NS1, NS8, etc.) were obtained after 2010.
Table 2. Description of the environments (combination of location and season) of the trials for the multi-environment study. Summary climatic data corresponding to each growing season are provided (more detailed data [25] are provided in Table S1).
EnvironmentsSeasonSite, Level of Broomrape (Oc) InfestationSoil TypeSoil pHOrganic Matter (g/100 g)Available Phosphorus (mg/kg)Average
Tmax (°C)
Average
Tmin (°C)
Rain
(mm)
Al-182017–2018Córdoba Almezos: high OcCambisol---19.87.6442
Al-192018–2019Córdoba Almezos: high OcCambisol7.51.215.021.66.4206
Al-202019–2020Córdoba Almezos: high OcCambisol---19.96.7362
Co-182017–2018Córdoba Cortijo: high OcCambisol---19.57.5441
Co-192018–2019Córdoba Cortijo: high OcCambisol7.51.215.122.26.3206
Co-202019–2020Córdoba Cortijo: high OcCambisol---20.16.6363
Pu-182017–2018Córdoba Puente: low OcVertisol---19.67.6441
Pu-192018–2019Córdoba Puente: low OcVertisol7.80.79.922.05.9129
Pu-202019–2020Córdoba Puente: low OcVertisol---20.06.7322
Table 3. Mean grain yield (kg ha−1) of 19 breeding lines and 6 check cultivars grown at 9 location–year environments.
AccessionAl-18Al-19Al-20Co-18Co-19Co-20Pu-18Pu-19Pu-20MeanSES2xi a
Breeding linesNS2248113693229241443077149473337933656045934635,098,509
NS3445524685313636563360284264305593575344452631,640,110
NS843874463156421933679211276106007479040894043,855,415
NS3942734627151628232542219266006239587040763843,579,527
NS3541232917237231243083190462675865558139153152,611,513
NS2142823611261835543572202739044669578637802651,203,486
NS8334983798248930412824196340945859567836942611,808,051
NS3332902763261633302531126256674392492334192931,850,394
NS2746433193187625223004130445963530569333743161,991,276
NS8131453874177624572925132022965757593332763482,677,509
NS3634983935172124412665157947152788503831532581,516,254
NS8229003256170525843097157125845633502531512651,872,430
NS4735783750164421372337181449124363306030662661,350,504
NS134373911179619962174181249523644349330242171,254,387
NS2034343712178819932362213449441887400729182361,288,321
NS24321830574721552314985443783468529728273142,536,403
J203484316921402009253021203904248234732812169496,512
J43271349926362074238014982459301538272740186540,092
NS1624442777604100312227622540197229571809183845,190
Check cultivarsMessire490529871801267211783279336126580035725217,383,456
Kayanne369033831282249275979451857208523034034275,044,151
Chicarrón35493643682494283790471805191392033104404,530,520
Cartouche3537250856127672212455144630287023603823,866,770
Enduro26342789497597336849304873327023133553,418,513
Babieca2607175281166169034825545026358020813002,477,425
Mean3647343014882322254414374939472646963248
SE95117147122948421521714269
a S2xi = environmental variance of genotypes, detects all deviations from the genotypic mean. A genotype with minimum variance under different environments is considered statically stable.
Table 4. Mean broomrape infection (Oc/plant) of 19 pea breeding lines and 6 check cultivars grown at 9 location–year environments.
AccessionAl-18Al-19Al-20Co-18Co-19Co-20Pu-18Pu-19Pu-20MeanSES2xi a
Breeding linesNS220.000.010.060.140.080.180.000.000.160.060.020.0056
J40.000.000.570.360.030.370.000.000.000.150.050.0495
NS160.050.030.780.470.200.210.000.000.080.200.050.0694
J200.100.011.150.120.030.410.000.000.010.200.070.1430
NS330.050.350.900.180.180.200.000.000.020.210.060.0809
NS270.000.051.380.210.200.240.000.000.040.230.080.1939
NS810.030.061.290.500.040.250.000.000.060.250.080.1792
NS390.140.051.040.140.071.170.000.000.060.300.090.2136
NS200.160.041.140.580.210.710.000.000.020.320.070.1629
NS360.040.010.860.160.151.560.000.000.140.320.110.2869
NS210.060.100.870.050.121.570.000.000.160.330.110.2905
NS80.150.071.370.440.280.850.000.000.100.360.090.2160
NS240.280.041.780.430.190.520.000.000.080.370.110.3152
NS470.240.271.200.660.190.820.000.000.060.380.080.1754
NS340.030.161.250.070.651.360.000.000.020.390.130.3093
NS350.180.260.920.130.131.710.000.000.150.390.120.3227
NS820.030.160.870.300.031.940.000.000.250.400.140.4096
NS10.280.021.770.700.120.740.000.000.040.410.110.3461
NS830.020.130.860.290.022.240.000.000.210.420.150.5405
Check cultivarsCartouche0.841.340.901.611.940.900.000.000.650.910.150.4331
Chicarrón0.210.881.810.602.562.420.000.000.190.960.211.0686
Babieca0.800.841.611.222.382.110.000.000.251.020.170.7725
Enduro0.471.561.882.062.801.470.000.000.281.170.221.0269
Kayanne1.071.831.951.492.082.120.000.000.181.190.190.8251
Messire0.840.572.721.572.332.410.000.000.261.190.211.1847
Mean0.240.351.240.570.681.140.000.000.140.48
SE0.040.070.070.060.110.110.000.000.020.03
a S2xi = environmental variance of genotypes.
Table 5. Estimates of the original mean (XO), mean of the selected genotypes (XS), selection differential (SD), the broad heritability (h2) and selection genetic gains (SG%) based on multi-trait stability and performance index applied on grain yield, dry biomass at harvest, crop appearance and broomrape infection (Oc/pl), evaluated in 25 pea genotypes in six environments (Al-19, Al-20, Co-19, Co-20, Pu-19 and Pu-20).
TraitFactorXOXSSDh2SG(%)
Grain yieldFA1305437096560.7616.43
Dry biomassFA16624837217480.7820.74
Crop appearanceFA13.334.270.930.9526.93
Broomrape infectionFA20.590.41−0.180.7723.13
Table 6. Pearson correlations among assessed traits.
Grain YieldDry BiomassDtfCrop StatureCrop Appearance #BroomrapePowdery MildewAscochyta Blight ##
Grain yield 0.9649 ***−0.09720.20560.8955 ***−0.9650 ***−0.1269−0.1772
Dry biomass 0.04260.16020.8052 ***−0.9115 ***−0.1304−0.6560 **
Dtf 0.5760 *−0.1314−0.07140.6284 **−0.8432 ***
Crop stature 0.3971−0.29990.3615−0.7356 ***
Crop appearance # −0.8858 ***−0.0482−0.7937 ***
Broomrape −0.06040.1012
Powdery mildew −0.5859 *
Ascochyta blight ##
# correlations with means for 2019 and 2020 seasons. ## correlations with means for only 2018 season and 18 lines. * Significant at the 0.05 level of probability; ** Significant at the 0.001 level of probability; *** Significant at the 0.0001 level of probability.
Publisher’s Note: MDPI stays neutral with regard to jurisdictional claims in published maps and institutional affiliations.

