
Identification of Superior Soybean Cultivars through the Indication of Specific Adaptabilities within Duo-Environments for Year-Round Soybean Production in Northeast Thailand


Abstract
1. Introduction
2. Materials and Methods
2.1. Plant Material and Experimental Design
2.2. Data Collection
2.3. Statistical Analysis
3. Results
4. Discussion
Author Contributions
Funding
Institutional Review Board Statement
Informed Consent Statement
Acknowledgments
Conflicts of Interest
References
- Dong, S.Y.; Zhuang, C.B.; Zhao, L.M.; Sun, H.; He, M.Y. The genetic diversity of annual wild soybeans grown in China. Theor. Appl. Genet. 2001, 103, 98–103. [Google Scholar] [CrossRef]
- Wen, Z.; Ding, Y.; Zhao, T.; Gai, J. Genetic diversity and peculiarity of annual wild soybean (Glycine soja Sieb. et Zucc.) from various eco-regions in China. Theor. Appl. Genet. 2009, 119, 371–381. [Google Scholar] [CrossRef] [PubMed]
- Guo, J.; Liu, Y.; Wang, Y.; Chen, J.; Li, Y.; Huang, H.; Qiu, L.; Wang, Y. Population structure of the wild soybean (Glycine soja) in China: Implications from microsatellite analyses. Ann. Bot. 2012, 110, 777–785. [Google Scholar] [CrossRef][Green Version]
- Lu, B.R. Conserving biodiversity of soybean gene pool in the biotechnology era. Plant Species Biol. 2004, 19, 115–125. [Google Scholar] [CrossRef]
- Adie, M.M.; Krisnawati, A. Soybean yield stability in eight locations and its potential for seed oil source in Indonesia. Energy Procedia 2015, 65, 223–229. [Google Scholar] [CrossRef]
- Polizel, A.C.; Juliatti, F.C.; Hamawaki, O.T.; Hamawaki, R.L.; Guimarães, S.L. Phenotypical adaptability and stability of soybean genotypes in the state of Mato Grosso. Bioscience 2013, 29, 910–920. [Google Scholar]
- Soares, I.O.; Bruzi, A.T.; Zambiazzi, E.V.; Guilherme, S.R.; Bianchi, M.C.; Silva, K.B.; Fronza, V.; Teixeira, C.M. Stability and adaptability of soybean cultivars in Minas Gerais. Genet. Mol. Res. 2017, 16, gmr16039730. [Google Scholar] [CrossRef] [PubMed]
- Susanto, G.W.A.; Adie, M.M. Adaptability of promising soybean lines at different environmental conditions. Penelit. Pertan. Tanam. Pangan 2010, 29, 166–170. [Google Scholar]
- Yothasiri, A.; Somwang, T. Stability of Soybean Genotypes in Central Plain Thailand. Kasetsart J. (Nat. Sci.) 2000, 34, 315–322. Available online: https://li01.tci-thaijo.org/index.php/anres/article/view/240321/163877 (accessed on 18 March 2021).
- Gurmu, F.; Mohammed, H.; Alemaw, G. Genotype X environment interactions and stability of soybean for grain yield and nutrition quality. Afr. Crop Sci. J. 2009, 17, 87–99. [Google Scholar] [CrossRef]
- Ramos Junior, E.U.; Brogin, R.L.; Godinho, V.P.C.; Botelho, F.J.E.; Tardin, F.D.; Teodoro, P.E. Identification of soybean genotypes with high stability for the Brazilian macro-region 402 via biplot analysis. Genet. Mol. Res. 2017, 16, gmr16039786. [Google Scholar] [CrossRef]
- Hamawaki, O.T.; Nogueira, A.P.O.; Teixeira, F.G.; Bicalho, T.F.; Jorge, G.L.; Hamawaki, R.L.; Machado Júnior, C.S.; Gomes, G.F.; Hamawaki, C.L. Adaptability and Stability of Soybean Genotypes in the States of Maranhão, Piauí, Tocantins and Bahia. Genet. Mol. Res. 2018, 17, gmr16039895. [Google Scholar] [CrossRef]
- Cover, J.E.; Aguiar, C.D.; Silva, A.V.; Silva, C.M.; Mielezrski, F. Productive potential and seed quality of soybean genotypes with different maturity groups. Aust. J. Crop Sci. 2019, 13, 1155–1161. [Google Scholar] [CrossRef]
- FAOSTAT. Database. 2020. Available online: http://www.fao.org/faostat/en/#data/SC (accessed on 2 January 2021).
- Srisomboon, S.; Kornthong, A.; Kaewmeechai, S.; Daengpradub., S. Genetic study of soybean. In Proceedings of the 4th Soybean Research Conference, Khon Kaen University, Khon Kaen, Thailand, 19–21 August 1992; pp. 20–30. [Google Scholar]
- R Core Team. R: A Language and Environment for Statistical Computing; R Foundation for Statistical Computing: Vienna, Austria, 2016; Available online: http://www.R-project.org/ (accessed on 30 December 2020).
- Ward, J.H. Hierarchical grouping to optimize an objective junction. J. Am. Stat. Assoc. 1963, 58, 236–244. [Google Scholar] [CrossRef]
- Kumar, S.; Dudley, J.; Nei, M.; Tamura, K. MEGA: A biologist-centric software for evolutionary analysis of DNA and protein sequences. Brief. Bioinform. 2008, 9, 299–306. [Google Scholar] [CrossRef] [PubMed]
- Miri, M.; Janakirama, P.; Held, M.; Ross, L.; Szczyglowski, K. Into the root: How cytokinin controls rhizobial infection. Trends Plant Sci. 2016, 21, 178–186. [Google Scholar] [CrossRef]
- Martins da Costa, E.; Almeida Ribeiro, P.R.; Soares de Carvalho, T.; Vicentin, R.P.; Balsanelli, E.; Maltempi de Souza, E.; Lebbe, L.; Willems, A.; de Souza Moreira, F.M. Efficient Nitrogen-Fixing Bacteria Isolated from Soybean Nodules in the Semi-arid Region of Northeast Brazil are Classified as Bradyrhizobium brasilense (Symbiovar Sojae). Curr. Microbiol. 2020, 77, 1746–1755. [Google Scholar] [CrossRef]
- Vityakon, P. Degradation and restoration of sandy soils under different agricultural land uses in northeast Thailand: A review. Land Degrad. Develop. 2007, 18, 567–577. [Google Scholar] [CrossRef]
- Arunrat, N.; Kongsurakan, P.; Sereenonchai, S.; Hatano, R. Soil Organic Carbon in Sandy Paddy Fields of Northeast Thailand: A Review. Agronomy 2020, 10, 1061. [Google Scholar] [CrossRef]
- Machikowa, T.; Laosuwan, P. Extension of Days to Flowering on Yield and Other Characters of Early Maturing Soybean. Suranareej. Sci. Technol. 2009, 16, 169–174. [Google Scholar]
- Lodthong, S. (Khon Kaen University, Khon Kaen, Thailand). Personal communication, 2017.
- Philbrook, B.D.; Oplinger, E.S. Soybean field losses as influenced by harvest delays. Agron. J. 1989, 81, 251. [Google Scholar] [CrossRef]
- Ramteke, R.; Singh, D.; Murlidharan, P. Selecting soybean (Glycine max) genotypes for insertion height of the lowest pod, the useful trait for combine harvester. Indian J. Agric. Sci. 2012, 82, 511–515. [Google Scholar]
- Weber, C.R.; Fehr, W.R. Seed Yield Losses from Lodging and Combine Harvesting in Soybeans. Agron. J. 1966, 58, 287. [Google Scholar] [CrossRef]
- Alencar, E.R.; Faroni, F.R.D. Storage of soybeans and its effects on quality of soybean sub-products. In Recent Trends for Enhancing the Diversity and Quality of Soybean Products; Krezhova, D., Ed.; IntechOpen: London, UK, 2011; pp. 48–66. [Google Scholar] [CrossRef]
- Matsue, Y.; Uchikawa, O.; Sato, H.; Tanaka, K. Productivity of the Soybean Seeds Stored for Various Periods. Plant Prod. Sci. 2005, 8, 393–396. [Google Scholar] [CrossRef]
- Panobianco, M.; Vieira, R.D. Electrical conductivity and deterioration of soybean seeds exposed to different storage conditions. Rev. Bras. Sementes 2007, 29, 97–105. [Google Scholar] [CrossRef]


| Genotype | Variety Type | Cross | Maturity Type | Source |
|---|---|---|---|---|
| 44*Ly-4E | Breeding line | (KKU35 × Horei) × Lyon | Intermediate | Khon Kaen University |
| 44*Ly-14E | Breeding line | (KKU35 × Horei) × Lyon | Intermediate | Khon Kaen University |
| 40*Ly-15 | Breeding line | (KKU35 × Horei) × Lyon | Intermediate | Khon Kaen University |
| 42*Ly-50-2 | Breeding line | (KKU35 × Horei) × Lyon | Intermediate | Khon Kaen University |
| 44*Ly-6-1-2-7 | Breeding line | (KKU35 × Horei) × Lyon | Intermediate | Khon Kaen University |
| 44*Lh-4 | Breeding line | (KKU35 × Horei) × UFV 80-85 | Intermediate | Khon Kaen University |
| 38D*a-16 | Breeding line | KKU35 × NS1 | Intermediate | Khon Kaen University |
| KKU74 | Breeding line | NS1 × KKU35 | Intermediate | Khon Kaen University |
| KKU5e | Breeding line | NS1 × KKU35 | Intermediate | Khon Kaen University |
| 74-T4 | Breeding line | NS1 × KKU35 | Intermediate | Khon Kaen University |
| 223*Lh-85 | Breeding line | (NS1 × KKU35) × UFV 80-85 | Intermediate | Khon Kaen University |
| 76*B-14-1-3 | Breeding line | NS1 × KKU35 | Intermediate | Khon Kaen University |
| 35*M-4 | Breeding line | SJ2 × Williams | Intermediate | Khon Kaen University |
| 35*Lh-7 | Breeding line | SJ2 × Williams | Intermediate | Khon Kaen University |
| 35*sj-32 | Breeding line | SJ2 × Williams | Intermediate | Khon Kaen University |
| 44*Lh-96 | Breeding line | (KKU35 × Horei) × UFV 80-85 | Intermediate | Khon Kaen University |
| 42*Lh-1-1-1 | Breeding line | (KKU35 × Horei) × UFV 80-85 | Intermediate | Khon Kaen University |
| KKU35*m-7-2 | Breeding line | SJ2 × Williams | Intermediate | Khon Kaen University |
| CM60 | Check variety | - | Intermediate | DOA, Thailand |
| SJ5 | Check variety | - | Intermediate | DOA, Thailand |
| KK | Check variety | - | Intermediate | DOA, Thailand |
| CM6 | Check variety | - | Intermediate | DOA, Thailand |
| NS1 | Check variety | - | Early | DOA, Thailand |
| KKU35 | Check variety | - | Late | Khon Kaen University |
| Environment | Growing Season | Soil Type | Rainfall (mm) | Rainy Days | Planting Date | Mean GY a (t/ha) |
|---|---|---|---|---|---|---|
| ENV1 | Wet season | Loamy clay | 525.0 | 56 | 3-Aug-2017 | 2733b |
| ENV2 | Wet season | Loamy clay | 436.2 | 40 | 9-Aug-2018 | 1106f |
| ENV3 | Wet season | Loamy clay | 403.9 | 28 | 23-Aug-2018 | 1682e |
| ENV4 | Wet season | Sandy clay | 716.0 | 79 | 22-Jun-2018 | 541g |
| ENV5 | Dry season | Sandy | 22.4 | 31 | 28-Dec-2017 | 1037f |
| ENV6 | Dry season | Sandy clay | 30.6 | 23 | 27-Dec-2017 | 2699c |
| ENV7 | Dry season | Loamy clay | 201.8 | 26 | 5-Jan-2018 | 1892de |
| ENV8 | Dry season | Sandy | 178.6 | 15 | 8-Dec-2018 | 985f |
| ENV9 | Dry season | Sandy clay | 541.8 | 37 | 12-Jan-2019 | 2013d |
| ENV10 | Dry season | Loamy clay | 447.6 | 39 | 4-Jan-2019 | 2983a |
| SOV | df | DTF a | %Respect SS | Plant Height a | % Respect SS | First Pod Height a | % Respect SS | Node Number a | % Respect SS |
|---|---|---|---|---|---|---|---|---|---|
| Environment (E) | 9 | 2540.50 ** | 93.52 | 11,519.13 ** | 93.22 | 306.61 ** | 84.54 | 1937.25 ** | 79.53 |
| Block/Env | 2 | 29.45 ** | 255.03 ** | 34.47 ** | 35.51 ** | ||||
| Genotypes (G) | 23 | 155.79 ** | 5.73 | 749.09 ** | 6.06 | 44.37 ** | 12.23 | 455.99 ** | 18.72 |
| GxE | 207 | 20.20 ** | 0.75 | 89.24 ** | 0.72 | 11.72 ** | 3.23 | 42.76 ** | 1.75 |
| df | Pod Number a | % Respect SS | Seed/Pod a | % Respect SS | 100 Seed Weight a | % Respect SS | GY a | % Respect SS | |
|---|---|---|---|---|---|---|---|---|---|
| Environment (E) | 9 | 20,806.20 ** | 87.68 | 3.17 ** | 31.64 | 574.46 ** | 81.19 | 66,190,761 ** | 97.68 |
| Block/Env | 2 | 495.30 ** | 0.28 ** | 6.51 ** | 792,097 ** | ||||
| Genotypes (G) | 23 | 2542.20 ** | 10.71 | 6.78 ** | 67.66 | 126.25 ** | 17.84 | 949,552 ** | 1.40 |
| GxE | 207 | 381.60 ** | 1.61 | 0.07 * | 0.70 | 6.86 ** | 0.97 | 622,823 ** | 0.92 |
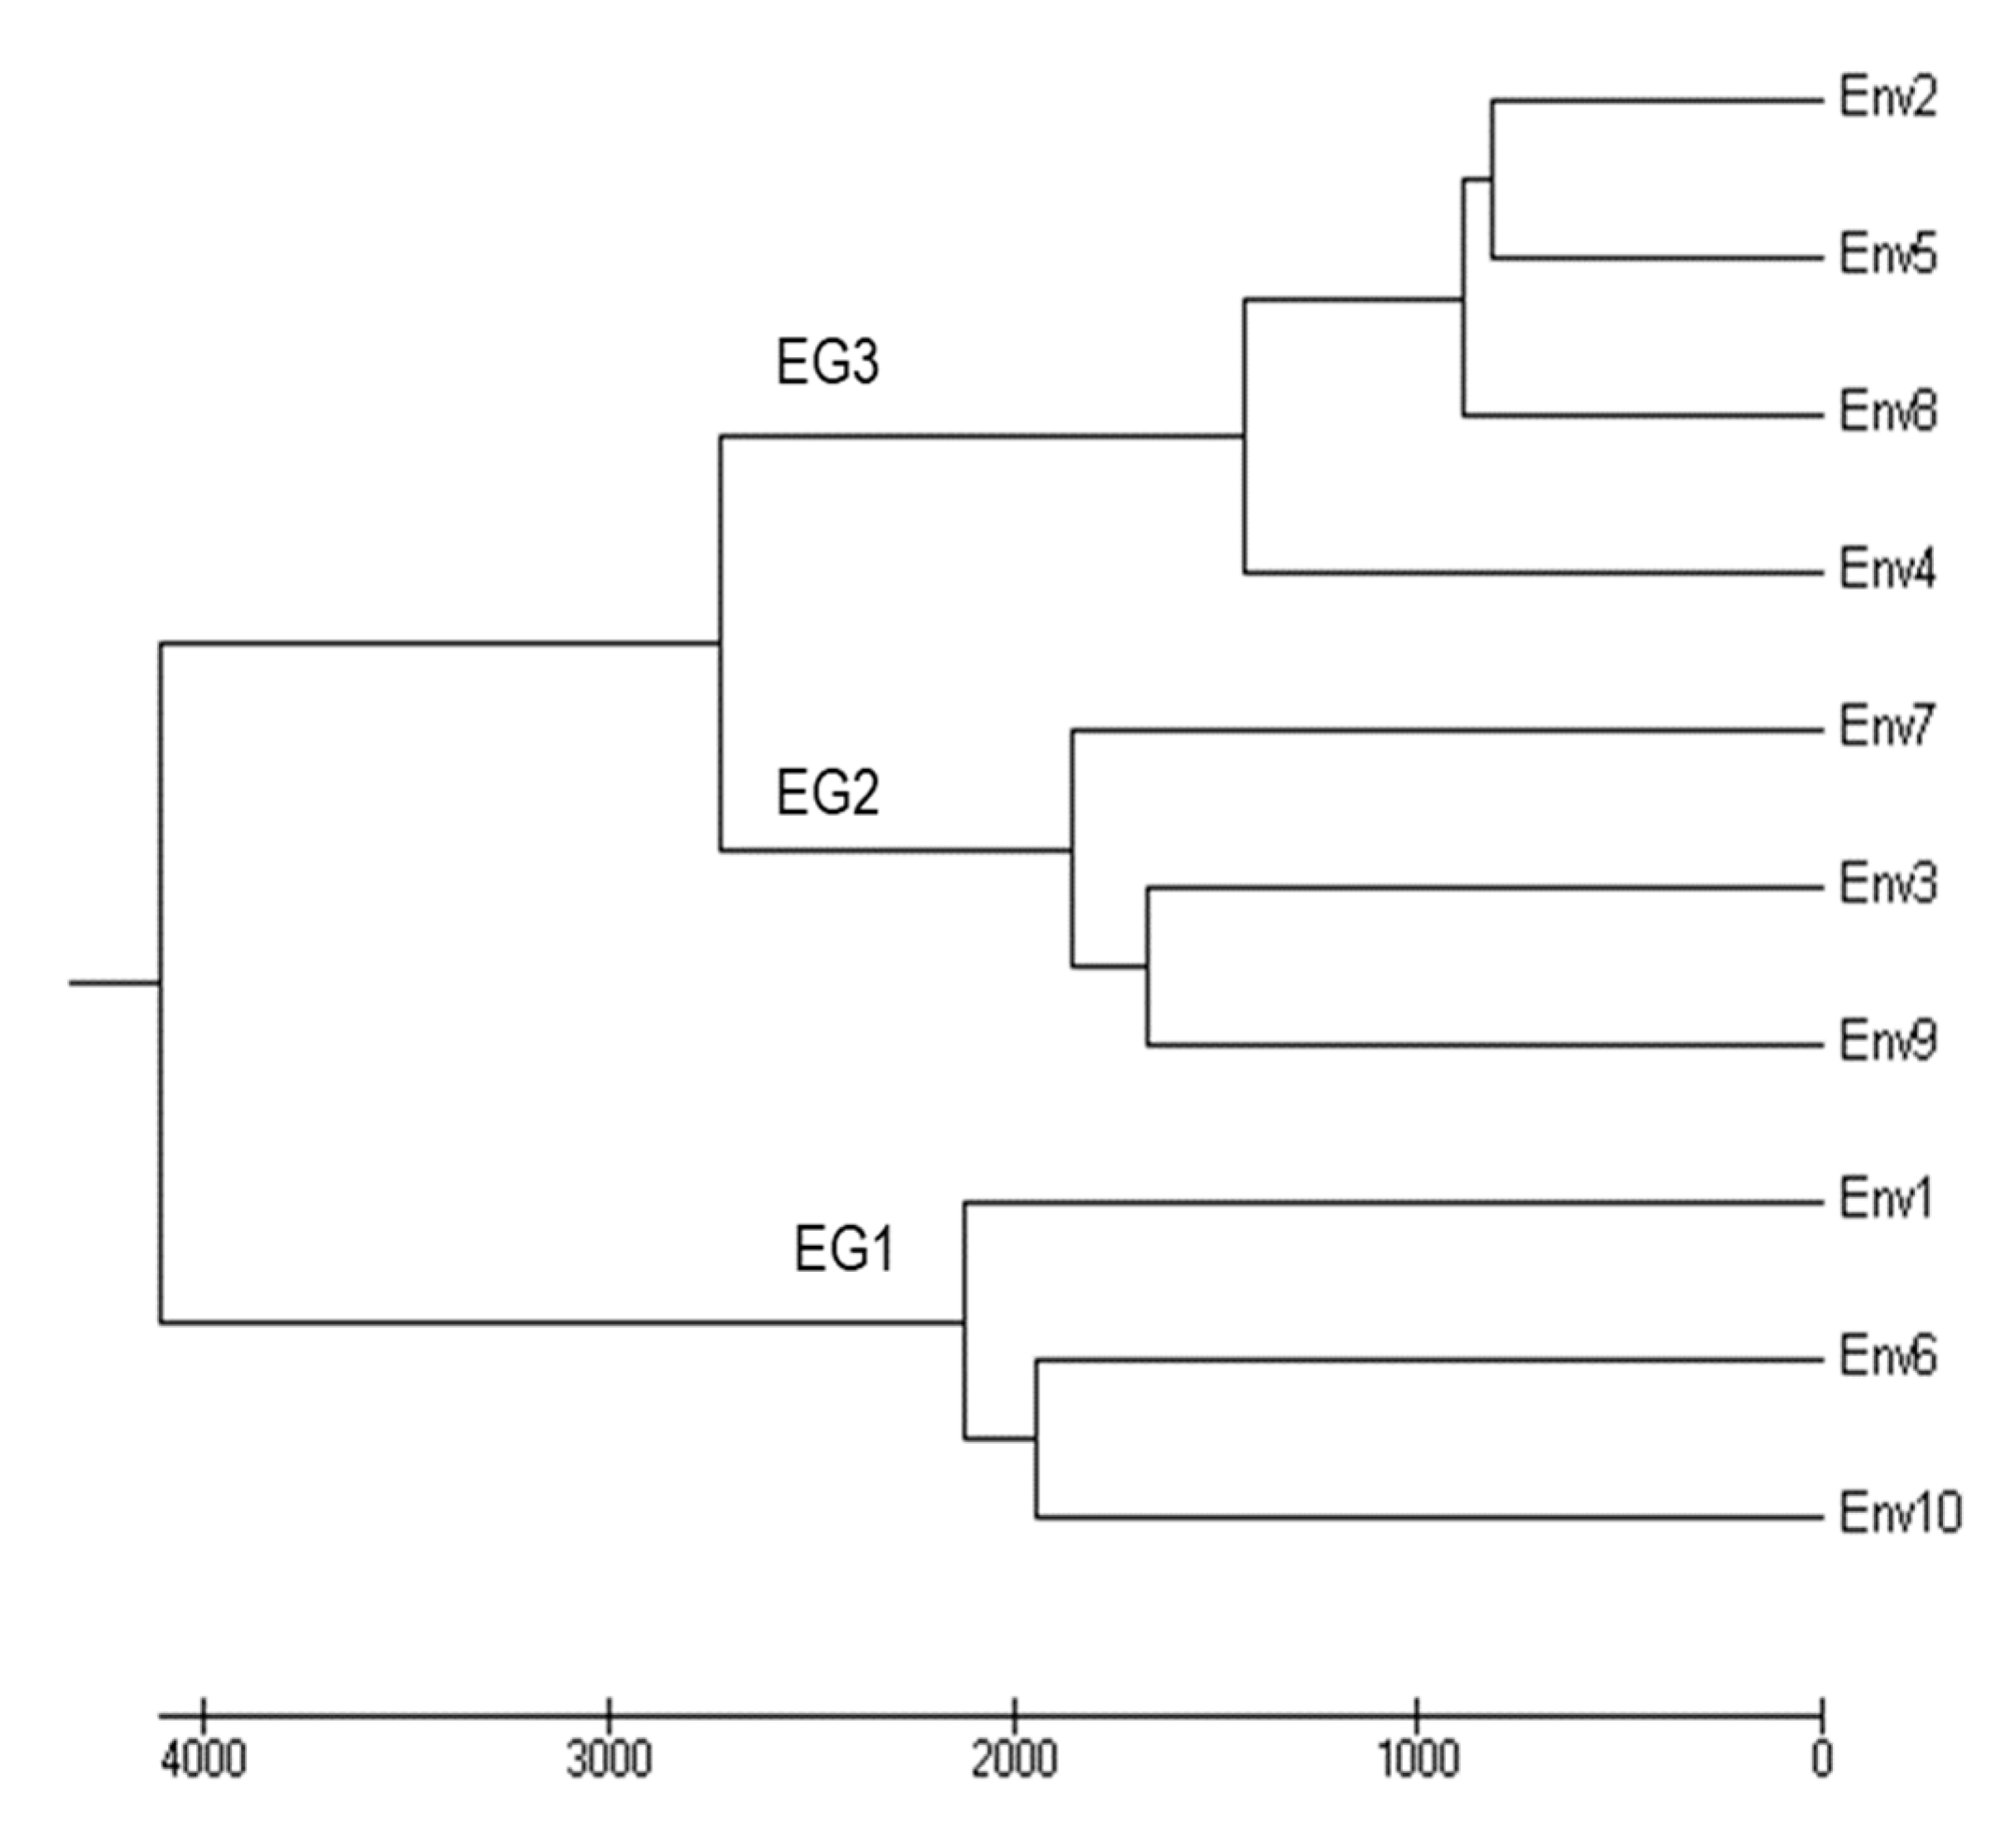
| Genotype | Environmental Group 1 | Environmental Group 2 | Environmental Group 3 | Genotype Mean | |||||||
|---|---|---|---|---|---|---|---|---|---|---|---|
| Env1 | Env6 | Env10 | Env3 | Env9 | Env7 | Env2 | Env4 | Env5 | Env8 | ||
| 44*Ly-4E | 2621 | 2848 | 3501 | 1650 | 1751 | 1611 | 1190 | 347 | 734 | 1140 | 1739 |
| 44*Ly-14E | 2330 | 3214 | 2508 | 1601 | 2160 | 1571 | 1133 | 413 | 1156 | 933 | 1702 |
| 40*Ly-15 | 3493 | 3087 | 2562 | 2296 | 2158 | 2086 | 947 | 260 | 953 | 833 | 1867 |
| 42*Ly-50-2 | 2590 | 3411 | 3366 | 1342 | 1847 | 2322 | 907 | 620 | 1116 | 933 | 1845 |
| 44*Ly-6-1-2-7 | 2349 | 1918 | 3092 | 1712 | 2320 | 1130 | 830 | 461 | 1146 | 590 | 1555 |
| 44*Lh-4 | 1589 | 1711 | 3546 | 1992 | 2849 | 1388 | 962 | 818 | 757 | 740 | 1635 |
| 38D*a-16 | 2720 | 3533 | 3162 | 1318 | 1015 | 2037 | 1220 | 633 | 910 | 1581 | 1813 |
| KKU74 | 2629 | 3203 | 3267 | 1213 | 2254 | 1784 | 1887 | 881 | 1240 | 1267 | 1962 |
| KKU5e | 3629 | 1572 | 2560 | 1665 | 2701 | 1893 | 1447 | 648 | 874 | 933 | 1792 |
| 74-T4 | 3450 | 2050 | 3002 | 1549 | 2047 | 1808 | 993 | 667 | 1665 | 1333 | 1856 |
| 223*Lh-85 | 2974 | 3074 | 3170 | 2050 | 3094 | 2092 | 1187 | 420 | 869 | 490 | 1942 |
| 76*B-14-1-3 | 2850 | 3047 | 3124 | 1457 | 1722 | 1799 | 920 | 333 | 843 | 840 | 1693 |
| 35*M-4 | 2859 | 3493 | 2767 | 1803 | 1805 | 1932 | 1707 | 501 | 1433 | 840 | 1914 |
| 35*Lh-7 | 1997 | 3984 | 3367 | 1433 | 1624 | 2733 | 833 | 360 | 742 | 1181 | 1825 |
| 35*sj-32 | 3280 | 3453 | 3335 | 1126 | 2127 | 2175 | 1202 | 480 | 988 | 1267 | 1943 |
| CM60 | 2828 | 2699 | 2290 | 1475 | 2477 | 1458 | 1033 | 613 | 1276 | 900 | 1705 |
| SJ5 | 3406 | 1970 | 2463 | 1381 | 1308 | 1881 | 960 | 708 | 676 | 667 | 1542 |
| NS1 | 2065 | 1595 | 1220 | 2220 | 752 | 1319 | 1107 | 740 | 843 | 829 | 1269 |
| KKU35 | 1960 | 2993 | 2770 | 1509 | 2204 | 2201 | 887 | 567 | 1323 | 1437 | 1785 |
| KK | 2999 | 3013 | 3385 | 2286 | 2034 | 1876 | 1020 | 473 | 990 | 840 | 1892 |
| 44*Lh-96 | 2718 | 2199 | 3662 | 2014 | 1569 | 3029 | 887 | 527 | 581 | 1300 | 1849 |
| CM6 | 3309 | 1952 | 2600 | 1704 | 2352 | 1620 | 1373 | 687 | 1224 | 1140 | 1796 |
| 42*Lh-1-1-1 | 2656 | 2626 | 3174 | 1654 | 1771 | 2889 | 827 | 418 | 1244 | 645 | 1790 |
| KKU35*m-7-2 | 2290 | 2137 | 3700 | 1907 | 2372 | 778 | 1098 | 420 | 1312 | 985 | 1700 |
| Environment mean | 2733 | 2699 | 2983 | 1682 | 2013 | 1892 | 1106 | 541 | 1037 | 985 | |
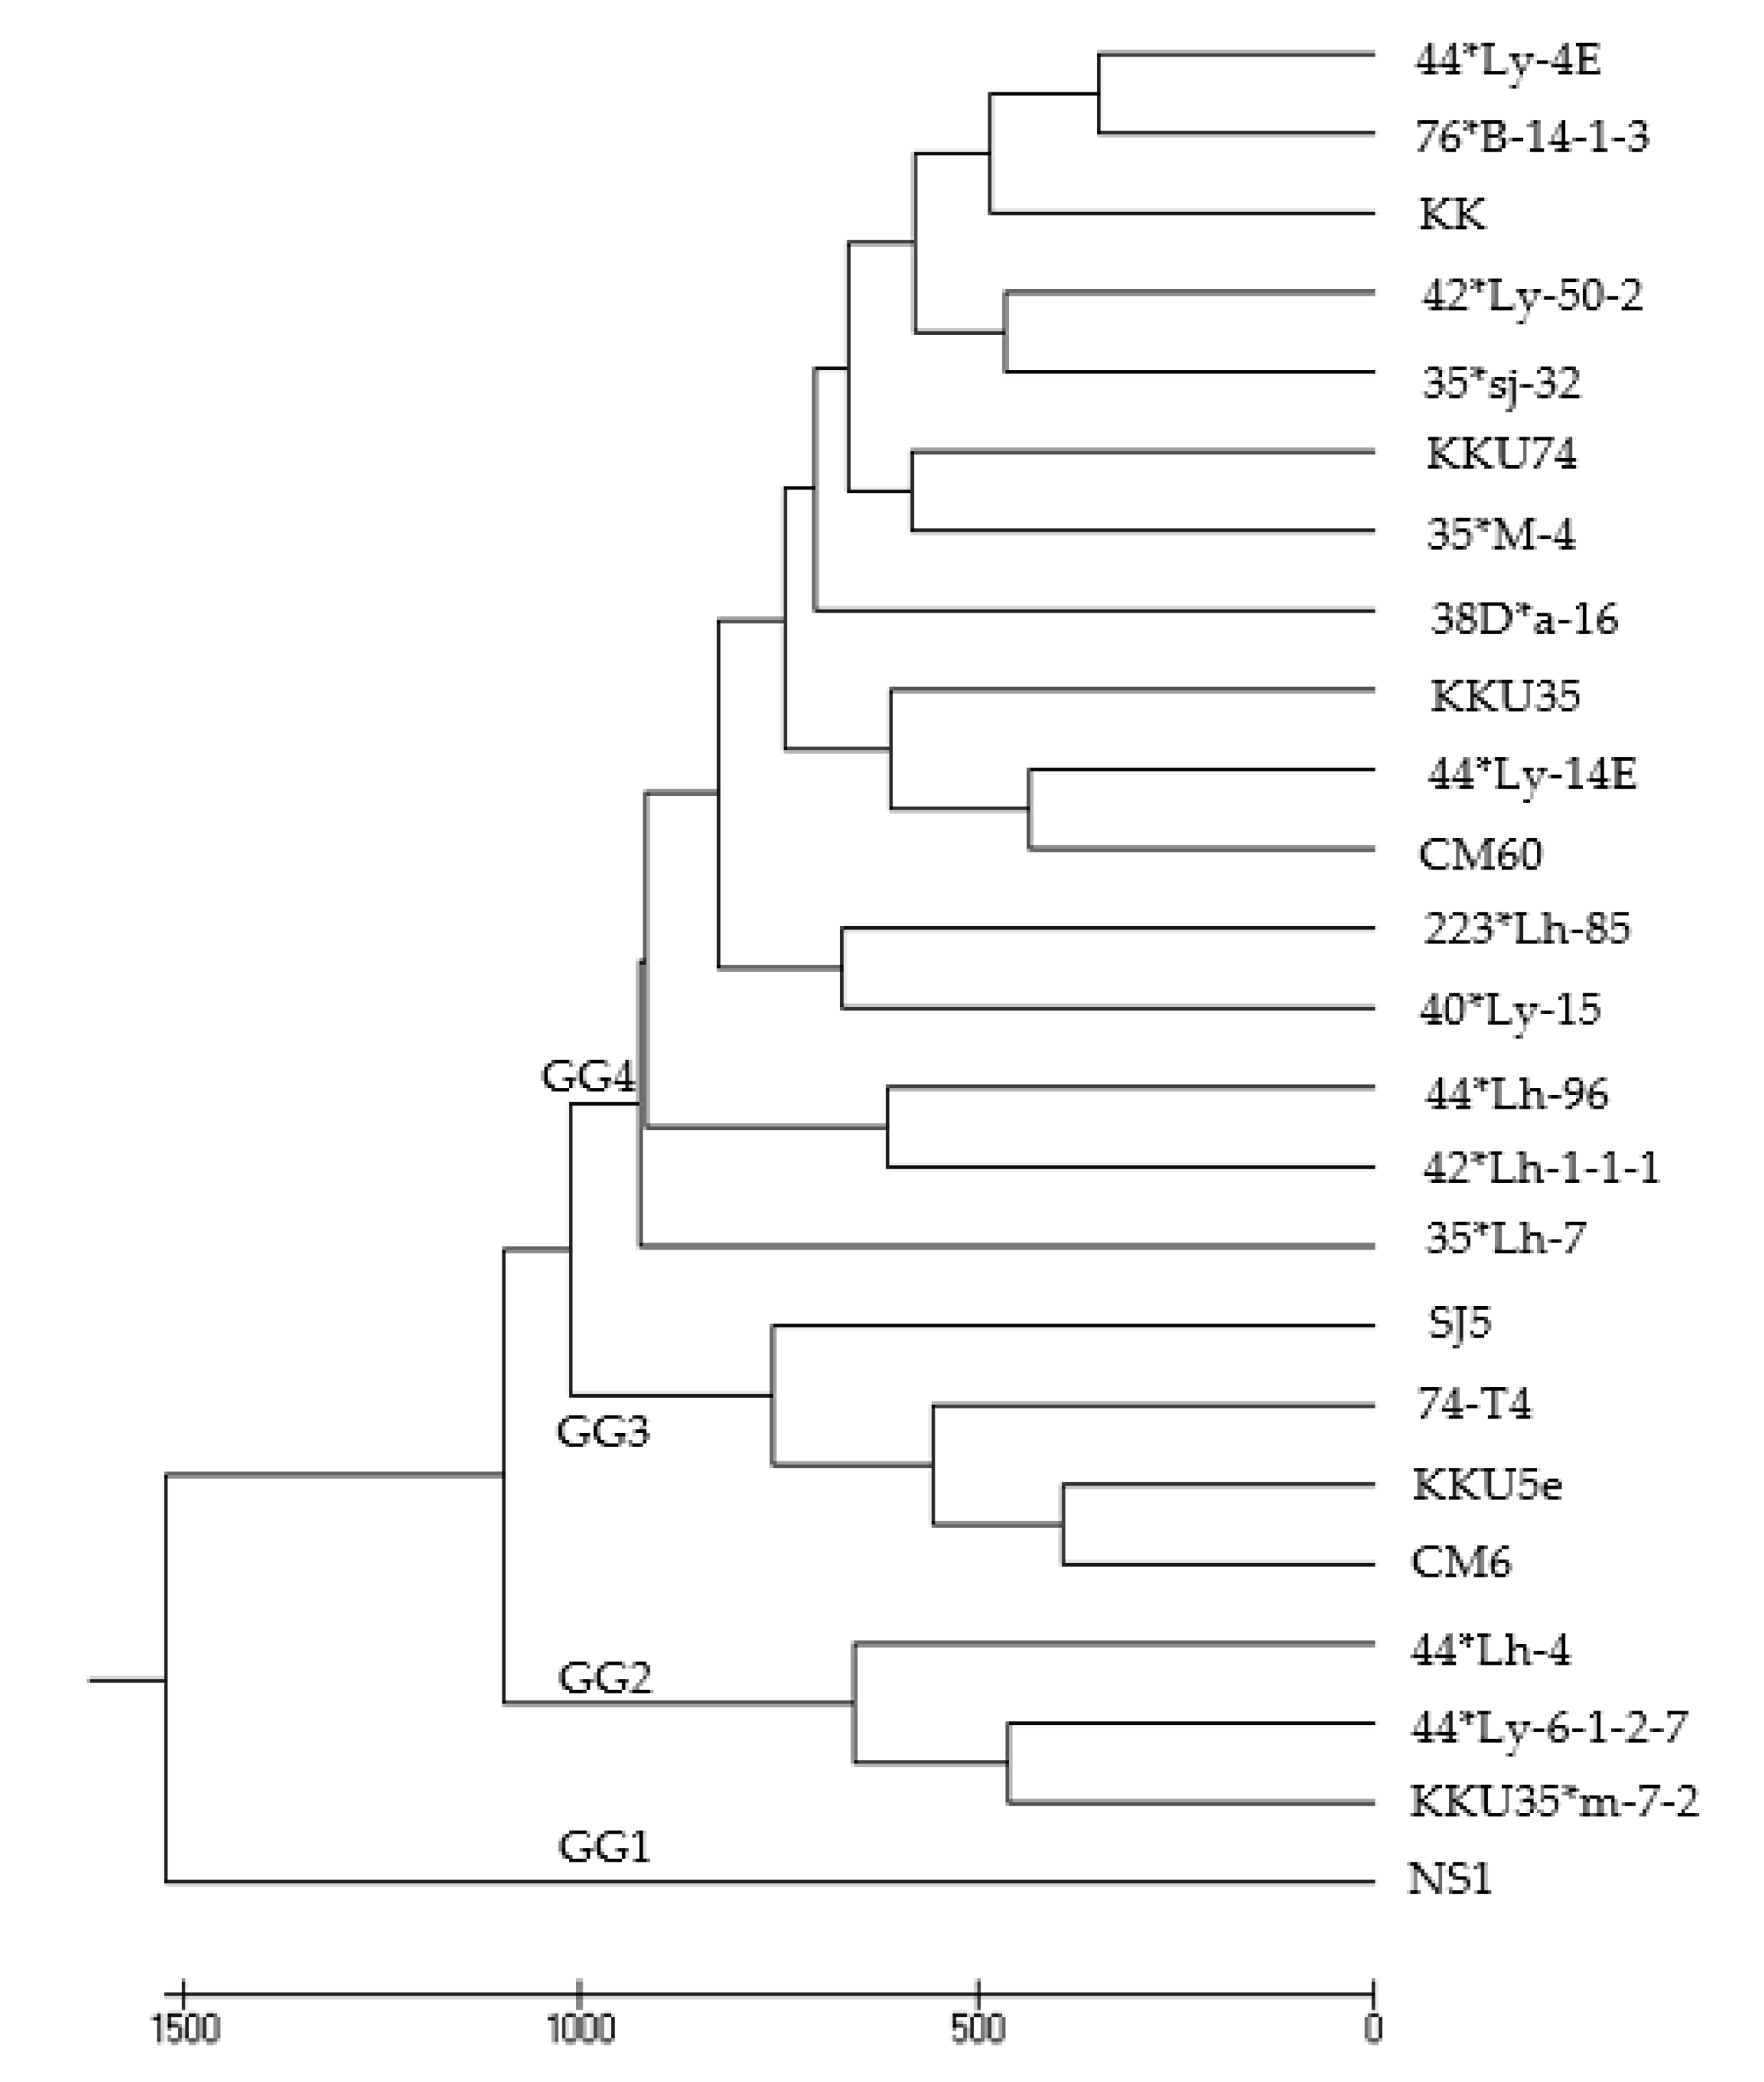
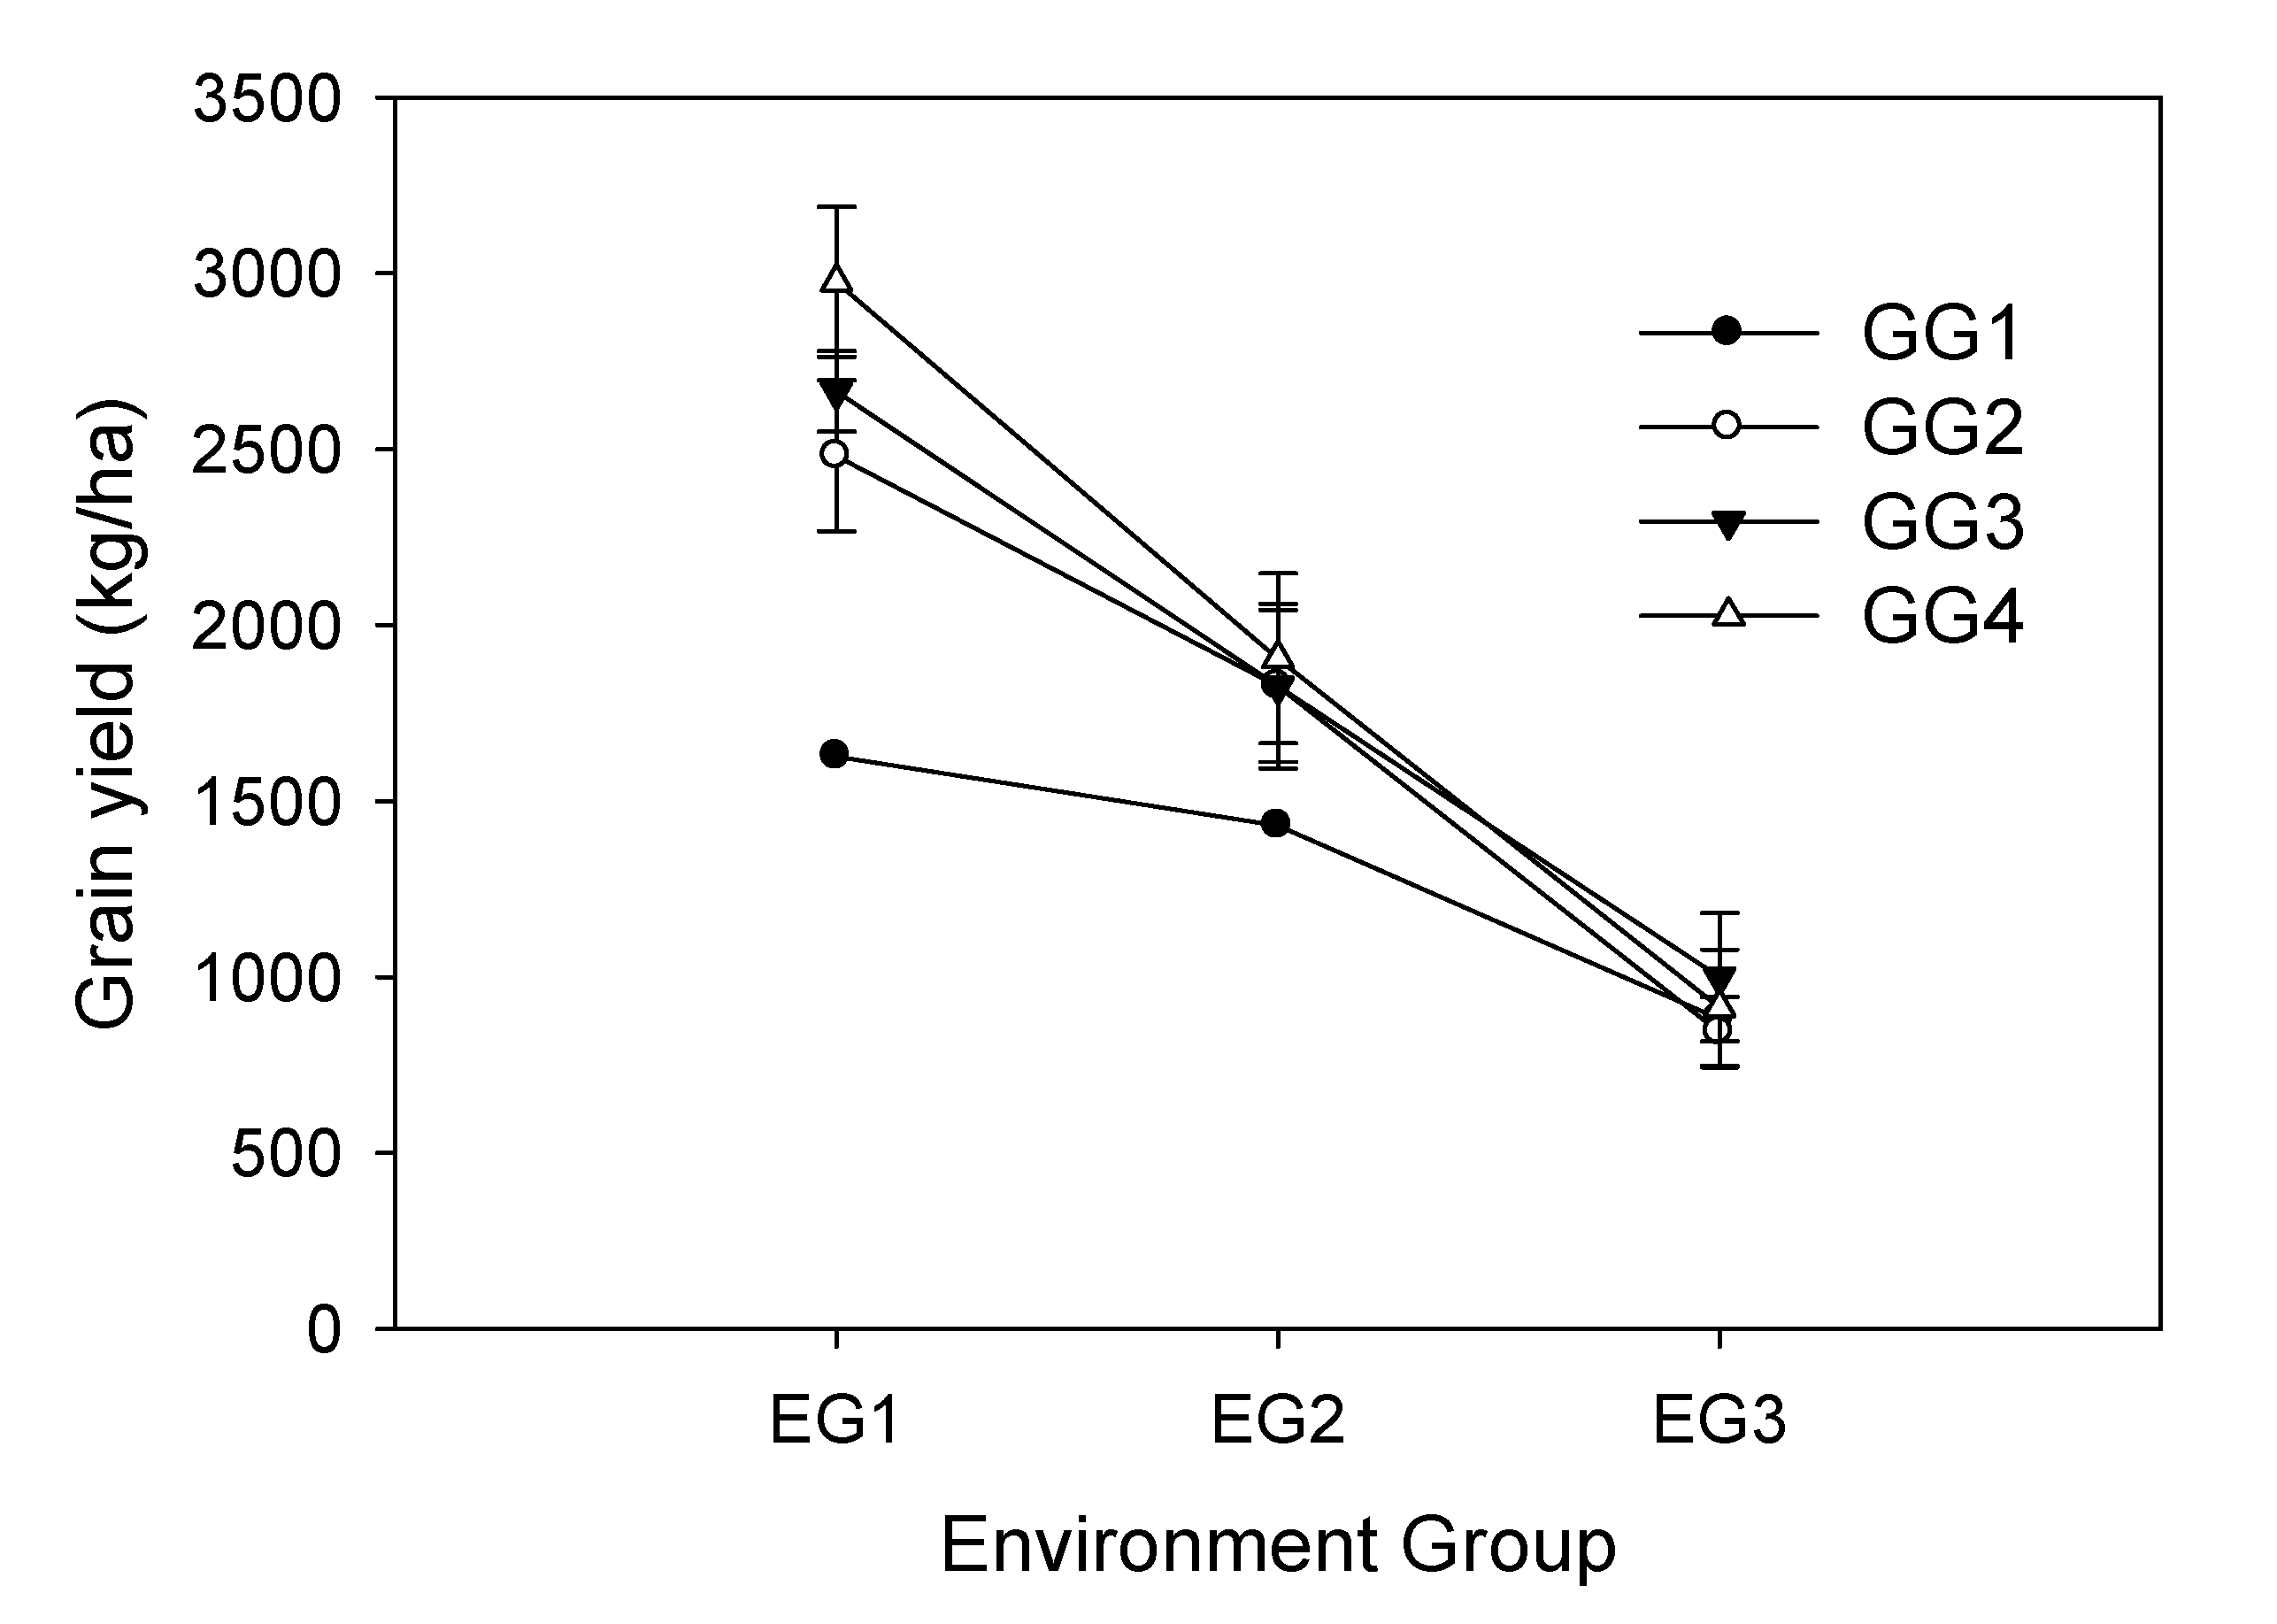
| Genotype Groups | Genotypes | EG1 | EG2 | EG3 |
|---|---|---|---|---|
| GG1 | ||||
| NS1 | 1627 | 1430 | 880 | |
| Mean | 1627 | 1430 | 880 | |
| GG2 | 44*Ly-6-1-2-7 | 2453 | 1721 | 757 |
| 44*Lh-4 | 2282 | 2076 | 819 | |
| KKU35*m-7-2 | 2709 | 1686 | 954 | |
| Mean | 2481 | 1827 | 843 | |
| GG3 | KKU5e | 2587 | 2086 | 976 |
| 74-T4 | 2834 | 1801 | 1165 | |
| SJ5 | 2613 | 1523 | 753 | |
| CM6 | 2620 | 1892 | 1106 | |
| Mean | 2664 | 1826 | 1000 | |
| GG4 | 44*Ly-4E | 2990 | 1671 | 853 |
| 42*Ly-50-2 | 3122 | 1837 | 894 | |
| 38D*a-16 | 3138 | 1457 | 1086 | |
| KKU74 | 3033 | 1750 | 1318 | |
| 76*B-14-1-3 | 3007 | 1659 | 734 | |
| 35*M-4 | 3039 | 1846 | 1120 | |
| 35*Lh-7 | 3116 | 1930 | 779 | |
| 35*sj-32 | 3356 | 1809 | 984 | |
| 44*Lh-96 | 2860 | 2204 | 824 | |
| 42*Lh-1-1-1 | 2819 | 2105 | 784 | |
| 44*Ly-14E | 2684 | 1777 | 909 | |
| 223*Lh-85 | 3073 | 2412 | 741 | |
| CM60 | 2606 | 1803 | 956 | |
| KKU35 | 2574 | 1971 | 1053 | |
| KK | 3132 | 2065 | 831 | |
| 40*Ly-15 | 3047 | 2180 | 748 | |
| Mean | 2975 | 1905 | 913 |
Publisher’s Note: MDPI stays neutral with regard to jurisdictional claims in published maps and institutional affiliations. |
© 2021 by the authors. Licensee MDPI, Basel, Switzerland. This article is an open access article distributed under the terms and conditions of the Creative Commons Attribution (CC BY) license (http://creativecommons.org/licenses/by/4.0/).
Share and Cite
Sritongtae, C.; Monkham, T.; Sanitchon, J.; Lodthong, S.; Srisawangwong, S.; Chankaew, S. Identification of Superior Soybean Cultivars through the Indication of Specific Adaptabilities within Duo-Environments for Year-Round Soybean Production in Northeast Thailand. Agronomy 2021, 11, 585. https://doi.org/10.3390/agronomy11030585
Sritongtae C, Monkham T, Sanitchon J, Lodthong S, Srisawangwong S, Chankaew S. Identification of Superior Soybean Cultivars through the Indication of Specific Adaptabilities within Duo-Environments for Year-Round Soybean Production in Northeast Thailand. Agronomy. 2021; 11(3):585. https://doi.org/10.3390/agronomy11030585
Chicago/Turabian StyleSritongtae, Chompoonut, Tidarat Monkham, Jirawat Sanitchon, Sanit Lodthong, Sittipong Srisawangwong, and Sompong Chankaew. 2021. "Identification of Superior Soybean Cultivars through the Indication of Specific Adaptabilities within Duo-Environments for Year-Round Soybean Production in Northeast Thailand" Agronomy 11, no. 3: 585. https://doi.org/10.3390/agronomy11030585
APA StyleSritongtae, C., Monkham, T., Sanitchon, J., Lodthong, S., Srisawangwong, S., & Chankaew, S. (2021). Identification of Superior Soybean Cultivars through the Indication of Specific Adaptabilities within Duo-Environments for Year-Round Soybean Production in Northeast Thailand. Agronomy, 11(3), 585. https://doi.org/10.3390/agronomy11030585