Article

Reduced Vegetative Growth Increases Grain Yield in Spring Wheat Genotypes in the Dryland Farming Region of North-West China

1
State Key Laboratory of Grassland Agroecosystems, Institute of Arid Agroecology, School of Life Sciences, Lanzhou University, Lanzhou 730000, China
2
College of Agriculture, Nanjing Agricultural University, Nanjing 210095, China
3
Key Laboratory of Vegetation Restoration and Management of Degraded Ecosystems, South China Botanical Garden, Chinese Academy of Sciences, Guangzhou 510650, China
4
UWA Institute of Agriculture and School of Agriculture and Environment, The University of Western Australia M082, 35 Stirling Highway, Crawley, WA 6009, Australia
*
Author to whom correspondence should be addressed.
Agronomy 2021, 11(4), 663; https://doi.org/10.3390/agronomy11040663
Submission received: 27 February 2021 / Revised: 23 March 2021 / Accepted: 29 March 2021 / Published: 31 March 2021

Abstract

:
To understand the co-evolution in yield-related traits with the breeding, selection, and introduction of genotypes for increased grain yield, field experiments were carried out at two sites in the western area of the Loess Plateau in China that differed in hydrothermal conditions. Sixteen genotypes of spring wheat introduced and grown over the past 120 years were compared in terms of their yield and yield-related traits. As the grain yield increased, the spike number per unit area and the grain number per spike increased linearly, but the 1000-kernel weight was not correlated with grain yield. In the more recent genotypes, anthesis was initiated significantly earlier, although the length of the period from anthesis to maturity remained unchanged. Water use and the Effective Use of Water (EUW) for aboveground biomass before anthesis and the contribution of pre-anthesis aboveground biomass to grain yield all decreased as grain yield increased. Soil water content at anthesis was negatively correlated with aboveground biomass at anthesis, but positively correlated with grain yield. Conclusively, breeding in spring wheat over the past century has increased the yield of new genotypes by (1) increasing the number of grains per unit area; (2) shortening the period of vegetative growth; (3) decreasing EUW and the soil water use before anthesis; thereby (4) retaining more soil water and increasing biomass accumulation after anthesis. Future spring wheat breeding for this dryland region should determine whether the time for grain filling from anthesis to maturity can be extended to enable greater use of environmental resources and higher yields.

1. Introduction

Wheat (Triticum aestivum L.), one of the major food crops worldwide, is grown on nearly 70% of the cultivated land in developed countries and about 50% in developing countries. However, wheat yields are limited by water shortage [1], especially in dryland regions; increasing the grain yield of wheat in those areas is critical to the world’s food security.
Since the ‘Green Revolution’ in the 1960s, which ushered in dwarf and semi-dwarf genotypes, wheat yields have increased significantly. Worldwide, the annual increase in the grain yield of spring wheat achieved through genetic means ranges from 0.5% to 1.5% [2,3]. This genetic gain is associated mainly with a reduction in plant height, resulting in an increased distribution of photosynthates to reproductive organs and a higher harvest index [4,5,6,7]. However, the history of wheat breeding in the cold environment of western Siberia over the past 100 years showed that genetic gain in yield potential was achieved neither by reducing plant height nor by incorporating Rht genes, but 40% was associated with greater 1000-kernel weight, 20% to more grains per unit area, and by greater resistance to leaf rust [8].
Many studies on the increase in grain yield with the development of new genotypes have focused on promoting such yield components as the number of spikes per unit area, the number of grains per spike, and 1000-kernel weight [9]. Some studies also showed that the genetic contribution to grain yield of non-yield-related traits closely associated with yield was significantly higher than that of the yield components. Thus, both yield components and non-yield-related traits are equally important for increasing yield [10,11,12,13], and understanding the importance of both is the key to progress in breeding high-yielding genotypes [14].
Some studies indicated that the number of grains per unit area (a product of the number of spikes per unit area and the number of grains per spike) was the decisive factor in the grain yield increase resulting from wheat breeding, whereas 1000-kernel weight is less important [15,16]. However, other studies showed that the genetic progress in developing wheat genotypes was directly attributable to higher grain weight; for example, the wheat genotypes bred at International Maize and Wheat Improvement Center in Mexico from 1966 to 2009 and those bred in China’s Henan province from 1981 to 2008 [2,17].
In crop breeding, the timing of anthesis is important for the adaptation of crops to a particular environment and therefore determines crop yield under field conditions [18,19]. Optimizing phenology to induce early heading to avoid the influence of terminal drought on grain filling [20], for example, or to prolong the stem elongation period [21], improves grain yield by increasing the number of grains or the weight of individual grains. As such, the question is whether shortening the time to anthesis will increase yields of spring wheat in the dryland farming region of North-West China with predominantly summer (July to September) rainfall after the growing season of spring wheat.
Aboveground biomass has shown little change with the development of new high-yielding genotypes of wheat [4,5]. However, research has shown that aboveground biomass contributes significantly to grain yield [22,23,24,25]. In Henan province, the accumulation of assimilates before and after anthesis was important for the final wheat yield [26], but whether this is the case in the drier regions of China is unknown.
Genotype × environment interactions are frequently observed in many crops, leading to difficulties in assessing the effects of genotype alone on yield increases [27]. The best linear unbiased prediction (BLUP) methodology was proposed by Santos et al. (1984) to allow for comparisons among genotypes over space (location, blocks) and environments [28], and more accurately predict the mean future performance of the genotypes in multiple environments [27,28]. BLUP is now frequently used in phenotypic selection in plant breeding and variety testing [29]. In this paper, we use BLUP to assess the yield increases across genotypes released over the past 120 years and to evaluate the genotypic benefits associated with the yield increases observed with the development of new genotypes.
Knowing which yield components or vegetative organs have influenced breeding progress in dryland farming areas with low and variable rainfall is essential in drawing up future breeding strategies. Studies on the genetic increase in grain yield with breeding and selection have covered most major wheat-growing areas of the world; however, few studies have focused on the contributors to grain yield in spring wheat in the semiarid regions of North-West China—a gap in knowledge the present study seeks to fill. To that end, we chose 16 genotypes of spring wheat grown over the semiarid Loess Plateau that, over the past century, have been the leading genotypes to examine how the yield components and non-yield-related traits have developed with breeding progress. More specifically, we sought to identify (1) the key factors affecting the increase in grain yield in the different genotypes developed over the 120 years; and (2) the key directions for breeding future lines of spring wheat suited to dryland farming in North-West China.

2. Materials and Methods

2.1. Materials and Experimental Sites

The sixteen genotypes chosen are listed in Supplementary Table S1. Among these, we included 3 lines, 021-128, Dingxi43-4, and Ganhan3 that were tested for certification, but not released. Two genotypes, NABUQ-6 and DURRA-5, were procured from the International Center for Agricultural Research in the Dry Areas (ICARDA) because they have been identified as suitable for the semiarid Loess Plateau.
Field experiments were carried out in Yuzhong (YZ) and Dingxi (DX), in Gansu Province in North-West China, from April to July 2019. The experimental site at YZ was at the Yuzhong Dryland Agriculture Experiment Station (35°51’ N, 104°07’ E, altitude 1620 m) of Lanzhou University. The site at DX was at the Dingxi Arid Meteorology and Ecological Environment Experiment Station (35°33’ N, 104°35’ E, altitude 1897 m). Both the sites, which are approximately 60 km apart, are typical of the semiarid and rainfed farming areas of the Loess Plateau. Precipitation during the wheat-growing season (April to July) in 2019 was 297 mm in YZ and 260 mm in DX, both higher than the long-term average precipitation over the past 20 years (2000–2019) of 197 mm in YZ and 195 mm in DX. Average temperatures during the growing season in 2019 were 15.4 °C in YZ and 14.7 °C in DX (Figure 1A). Climate data for the experimental sites were taken from national meteorological stations near the experiment stations.
The soil of two sites is a loess-like loam classified as an Orthic Entisol with a pH of 8.1 and 7.8, a soil organic carbon content of 9.1 g kg−1 and 8.96 g kg−1, a total soil nitrogen of 0.78 g kg−1and 0.84 g kg−1, a total soil phosphorus of 0.69 g kg−1 and 0.72 g kg−1, an average bulk density of the surface soil of 1.32 g cm−3 and 1.39 g cm−3, and a field capacity of 27 % and 28 % in YZ and DX, respectively. The field capacity decreased with soil depth from 28 % in the surface 20 cm, to 25% at 20–40 cm, to 27 % at 40–60 cm soil depth. The soil water content of the upper 2 m of the soil profile at sowing was 227 mm in YZ and 196 mm in DX (Figure 1B).

2.2. Experimental Design

The experiments were laid out as completely randomized blocks with three replications. The sowing density (300 grains m−2) and field management practices were the same as those followed by local farmers. Each plot was 9 m² (3 m × 3 m) and separated by 0.5 m from the adjacent plot. Seeds were sown in lines 0.2 m apart on 1 April at DX and 3 April at YZ. Before sowing, the soil was ploughed to a depth of 20 cm and supplied with nitrogen (82 kg ha−1) and phosphorus (32 kg ha−1). Each plot was divided into four equal subplots, and one subplot was selected at random for sampling at anthesis and one subplot at maturity, during which samples were collected from an area 1 m² to determine the values of the yield-related traits.

2.3. Soil and Plant Sampling

2.3.1. Field Capacity and Soil Bulk Density

The field capacity and soil bulk density of the soils were determined at 20 cm depths to 60 cm before sowing using a 5 cm inner diameter ring cutter, replicated three times at each site. The rings containing the soil samples were immersed in water for 48 h, and then the soil water was allowed to drain through filter paper across the base of the soil column for 8 h. The gravimetric saturated and drained soil moisture content, measured after oven drying and weighing, was considered to be the field capacity of the soil. The soil bulk density was calculated by dividing the dry weight of the soil samples in the ring cut by the volume of the soil in the ring cutter. The field capacity and bulk density of 60–200 cm soil depth were assumed to be similar to the values at 40–60 cm.

2.3.2. Soil Water Content at Sowing, Anthesis, and Maturity

At sowing, anthesis and maturity, the soil water content of each plot was measured gravimetrically at 20 cm depths down the soil profile to a depth of 2 m using the ring cutter method described above. Water use from sowing to anthesis (pre-anthesis water use) and from anthesis to maturity (post-anthesis water use) was calculated by the water balance equation, namely water use = precipitation + difference in soil water content during the two growth stages from sowing to anthesis and anthesis to maturity. As the genotypes varied in time of anthesis, the date of soil sampling varied with genotype. Soil moisture content (mm) = soil water content × soil bulk density × soil volume. No irrigation was given, and run-off and drainage were assumed to be negligible. The soil relative water content (%) = (soil water content/soil water content at field capacity) × 100. At DX, there was a rain event just prior to the time at which the soil water content at anthesis was measured. As this event was too close to anthesis to be included in the pre-anthesis water use, we deducted this rainfall when calculating the soil water content at anthesis and pre-anthesis water use and included it in the post-anthesis water use.

2.3.3. Phenological Observations

The dates of anthesis and maturity for each genotype were accurately recorded. Anthesis was recorded when anthers could be seen in 50% of the plants in a given plot, and maturity was when the flag leaf and the glumes had completely lost their green color.

2.3.4. Aboveground Biomass and Pre-Anthesis Biomass Mobilization

At anthesis, 1 m lengths of row were measured in 5 rows excluding the rows at the edges of the plots. Whole plants were harvested by cutting them at ground level and dried in an oven at 80 °C for 48 h before weighing. Pre-anthesis biomass accumulation was the aboveground biomass at anthesis, while the post-anthesis biomass accumulation was calculated as follows: post-anthesis biomass accumulation = aboveground biomass at maturityaboveground biomass at anthesis. The contribution of pre-anthesis biomass mobilization to grain yield was calculated as: (aboveground biomass at anthesisaboveground biomass at maturity without seeds)/grain yield × 100 [30].

2.3.5. Yield and Aboveground Biomass at Maturity

The plants were sampled at maturity in the same way as at anthesis. The number of spikes per unit area was recorded, and the number of grains per spike and 1000-kernel weight were determined from samples comprising 15 randomly chosen spikes each. The grains and the remaining above-ground parts were dried, and the harvest index (grain yield/total aboveground biomass, including grain) was calculated. The Effective Use of Water (EUW) was calculated as: EUW = water use/aboveground biomass. Water use efficiency (WUE) was calculated as follows: WUE = grain yield/total water use from sowing to maturity.

2.4. Statistical Analysis

Analyses of variance (ANOVA) for all data was carried out using GenStat ver. 19.1 (VSN International, Hemel Hempstead, UK), and the differences were compared at P = 0.05 level of significance. We calculated the values of each phenotypic feature at YZ and DX as a breeding value by the Best Linear Unbiased Prediction (BLUP). The BLUP was calculated using a mixed linear model of GenStat ver. 19.1 (VSN International, Hemel Hempstead, UK) and the effects of genotypes were random. We estimated the BLUP value of grain yield and yield-related traits for each genotype and evaluated the correlations between those traits to measure the key factors affecting the changes in grain yield. Pearson’s correlation coefficient and linear regression were used for ascertaining the correlation, if any, among the BLUP of phenology, water use, soil water content at anthesis, aboveground biomass, harvest index, WUE, and grain yield. We also calculated the correlations between yields and the length of the growing period, water use and aboveground biomass accumulation at the two research sites. Origin ver. 8.0 (Origin Lab, Northampton, MA, USA) was used to prepare the figures.

3. Results

3.1. Yield and Its Components

The grain yield of all genotypes (G) at YZ was higher than that at DX [sites = environments (E)], varying among the genotypes from 202 to 437 g m−2 at YZ, but only 183–286 g m−2 at DX (Supplementary Table S2). At both sites yields tended to increase with year of release with some exceptions, 021-128 and Ganhan3 were tested for certification in 1990 and 2013, respectively, but were not released and had low yields at both sites (Table S2). Two-way analyses of variance showed that grain yield and yield-related traits, including yield components, pre-anthesis aboveground biomass accumulation, post-anthesis aboveground biomass accumulation, and harvest index showed a significant G × E interaction (p < 0.05), but not aboveground biomass at maturity, water use and WUE (Table 1).
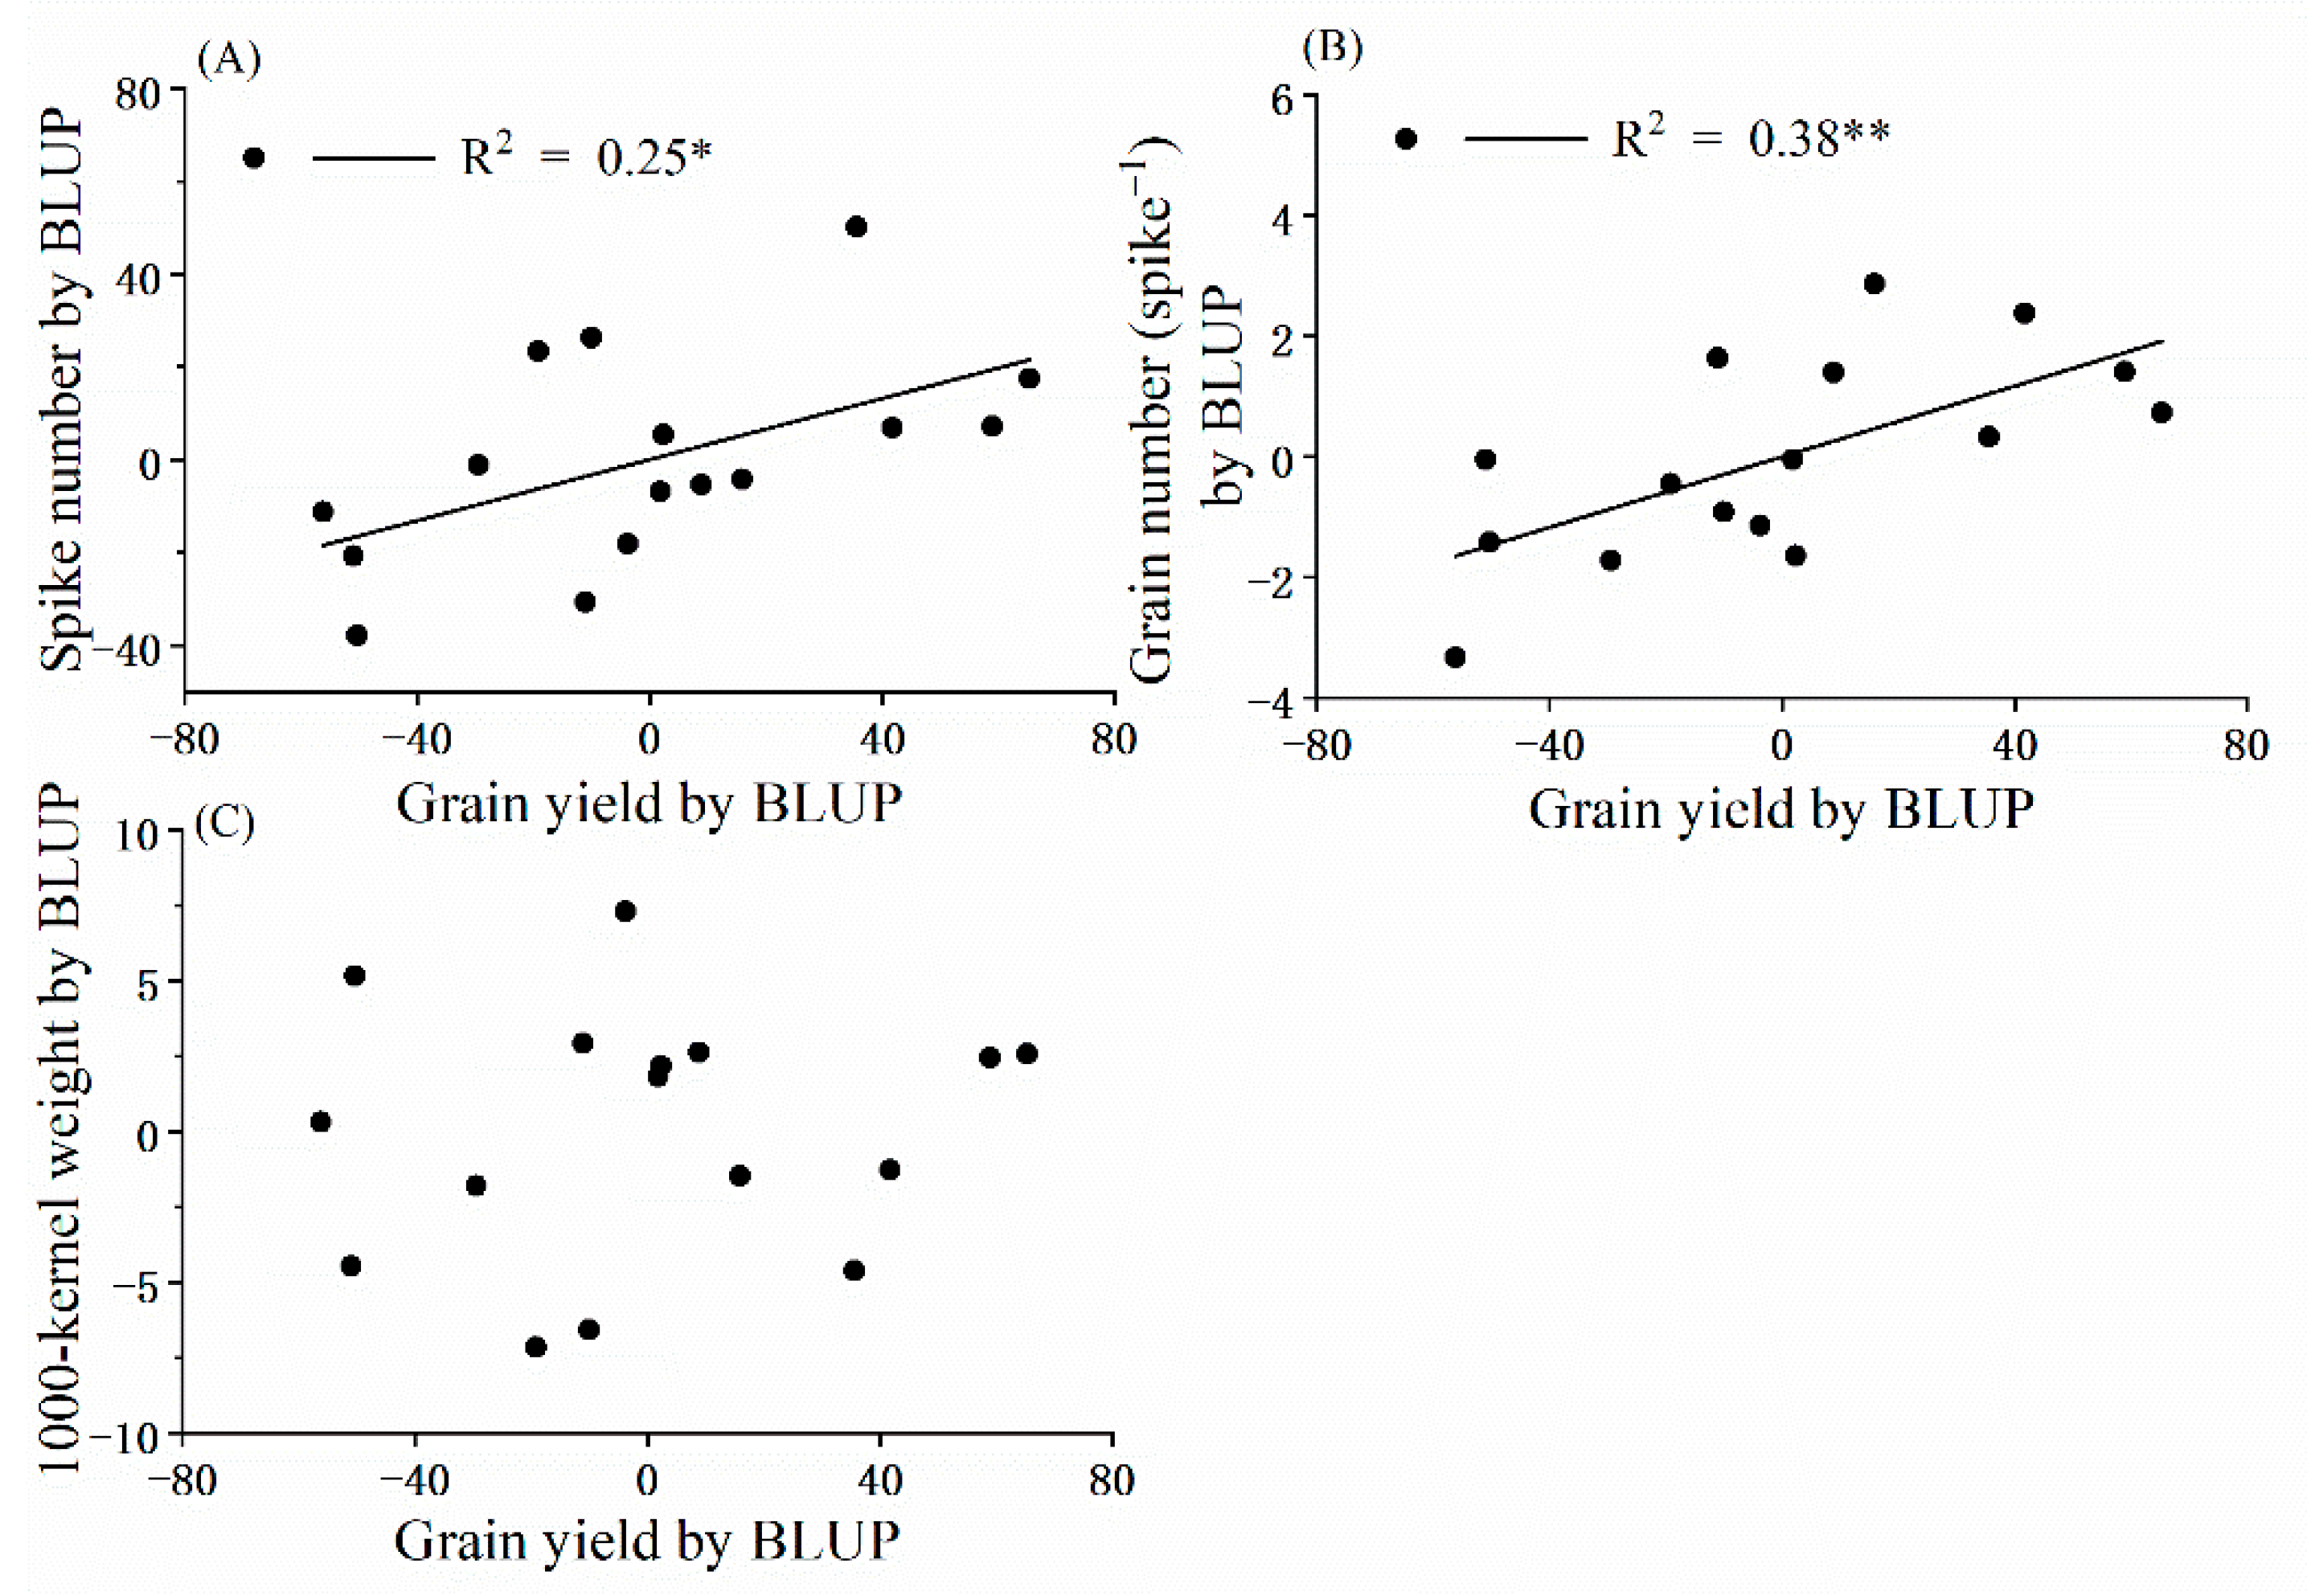
As the grain yield of spring wheat genotypes increased, the spike number per unit area (R2 = 0.25*) and the grain number per spike (R2 = 0.38**) increased linearly, but the 1000-kernel weight was not correlated with grain yield (Figure 2).

3.2. Phenology

As the grain yield of spring wheat genotypes increased, the pre-anthesis period (from sowing to flowering) decreased significantly at both sites (Figure S1a).However, the post-anthesis period (from anthesis to maturity) remained almost unchanged at approximately 32–36 days (Figure S1b), leading to the growth period of spring wheat genotypes gradually shortening from 120 to 105 days at both sites (Figure S1c) and an overall negative correlation between the duration of the entire growth period and grain yield (Figure 3).

3.3. Water Use

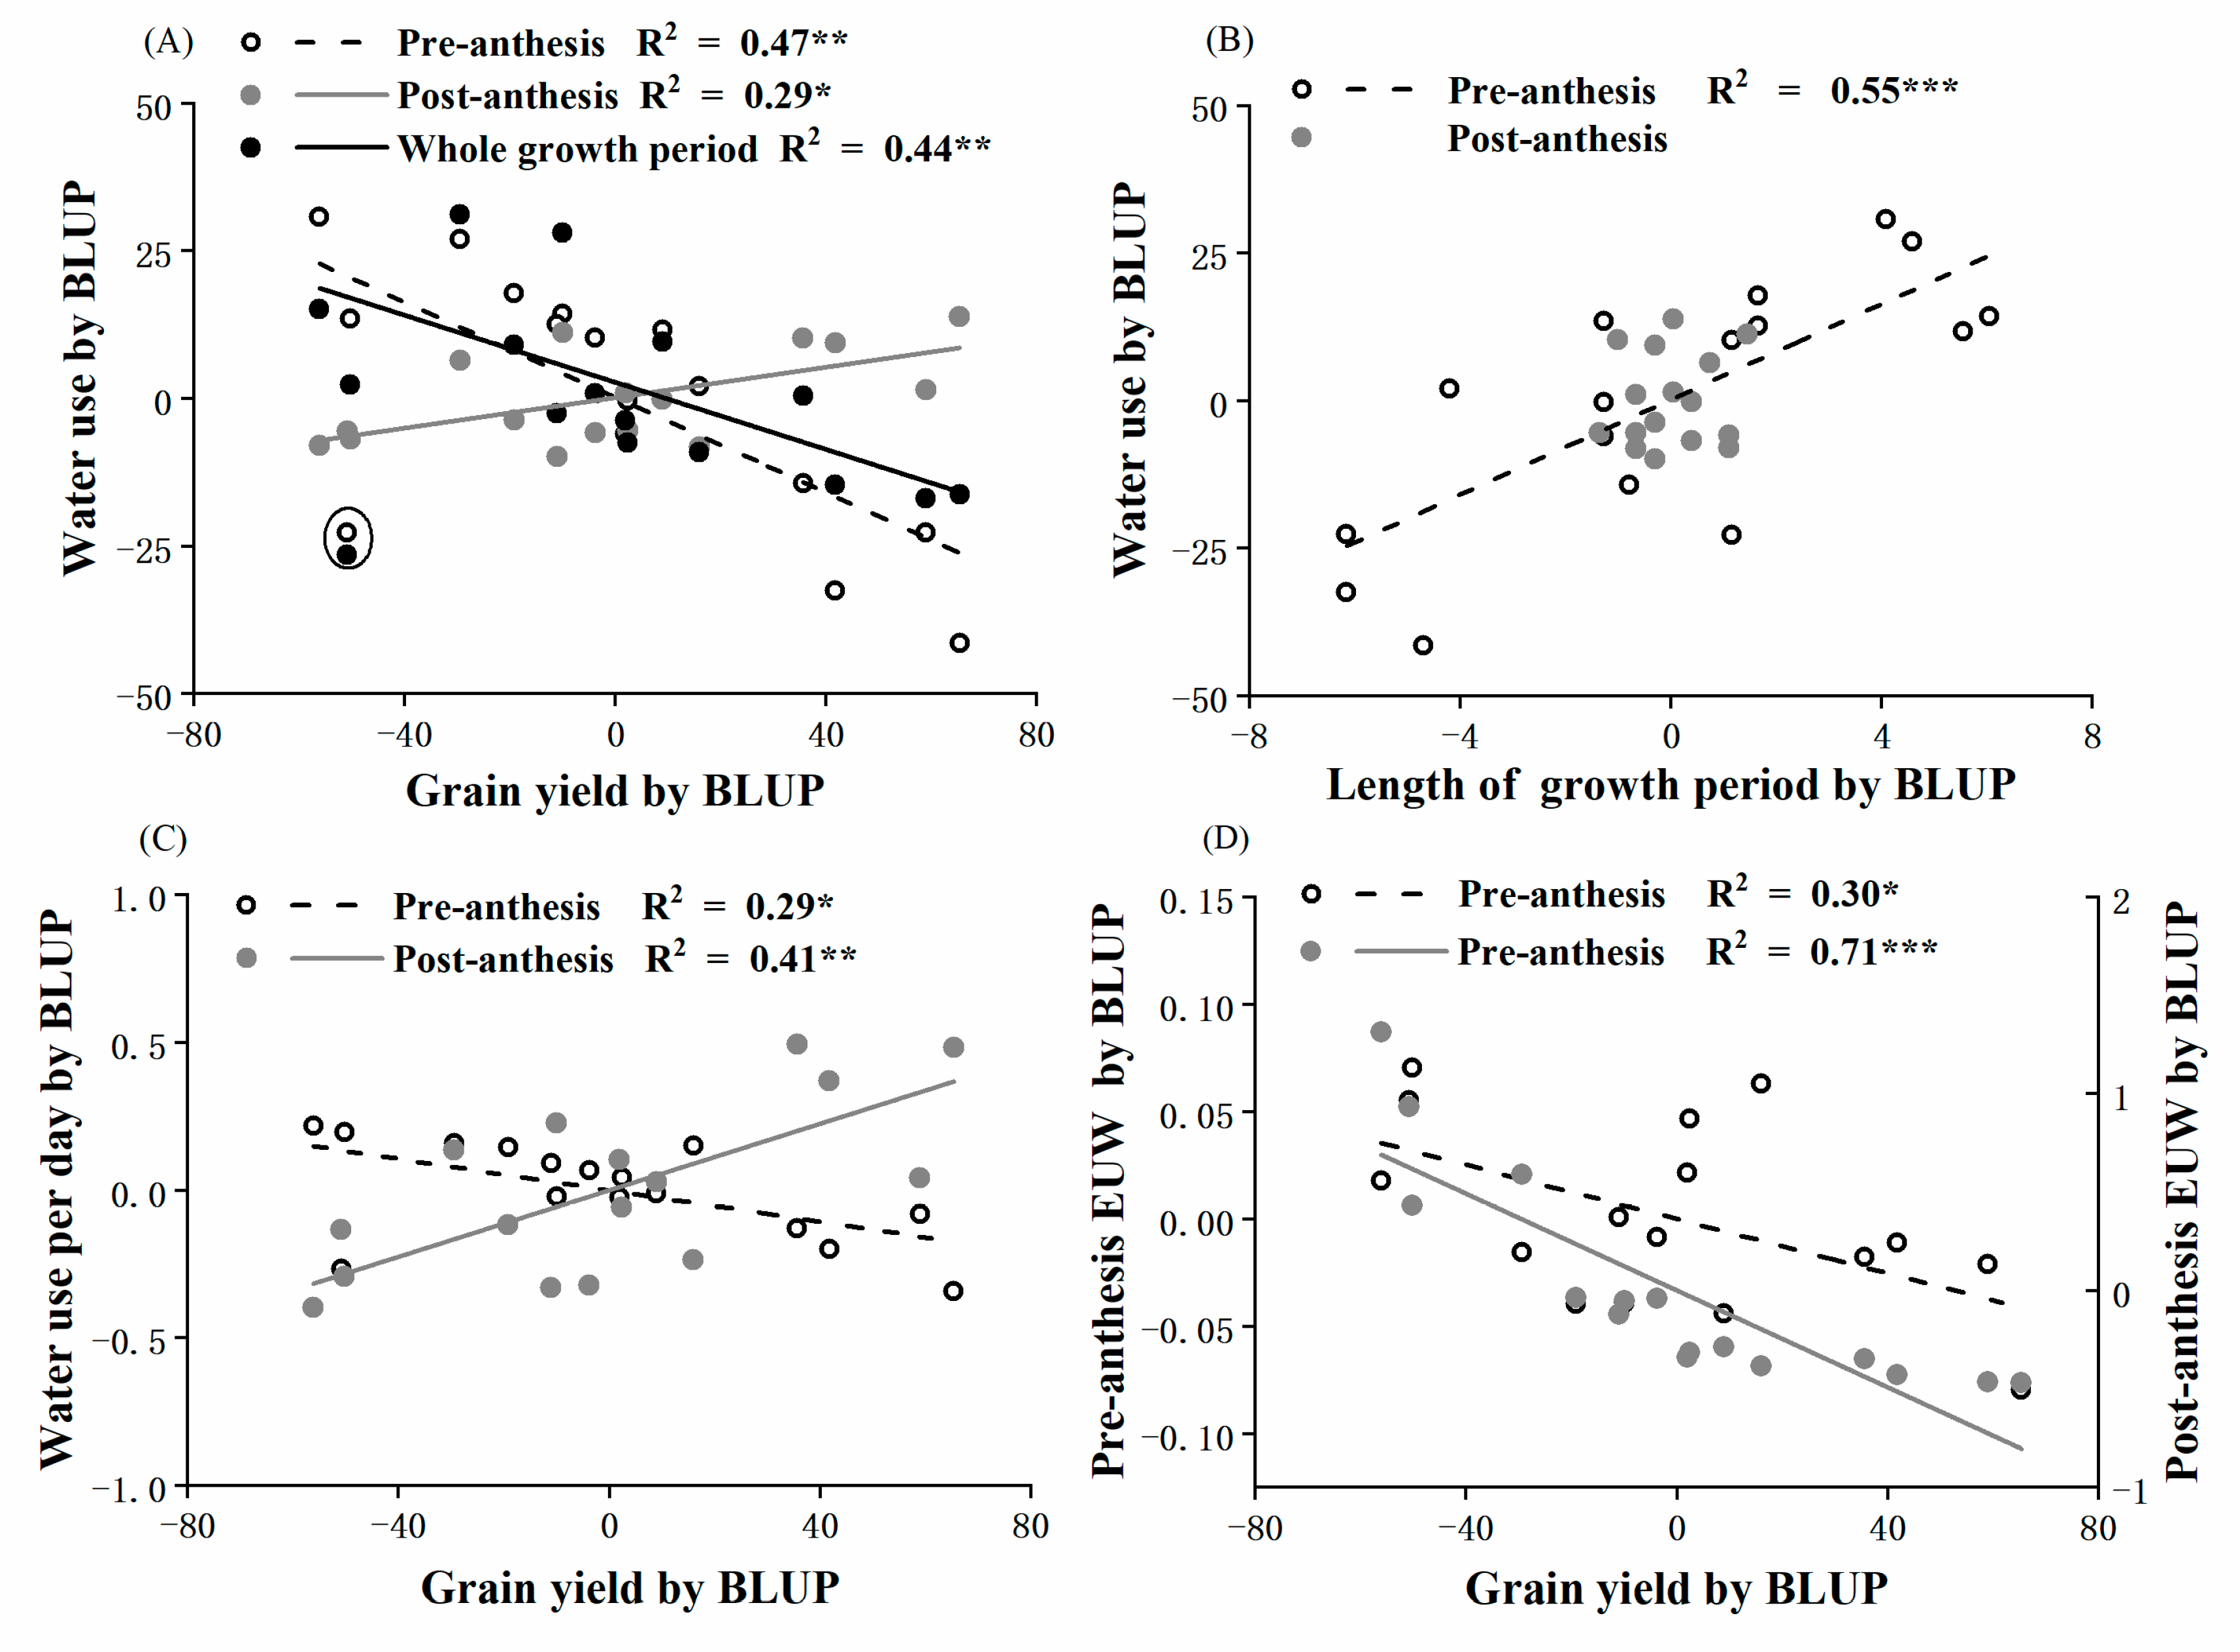
Water use before anthesis was significantly higher at YZ than DX and negatively correlated with grain yield of the genotypes at both sites (Figure S1d). However, water use after anthesis increased linearly at both sites as the grain yield increased in the more recently released genotypes (Figure S1e). Water use and grain yield were significantly and negatively correlated during the entire growth period excluding the genotype 021-128 which is circled (Figure 4A). This genotype is unique with small aboveground biomass, low water consumption and low yield, so it was never released. The longer the pre-anthesis period, the greater the water use during the same period, whereas the length of the post-anthesis period showed no significant correlation with water use (Figure 4B). Furthermore, daily water use before anthesis decreased gradually as the grain yield of the genotypes increased, whereas daily water uses after anthesis increased gradually with the increase in grain yield among genotypes (Figure 4C and Figure S2a,b). Both the pre-anthesis EUW and post-anthesis EUW were significantly and negatively correlated with grain yield (Figure 4D and Figure S2c,d).

3.4. Soil Water Content at Anthesis

At both sites, the amount of aboveground biomass accumulated was significantly and positively correlated to water use in the periods both before and after anthesis (Figure 5A,B). There was a significant negative correlation between aboveground biomass and soil water content at anthesis (Figure 5C). While the grain yield was significantly higher at YZ than DX at the same soil water content, at both sites the grain yield increased with the increase in soil water content at anthesis, when the genotype 021-128 is excluded (Figure 5D). The greater the amount of aboveground biomass accumulated before anthesis, the higher was the soil water use by the crop and the smaller the amount of available water at anthesis for use in during grain filling. Conversely, the smaller the biomass accumulation before anthesis, the smaller the water use by the crop, the greater the amount of water available in the soil at anthesis and the greater the grain yield at maturity (Figure 5D and Figure S1d–f).

3.5. Aboveground Biomass, Harvest Index and Water Use Efficiency

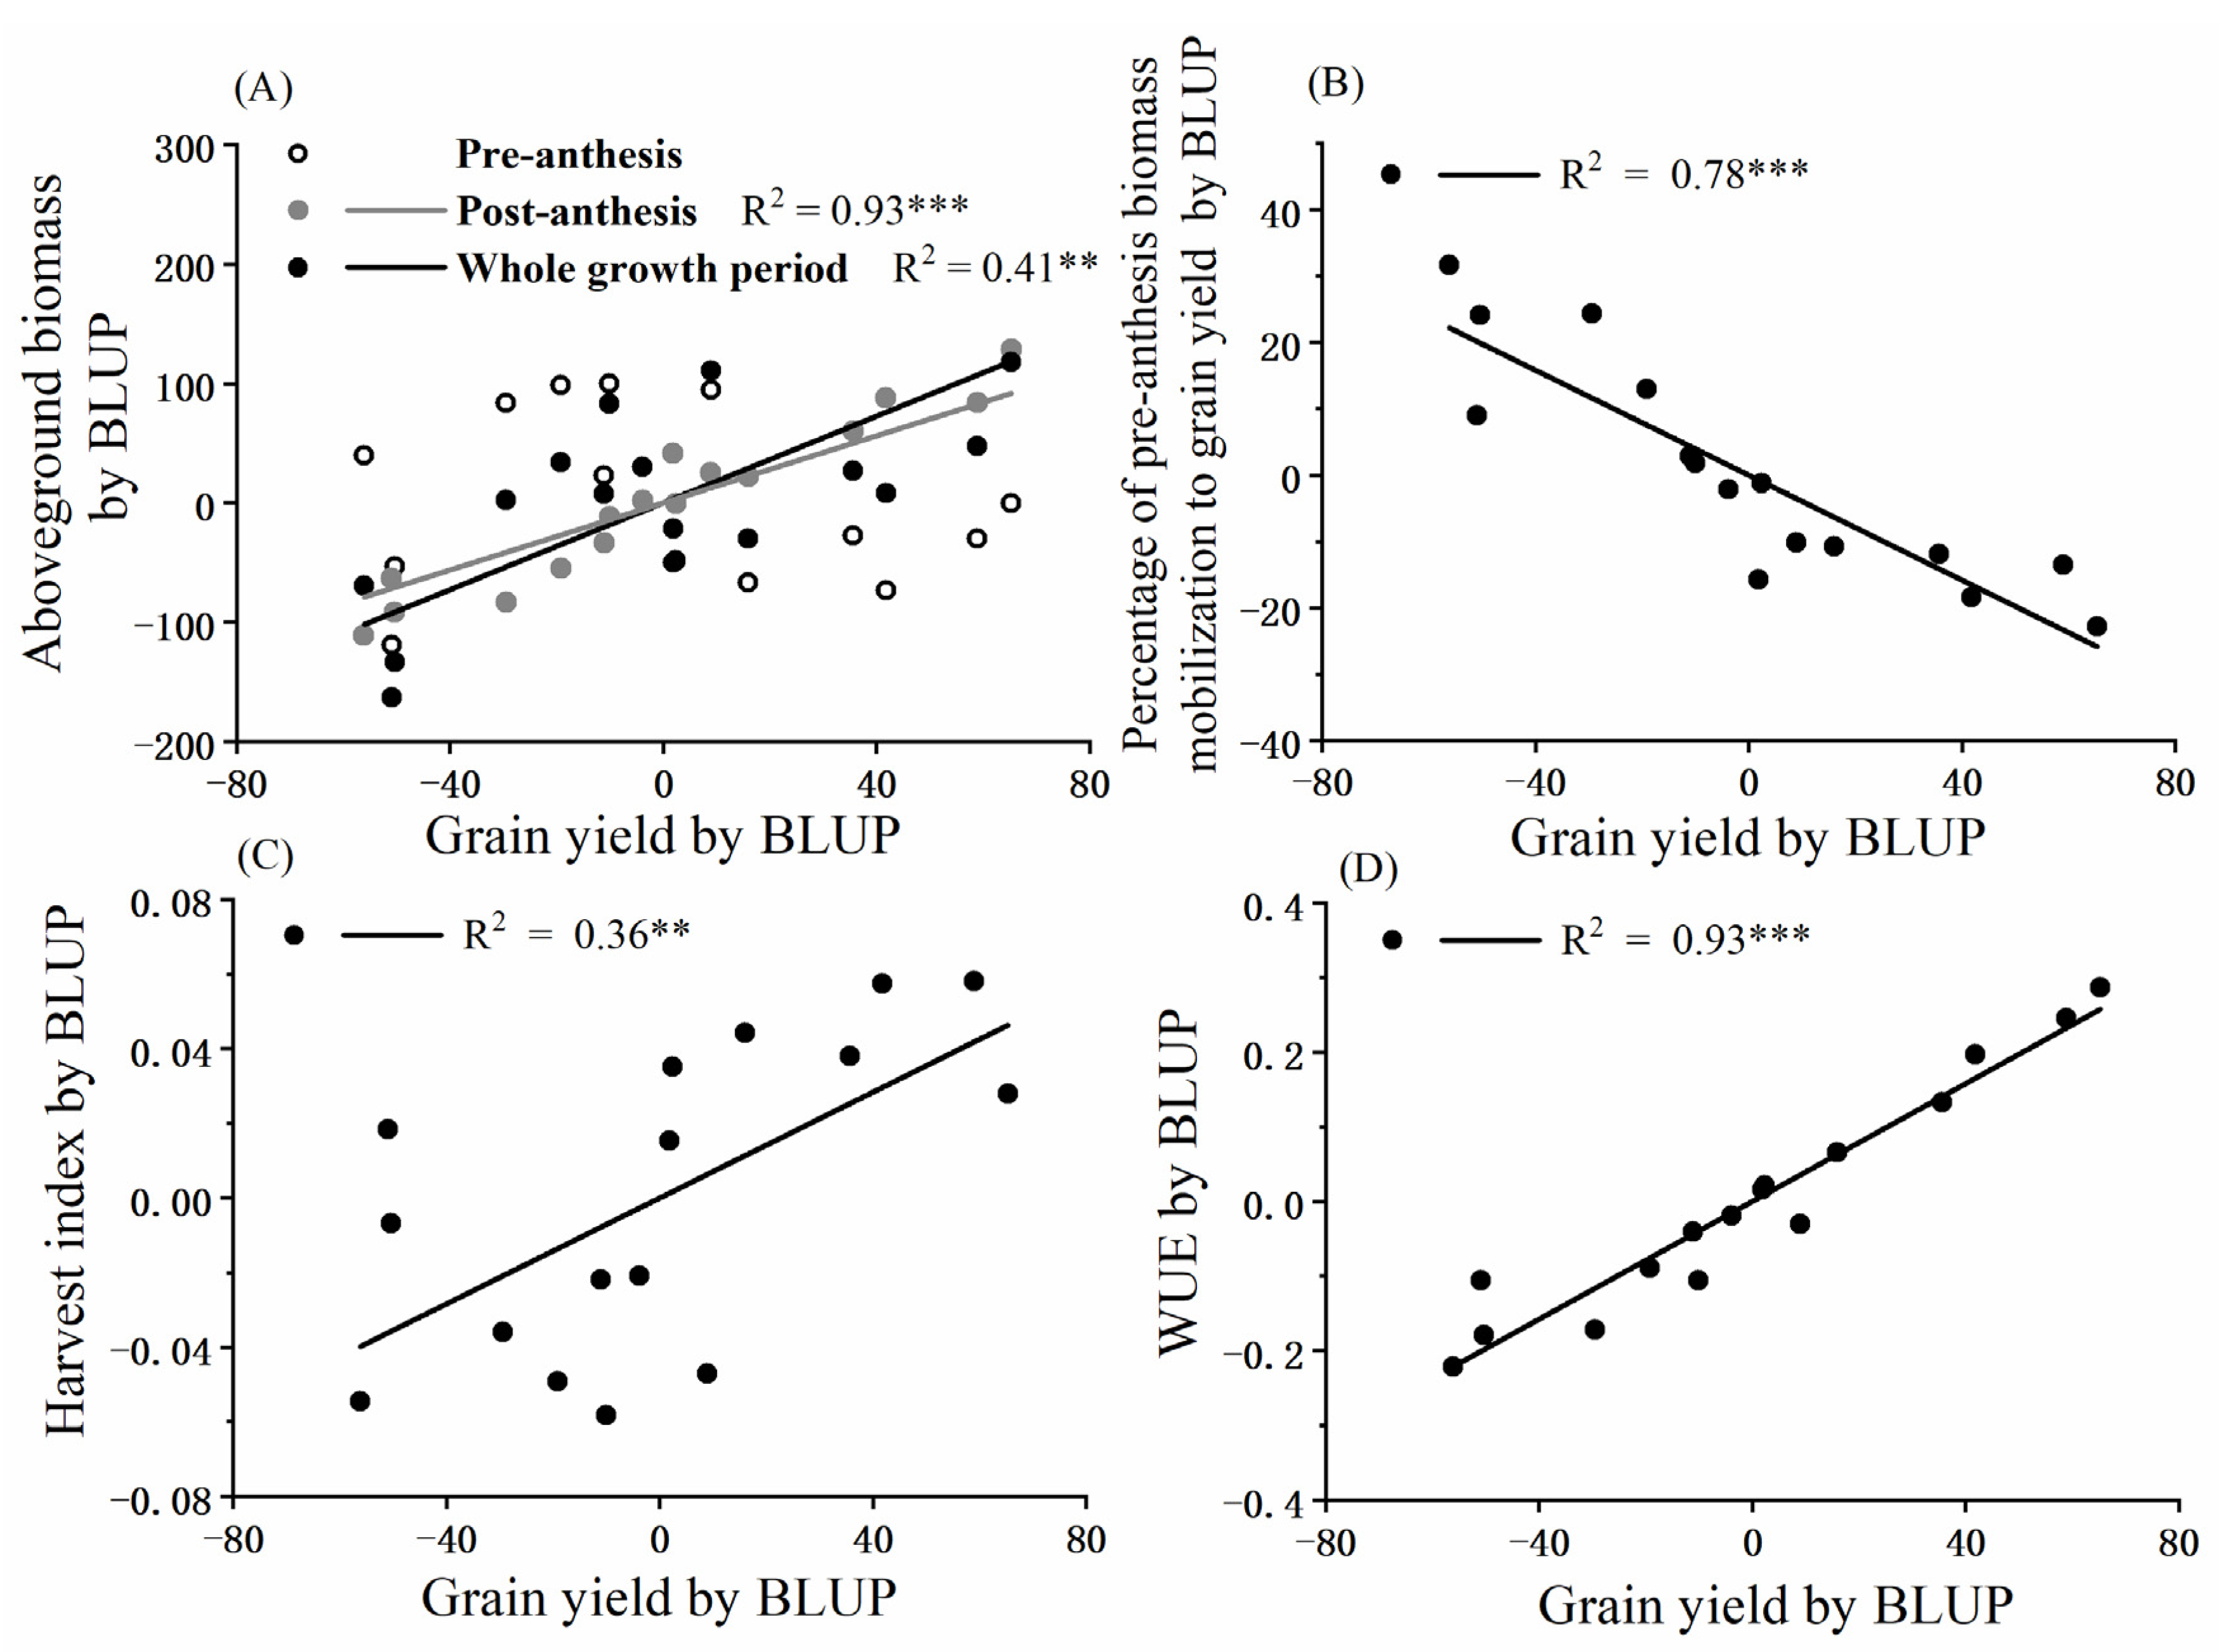
The grain yield was significantly and positively correlated to both the aboveground biomass accumulation during the post-anthesis period and the total aboveground biomass at maturity but was not correlated with the aboveground biomass accumulation in the pre-anthesis period (Figure 6A and Figure S1g–i). With the increase in grain yield among the genotypes, the contribution of pre-anthesis biomass mobilization to grain yield decreased (Figure 6B and Figure S3) while the harvest index (Figure 6C and Figure S2f) and the WUE (Figure 6D and Figure S2e) increased significantly.

4. Discussion

4.1. Changes in Agronomic Traits Related to Grain Yield Increase

Yield and its stability are always the key targets for crop breeding, especially in poor environments [31]. In the present study, the major yield components were the number of spikes per unit area and the number of grains per spike (Figure 2), which are consistent with several earlier studies [15,16,32]. The relationship between grain yield and the number of grains per unit area was stronger than that between grain yield and grain weight [33,34], but the relationships can vary with locations in China. For example, Tian et al. [35] found that the number of grains and grain weight contributed equally to grain yield in a field study which was conducted in Jiangsu province of China. Such differences may be related to differences in the hydrothermal environment and selection pressure [31]. Jiangsu is the main wheat-producing area in China, with high water availability and suitable temperatures, which is quite different from the sites in the present study.
As grain yield increased in the different genotypes released in different eras, so did the aboveground biomass and harvest index at maturity (Figure 6). This result is also consistent with the earlier research. The genetic gain in global yield potential is positively correlated to harvest index and aboveground biomass [13,23]. Zhou et al. [36] studied ten wheat genotypes released from 1995 to 2014 and found that the harvest index, aboveground biomass, and the number of grains per unit area were the main contributors to grain yield. Zhang et al. [37] pointed out that the main contributor to the increase in GY in wheat in the North China Plain was aboveground biomass and harvest index, and the contribution of aboveground biomass was greater than that of harvest index.
Many studies have shown that pre-anthesis biomass reserves contribute significantly to grain yield, especially with unfavorable conditions during grain filling [11,38]. In the present study, the contribution of pre-anthesis aboveground biomass to grain yield in the low-yielding genotypes was up to 80% at both sites, but decreased significantly with the increase in grain yield, dropping to almost zero at DX or 26% at YZ (Figure S3). Our results are supported by other studies. Pheloung and Siddique [39] found that compared with cultivars with lower potential yield, high-yielding cultivars had less storage and transfer of assimilates under drought stress and resulted in greater yield loss under the Mediterranean environment of their study. Similar results were also found in winter wheat [40]. Du et al. [31] using similar genotypes in the same environments as the present study, observed that low-yielding varieties had higher yield stability and high-yielding varieties were associated with low yield stability. Blum et al. [41] proposed that the storage and transfer of assimilates in vegetative organs maintained the stability of wheat yield, even at the cost of lower yield, due to higher assimilate reserves. However, some studies pointed out that more recent wheat varieties had a higher utilization capacity for assimilates stored before anthesis [42]. Significant increases in water-soluble carbohydrate storage before anthesis in wheat has led to genetic increases in grain yield in recent years [3].
In semiarid regions, the effective use of available water is critical to obtaining maximum grain yield per unit area [43]. Water use before anthesis decreased as the grain yield at maturity increased among genotypes (Figure 4A): the decrease was due not only to the shorter time between sowing and anthesis seen in the high-yielding genotypes (Figure 4B), but also to the reduced pre-anthesis EUW (Figure 4D). On the other hand, grain yield was significantly and positively correlated with soil water content at anthesis (Figure 5D) and water use after anthesis (Figure 4A). Soil water content at anthesis is crucial to grain yield under rain-fed conditions when no irrigation is available, as it is an indication of the degree of water-saving prior to anthesis for use during reproductive development. However, the soil water content at anthesis at YZ was on average lower than that at DX (Figure 5C), but the yield at YZ was higher than at DX (Figure 5D), presumably because of the greater percentage mobilization of pre-anthesis biomass (Figure S3), the higher post-anthesis rainfall (Figure 1A) and therefore the higher water availability after anthesis (Figure S1e) at YZ than DX. In semiarid areas, the main purpose of saving water before anthesis is to ensure that adequate water is available during grain filling after anthesis and thus to boost grain yield and maintain yield stability. The high-yielding genotypes of spring wheat also had higher WUE, which saw a linear increase with increase in yield (Figure 6D). Those genotypes used water more efficiently because they consumed less water before anthesis, preserving it for use in the reproductive stage, and thus had a significantly higher harvest index. Therefore, optimizing water use before and after anthesis is crucial to higher WUE and, in turn, to higher grain yield. This observation is consistent with the results of earlier studies in North-West China [44]. Water conservation before anthesis is particularly important for crop yield in rain-fed agriculture.
In short, genotypes bred for higher yields in semiarid environments show an overall shorter growth period and lower water consumption during vegetative growth. These strategies ensure more resources are reserved for the reproductive phase, which leads to higher aboveground biomass, higher harvest index, and higher WUE, all ultimately contributing to higher grain yield.

4.2. Changes in Growing Periods

Early anthesis in wheat is often observed in genotypes bred for Mediterranean regions. In the Mediterranean-type environment, grain filling is often affected by high temperatures and low rainfall, which result in low yield [45,46], i.e., early anthesis can decrease the damage from both adverse factors, thereby leading to stable and high yields [20,47,48]. Therefore, early anthesis and early maturity are considered as strategies to escape drought and for synchronizing the growing period of wheat with the rainy season so that plants are assured of adequate water supply [49,50]. Therefore, shortening the time to anthesis has been a successful strategy in breeding for environments characterized by stress during reproductive growth [51].
Araus et al. [11] noted only a few or no changes in the time to anthesis in climates other than Mediterranean-type climates. Our analysis has shown that with the increase in grain yield in later-released genotypes, both the time to anthesis and the entire growth period have been shortened (Figure 3). In the dry-farming areas of North-West China, precipitation during the growing season of spring wheat accounts for only about 30% of the annual precipitation, 60% of which occurs during July–September [52,53] after maturity of spring wheat. The harvest of spring wheat is followed by rainy and warm weather, conditions that are more conducive to the growth of spring wheat; however, early anthesis means these rich hydrothermal resources are not utilized by spring wheat farmers. This suggests that selection for early anthesis in North-West China may not have been an active strategy to escape terminal drought as in Mediterranean-type climates, but an inadvertent outcome of simply breeding and selection for increased grain yield to reduce the ‘hunger gap’ between sowing and harvest under heavy population pressure in the long farming history of North-West China. It raises the question whether increasing the length of the post-anthesis period when more favorable hydrothermal conditions prevail will result in further increases in yield.

4.3. Post-Anthesis Growth and 1000-Kernel Weight

The grain yield of wheat is considered to be positively correlated to the length of the post-anthesis period [17], and early-anthesis genotypes benefit from the longer time available for grain-filling after anthesis, which leads to more dry matter and grain yield [54,55]. However, we found no close correlation between the duration from anthesis to maturity and grain yield: early anthesis had shortened not only the growth period before anthesis, but also the entire growth period (Figure 3 and Figure S1). Compared to other wheat-producing areas in the world, the grain-filling period in China’s wheat-producing areas is much shorter, typically only one month [43]. In the present study, for most genotypes it was 31–35 days. As a result, none of the genotypes were able to benefit from the period during which the three critical resources, namely water, heat, and sunlight, are plentiful. Therefore, we suggest that for dryland farming areas of North-West China, wheat breeding should focus on trying to extend the grain-filling period to obtain higher yields. To that end, apportioning larger amounts of assimilates to reproductive organs to increase the weight of the individual grains may increase grain yield [56]. The duration and rate of grain filling determine the final grain weight [57]. In the present study 1000-kernel weight was not correlated to grain yield (Figure 2). If maximum grain size is not genetically determined, increasing grain weight has great potential to increase grain yield of spring wheat. However, Metzger [58] indicated that there was no significant association between grain-filling duration and yield in spring barley with similar maturity, and any advantage derived from alteration of the grain-filling period may be outweighed by a coincident change in length of the vegetative period. These results suggest that simply increasing post-anthesis growth, both in terms of the duration and/or rate, may not be a simple step for breeders, but we consider it is worthy of further research in North-West China.
Worldwide 1000-kernel weight has seen little change in recent decades [5,15]. Kernel weight is highly heritable and less plastic than the number of grains [9,59]. Some studies suggest that kernel weight is usually negatively correlated to the number of grains [56]. In other words, there is a trade-off between the number of grains and kernel weight. Understanding the ecological and physiological basis of kernel weight may help in breaking the negative correlation between the number of grains and kernel weight [60]. Foulkes et al. [56] suggest that seeking a mechanism to increase kernel weight and selecting for traits that affect kernel weight without affecting grain number will be the key to further grain yield increases.

5. Conclusions

The breeding and selection of spring wheat genotypes grown in North-West China over the past 120 years has mainly shortened the pre-anthesis period, reduced the growth of vegetative organs and the uptake of soil water before anthesis, conserving soil water and enabling the accumulation of more biomass in reproductive organs and the development of a greater number of spikes, grains per spike and better-filled grains after anthesis. These traits have been the main drivers of grain yield increase. However, the post-anthesis period of growth has not changed in the genotypes produced over the past century, so the recent cultivars have not been able to take advantage of the favorable growth period after maturity. We conclude that selection for a longer period of post-anthesis growth and larger kernel weight/kernel size should result in increased yield benefits for spring wheat in the semiarid region of North-West China.

Supplementary Materials

The following are available online at https://www.mdpi.com/article/10.3390/agronomy11040663/s1.

Author Contributions

Conceptualization, T.F. and F.-M.L.; methodology, T.F.; software, Y.X.; validation, F.-M.L.; formal analysis, T.F.; investigation, T.F., Y.X., N.C., X.-T.Z. and Y.J.; resources, F.-M.L.; data curation, F.-M.L.; writing—original draft preparation, T.F.; writing—review and editing, T.F., Y.X., Y.-H.Z., N.C.T. and F.-M.L.; visualization, Y.X.; supervision, F.-M.L.; project administration, F.-M.L.; funding acquisition, F.-M.L. All authors have read and agreed to the published version of the manuscript.

Funding

This research received no external funding.

Institutional Review Board Statement

Not applicable.

Informed Consent Statement

Not applicable.

Data Availability Statement

Not applicable.

Acknowledgments

This work was supported by the National Nature Science Foundation of China (No. 31470496) and the ‘111’ Program (BP0719040).

Conflicts of Interest

The authors declare no conflict of interest.

References

  1. Trethowan, R.M.; Pfeiffer, W.H. Challenges and future strategies in breeding wheat for adaptation to drought stressed environments: A CIMMYT wheat program perspective. In Molecular Approaches for the Genetic Improvement of Cereals for Stable Production in Water-Limited Environments; Ribaut, J.-M., Poland, D., Eds.; CIMMYT: Mexico City, Mexico, 2000; pp. 21–25. [Google Scholar]
  2. Aisawi, K.A.B.; Reynolds, M.P.; Singh, R.P.; Foulkes, M.J. The physiological basis of the genetic progress in yield potential of CIMMYT spring wheat cultivars from 1966 to 2009. Crop. Sci. 2015, 55, 1749–1764. [Google Scholar] [CrossRef]
  3. Xiao, Y.G.; Qian, Z.G.; Wu, K.; Liu, J.J.; Xia, X.C.; Ji, W.Q.; He, Z.H. Genetic gains in grain yield and physiological traits of winter wheat in Shandong Province, China, from 1969 to 2006. Crop Sci. 2012, 52, 44–56. [Google Scholar] [CrossRef]
  4. Austin, R.; Bingham, J.; Blackwell, R.; Evans, L.; Ford, M.; Morgan, C.; Taylor, M. Genetic improvements in winter wheat yields since 1900 and associated physiological changes. J. Agric. Sci. 1980, 94, 675–689. [Google Scholar] [CrossRef]
  5. Brancourt-Hulmel, M.; Doussinault, G.; Lecomte, C.; Bérard, P.; Trottet, M. Genetic improvement of agronomic traits of winter wheat cultivars released in France from 1946 to 1992. Crop Sci. 2003, 43, 37–45. [Google Scholar] [CrossRef]
  6. Reynolds, M.; Foulkes, M.J.; Slafer, G.A.; Berry, P.; Parry, M.A.; Snape, J.W.; Angus, W.J. Raising yield potential in wheat. J. Exp. Bot. 2009, 60, 1899–1918. [Google Scholar] [CrossRef] [PubMed] [Green Version]
  7. Zhou, Y.; Zhu, H.Z.; Cai, S.B.; He, Z.H.; Zhang, X.K.; Xia, X.C.; Zhang, G.S. Genetic improvement of grain yield and associated traits in the southern China winter wheat region: 1949 to 2000. Euphytica 2007, 157, 465–473. [Google Scholar] [CrossRef]
  8. Morgounov, A.; Zykin, V.; Belan, I.; Roseeva, L.; Zelenskiy, Y.; Gomez-Becerra, H.F.; Budak, H.; Bekes, F. Genetic gains for grain yield in high latitude spring wheat grown in Western Siberia in 1900–2008. Field Crop. Res. 2010, 117, 101–112. [Google Scholar] [CrossRef]
  9. Sadras, V.O.; Slafer, G.A. Environmental modulation of yield components in cereals: Heritabilities reveal a hierarchy of phenotypic plasticities. Field Crop. Res. 2012, 127, 215–224. [Google Scholar] [CrossRef]
  10. Abdolshahi, R.; Nazari, M.; Safarian, A.; Sadathossini, T.S.; Salarpour, M.; Amiri, H. Integrated selection criteria for drought tolerance in wheat (Triticum aestivum L.) breeding programs using discriminant analysis. Field Crop. Res. 2015, 174, 20–29. [Google Scholar] [CrossRef]
  11. Araus, J.L.; Slafer, G.A.; Royo, C.; Dolores Serret, M. Breeding for yield potential and stress adaptation in cereals. Crit. Rev. Plant Sci. 2008, 27, 377–412. [Google Scholar] [CrossRef]
  12. Aziz, M.M.; Palta, J.A.; Siddique, K.H.M.; Sadras, V.O. Five decades of selection for yield reduced root length density and increased nitrogen uptake per unit root length in Australian wheat varieties. Plant Soil 2016, 413, 181–192. [Google Scholar] [CrossRef]
  13. Foulkes, M.; Snape, J.; Shearman, V.; Reynolds, M.; Gaju, O.; Sylvester-Bradley, R. Genetic progress in yield potential in wheat: Recent advances and future prospects. J. Agric. Sci. 2007, 145, 17–29. [Google Scholar] [CrossRef]
  14. Slafer, G.A.; Savin, R.; Sadras, V.O. Coarse and fine regulation of wheat yield components in response to genotype and environment. Field Crop. Res. 2014, 157, 71–83. [Google Scholar] [CrossRef]
  15. Calderini, D.F.; Reynolds, M.P.; Slafer, G.A.; Satorre, E.H.; Slafer, G.A. Genetic gains in wheat yield and associated physiological changes during the twentieth century. Wheat Ecol. Physiol. Yield Determ. 1999, 61, 351–377. [Google Scholar]
  16. Hall, A.J.; Richards, R.A. Prognosis for genetic improvement of yield potential and water-limited yield of major grain crops. Field Crop. Res. 2013, 143, 18–33. [Google Scholar] [CrossRef] [Green Version]
  17. Zheng, T.C.; Zhang, X.K.; Yin, G.H.; Wang, L.N.; Han, Y.L.; Chen, L.; Huang, F.; Tang, J.W.; Xia, X.C.; He, Z.H. Genetic gains in grain yield, net photosynthesis and stomatal conductance achieved in Henan Province of China between 1981 and 2008. Field Crop. Res. 2011, 122, 225–233. [Google Scholar] [CrossRef]
  18. Perry, M.W.; D’Antuono, M.F. Yield improvement and associated characteristics of some Australian spring wheat cultivars introduced between 1860 and 1982. Aust. J. Agric. Res. 1989, 40, 457–472. [Google Scholar]
  19. Richards, R.A. Defining selection criteria to improve yield under drought. Plant Growth Regul. 1996, 20, 157–166. [Google Scholar] [CrossRef]
  20. Kobata, T.; Koç, M.; Barutçular, C.; Tanno, K.-I.; Inagaki, M. Harvest index is a critical factor influencing the grain yield of diverse wheat species under rain-fed conditions in the Mediterranean zone of southeastern Turkey and northern Syria. Plant Prod. Sci. 2018, 21, 71–82. [Google Scholar] [CrossRef]
  21. García, G.A.; Serrago, R.A.; Appendino, M.L.; Lombardo, L.A.; Vanzetti, L.S.; Helguera, M.; Miralles, D.J. Variability of duration of pre-anthesis phases as a strategy for increasing wheat grain yield. Field Crops Res. 2011, 124, 408–416. [Google Scholar] [CrossRef]
  22. Sadras, V.O.; Lawson, C. Genetic gain in yield and associated changes in phenotype, trait plasticity and competitive ability of South Australian wheat varieties released between 1958 and 2007. Crop Pasture Sci. 2011, 62, 533–549. [Google Scholar] [CrossRef]
  23. Shearman, V.; Sylvester-Bradley, R.; Scott, R.; Foulkes, M. Physiological processes associated with wheat yield progress in the UK. Crop Sci. 2005, 45, 175–185. [Google Scholar]
  24. Pampana, S.; Mariotti, M.; Ercoli, L.; Masoni, A. Remobilization of dry matter, nitrogen and phosphorus in durum wheat as affected by genotype and environment. Ital. J. Agron. 2011, 2, 303–314. [Google Scholar] [CrossRef] [Green Version]
  25. Regmi, K.C.; Yogendra, K.; Farias, J.G.; Li, L.; Kandel, R.; Yadav, U.P.; Sha, S.; Trittermann, C.; Short, L.; George, J.; et al. Improved yield and photosynthate partitioning in AVP1 expressing wheat (Triticum aestivum) plants. Front. Plant Sci. 2020, 11, 273. [Google Scholar] [CrossRef] [PubMed] [Green Version]
  26. Zhang, Y.; Xu, W.; Wang, H.; Dong, H.; Qi, X.; Zhao, M.; Fang, Y.; Gao, C.; Hu, L. Progress in genetic improvement of grain yield and related physiological traits of Chinese wheat in Henan Province. Field Crop. Res. 2016, 199, 117–128. [Google Scholar] [CrossRef]
  27. Peixouto, L.S.; Nunes, J.A.R.; Furtado, D.F. Factor analysis applied to the G+GE matrix via REML/BLUP for multi-environment data. Crop Breed. Appl. Biotechnol. 2016, 16, 1–6. [Google Scholar] [CrossRef] [Green Version]
  28. Resende, M.D.V.d. Software Selegen-REML/BLUP: A useful tool for plant breeding. Crop Breed. Appl. Biotechnol. 2016, 16, 330–339. [Google Scholar] [CrossRef]
  29. Piepho, H.P.; Möhring, J.; Melchinger, A.E.; Büchse, A. BLUP for phenotypic selection in plant breeding and variety testing. Euphytica 2007, 161, 209–228. [Google Scholar] [CrossRef]
  30. Papakosta, D.K.; Gagianas, A. Nitrogen and dry matter accumulation, remobilization, and losses for Mediterranean wheat during grain filling. Agron. J. 1991, 83, 864–870. [Google Scholar] [CrossRef]
  31. Du, Y.-L.; Xi, Y.; Cui, T.; Anten, N.P.R.; Weiner, J.; Li, X.; Turner, N.C.; Zhao, Y.-M.; Li, F.-M. Yield components, reproductive allometry and the tradeoff between grain yield and yield stability in dryland spring wheat. Field Crop. Res. 2020, 257, 107930. [Google Scholar] [CrossRef]
  32. Fischer, R.A. Understanding the physiological basis of yield potential in wheat. J. Agric. Sci. 2007, 145, 99–113. [Google Scholar] [CrossRef]
  33. Borrás, L.; Slafer, G.A.; Otegui, M.E. Seed dry weight response to source–sink manipulations in wheat, maize and soybean: A quantitative reappraisal. Field Crop. Res. 2004, 86, 131–146. [Google Scholar] [CrossRef]
  34. Duggan, B.L.; Domitruk, D.R.; Fowler, D.B. Yield component variation in winter wheat grown under drought stress. Can. J. Plant Sci. 2000, 80, 739–745. [Google Scholar] [CrossRef] [Green Version]
  35. Tian, Z.; Jing, Q.; Dai, T.; Jiang, D.; Cao, W. Effects of genetic improvements on grain yield and agronomic traits of winter wheat in the Yangtze River Basin of China. Field Crop. Res. 2011, 124, 417–425. [Google Scholar] [CrossRef]
  36. Zhou, B.; Sanz-Sáez, Á.; Elazab, A.; Shen, T.; Sánchez-Bragado, R.; Bort, J.; Serret, M.D.; Araus, J.L. Physiological traits contributed to the recent increase in yield potential of winter wheat from Henan Province, China. J. Integr. Plant Biol. 2014, 56, 492–504. [Google Scholar] [CrossRef]
  37. Zhang, X.; Chen, S.; Sun, H.; Pei, D.; Wang, Y. Dry matter, harvest index, grain yield and water use efficiency as affected by water supply in winter wheat. Irrig. Sci. 2008, 27, 1–10. [Google Scholar] [CrossRef]
  38. Gebbing, T.; Schnyder, H. Pre-anthesis reserve utilization for protein and carbohydrate synthesis in grains of wheat. Plant Physiol. 1999, 121, 871–878. [Google Scholar] [CrossRef] [PubMed] [Green Version]
  39. Pheloung, P.C.; Siddique, K.H.M. Contribution of stem dry-matter to grain-yield in wheat cultivars. Aust. J. Plant Physiol. 1991, 18, 53–64. [Google Scholar] [CrossRef]
  40. Hossain, A.B.S.; Sears, R.G.; Cox, T.S.; Paulsen, G.M. Desiccation tolerance and its relationship to assimilate partitioning in winter-wheat. Crop Sci. 1990, 30, 622–627. [Google Scholar] [CrossRef]
  41. Blum, A.; Golan, G.; Mayer, J.; Sinmena, B.; Shpiler, L.; Burra, J. The drought response of landraces of wheat from the northern Negev Desert in Israel. Euphytica 1989, 43, 87–96. [Google Scholar] [CrossRef]
  42. Chen, W.; Sun, Y.; Zhang, S.; Palta, J.A.; Deng, X. The proportion of superior grains and the sink strength are the main yield contributors in modern winter wheat varieties grown in the Loess Plateau of China. Agronomy 2019, 9, 612. [Google Scholar] [CrossRef] [Green Version]
  43. Zhang, X.; Chen, S.; Sun, H.; Wang, Y.; Shao, L. Water use efficiency and associated traits in winter wheat cultivars in the North China Plain. Agric. Water Manag. 2010, 97, 1117–1125. [Google Scholar] [CrossRef]
  44. Li, F.M.; Liu, X.L.; Li, S.Q. Effects of early soil water distribution on the dry matter partition between roots and shoots of winter wheat. Agric. Water Manag. 2001, 49, 163–171. [Google Scholar] [CrossRef]
  45. Simane, B.; Peacock, J.M.; Struik, P.C. Differences in developmental plasticity and growth rate among drought-resistant and susceptible cultivars of durum wheat (Triticum turgidum L. var. durum). Plant Soil 1993, 157, 155–166. [Google Scholar] [CrossRef]
  46. Turner, N.C. Further progress in crop water relations. Adv. Agron. 1996, 58, 293–338. [Google Scholar]
  47. Álvaro, F.; Isidro, J.; Villegas, D.; García del Moral, L.F.; Royo, C. Breeding effects on grain filling, biomass partitioning, and remobilization in Mediterranean durum wheat. Agron. J. 2008, 100, 361–370. [Google Scholar] [CrossRef]
  48. Lopes, M.S.; Reynolds, M.P.; Jalal-Kamali, M.R.; Moussa, M.; Feltaous, Y.; Tahir, I.S.A.; Barma, N.; Vargas, M.; Mannes, Y.; Baum, M. The yield correlations of selectable physiological traits in a population of advanced spring wheat lines grown in warm and drought environments. Field Crop. Res. 2012, 128, 129–136. [Google Scholar] [CrossRef]
  49. Araus, J.L.; Slafer, G.A.; Reynolds, M.P.; Royo, C. Plant breeding and drought in C3 cereals: What should we breed for? Ann. Bot. 2002, 89, 925–940. [Google Scholar] [CrossRef] [PubMed]
  50. Araus, J.L.; Bort, J.; Steduto, P.; Villegas, D.; Royo, C. Breeding cereals for Mediterranean conditions: Ecophysiological clues for biotechnology application. Ann. Appl. Biol. 2003, 142, 129–141. [Google Scholar] [CrossRef]
  51. Álvaro, F.; Royo, C.; García del Moral, L.F.; Villegas, D. Grain filling and dry matter translocation responses to source-sink modifications in a historical series of durum wheat. Crop Sci. 2008, 48, 1523–1531. [Google Scholar] [CrossRef] [Green Version]
  52. Li, F.R.; Zhao, S.L.; Geballe, G.T. Water use patterns and agronomic performance for some cropping systems with and without fallow crops in a semi-arid environment of northwest China. Agric. Ecosyst. Environ. 2000, 79, 129–142. [Google Scholar] [CrossRef]
  53. Zhao, F.; Lei, J.; Wang, R.; Wang, H.; Qiang, Y.U. Determining agricultural drought for spring wheat with statistical models in a semi-arid climate. J. Agric. Meteorol. 2018, 74, 162–172. [Google Scholar] [CrossRef] [Green Version]
  54. Austin, R.B.; Ford, M.A.; Morgan, C.L. Genetic improvement in the yield of winter wheat: A further evaluation. J. Agric. Sci. 1989, 112, 295–301. [Google Scholar] [CrossRef]
  55. Loss, S.P.; Kirby, E.J.M.; Siddique, K.H.M.; Perry, M.W. Grain growth and development of old and modern Australian wheats. Field Crop. Res. 1989, 21, 131–146. [Google Scholar] [CrossRef]
  56. Foulkes, M.J.; Slafer, G.A.; Davies, W.J.; Berry, P.M.; Sylvester-Bradley, R.; Martre, P.; Calderini, D.F.; Griffiths, S.; Reynolds, M.P. Raising yield potential of wheat. III. Optimizing partitioning to grain while maintaining lodging resistance. J. Exp. Bot. 2011, 62, 469–486. [Google Scholar] [CrossRef] [Green Version]
  57. Yang, J.; Zhang, J. Grain filling of cereals under soil drying. N. Phytol. 2006, 169, 223–236. [Google Scholar] [CrossRef]
  58. Metzger, D.D.; Czaplewski, S.J.; Rasmusson, D.C. Grain-Filling duration and yield in sring barley.1. Crop Sci. 1984, 24, 1101–1105. [Google Scholar] [CrossRef]
  59. Sadras, V.O. Evolutionary aspects of the trade-off between seed size and number in crops. Field Crop. Res. 2007, 100, 125–138. [Google Scholar] [CrossRef]
  60. Ugarte, C.; Calderini, D.F.; Slafer, G.A. Grain weight and grain number responsiveness to pre-anthesis temperature in wheat, barley and triticale. Field Crop. Res. 2007, 100, 240–248. [Google Scholar] [CrossRef]
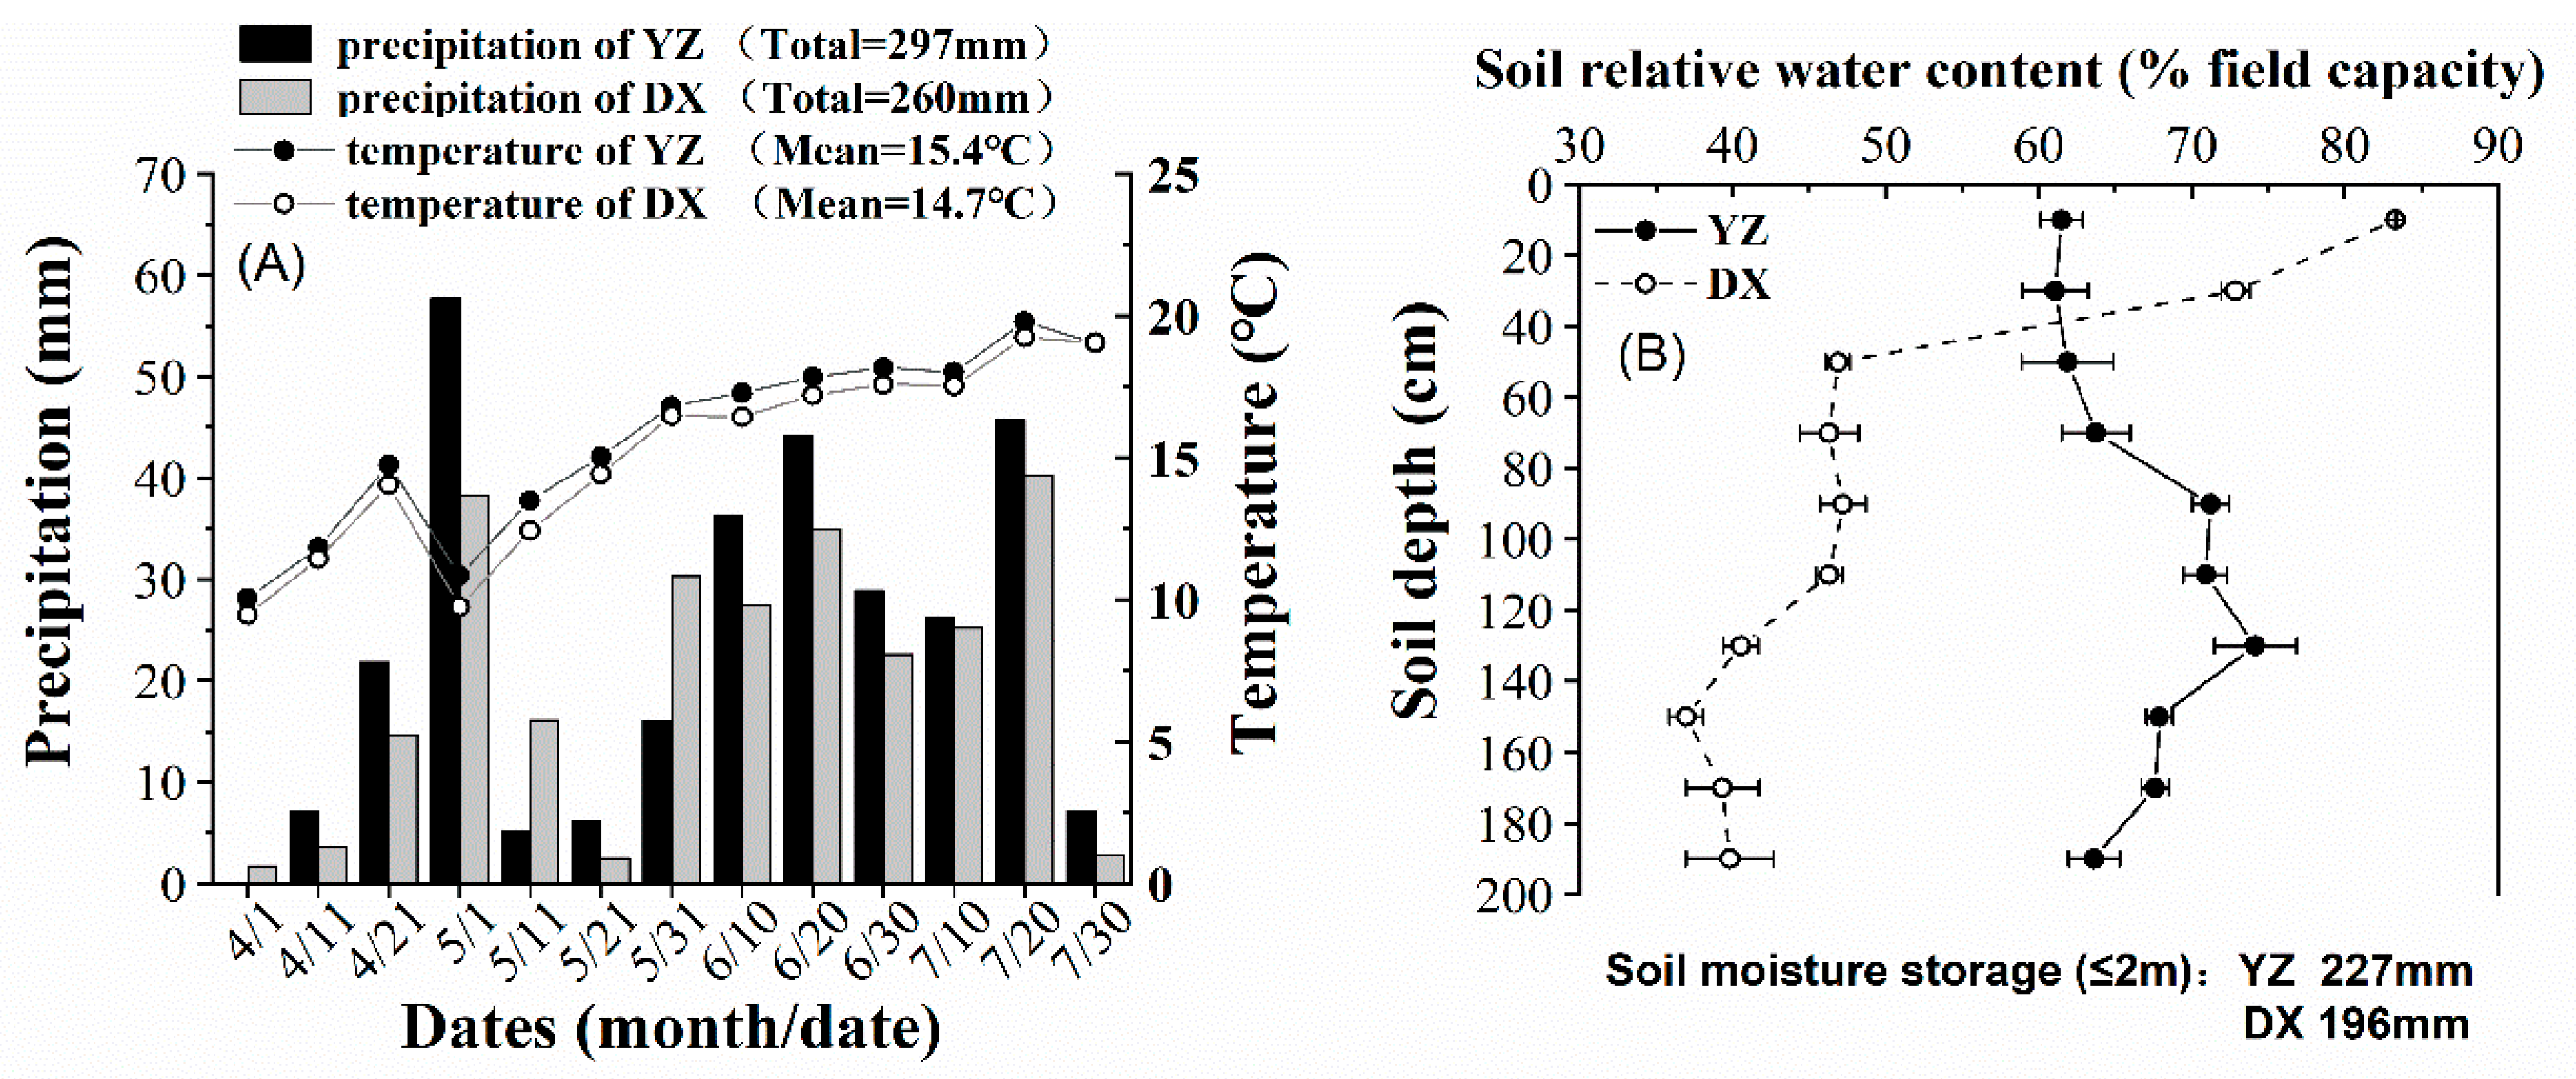
Figure 1. (A) Cumulative 10-day precipitation and mean 10-day air temperature during the growth period of wheat (April–July 2019) at Yuzhong (YZ) and Dingxi (DX). The date in the x-axis is the first day of the 10-day periods.; (B) Soil relative water content as a percentage of the field capacity of the upper 2 m of the soil profile at YZ and DX just prior to sowing.
Agronomy 11 00663 g001
Figure 2. The relationship between grain yield by best linear unbiased prediction (BLUP) and (A) spike number by BLUP; (B) grain number by BLUP; and (C) 1000-kernel weight by BLUP. Only the significant linear regressions are shown. * p < 0.05; ** p < 0.01.
Agronomy 11 00663 g002
Figure 3. The relationships between grain yield by BLUP and length of pre-anthesis period by BLUP, length of post-anthesis period by BLUP, and length of the entire growth period by BLUP. Only the significant linear regressions are shown. ** p < 0.01.
Agronomy 11 00663 g003
Figure 4. The relationships between (A) grain yield by BLUP and water use by BLUP; (B) length of the growth period by BLUP and water use by BLUP; (C) grain yield by BLUP and daily water use by BLUP; (D) grain yield by BLUP and effective use of water (EUW) by BLUP over different growth stages. Only the significant linear regressions are shown. The circled genotype in (A) is 021-128, which was not included in the linear regression (see text). * p < 0.05; ** p < 0.01; *** p < 0.001. Note change of scale of y-axis for pre- and post-anthesis EUW in Figure 4D.
Agronomy 11 00663 g004
Figure 5. The relationships between: (A) water use before anthesis and aboveground biomass at anthesis; (B) water use after anthesis and aboveground biomass accumulation after anthesis; (C) soil water content at anthesis and aboveground biomass at anthesis; (D) soil water content at anthesis and grain yield at YZ and at DX. Fitted data are the mean of three replications for 16 genotypes; a single regression is fitted where the two sites did not differ significantly. The circled genotype in (D) is 021-128, which is not included in the linear regression. * p < 0.05; ** p < 0.01; *** p < 0.001.
Agronomy 11 00663 g005
Figure 6. The relationship between grain yield by BLUP and (A) accumulation of aboveground biomass in the pre-anthesis, post-anthesis, and at maturity by BLUP; (B) percentage of pre-anthesis biomass mobilized to grain yield by BLUP; (C) harvest index by BLUP; and (D) water use efficiency (WUE) by BLUP. Only the significant linear regressions are shown. ** p < 0.01; *** p < 0.001.
Agronomy 11 00663 g006
Table 1. The effect of genotype (G) and environment (E) and their interaction (G X E) on grain yield and yield-related traits of spike number, grain number per spike, 1000-kernel weight, water use from sowing to maturity, water use efficiency (WUE), harvest index, pre-anthesis aboveground biomass accumulation, post-anthesis aboveground biomass accumulation, total aboveground biomass, and grain yield. * p < 0.05; ** p < 0.01; *** p < 0.001; ns not significant. The values before the asterisks are the least significance differences at p = 0.05.
TraitsGenotype (G)Environment (E)G × E
Spike number (m−2)46.61 ***16.48 ***65.92 **
Grain number (spike−1)3.63 ***1.28 ***5.13 ***
1000-kernel weight (g)2.03 ***0.72 ***2.86 ***
Water use (L)23.09 ***8.16 ***32.65 ns
WUE (g L−1)0.14 ***0.05 ns0.20 ns
Harvest index0.035 ***0.012 **0.049 **
Pre-anthesis aboveground biomass accumulation (g m−2)53.12 ***18.78 ***75.12 **
Post-anthesis aboveground biomass accumulation (g m−2)46.59 ***16.47 *65.89 **
Total aboveground biomass (g m−2)81.73 ***28.90 ***115.58 ns
Grain yield (g m−2)38.82 ***13.73 ***54.90 ***
Publisher’s Note: MDPI stays neutral with regard to jurisdictional claims in published maps and institutional affiliations.