Article

Discovery of Anthocyanin Biosynthetic Pathway in Cosmos caudatus Kunth. Using Omics Analysis

1
Institute of Systems Biology, Universiti Kebangsaan Malaysia, Bangi 43600, Selangor, Malaysia
2
Malaysian Palm Oil Board, No 6, Persiaran Institusi, Bandar Baru Bangi, Kajang 43000, Selangor, Malaysia
3
Department of Biological Sciences and Biotechnology, Faculty of Science and Technology, Universiti Kebangsaan Malaysia, Bangi 43600, Selangor, Malaysia
*
Author to whom correspondence should be addressed.
Agronomy 2021, 11(4), 661; https://doi.org/10.3390/agronomy11040661
Submission received: 26 January 2021 / Revised: 9 March 2021 / Accepted: 17 March 2021 / Published: 31 March 2021

Abstract

:
Cosmos caudatus Kunth. or “king’s salad” contains high values of nutritional compounds that act as health promoters. Although widely consumed for its medicinal value, information on phytochemical contents and their biosynthesis in the species is scarce. Among the interesting compounds are the anthocyanins that possess a dual role; an antioxidant and natural colorant. A complete anthocyanin biosynthetic pathway in C. caudatus was elucidated using transcriptomics, metabolomics, and anatomical approaches in this study. The transcriptomic analysis revealed genes encoding enzymes in the anthocyanin biosynthetic pathway and the genes encoding the transcription factors relevant to the latter pathway. A total of 11 anthocyanins of cyanidin, pelargonidin, and delphinidin derivatives that are significantly abundant in the species were identified, correlating with the anthocyanin mainstream gene pathway. The occurrence of anthocyanin was further validated by light microscopy. Anthocyanin pigments in C. caudatus were detected at the epidermal layer of the leaf, stem, and flower, and at the cortex of stem and root. To our knowledge, this is the first work that has delineated the complete anthocyanin biosynthetic pathway in Malaysia’s underutilized plant, C. caudatus Kunth. This study correlated multi-omics data that will help integrate systems biology and synthetic biology, for a detailed understanding of the molecular mechanism and characterization of the anthocyanin biosynthesis using heterologous expression studies.

1. Introduction

Anthocyanin has garnered the attention of researchers due to its potent antioxidant properties and potential for lowering the risk of cancer [1], heart problems [2,3], regulating blood glucose level [4], and acting in preventing carcinogenesis [5]. Anthocyanin constitutes a class of flavonoids that play a pivotal role in the coloration of fruits and most flowers, as well as various plant tissues such as the root, stem, and leaves [6,7]. The word anthocyanin is derived from the Greek term anthos, flower, and kyanos, dark blue, referring to the colored pigments commonly found in angiosperms [8]. Anthocyanins are secondary metabolites derived from the phenylpropanoid pathway’s biosynthetic network, which has been well-studied in various plant species such as Oryza sativa, Arabidopsis thaliana, and Malus domestica [9,10,11].
In general, two classes of genes are involved in this pathway; the structural genes encoding the enzymes that directly participate in forming anthocyanins and the regulatory genes controlling these structural gene’s expression [12]. Environmental factors such as light, temperature, environmental stress, and loss of nutrient elements affect the expression levels of both structural and regulatory genes and correspondingly promote or inhibit the synthesis and accumulation of anthocyanin, resulting in different colorations in plant tissues [13]. The use of anthocyanins as a natural food colorant and additive approved by the Food and Drug Administration (FDA) and European nations (E-163) is, however, still limited due to their non-stable properties at different pH and temperatures [7].
C. caudatus is also known as king’s salad in Malaysia due to its unique flavor. C. caudatus was found to have the highest phenolic content among other medicinal plants [14]. It is considered a potential source of dietary flavonoids and can be incorporated into the daily human diet [15,16]. In Malaysia, the plant is widely recognized for its pharmaceutical properties [17]. Due to its nutritional value, the demand for this species has drastically increased as various researchers have proven that its consumption helps regulate blood circulation and promote bone formation [18,19]. Other studies have demonstrated the medicinal effects of C. caudatus, such as being anti-hypertensive [20] and antioxidant [21,22,23], as well as its antimicrobial and antifungal activity [24,25]. Although C. caudatus is generally known to possess a myriad of bioactive phytochemicals, available reports on its anthocyanin metabolite profile are scarce. The total anthocyanin content of the species has been reported to be as high as 0.78 ± 0.05 mg/100 g of fresh weight sample using liquid extraction methods in comparison to other plants with intense color; in addition to the presence of several other metabolites such as quercetin, β-carotene, kaempferol, ascorbic acid, and ferulic acid [14,26].
Despite the importance of anthocyanin as a potential nutraceutical product, its biological pathways and specific compounds of interest produced by C. caudatus have not been studied. Lack of genomic information is one of the limiting factors in further exploration of the C. caudatus biosynthetic pathways contributing to its medicinal properties. This research gap has created a need to explore the species more comprehensively using omics technology. Omics technology has enabled the identification of whole complex frameworks underlying different mechanisms in plant metabolism. Next-generation sequencing (NGS) of RNA in transcriptome analysis has been widely used to analyze specific genes for identifying various biosynthetic pathways. This technique is crucial and advantageous in exploring non-model plants [27,28,29]. For plant metabolomic platforms, liquid chromatography-mass spectrometry (LC-MS) has been extensively used in profiling secondary metabolites, such as phenylpropanoids and alkaloids [30,31,32,33,34,35,36,37]. The correlation of information from multi-omics analysis platforms will increase our understanding of the medicinal properties of C. caudatus and encourage information trade with other model plants [38].
Several studies focusing on metabolites from C. caudatus extracts of different tissues have been performed, using chromatography and spectroscopy analysis [21,25,39,40,41]. More information needs to be gained to shed light on this important species; therefore, we further expanded the investigation by employing advanced and holistic omics methodologies. This is the first report of complementary approaches, in which the C. caudatus transcriptome analysis was combined with metabolite profiling and anatomical investigation of the leaf, flower, stem, and root, to describe the anthocyanin biosynthetic pathways in C. caudatus.

2. Materials and Methods

2.1. Plant Cultivation and Maintenance

C. caudatus seeds were sown in germination pots and transferred to the plot of an open field after two weeks, with an average daily sunlight of 7 h. The plants were watered daily, while fertilizer was applied every three weeks. Generally, the plant was grown in the warm and humid conditions of the tropics. Samples of leaf, flower, stem, and root tissues of C. caudatus were harvested from the experimental herbal plot at the UKM campus, Bangi, Malaysia, at the recorded GPS location 2.922165, 101.788304, after 10 weeks of growth, specifically when the plants began flowering, for further analysis.

2.2. RNA Extraction for Transcriptomic Analysis

Samples of each of the harvested tissues were frozen immediately in liquid nitrogen and stored at −80 °C. Each tissue sample was ground using a mortar and pestle with liquid nitrogen. According to the manufacturer’s protocols, the total RNA from each tissue (powdered sample) was extracted using a Qiagen RNeasy Plant Mini Kit (Hilden, Germany). The quality check of the RNA was done using Bioanalyzer 2100 (Agilent Technologies, Santa Clara, CA, USA), where an RNA integrity number (RIN) of 7 or higher was used for sequencing [42]. One biological replicate for each tissue was used for sequencing, in which the obtained result for all four tissues was assembled for further analysis. All the apparatus and disposable items used throughout this study were maintained in a sterile condition.

2.3. cDNA Library Construction and Illumina Sequencing

The cDNA library preparation was done using SureSelect Strand-Specific RNA Library Prep (Agilent Technologies, Santa Clara, CA, USA). Oligo (dT) magnetic beads were used to isolate the RNAs and fragmentation buffer was used to fragment them into small pieces. Reverse transcription of the first and second-strand cDNA was obtained using First Strand Master Mix. cDNA was ligated with adapters to both ends of the fragments using a SureSelect Oligo Adaptor, followed by attaching DNA to the surface to allow bridge amplification and denaturation of the double-stranded molecules. The sequencing of cDNA libraries was performed using the Illumina Hiseq4000 150PE (Theragene Etex, Seoul, Korea) platform.

2.4. De Novo Transcriptome Assembly

Adapter sequences were removed from raw read data using “cutadapt” followed by raw data filter out reads with inaccurate bases >10% and <Q20 using an in-house script by TheragenEtex Bio Institute (Seoul, Gyeonggi-do, Korea). The remaining clean reads from the sample library were assembled. Trinity software version 2.0.2 was used to assemble the sequences using de novo assembly [43]. All transcripts were clustered using TGICL software to eliminate redundant sequences, and the most extended transcript in each cluster was selected as unigene [44].

2.5. Gene Annotation and Classification

The assembled unigene sequences were used to perform searches in public databases, including the NCBI non-redundant protein (NR) and UniProt. A homology search was done using BLASTx local and InterProScan, and setting an e-value threshold of <1 × 10⁻⁵. The Uniprot database id was uploaded to the online database PANTHER (http://www.pantherdb.org/ accessed online on 24 December 2019) to retrieve the gene ontology (GO) annotation, according to molecular function, biological process, and cellular components, apart from each sample’s protein class. The same database was then used to perform a GO functional classification [45]. Pathway assignments were carried out based on the Kyoto Encyclopedia of Genes and Genomes (KEGG) database [46]. The coding region of the transcripts was identified using Transdecoder (http://transdecoder.sf.net accessed online on 15 November 2019). The transcription factors were predicted based on transcripts uploaded in the online database PlantTFDB version 5.0 (http://planttfdb.gao-lab.org/index.php accessed online on 22 February 2020). The domains of the anthocyanin key genes using peptide sequences were searched against InterProScan software (https://www.ebi.ac.uk/interpro accessed online on 21 February 2021) [47].

2.6. Metabolite Extraction

The samples from the four tissues of three biological replicates each were immersed in liquid nitrogen before grinding using a mortar and pestle. For each of the tissues and its replicates, 1 g of the pulverized sample was transferred into a vial followed by the addition of 10 mL 100% MeOH for metabolite extraction [48]. The mixture was vigorously vortexed for 1 min, followed by sonication in a water bath (S30H, Elma, Singen, Germany) at room temperature, at the maximum frequency of 37 kHz, for approximately 15 min. Filtration of the samples was carried out using a 0.22 µm nylon membrane filter with a syringe aid. The extracts were then transferred into autosampler glass vials before liquid chromatography-mass spectrometry (LC-MS) analysis. All the solvents and chemicals used in this study were HPLC grade.

2.7. LC-MS Analysis

Separation of the extracts was performed on a Thermo Scientific C18 reversed-phase column of AcclaimTM Polar Advantage II, 3 × 150 mm dimension, 3 µm particle size on a Dionex UltiMate 3000 ultra-high-performance liquid chromatography (UHPLC) system (Thermo Fisher Scientific, Waltham, MA, USA) thermostatted column compartment at 40 °C. The flow rate was constant at 0.4 mL/min using H2O and 0.1% formic acid as solvent A, and 100% acetonitrile as solvent B, with 22 min of total run time. The gradient began at 5% B (0–3 min); 80% B (3–10 min); 80% B (10–15 min); and 5% B (15–22 min). The injection volume of the sample was 1 µL. For mass spectrometry (MS) detection, MicrOTOF-Q III (Bruker Daltonik GmbH, Bremen, Germany) was used for high-resolution MS, in positive electrospray ionization (ESI) mode, in the following conditions: capillary voltage: 4500 V; nebulizer pressure: 1.2 bar; drying gas: 8 L/min at 200 °C. The mass range was set at the mass-to-charge ratio (m/z) of 50–1000 [49].

2.8. Statistical and Multivariate Analysis

Data obtained from the time-of-flight (TOF) analyzer was processed using Compass Data Analysis software, version 4.2 (Bruker, Bremen, Germany). The data file obtained in .d format was converted to .csv (comma-separated values) format file. Signal-to-noise ratio value (S/N) of 10 and a smoothing width of 3 was applied to the entire data set to perform data analysis. The metabolome data was normalized to a reference feature of caffeine (m/z 195.0877), spiked as an internal standard in the samples. The data were also analyzed using one-way analysis of variance (ANOVA) in MetaboAnalyst 3.0 online software [50] for anthocyanins with p < 0.05 significant values. The heatmap was constructed using the default Euclidean distance measure and Ward clustering algorithm in MetaboAnalyst 3.0 and viewed as group averages.

2.9. Anatomy Studies

The sectioning of the fresh leaf, stem, flower petal, and root tissues was performed using a sliding microtome and sections were viewed immediately, without any staining procedure using a light microscope, Olympus BX43 (Tokyo, Japan) connected to Olympus DP72 (Tokyo, Japan) and Canon EOS 700D (Tokyo, Japan) cameras. Photographs of the cells were taken and processed using Analysis Docu and EOS Utility 2 software. The images were observed under magnifications of 10× and 20× for a clearer cell view. Images were saved as tagged image file format (TIFF) files. As the cells’ distribution was similar within replicates, each tissue replicate’s best image was processed further.

3. Results

3.1. Transcriptome Analysis

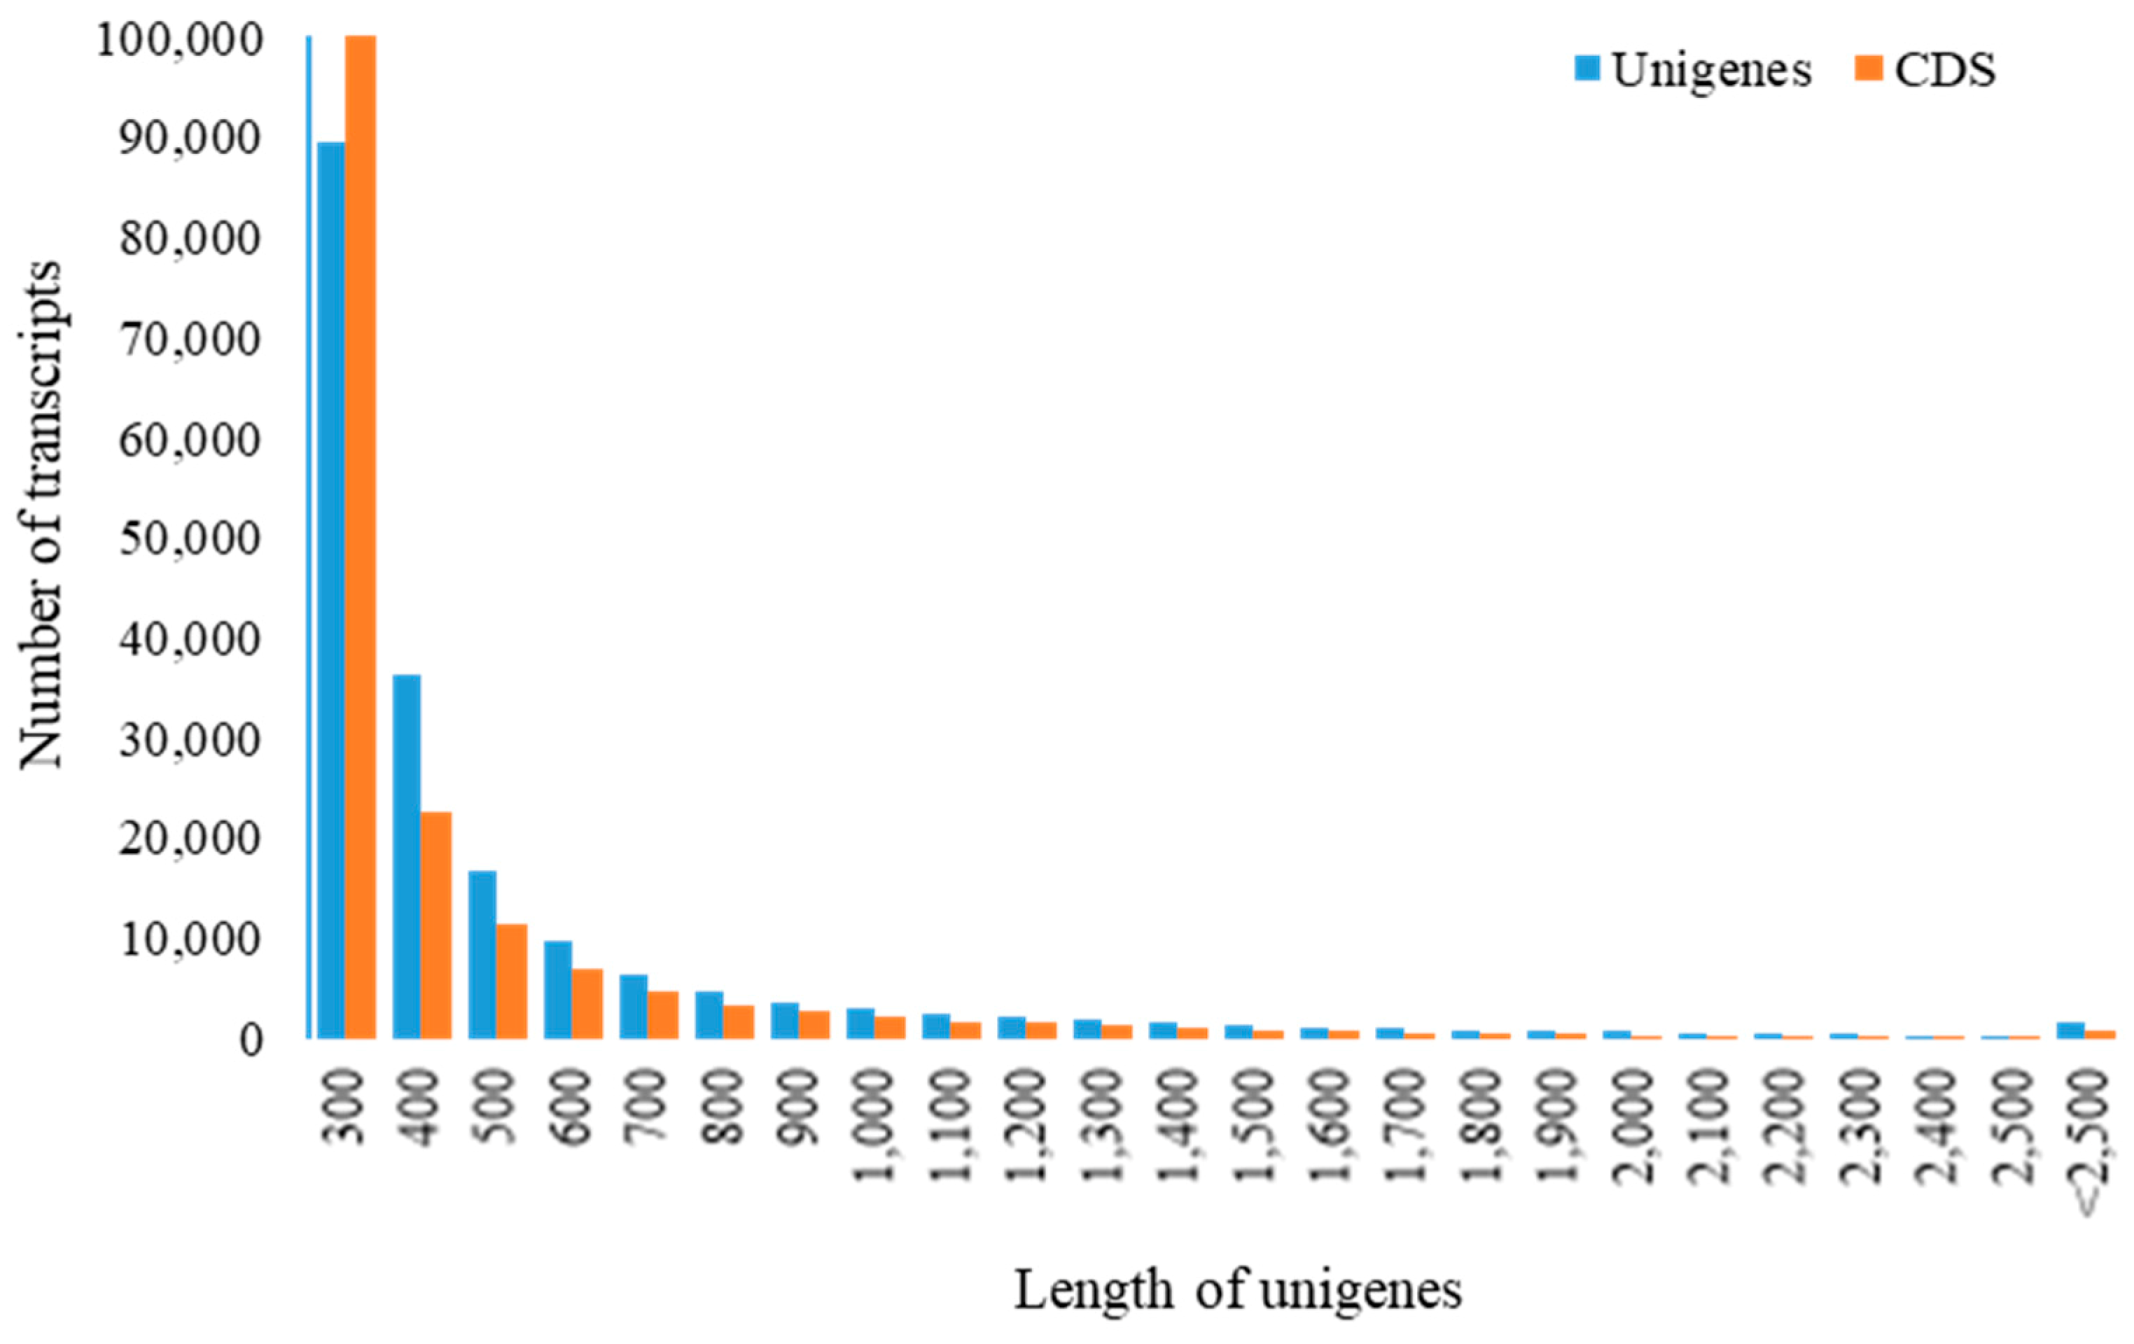
3.1.1. High-Throughput Sequencing and De Novo Sequence Assembly of C. caudatus Transcriptome

The high-throughput transcriptome sequencing of C. caudatus using Illumina Hiseq4000 (150PE) produced 263,163,738 total raw reads. After data cleaning, 242,973,712 total clean reads were obtained, and 68,120,202, 60,354,324, 55,512,786, and 58,986,400 reads were from root, flower, leaf, and stem libraries, respectively (Supplementary S1). All clean reads from the four libraries were assembled, the length distribution of unigenes is shown in Figure 1. Out of the total unigene (187,206) sequences found, most unigenes obtained had a length between 200 and 500 nucleotides (nt). The total assembly statistics showed a GC content of 41.89%, with average contigs of 476.71 based on statistical analysis (Table 1). In addition, the open reading frames (ORFs) analysis using Transdecoder showed that 89.34% of the total transcripts (167,252 sequences) contained the predicted coding sequences (CDS). Among the predicted CDS, 18.74% (31,338 sequences) contained both start and stop codon, indicating these transcripts contained full-length CDS.

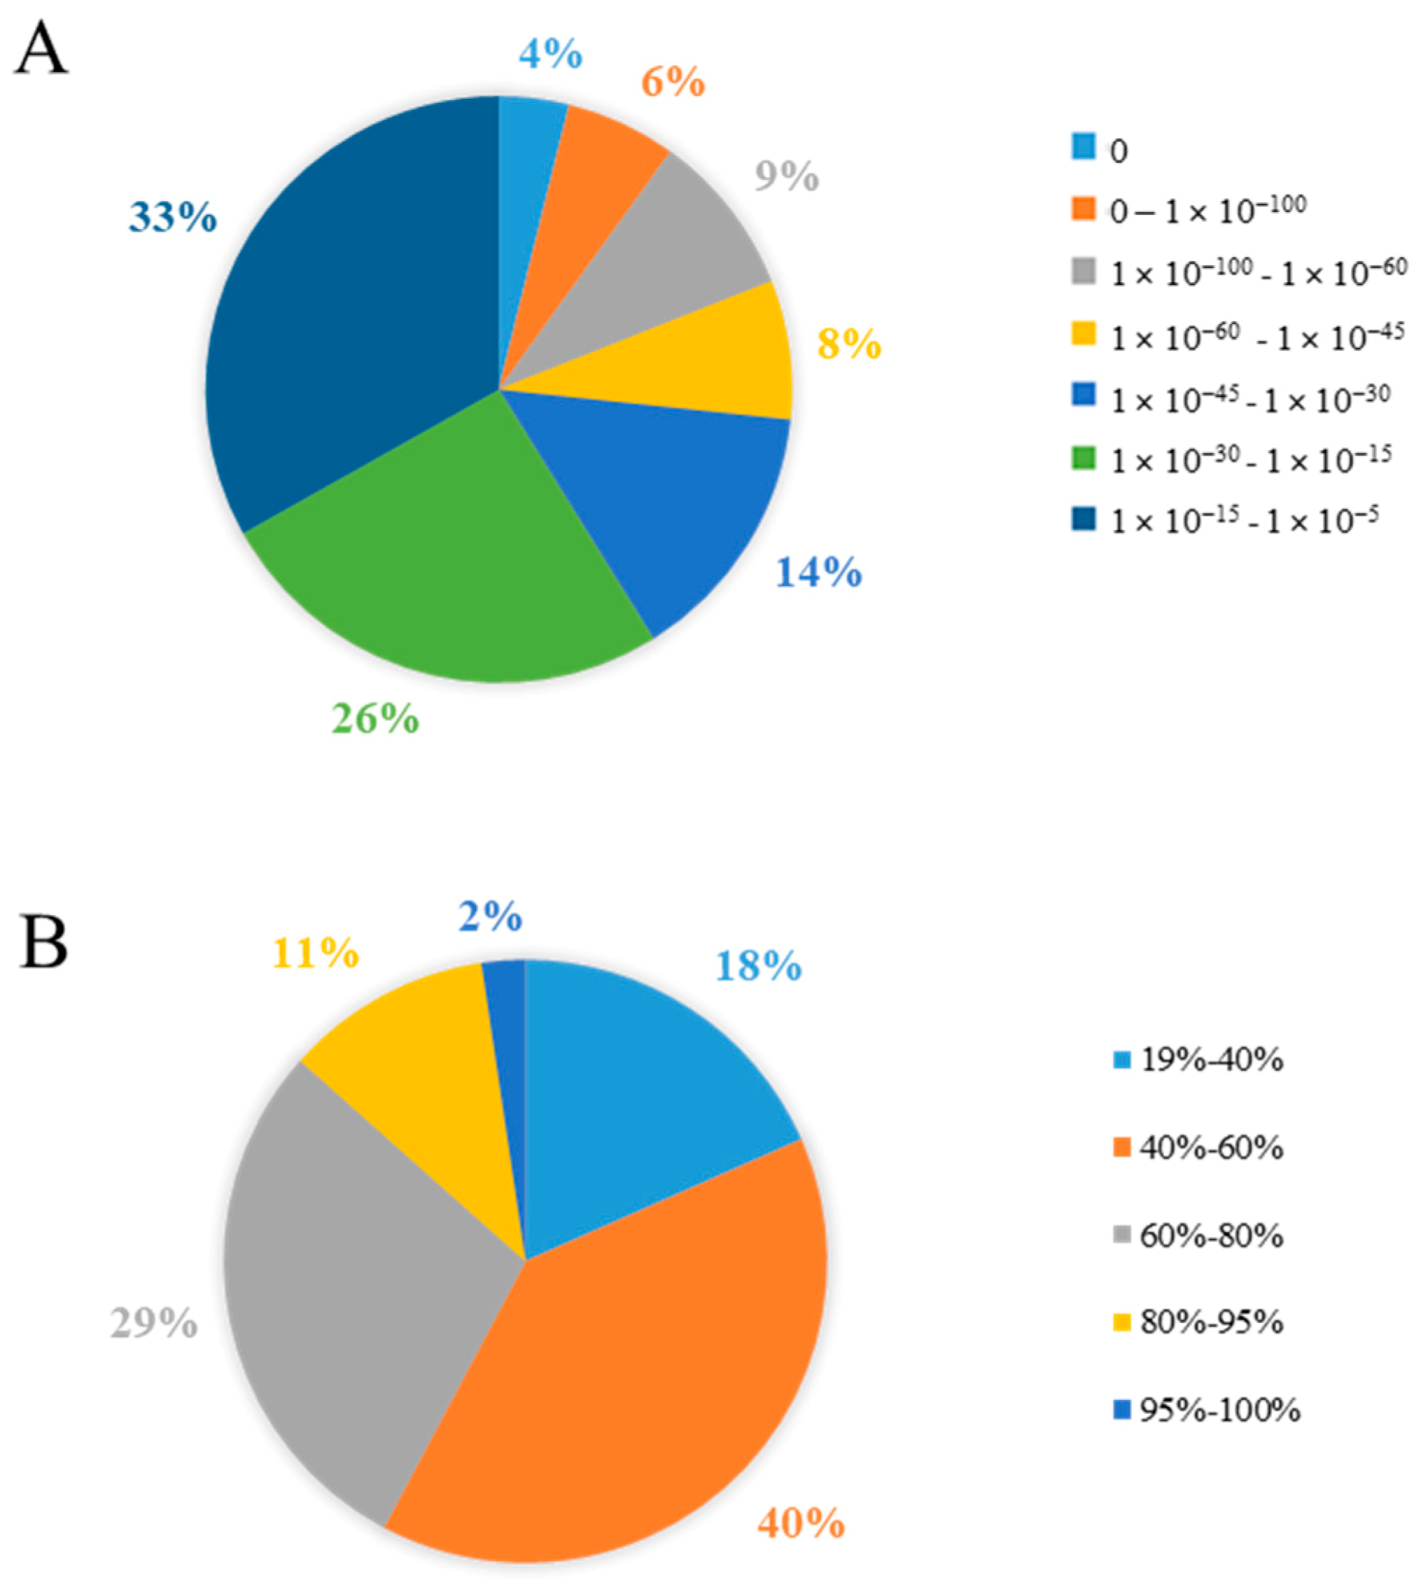
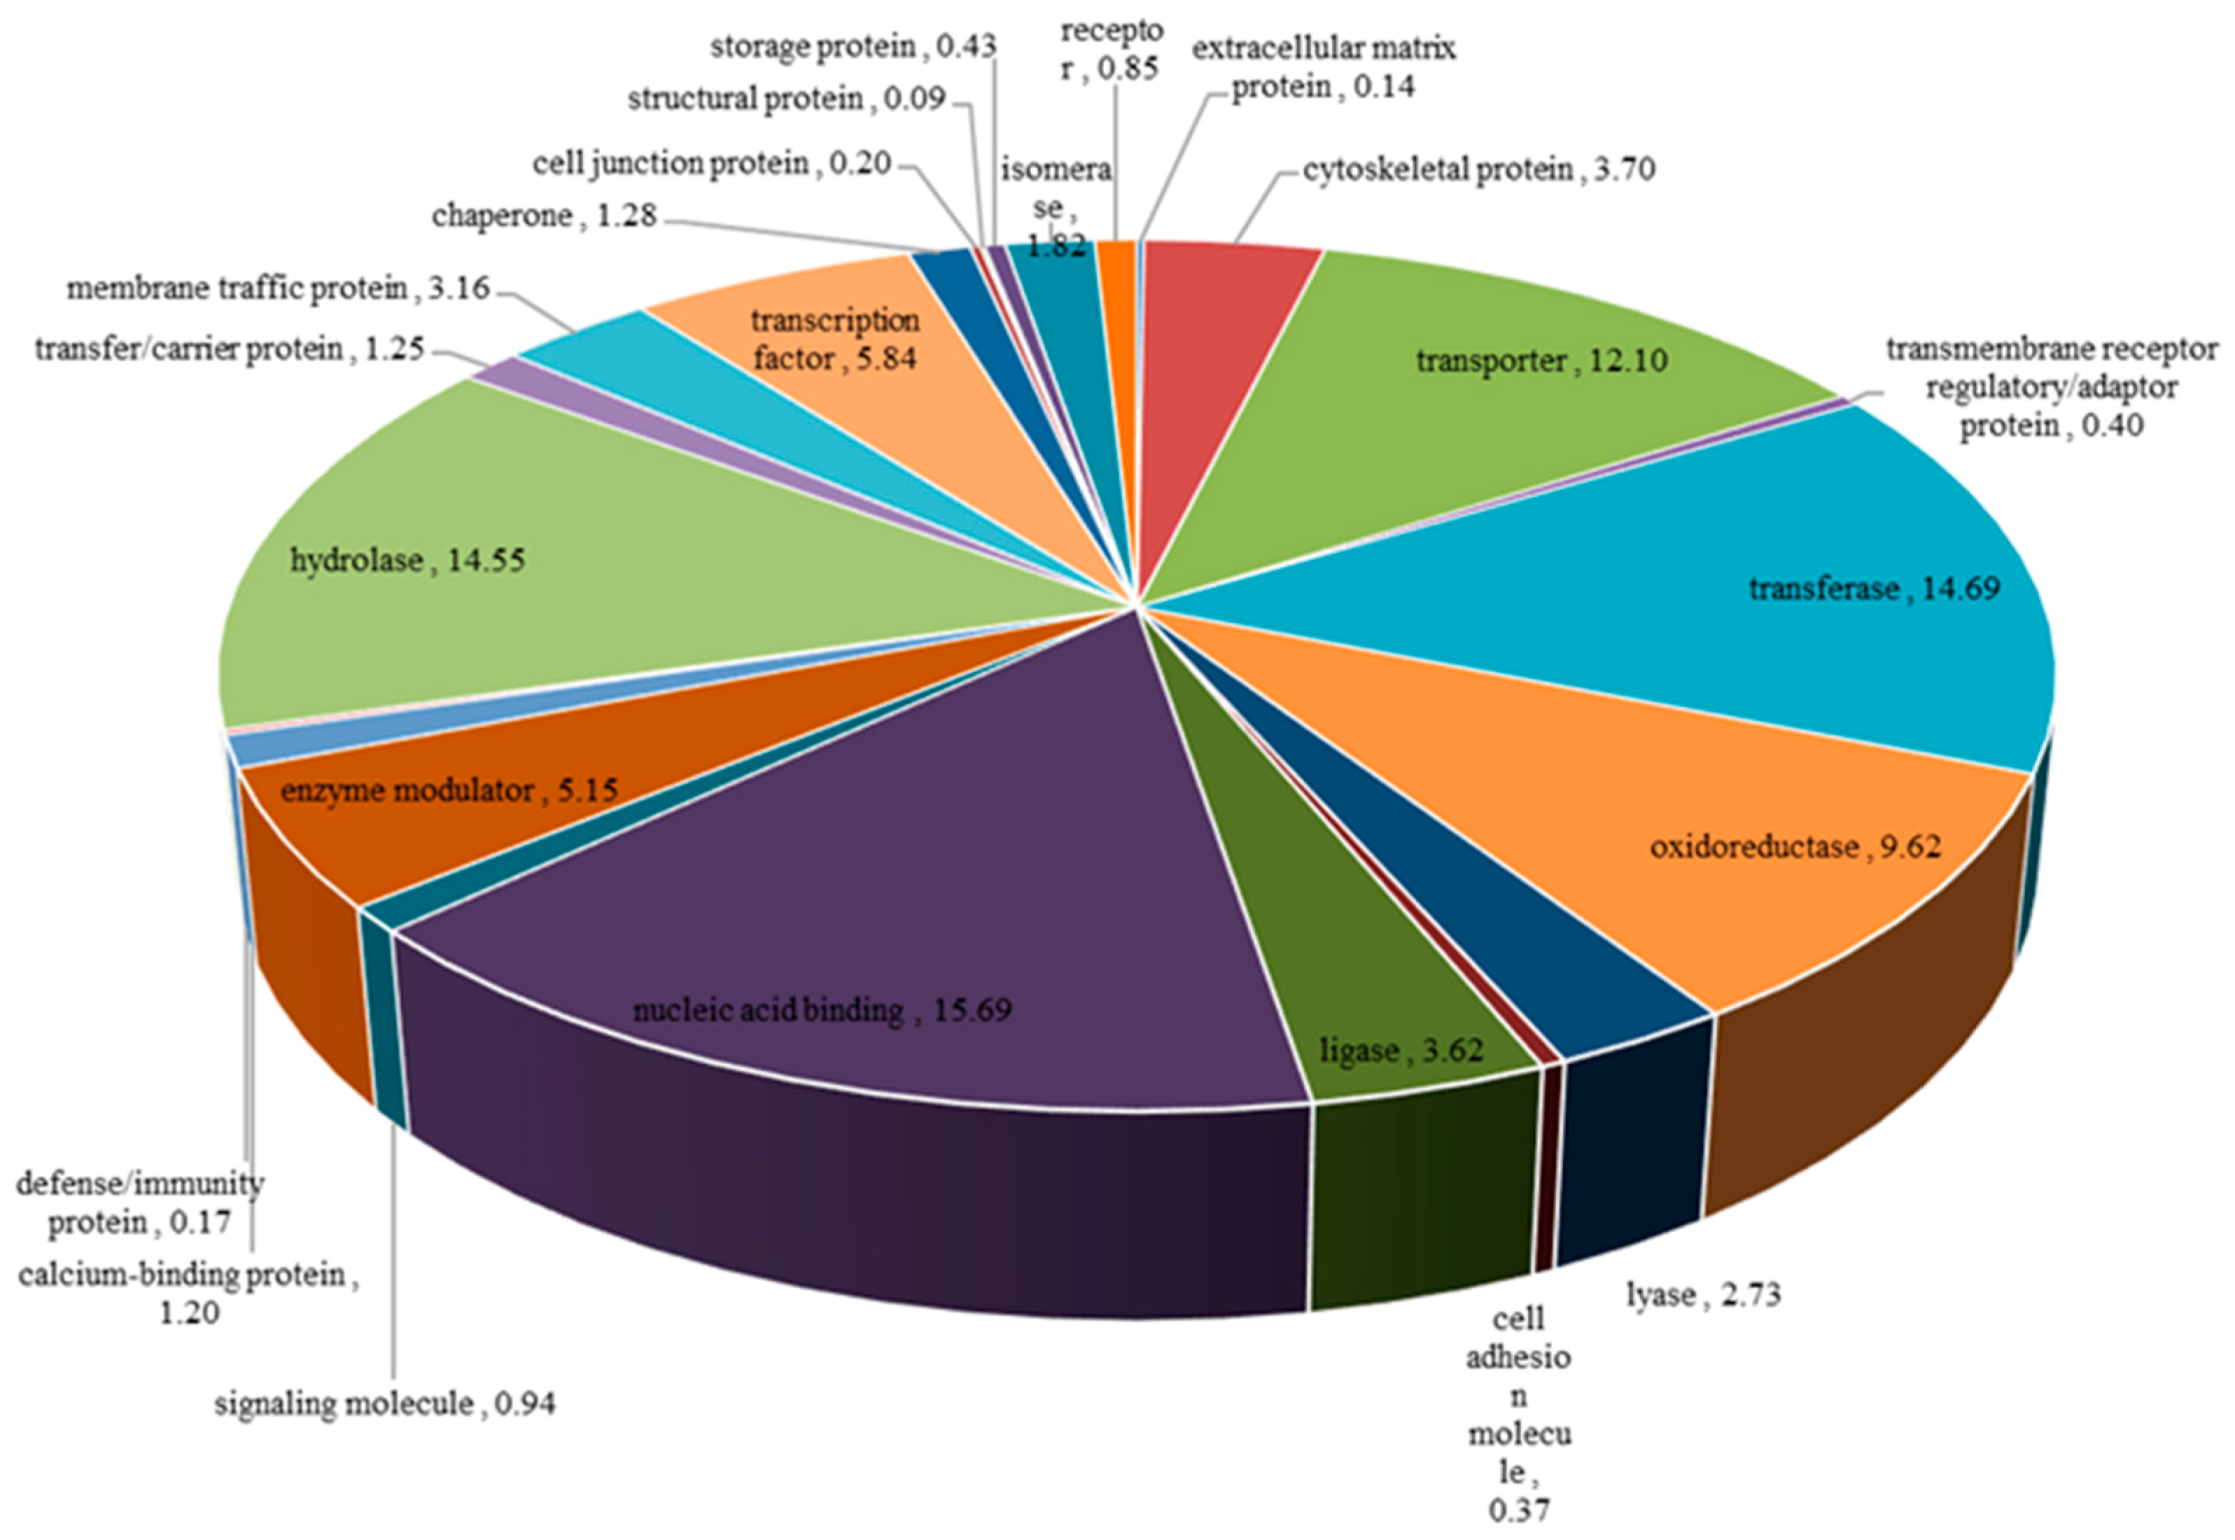
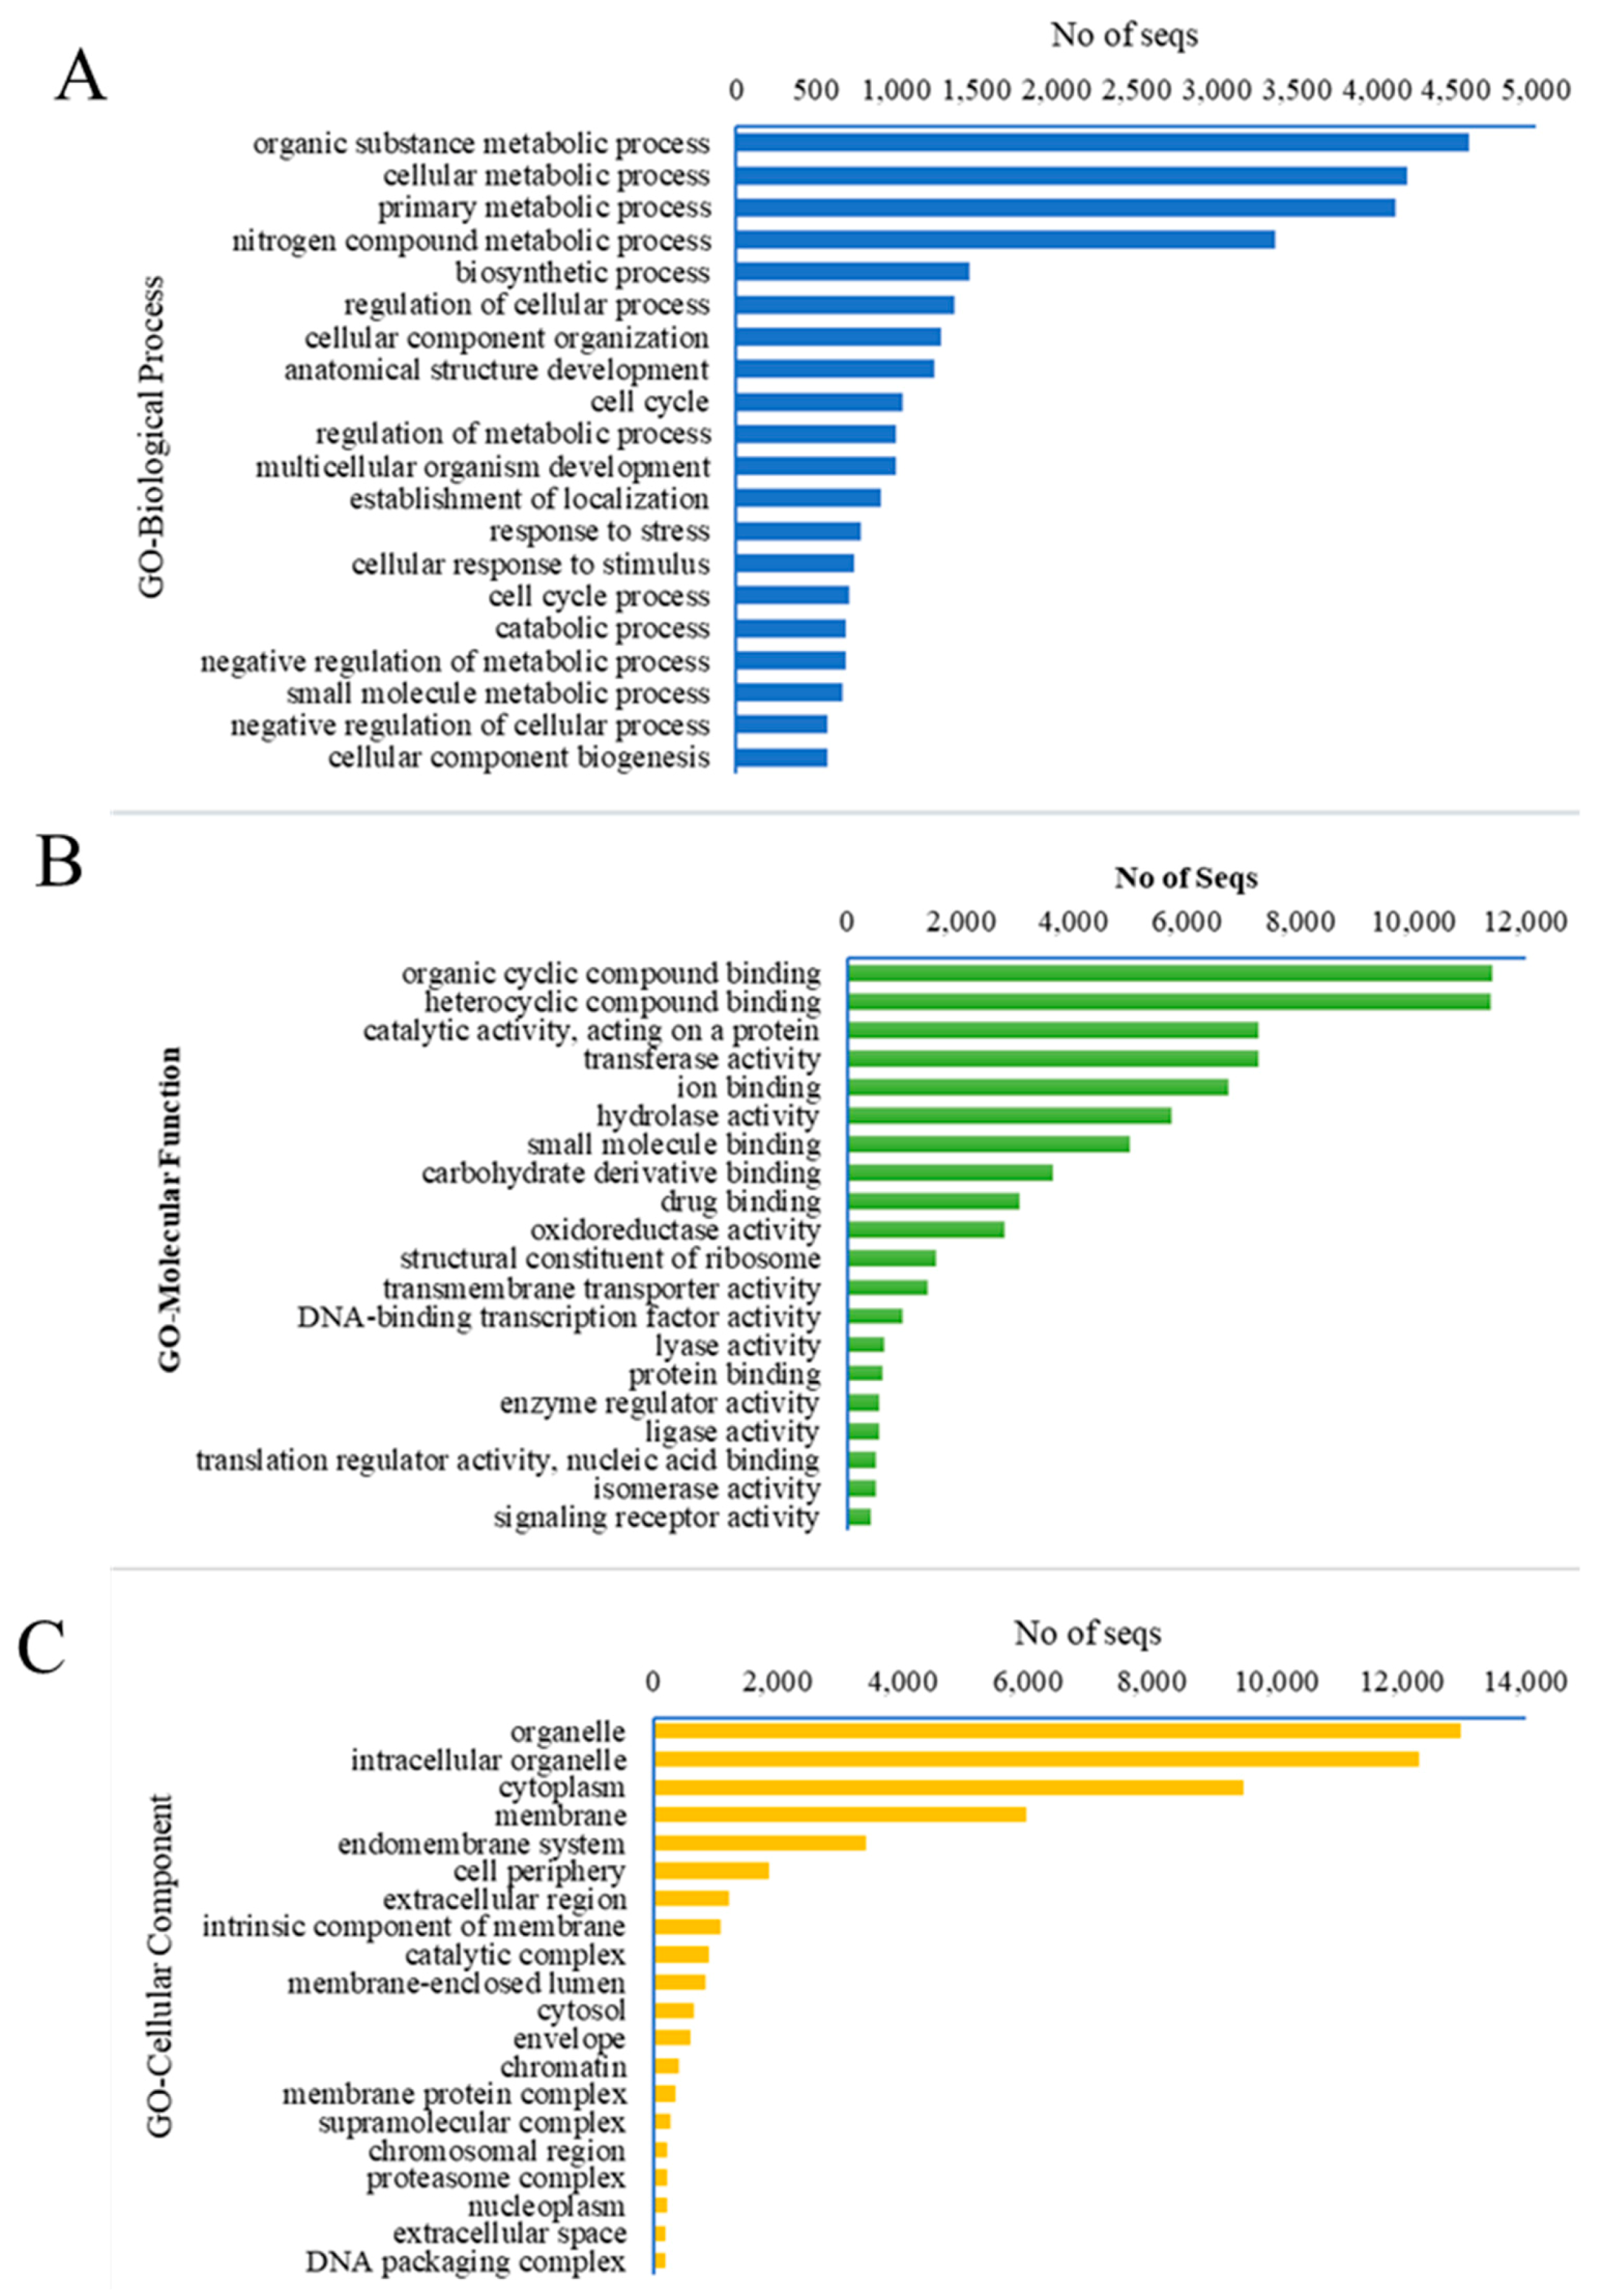
3.1.2. Functional Annotation of Unigenes

To further analyze the criteria of the obtained C. caudatus transcriptome, all unigenes were annotated against the NCBI non-redundant protein database (NR), Swiss-Prot, Interpro, and Kyoto Encyclopedia of Genes and Genomes (KEGG) databases (Table 2). Blastx analysis with the threshold value of e-value < 1 × 10⁻⁵ successfully matched 51.25% and 38.25% of our unigenes to a known protein available in the NR and Swiss-Prot databases. The E-value distribution showed 27% of our annotated unigenes had a homology of an e-value < 1 × 10−45 with a known protein, while the remaining annotated unigenes showed homology with an e-value more than 1 × 10−45 (Figure 2). Our annotated unigenes’ similarity distribution showed that 81% of these genes had similarities higher than 40% to known proteins. Altogether, these results indicated that transcripts of C. caudatus are conserved in comparison with known proteins.
The predicted abundant protein classes found in the C. caudatus transcriptome are shown in Figure 3. The nucleic acid-binding (PC00171) protein family members were present in the highest numbers, due to the interactions between nucleic acid and other protein domains are fundamental to the entire genetic information’s maintenance and the accessions of an organism, as these enzymes are predominant to various biological related processes [51,52]. The protein classes of transferase (PC00220) and hydrolase (PC00121) account for the second most abundant protein class in the species with a similar distribution value. Transferases catalyze a particular functional group’s relocation from one donor molecule to an acceptor molecule, while hydrolases catalyze the complex compounds’ cleavage through hydrolytic action [53,54]. Transporter (PC00227) protein accounts for the fourth most abundant protein class in the C. caudatus plant, as it aids the movement of a wide range of molecules and ions transversing the membrane of cells [55].
Gene ontology analysis was carried out to elucidate the function of C. caudatus predicted unigenes. Based on the sequence similarity, a total of 70,065 unigenes were assigned with one or more GO terms. The number of GO terms per transcript ranged from 1 to 167. In total, 14,894 GO terms were successfully assigned to our unigenes and were classified into three major categories: biological process, molecular function, and cellular component (Figure 4). Within the biological process GO category, organic substance metabolic process (4583 unigenes), cellular metabolic process (4195 unigenes), and primary metabolic process (4118 unigenes) were the most abundant groups. The molecular function GO category was dominated by organic cyclic compound binding (11,398 unigenes), heterocyclic compound binding (11,379), and catalytic activity, acting on a protein (7278 unigenes). Moreover, under the cellular component category, organelles (12,964 unigenes), intracellular organelles (12,275 unigenes), and cytoplasm (9474 unigenes) were found to be the most dominant groups.
KEGG pathway analysis was then performed to understand the specific function further, and identify active biological pathways in C. caudatus [47]. A total of 49,984 of our CDS were assigned to 7251 KEGG ortholog groups and 433 biological pathways, which were classed into several main categories, including metabolism, genetic information processing, environmental information processing, and cellular processes. Many CDS (573 CDS) were assigned to the biosynthesis of secondary metabolites pathways, including phenylpropanoid biosynthesis, flavonoid biosynthesis, anthocyanin biosynthesis, isoflavonoid biosynthesis, and isoquinoline alkaloid biosynthesis. In this study, annotated unigenes with the processes associated with anthocyanin biosynthesis were selected for further analysis.

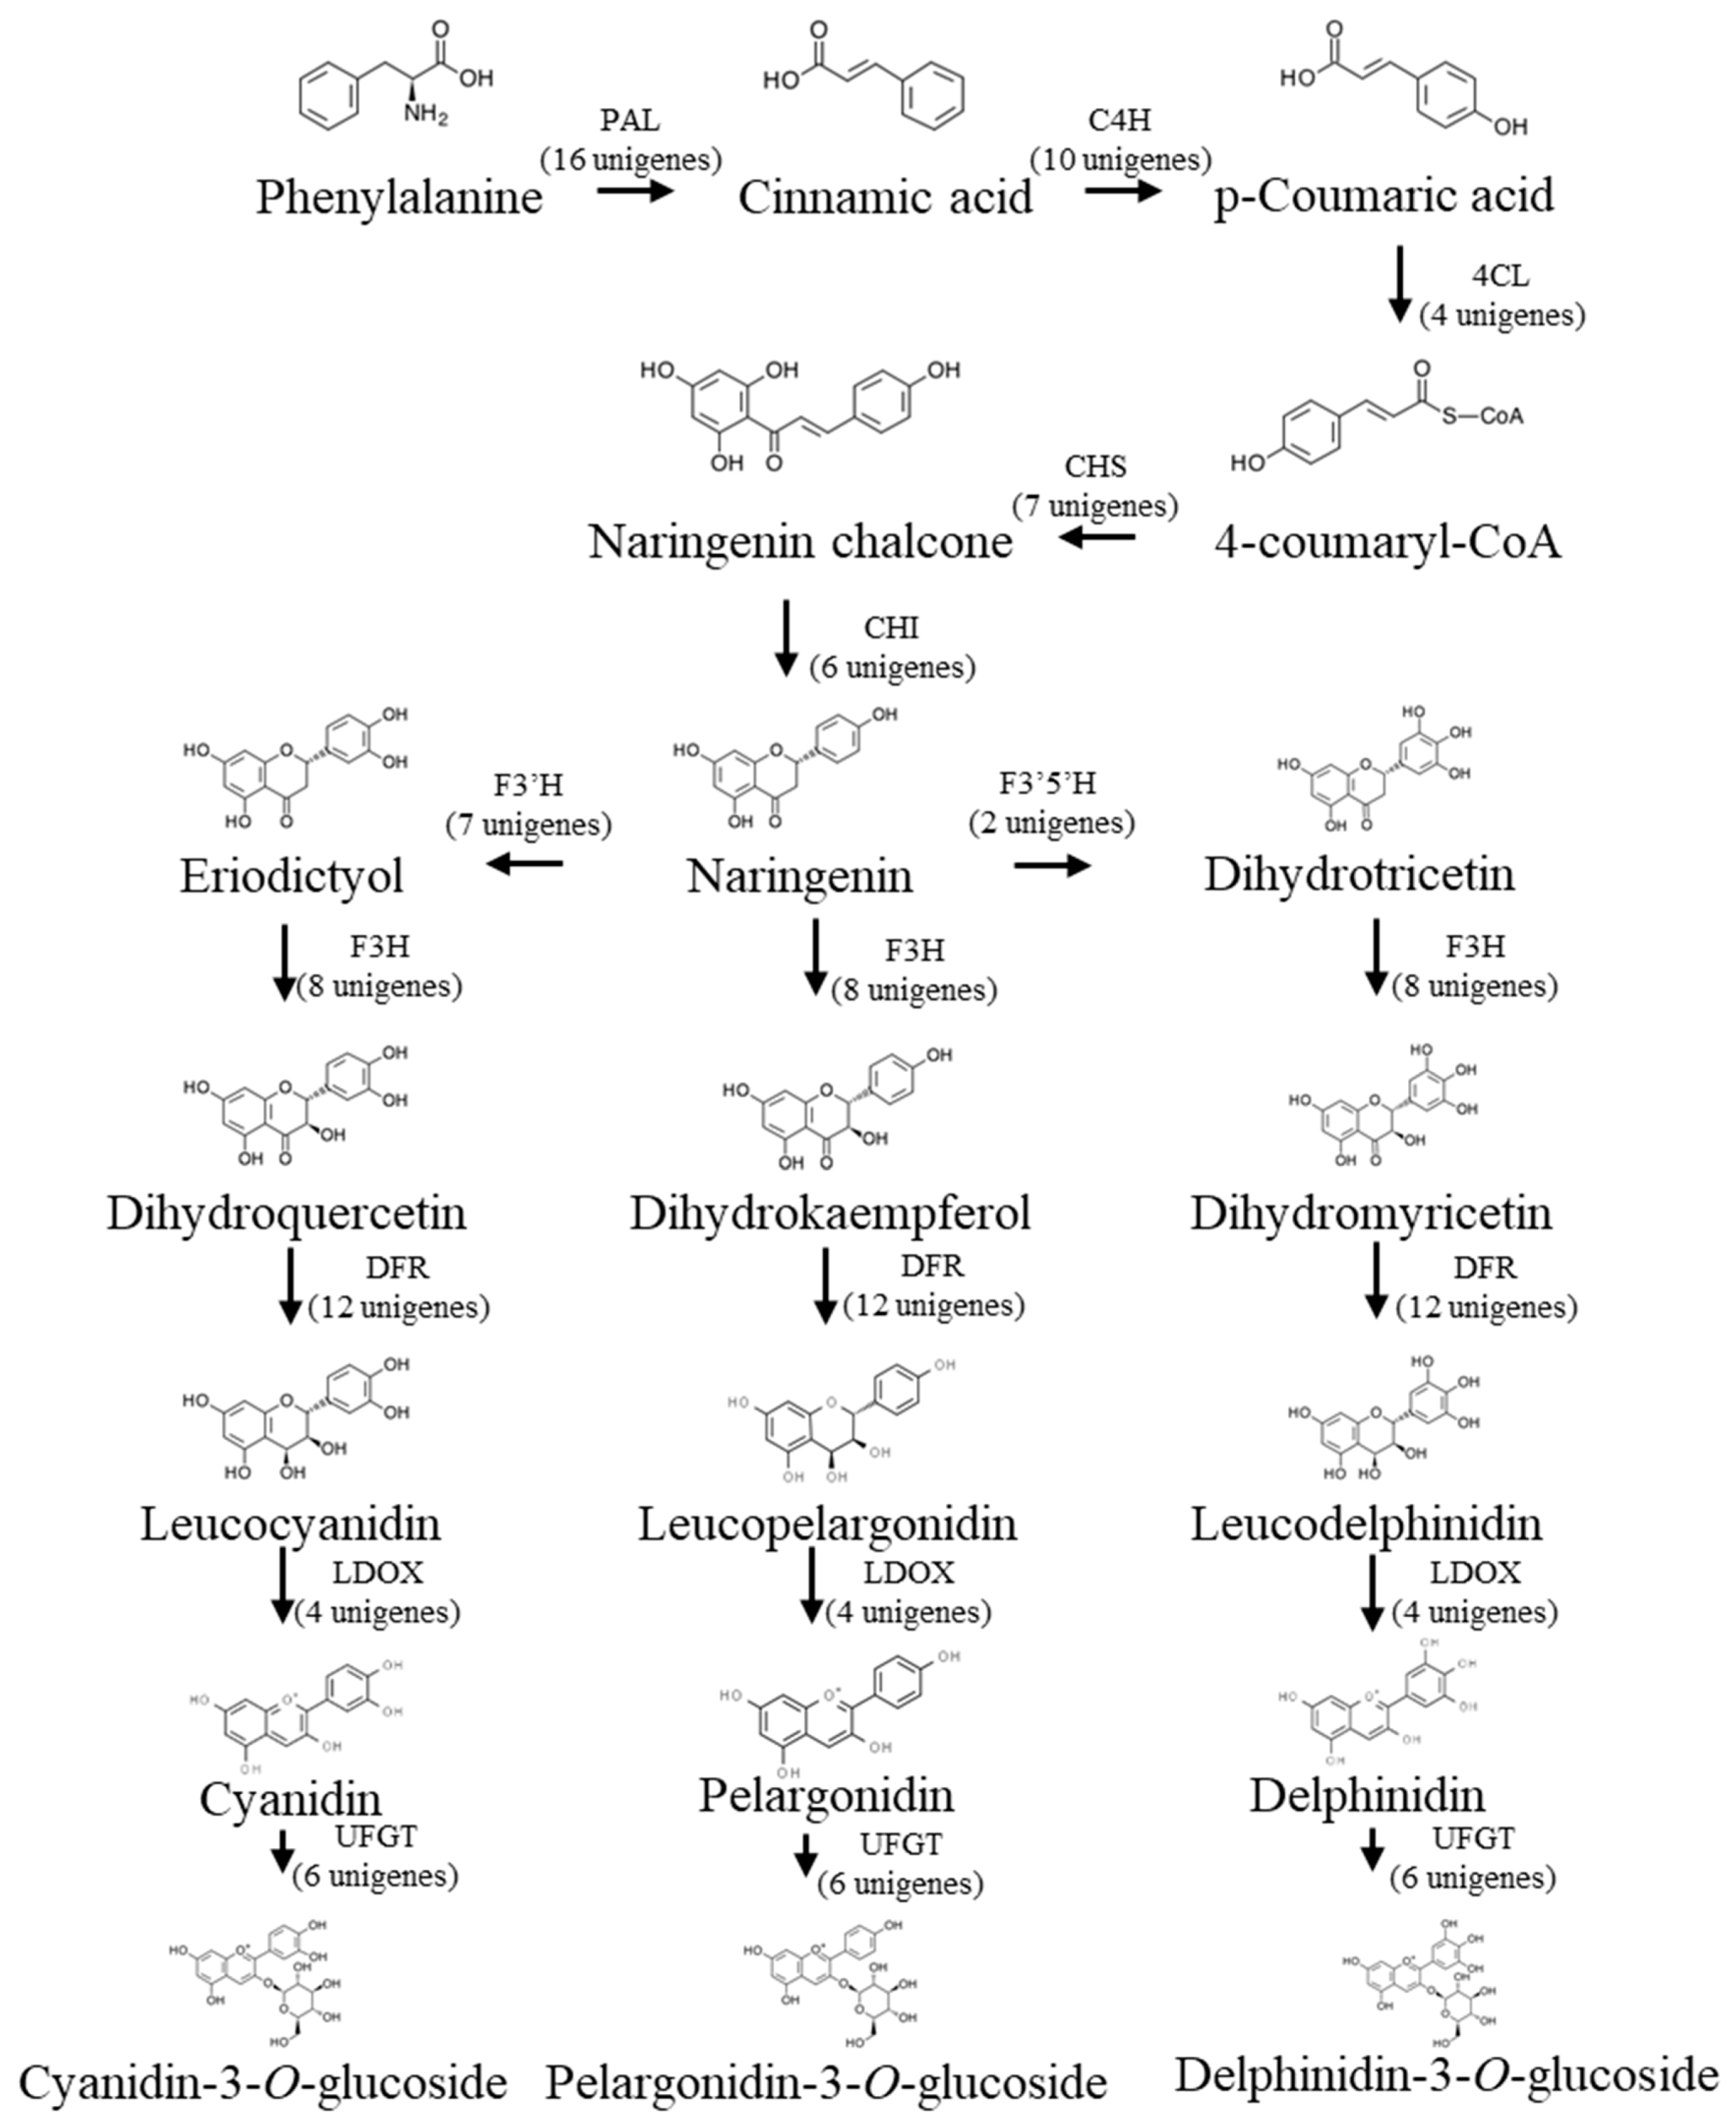
3.1.3. Candidate Genes for Anthocyanin Biosynthesis

The unigenes from C. caudatus transcripts involved in the anthocyanin biosynthetic pathway remapped from unigenes correlated with the KEGG pathway database (Figure 5). The mapping was done by integration of three KEGG pathways; the phenylpropanoid pathway (map00940), flavonoid pathway (map00941), and anthocyanin biosynthesis pathway (map00942). The anthocyanin biosynthesis pathway generally starts from the phenylpropanoid pathway towards the flavonoid biosynthesis pathway, followed by the anthocyanin biosynthesis pathway responsible for synthesizing various types of anthocyanin. In our study, a total of 82 unigenes belonging to 11 main enzymes in the anthocyanin biosynthesis have been discovered. Among these unigenes, 30 are mapped to three general phenylpropanoid enzymes (PAL, C4H, and 4CL), 30 are early (CHS, CHI, F3H, F3′H, and F3′5′H) and 22 are late (DFR, LDOX, and UFGT) anthocyanin biosynthetic genes in which all these genes complete the whole anthocyanin biosynthetic pathway. The anthocyanin biosynthetic pathway begins from L-phenylalanine, which is then converted into chalcones by enzymes of phenylalanine ammonia-lyase (PAL; 16 unigenes), cinnamate 4-hydroxylase (C4H; 10 unigenes), 4-coumarate CoA ligase (4CL; 4 unigenes), and chalcone synthase (CHS; 7 unigenes) in the phenylpropanoid pathway. Along this line, stereospecific cyclization of chalcones catalyzed by the enzyme chalcone isomerase (CHI; 6 unigenes) forms either naringenin or flavanones. Hydroxylation of flavanones by the enzyme flavanone 3-hydroxylase (F3H; 8 unigenes) forms dihydroflavonols which are then converted to leucoanthocyanidins by dihydroflavonol 4-reductase (DFR; 12 unigenes) during the pathway branching towards the anthocyanin production. Conversion of leucoanthocyanidins into anthocyanidin was through the activity of leucoanthocyanidin dioxygenase (LDOX; 4 unigenes). In either form, anthocyanins were then produced by the enzyme UDP glucose activity: flavonoid-3-O-glucosyltransferase (UFGT; 6 unigenes). The peptide sequence of four key genes of the anthocyanin biosynthesis pathway (F3H, DFR, LDOX, and UFGT) found in the transcript of C. caudatus were searched for their domain region to further confirm the characteristics of the genes were as the functions predicted. Table 3 summarizes each key gene’s domain characteristics from C. caudatus transcripts based on the UniprotPro database. The domain hit for the sequence of respective genes is included in Supplementary S4.

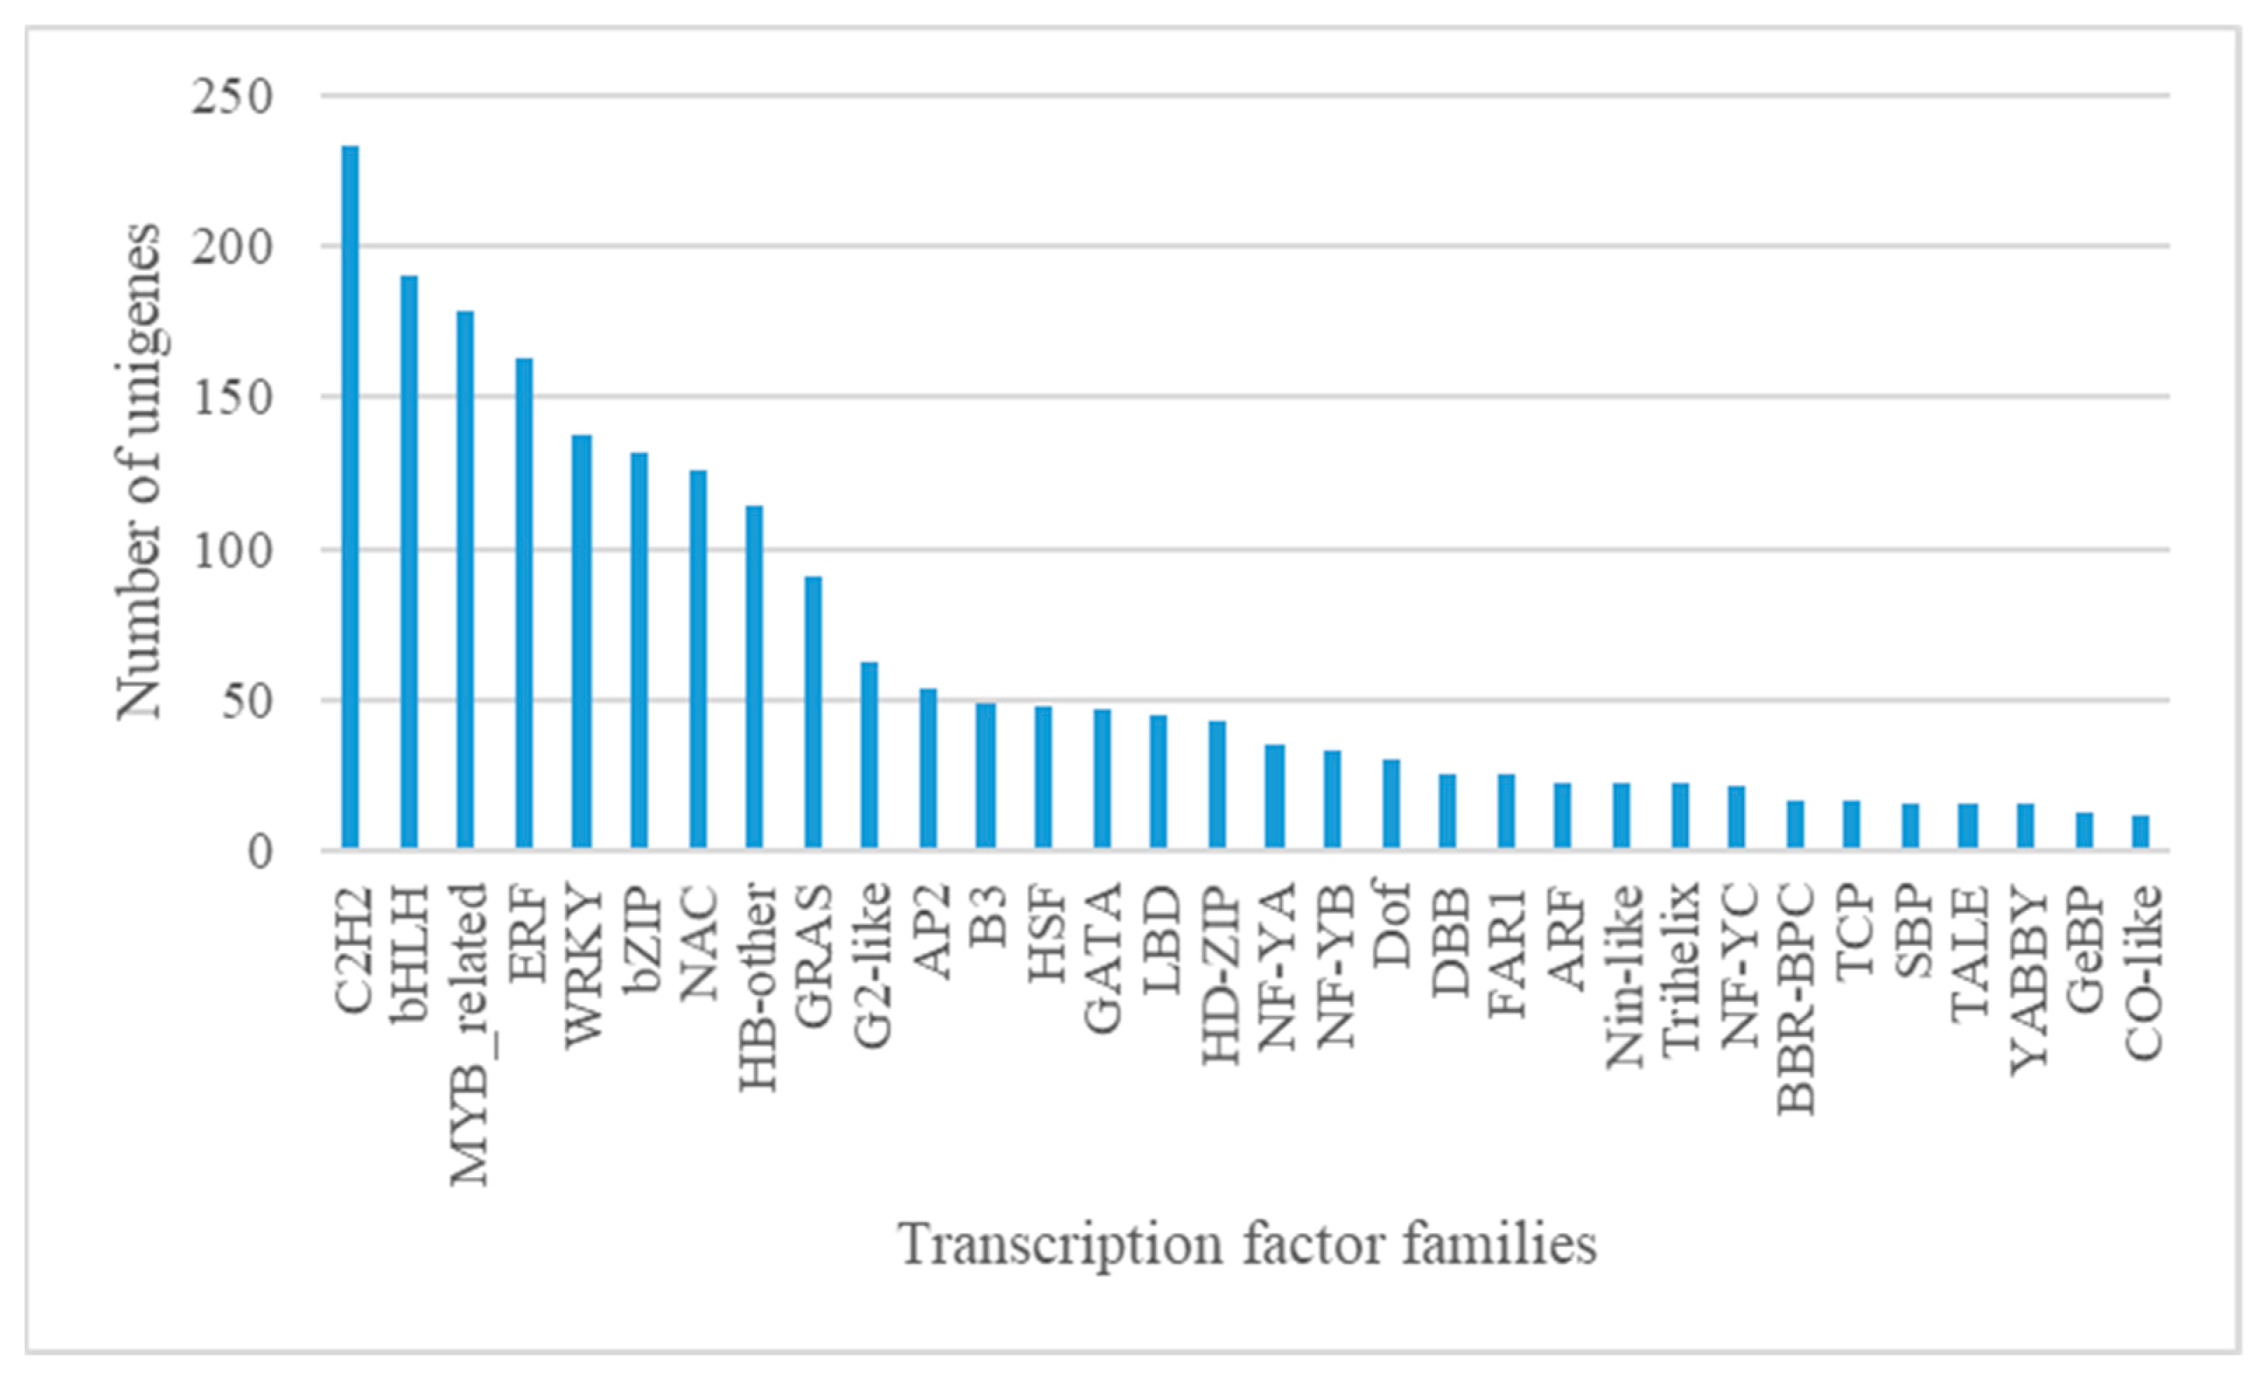
3.1.4. Candidate Transcription Factors (TFs) Involved in Anthocyanin Biosynthesis and Transport

Several TFs regulate the anthocyanin biosynthetic pathways, namely C2H2, basic helix-loop-helix (bHLH), MYB related proteins, ethylene response factor (ERF), and WRKY transcription factor [56,57]. Unigenes encoding for these TFs were discovered in this study as the top five most abundant unigenes annotated from the transcriptome assembly among several other TFs. The transcriptome data analyzed using the Plant Transcription Factor Database (PlantTFDB) for C. caudatus found the most abundant encodes were of C2H2 (233 unigenes), followed by bHLH (190 unigenes), MYB_related proteins (179 unigenes), ERF (163 unigenes), and WRKY (138 unigenes), and followed by several other TF (Figure 6). The top five TF found in our data are known to be regulating and influencing the anthocyanin biosynthesis in various species.

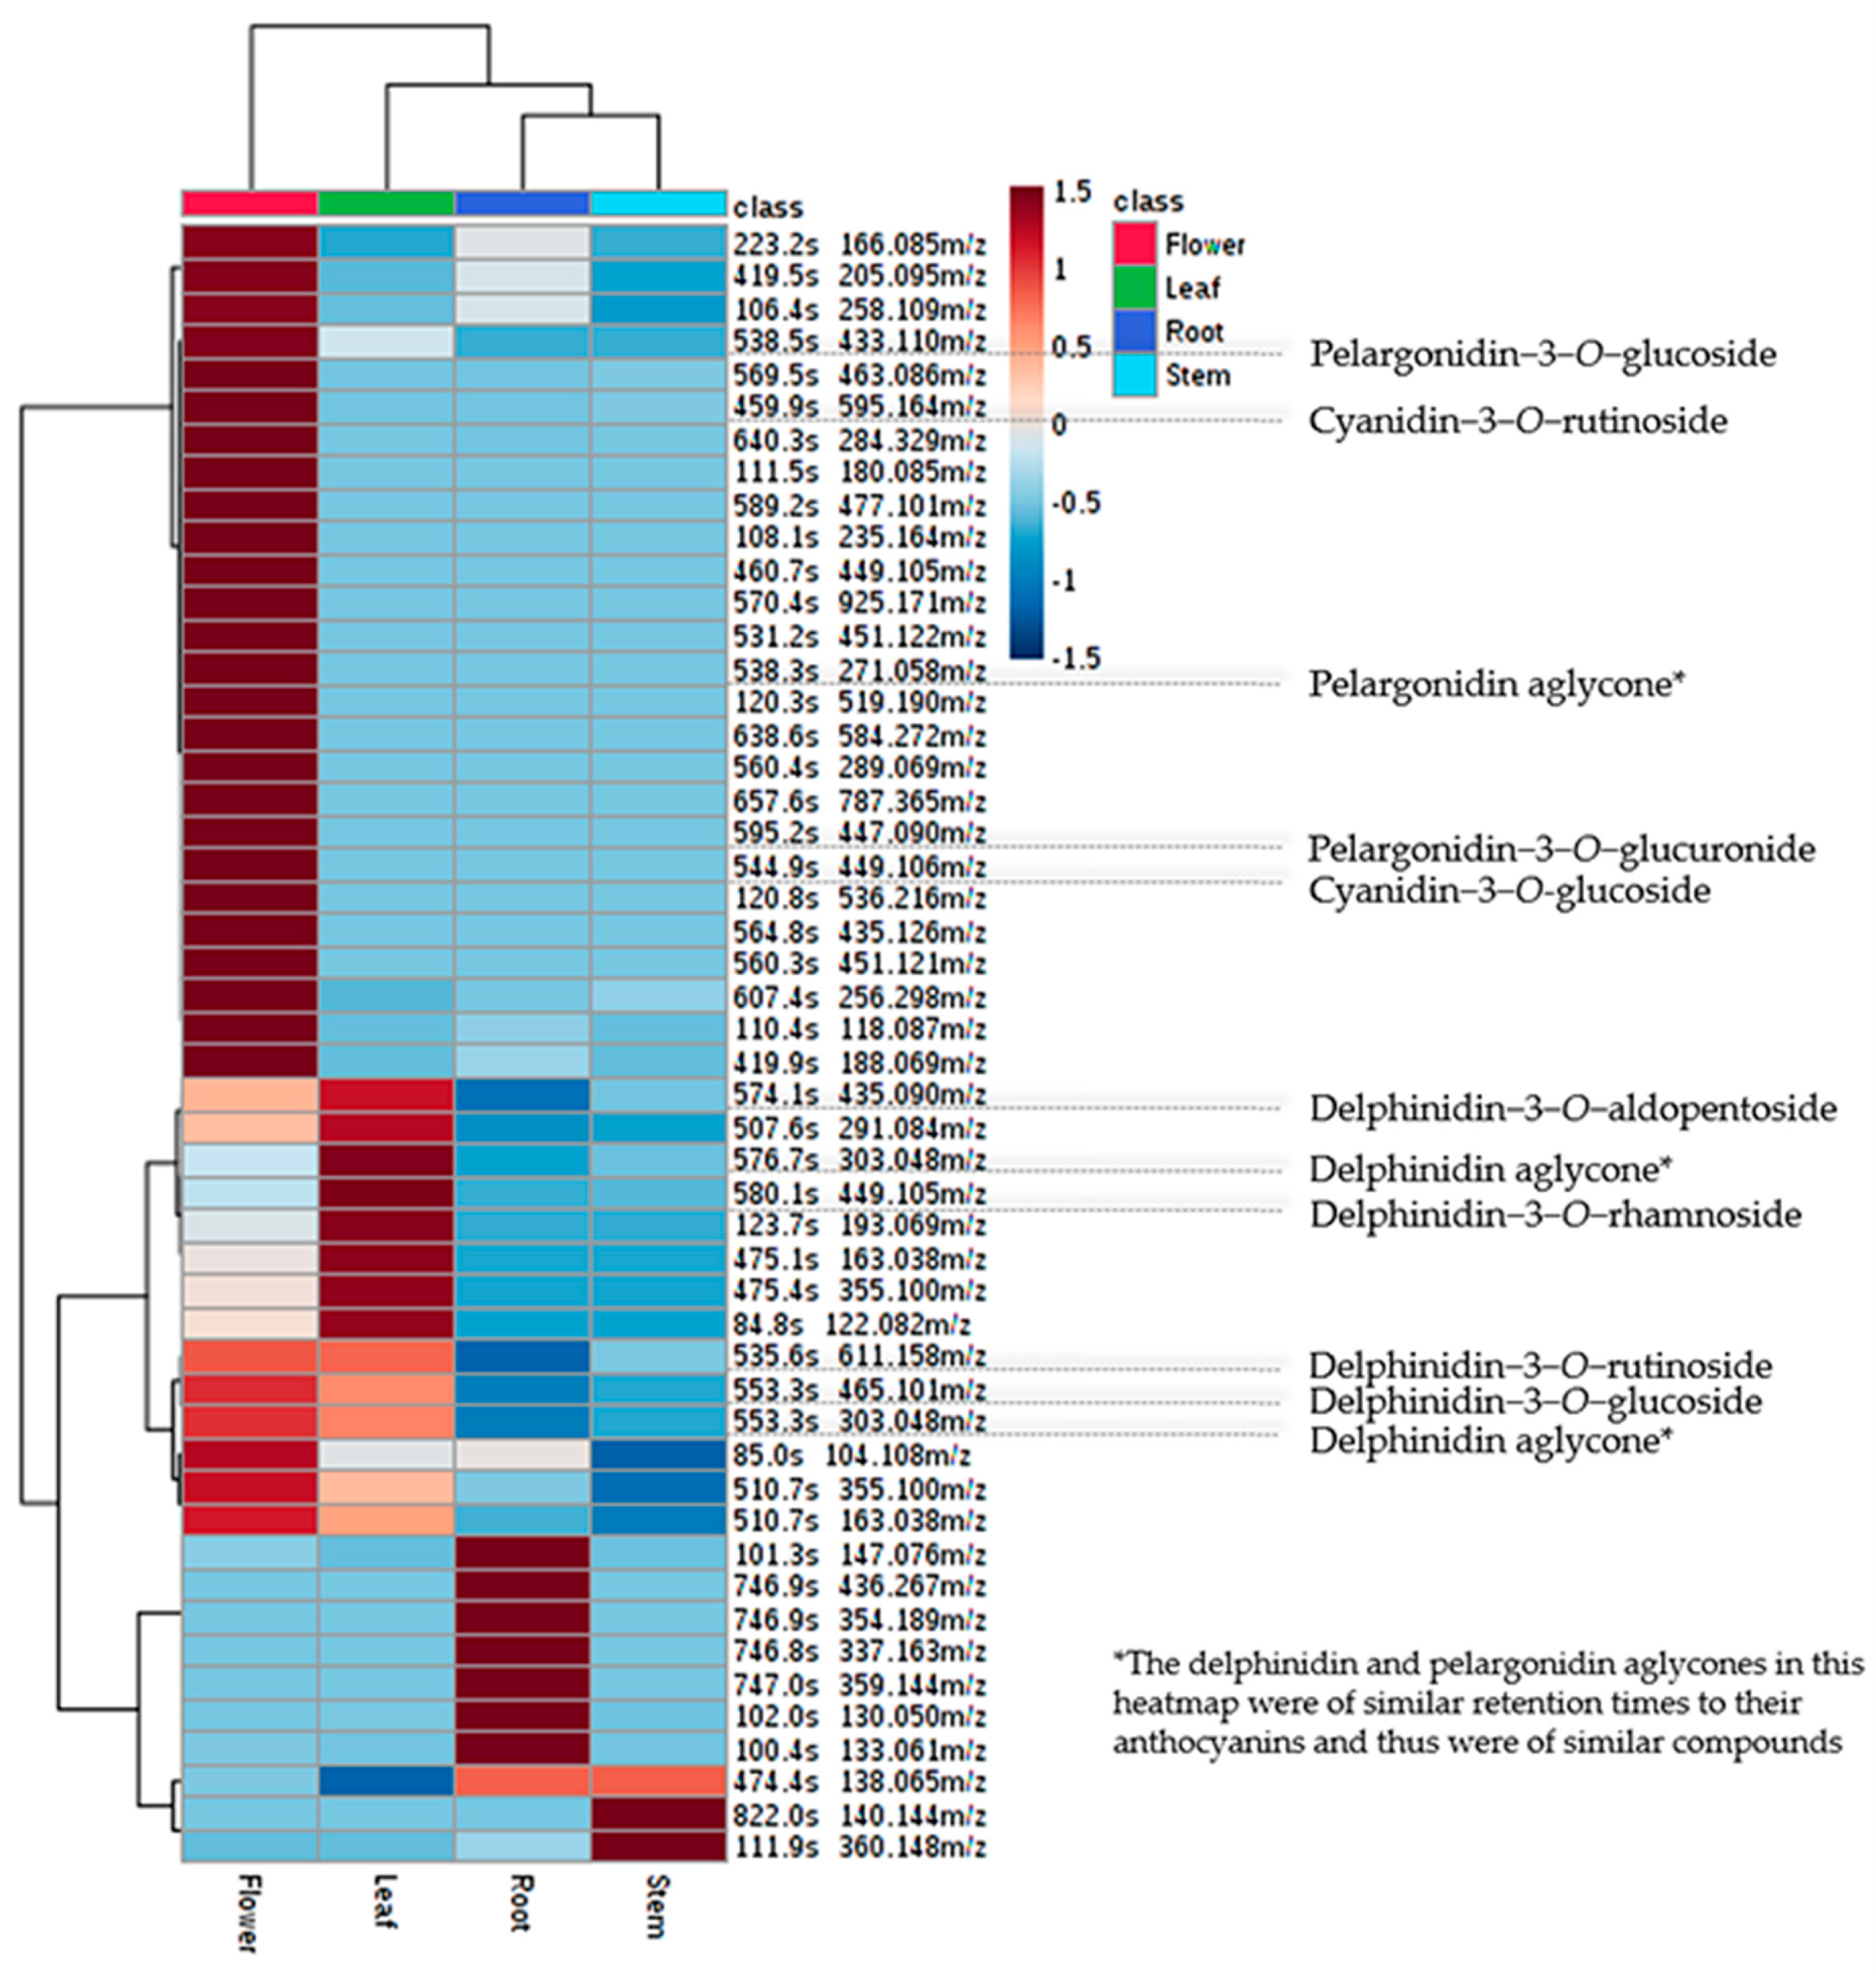
3.2. Metabolomic Analysis
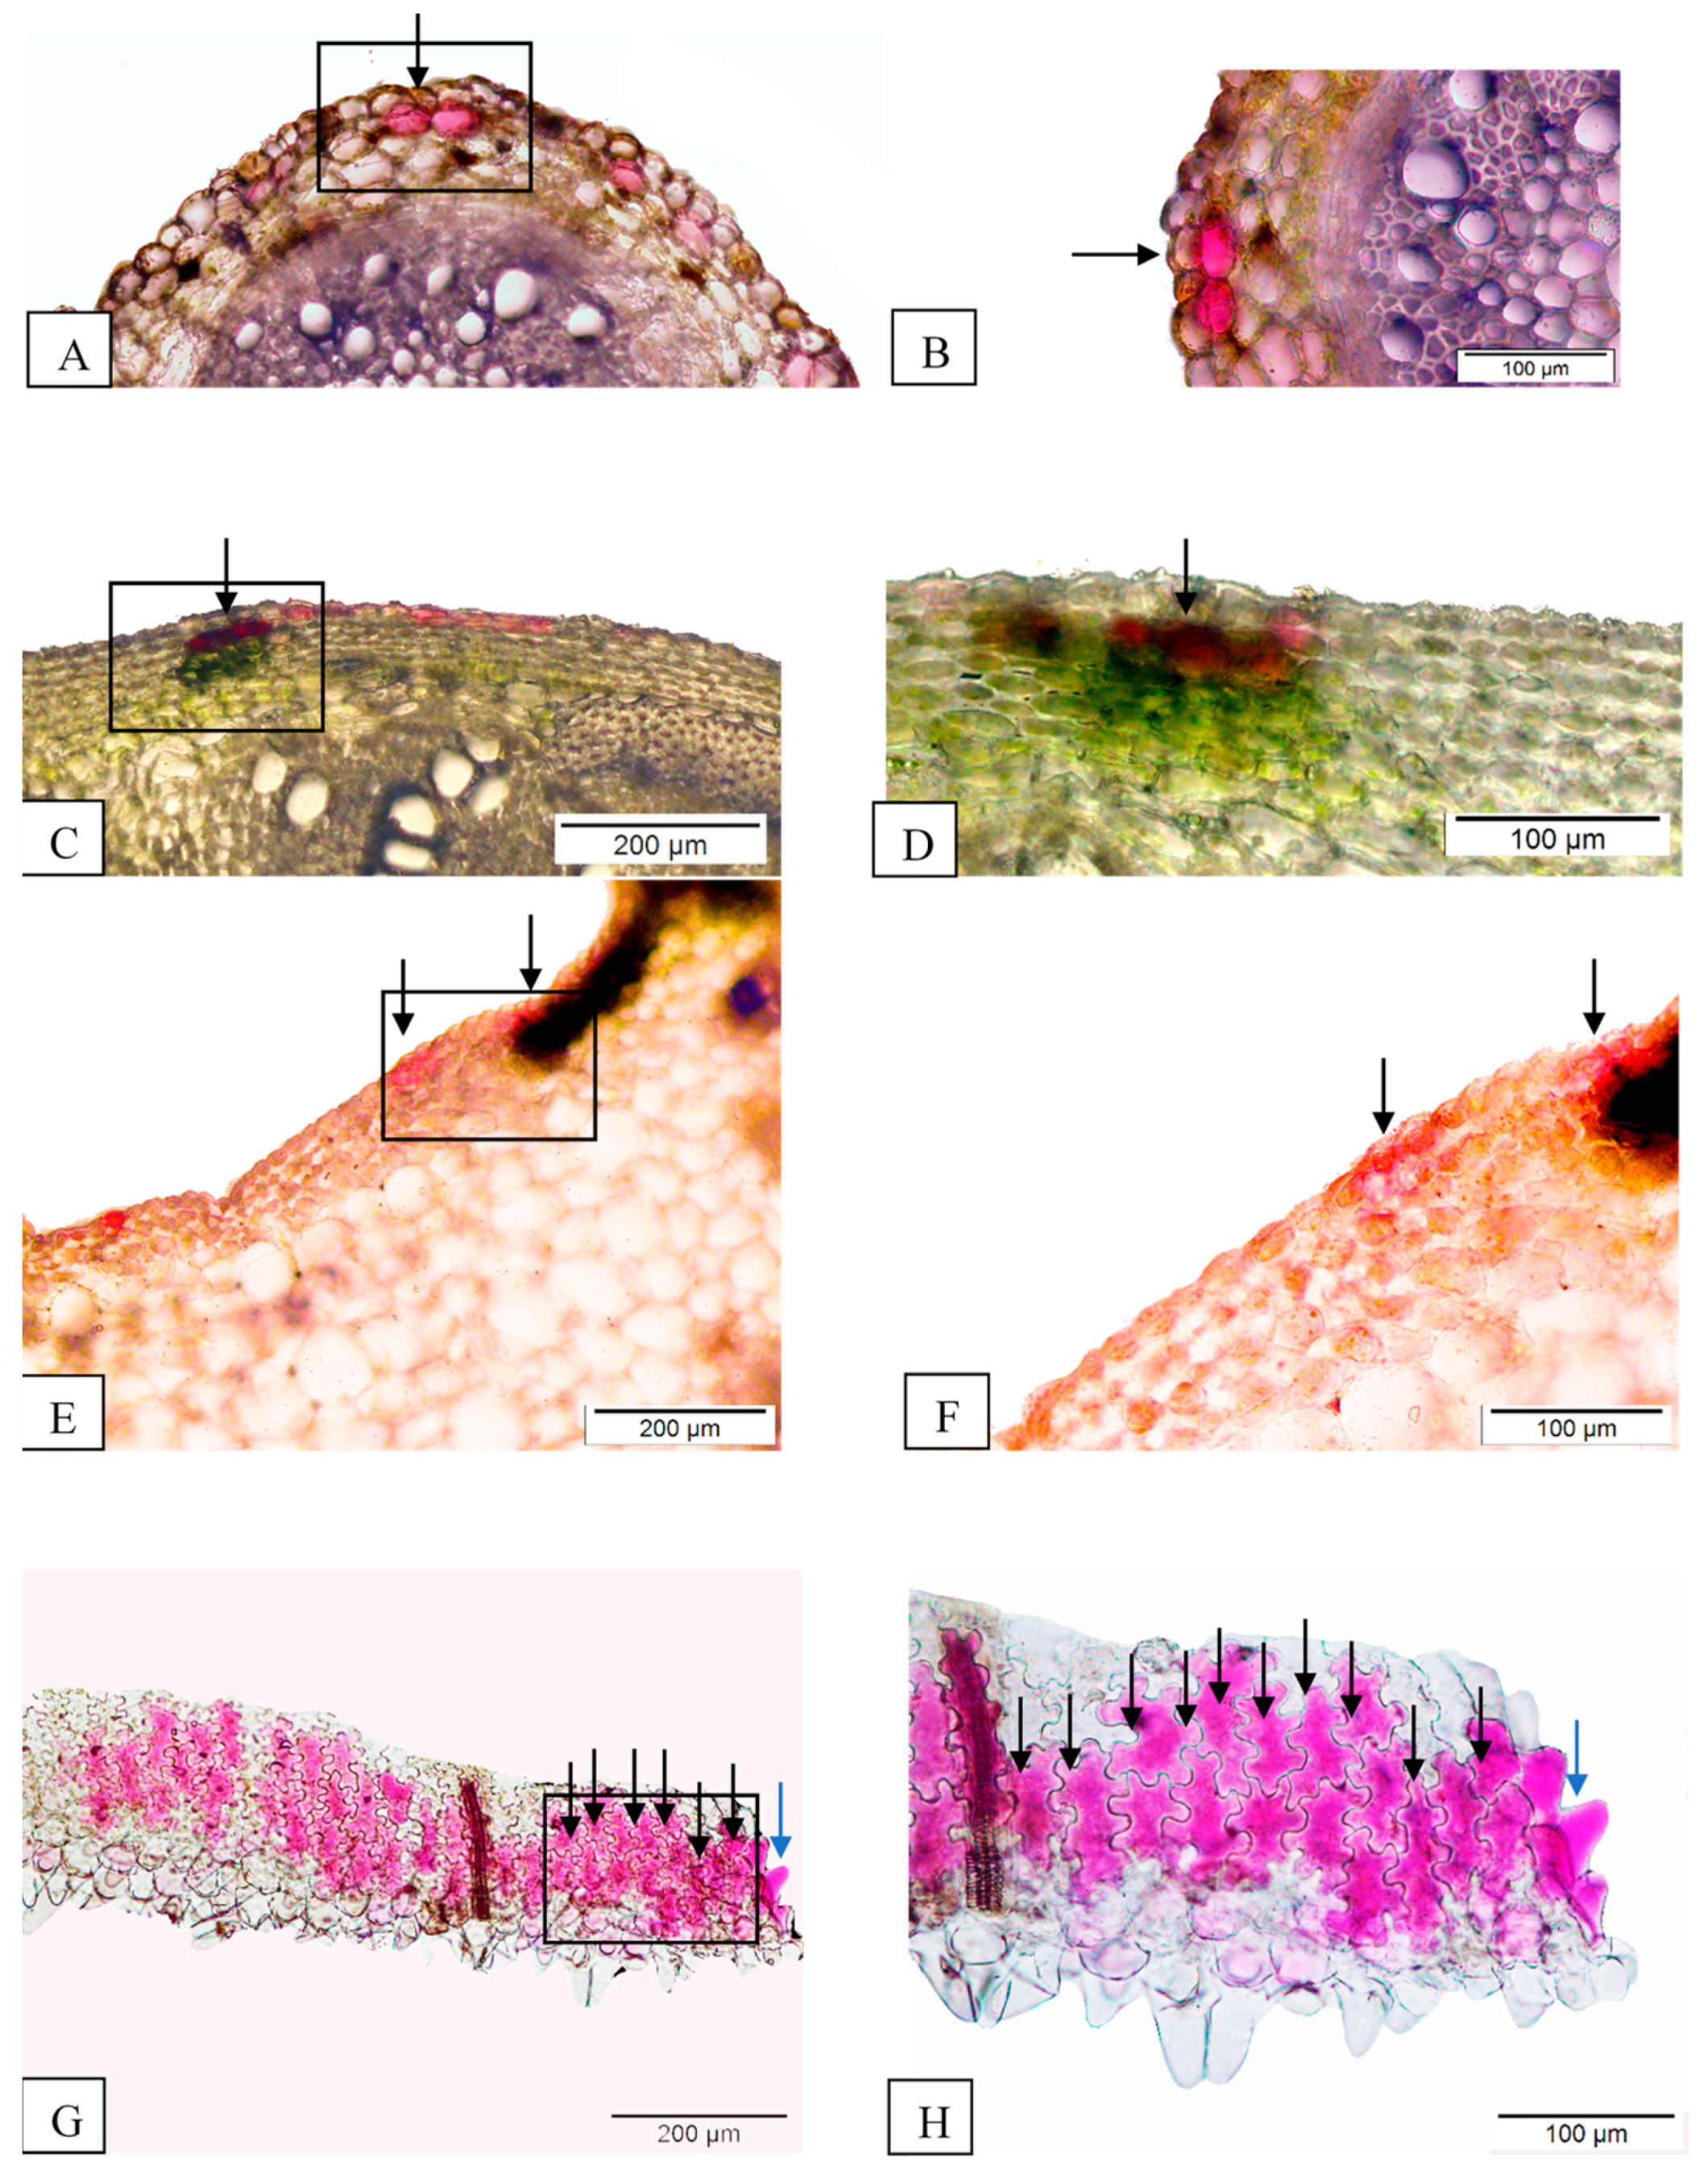
The LC-MS data were examined for anthocyanin derivative ion masses of naturally occurring anthocyanidins, i.e., cyanidin ([M]+, m/z 287), pelargonidin ([M]+, m/z 271), delphinidin ([M]+, m/z 303), petunidin ([M]+, m/z 317), peonidin ([M]+, m/z 301), and malvidin ([M]+, m/z 331) at mass width ±0.2. The anthocyanins detected were of cyanidin, pelargonidin, and delphinidin derivatives, distinguished by the aglycones that were easily detached from the molecular ions at their respective retention times. Although this phenomenon may be observed more evidently in tandem MS with elevated collision energy, the 6eV minimal applied energy to allow ion movement through the cell in this MS analysis caused initial breakage of the O-glycosidic bonds in the anthocyanin molecular ions. The free anthocyanidins or the aglycone of anthocyanins cyanidin, pelargonidin, and delphinidin were not observed as separate metabolite peaks in all the LC-MS chromatograms of the C. caudatus extracts. The structure of these anthocyanidins and the 11 observed anthocyanins in the C. caudatus extracts are illustrated in Table 4, along with their molecular weights. The high-resolution time-of-flight (TOF) mass spectrometer (HRMS) with mass-resolving power of ≥10,000 at the full width at half maximum (FWHM) of a peak, sub-ppm (parts per million) mass measurement error, and characteristic sensitive full-spectrum scanning allowed the calculation of accurate elemental formulae and the elucidation of the anthocyanin identities in the C. caudatus extracts [58,59,60]. The generated molecular formulae were then compared to previous reports on anthocyanins, as listed in Table 5. The anthocyanins’ abundance marked the differences in the C. caudatus flower, leaf, root, and stem tissues significant with a p-value less than 0.05. These are illustrated in the heatmap in Figure 7.

3.3. Anatomy Data

The anthocyanin was observed to be accumulated in the inner side of developed vacuoles, synthesized around the tonoplast and condensed on the vacuoles’ inward side in the C. caudatus tissues. The presence of anthocyanin can be recognized with evident coloration, without any staining. The vibrant hue of the red-pigmented area was determined based on the color visible on the cell’s outer part. Further focusing on the region revealed that the anthocyanin was accumulated in the granule (Figure 8). The cross-section of the petiole, stem, and root allowed the observation of the anthocyanin accumulation in C. caudatus, primarily located in the epidermal layer and below the epidermal layer, known as the subepidermal layer. The anthocyanin was mostly found in the vacuoles of parenchyma cells. Cells with an accumulation of anthocyanin were slightly more prominent than other cells and their color density varied (Figure 8A–F). However, in the flower tissue, anthocyanin accumulation was, relatively, very highly distributed almost all over the adaxial epidermal cells, including the papillae and in the area slightly lower, in the abaxial epidermal cells (Figure 8G,H). The anthocyanin density was high in the epidermis cells’ outer layer and gradually decreased moving inward to the inner part of the flesh. Anthocyanin was observed to accumulate more in the flower part, especially in the adaxial epidermal layer.

4. Discussions

The formation of coloration in plant species is highly influenced by anthocyanin, a group of compounds derived from the phenylpropanoid pathway [78]. Previous studies on C. caudatus extracts suggested anthocyanin’s role in contributing to its high bioactivity [14,21]. However, an in-depth study to confirm the specific anthocyanin compounds produced by this species is still lacking. In this investigation, the next-generation sequencing technology of Illumina Hiseq4000 was employed to unravel the anthocyanin biosynthetic genes present in C. caudatus, which did not have a reference genome. The domain part in a sequence is important in determining the function of a specific gene of the same class according to its conserved regions. The transcript of the four key genes in anthocyanin biosynthesis found in this study were searched for their domains. The first key gene, F3H annotated in this study has a domain of Fe-dependent dioxygenase, as this conserved region has been found in the F3H gene from Carthamus tinctorius L. and Ascocenda sp. [79,80]. The DFR gene liable in the formation of leucoanthocyanidins from dihydroflavonols by stereospecific reduction has the domain of epimerase/dehydratase, which was found to be similar to other species like Camellia sinensis and Brassica rapa [81,82]. The LDOX gene found in this study showed the iron/2oxoglutarate dependent dioxygenase, which is also be known as anthocyanidin synthase (ANS), and responsible for converting leucoanthocyanidin into anthocyanidin, as proven in a previous study involving Perilla frutescens [83]. The conversion of anthocyanidin to anthocyanin is catalyzed by the enzyme UFGT, a vital enzyme of the anthocyanin biosynthetic pathway. From domain analysis, the transcripts obtained in this study and previously reported in Ginkgo biloba for the gene UFGT were of the same superfamily, UDP-glycosyltransferase [84]. Previous research involving Prunus mume (Japanese apricot) has demonstrated that the UFGT gene plays a crucial role in pigmentation, and that the transcription level of the gene is directly proportional to the anthocyanin level detected in the species [85]. Some other studies also demonstrated that these enzymes’ expression is vital in anthocyanin biosynthesis in Vitis vinifera, Solanum tuberosum, Phalaenopsis, and Musa itenerans [86,87,88]. The previous research proved that the key gene’s presence contributes to the occurrence of anthocyanin across different plant species, as found in the transcriptome data of C. caudatus [80,81,82].
The interaction of regulatory genes such as basic helix-loop-helix (bHLH), WD40, and MYB TFs with promoters of the structural genes plays an important role in the biosynthesis of anthocyanin [89,90]. One of the most abundant TFs in plants is the superfamily bHLH [91,92,93]. TF bHLH, along with other activators such as MYB, plays a pivotal role in anthocyanin’s biosynthesis [94]. MYB is important in the accumulation of anthocyanin intensity patterns in various plant species [95]. The activation of this biosynthetic pathway is regulated by the bHLH-MYB-WD40 complex, where modification of any of these genes causes changes in color formation in various plants, such as Malus domestica, Brassica oleracea var. botrytis, Dahlia variabilis, and Citrus sinensis [96,97,98,99]. A study on Solanum tuberosum demonstrated that TF C2H2, besides several other protein families such as zf-HD, LOB, bZIP, MYB, and MADS, played an essential part in regulating the anthocyanin biosynthetic pathway in wild purple and red potatoes, using a comparative transcriptome approach [100]. Several studies have demonstrated a strong correlation of ERF with anthocyanin’s expression level in several species, such as Vaccinium myrtillus [101]. It binds with MYB and bHLH promoters as co-regulator of anthocyanin biosynthesis in Malus domestica [102] and Pyrus sp. [103], respectively. Another study on Malus domestica identified WRKY as a protein that interacts with the positive regulator of anthocyanin synthesis in the species, which bind MYB to its target genes better [104]. By comparing sequences of known transcription factor families, the most abundant TFs: C2H2, MYB, bHLH, ERF, and WRKY, were annotated in the transcriptome profile of C. caudatus, which might play a pivotal role in regulating the anthocyanin pathway in the species studied, as shown in other angiosperms species.
Anthocyanidins such as cyanidin, delphinidin, and pelargonidin occur in a more stable and soluble form of anthocyanin, i.e., glycosylated, and are very rarely found without their sugar substituents in nature [105]. This facilitates absorption of the anthocyanidin into the bloodstream upon consumption of plants containing anthocyanin. Various anthocyanins of cyanidin, delphinidin, and pelargonidin derivatives were identified in C. caudatus, with its flowers detected as having the most anthocyanin, followed by the leaf tissue. The results confirmed existing assertions of C. caudatus containing anthocyanin. The anatomical approach further supported this finding in which anthocyanin was observed to accumulate more in the flower tissue, especially in the adaxial epidermal layer. This is consistent with the proposed mechanism of anthocyanin accumulation in proportion to light exposure [106]. Anthocyanin and chlorophyll levels in green leaves are negatively correlated, as demonstrated in Brassica oleracea and Camellia sinensis [107]. This explains the lower density of anthocyanin detected in the C. caudatus leaf tissue. Anthocyanin level slowly decreases with plant development and a developed or mature leaf contains lower levels of anthocyanins compared to chlorophyll. The distribution of anthocyanin within the plant tissue also differs considerably. As a rule, anthocyanin was found to localize in the cell vacuoles or just below the adaxial epidermis. Occasionally, the anthocyanin pigments also accumulate in the abaxial epidermis’ cell vacuoles, palisade, spongy mesophyll, and root tissues as compounds involved in photoprotection. In this study, the findings showed a very low density of anthocyanin in the root, stem, and petiole tissues, which were more sheltered from the sun.
Previous anatomical screening on 463 plant species discovered anthocyanin in the leaf tissue of 260 species at different life stages, such as development, maturity, and senescence [108]. It has also been reported in various tissues other than trichomes, such as palisade and spongy layers, [108]. This correlates with the findings in our study, where the granules accommodating anthocyanin pigment were observed in all the tissues studied, although some were detected in different parts of the cell. At these parts of the tissues (Figure 8A–F), anthocyanin was only found in an individual cell or groups of several cells in one or two rows, as previously reported in Impatiens balsamina [109] The glandular trichomes found in the floral part of the C. caudatus were larger, immobile, and colorless, with several of the trichomes red-pigmented, indicating the accumulation of anthocyanin in them. The accumulation of anthocyanin in trichomes is supported by the previous examination on the foliar anatomy of Castanopsis fissa, suggesting the photoinhibition activity as a defense mechanism for protecting the tissue against high light intensity [110,111].
The high accumulation of anthocyanin in flower tissues with visible pink coloration is due to the abundance of cyanidin and pelargonidin derivative. Metabolomics data support this; a higher abundance of anthocyanins being responsible for red to pink spectrum is supported by previous reports on various flowers, such as Chrysanthemum morifolium, Lilium spp., and Centaurea cyanus [112,113,114]. In this study, the highest abundance of anthocyanins was found in flowers, followed by the leaves. This was found to correspond to our previous research on C. caudatus involving FT-IR, in which flower and leaf tissues were grouped together, apart from the other tissues studied [39]. Transcriptome data found the C. caudatus unigenes obtained were shown to have a complete anthocyanin biosynthesis pathway, directly correlating with three major anthocyanins (cyanidin-3-O-glucoside, pelargonidin-3-O-glucoside, and delphinidin-3-O-glucoside) found in the LC-MS analysis, elucidating the occurrence of complete anthocyanin biosynthesis in this species for the first time, to our knowledge.
Based on the results obtained from transcriptome data and metabolite analysis combined with the anatomy work, this study successfully demonstrated the occurrence of anthocyanin biosynthesis in C. caudatus (Figure 9). All the genes related to the anthocyanin pathway and the metabolites of interest were identified in this work. These findings offer a depiction of different anthocyanins present in the species and present more in-depth insights into each type of anthocyanin present in the investigated tissues. The traditional practice of C. caudatus dietary consumption for various health benefits may relate to the anthocyanins present in the species and other bioactive compounds, which demands further thorough research [115]. The identification of the C. caudatus unigenes encoding the overall anthocyanin biosynthesis would provide information on new candidate genes for anthocyanin bioproduction using metabolic engineering and synthetic biology approaches.

5. Conclusions

C. caudatus is a herbal plant with a high content of anthocyanins. To the best of our knowledge, this is the first comprehensive analysis of the anthocyanin biosynthetic pathway in C. caudatus based on the integration of transcriptomics, metabolomics, and anatomical approaches. The work enabled the identification of eleven main genes involved in the anthocyanin biosynthetic pathway and 11 correlative anthocyanins present in the species. The pathway was elucidated, and the identification of transcripts related to anthocyanin biosynthesis will help discern the molecular mechanism for future research prospects. The results obtained from this research can be used to choose specific tissues of interest to enhance anthocyanin production. This can be done by understanding and controlling the gene regulation of the anthocyanin biosynthesis pathway. Furthermore, this discovery will also assist and complement future translational research in biotransformation and characterization of different anthocyanins and the exploration of synthetic biology to harness this highly potent plant using heterologous expression studies.

Supplementary Materials

The following are available online at https://www.mdpi.com/article/10.3390/agronomy11040661/s1, Table S1: Quality control and filtering of transcriptome raw reads of Cosmos caudatus, Table S2: KEGG pathway analysis Cosmos caudatus, Table S3: List of unigene anthocyanin biosynthetic pathway Cosmos caudatus, Figure S4: Domain Search Using Interproscan Software. (A) F3H; (B) DFR; (C) LDOX; (D) UFGT.

Author Contributions

D.G., H.B. conceived and designed the experiments, D.G. performed the experiment, analyzed the data, prepared figures, and tables, and drafted the manuscript. N.I.T. analyzed the LC-MS data. M.A.A. analyzed the transcriptome data. S.B. analyzed the anatomy data. N.I.T., M.A.A., I.I., N.T., A.B.R., S.N.B., N.M.N., H.B. reviewed drafts of the manuscript. N.M.N., S.N.B., H.B. contributed reagents/materials/analysis tools, acquired funding. All authors have read and agreed to the published version of the manuscript.

Funding

The authors’ research was supported by the Dana Impak Perdana (DIP-2016-014), Universiti Kebangsaan Malaysia.

Institutional Review Board Statement

Not applicable.

Informed Consent Statement

Not applicable.

Data Availability Statement

The raw read sequences of transcriptome assembly obtained from Illumina Hiseq4000 (150PE) platform have been deposited in Sequence Read Archive (SRA) under the accession number SRP158180 in NCBI and details of the sample can be viewed via BioProject id: PRJNA486042. This Transcriptome Shotgun Assembly project has been deposited at DDBJ/ENA/GenBank under the accession GJBF00000000. The version described in this paper is the first version, GJBF01000000.

Acknowledgments

Sequencing and assembly was done at TheragenEtex Bio Institute, Republic of Korea. We would like to thank INBIOSIS’s Science officer, Sarah Ibrahim for handling LC-TOF-MS equipment.

Conflicts of Interest

The authors declare that they have no competing interests.

References

  1. Ha, U.; Bae, W.J.; Kim, S.J.; Yoon, B., II; Hong, S.H.; Lee, J.Y.; Hwang, T.-K.; Hwang, S.Y.; Wang, Z.; Kim, S.W. Anthocyanin induces apoptosis of DU-145 cells in vitro and inhibits xenograft growth of prostate cancer. Yonsei Med. J. 2015, 56, 16–23. [Google Scholar] [CrossRef] [PubMed] [Green Version]
  2. Kruger, M.J.; Davies, N.; Myburgh, K.H.; Lecour, S. Proanthocyanidins, anthocyanins and cardiovascular diseases. Food Res. Int. 2014, 59, 41–52. [Google Scholar] [CrossRef]
  3. Wallace, T.C. Anthocyanins in cardiovascular disease. Adv. Nutr. 2011, 2, 1–7. [Google Scholar] [CrossRef] [Green Version]
  4. Sancho, R.A.S.; Pastore, G.M. Evaluation of the effects of anthocyanins in type 2 diabetes. Food Res. Int. 2012, 46, 378–386. [Google Scholar] [CrossRef]
  5. Peiffer, D.S.; Zimmerman, N.P.; Wang, L.-S.; Ransom, B.W.S.; Carmella, S.G.; Kuo, C.-T.; Siddiqui, J.; Chen, J.-H.; Oshima, K.; Huang, Y.-W. Chemoprevention of esophageal cancer with black raspberries, their component anthocyanins, and a major anthocyanin metabolite, protocatechuic acid. Cancer Prev. Res. 2014, 7, 574–584. [Google Scholar] [CrossRef] [PubMed] [Green Version]
  6. Wang, J.; Shen, X.; Chen, Y. Effect of pH, temperature and iron on the stability of anthocyanins from black-skinned peanuts (Arachis hypogaea L.). Afr. J. Agric. Res. 2013, 8, 2044–2047. [Google Scholar]
  7. Khoo, H.E.; Azlan, A.; Tang, S.T.; Lim, S.M. Anthocyanidins and anthocyanins: Colored pigments as food, pharmaceutical ingredients, and the potential health benefits. Food Nutr. Res. 2017, 61, 1361779. [Google Scholar] [CrossRef] [PubMed] [Green Version]
  8. Cavalcanti, R.N.; Santos, D.T.; Meireles, M.A.A. Non-thermal stabilization mechanisms of anthocyanins in model and food systems—An overview. Food Res. Int. 2011, 44, 499–509. [Google Scholar] [CrossRef]
  9. Grotewold, E. The genetics and biochemistry of floral pigments. Annu. Rev. Plant Biol. 2006, 57, 761–780. [Google Scholar] [CrossRef]
  10. Lin-Wang, K.; Bolitho, K.; Grafton, K.; Kortstee, A.; Karunairetnam, S.; McGhie, T.K.; Espley, R.V.; Hellens, R.P.; Allan, A.C. An R2R3 MYB transcription factor associated with regulation of the anthocyanin biosynthetic pathway in Rosaceae. BMC Plant Biol. 2010, 10, 50. [Google Scholar] [CrossRef] [Green Version]
  11. Lim, S.-H.; Ha, S.-H. Marker development for the identification of rice seed color. Plant Biotechnol. Rep. 2013, 7, 391–398. [Google Scholar] [CrossRef]
  12. Liu, Y.; Tikunov, Y.; Schouten, R.E.; Marcelis, L.F.M.; Visser, R.G.F.; Bovy, A. Anthocyanin biosynthesis and degradation mechanisms in Solanaceous vegetables: A review. Front. Chem. 2018, 6, 52. [Google Scholar] [CrossRef] [PubMed]
  13. Lepiniec, L.; Debeaujon, I.; Routaboul, J.-M.; Baudry, A.; Pourcel, L.; Nesi, N.; Caboche, M. Genetics and biochemistry of seed flavonoids. Annu. Rev. Plant Biol. 2006, 57, 405–430. [Google Scholar] [CrossRef] [PubMed]
  14. Andarwulan, N.; Batari, R.; Sandrasari, D.A.; Bolling, B.; Wijaya, H. Flavonoid content and antioxidant activity of vegetables from Indonesia. Food Chem. 2010, 121, 1231–1235. [Google Scholar] [CrossRef] [Green Version]
  15. Sumazian, Y.; Syahida, A.; Hakiman, M.; Maziah, M. Antioxidant activities, flavonoids, ascorbic acid and phenolic content of Malaysian vegetables. J. Med. Plants Res. 2010, 4, 881–890. [Google Scholar]
  16. Shipp, J.; Abdel-Aal, E.-S.M. Food applications and physiological effects of anthocyanins as functional food ingredients. Open Food Sci. J. 2010, 4, 1. [Google Scholar] [CrossRef]
  17. Bunawan, H.; Baharum, S.N.; Bunawan, S.N.; Amin, N.M.; Noor, N.M. Cosmos caudatus Kunth.: A traditional medicinal herb. Glob. J. Pharmacol. 2014, 8, 420–426. [Google Scholar]
  18. Mohamed, N.; Gwee Sian Khee, S.; Shuid, A.N.; Muhammad, N.; Suhaimi, F.; Othman, F.; Babji, A.S.; Soelaiman, I.-N. The Effects of Cosmos caudatus on Structural Bone Histomorphometry in Ovariectomized Rats. Evidence-Based Complement. Altern. Med. 2012, 2012, 1–6. [Google Scholar] [CrossRef] [Green Version]
  19. Mohamed, N.; Sahhugi, Z.; Ramli, E.S.M.; Muhammad, N. The effects of Cosmos caudatus (ulam raja) on dynamic and cellular bone histomorphometry in ovariectomized rats. BMC Res. Notes 2013, 6, 239. [Google Scholar] [CrossRef] [Green Version]
  20. Amalia, L.; Anggadiredja, K.; Sukrasno, I.F.; Inggriani, R. Antihypertensive Potency of Wild Cosmos Caudatus Leaf Extract.Pdf. J. Pharmacol. Toxicol. 2012, 7, 359–368. [Google Scholar] [CrossRef] [Green Version]
  21. Shui, G.; Leong, L.P.; Shih, P.W. Rapid screening and characterisation of antioxidants of Cosmos caudatus using liquid chromatography coupled with mass spectrometry. J. Chromatogr. B Anal. Technol. Biomed. Life Sci. 2005, 827, 127–138. [Google Scholar] [CrossRef]
  22. Wong, S.P.; Leong, L.P.; Koh, J.H.W.; William Koh, J.H. Antioxidant activities of aqueous extracts of selected plants. Food Chem. 2006, 99, 775–783. [Google Scholar] [CrossRef]
  23. Reihani, S.F.S.; Azhar, M.E. Antioxidant activity and total phenolic content in aqueous extracts of selected traditional Malay salads (Ulam). Int. Food Res. J. 2012, 19, 4. [Google Scholar]
  24. Rasdi, N.H.M.; Samah, O.A.; Sule, A.; Ahmed, Q.U. Antimicrobial studies of Cosmos caudatus Kunth. (compositae). J. Med. Plants Res. 2010, 4, 669–673. [Google Scholar]
  25. Fuzzati, N.; Dyatmiko, W.; Rahman, A.; Hostettmann, K. Phenylpropane derivatives from roots of Cosmos caudatus. Phytochemistry 1995, 39, 409–412. [Google Scholar] [CrossRef]
  26. Andarwulan, N.; Kurniasih, D.; Apriady, R.A.; Rahmat, H.; Roto, A.V.; Bolling, B.W. Polyphenols, carotenoids, and ascorbic acid in underutilized medicinal vegetables. J. Funct. Foods 2012, 4, 339–347. [Google Scholar] [CrossRef]
  27. Varshney, R.K.; Nayak, S.N.; May, G.D.; Jackson, S.A. Next-generation sequencing technologies and their implications for crop genetics and breeding. Trends Biotechnol. 2009, 27, 522–530. [Google Scholar] [CrossRef] [Green Version]
  28. Ward, J.A.; Ponnala, L.; Weber, C.A. Strategies for transcriptome analysis in nonmodel plants. Am. J. Bot. 2012, 99, 267–276. [Google Scholar] [CrossRef]
  29. Loke, K.-K.; Rahnamaie-Tajadod, R.; Yeoh, C.-C.; Goh, H.-H.; Mohamed-Hussein, Z.-A.; Zainal, Z.; Ismail, I.; Noor, N.M. Transcriptome analysis of Polygonum minus reveals candidate genes involved in important secondary metabolic pathways of phenylpropanoids and flavonoids. PeerJ 2017, 5, e2938. [Google Scholar] [CrossRef] [PubMed] [Green Version]
  30. De Vos, R.C.H.; Moco, S.; Lommen, A.; Keurentjes, J.J.B.; Bino, R.J.; Hall, R.D. Untargeted large-scale plant metabolomics using liquid chromatography coupled to mass spectrometry. Nat. Protoc. 2007, 2, 778. [Google Scholar] [CrossRef]
  31. Naoumkina, M.; Farag, M.A.; Sumner, L.W.; Tang, Y.; Liu, C.-J.; Dixon, R.A. Different mechanisms for phytoalexin induction by pathogen and wound signals in Medicago truncatula. Proc. Natl. Acad. Sci. USA 2007, 104, 17909–17915. [Google Scholar] [CrossRef] [PubMed] [Green Version]
  32. Böttcher, C.; von Roepenack-Lahaye, E.; Schmidt, J.; Schmotz, C.; Neumann, S.; Scheel, D.; Clemens, S. Metabolome analysis of biosynthetic mutants reveals a diversity of metabolic changes and allows identification of a large number of new compounds in Arabidopsis. Plant Physiol. 2008, 147, 2107–2120. [Google Scholar] [CrossRef] [Green Version]
  33. Farag, M.A.; Huhman, D.V.; Dixon, R.A.; Sumner, L.W. Metabolomics reveals novel pathways and differential mechanistic and elicitor-specific responses in phenylpropanoid and isoflavonoid biosynthesis in Medicago truncatula cell cultures. Plant Physiol. 2008, 146, 387–402. [Google Scholar] [CrossRef] [PubMed] [Green Version]
  34. Matsuda, F.; Hirai, M.Y.; Sasaki, E.; Akiyama, K.; Yonekura-Sakakibara, K.; Provart, N.J.; Sakurai, T.; Shimada, Y.; Saito, K. AtMetExpress development: A phytochemical atlas of Arabidopsis development. Plant Physiol. 2010, 152, 566–578. [Google Scholar] [CrossRef] [Green Version]
  35. Matsuda, F.; Yonekura-Sakakibara, K.; Niida, R.; Kuromori, T.; Shinozaki, K.; Saito, K. MS/MS spectral tag-based annotation of non-targeted profile of plant secondary metabolites. Plant J. 2009, 57, 555–577. [Google Scholar] [CrossRef] [Green Version]
  36. Okazaki, Y.; Saito, K. Recent advances of metabolomics in plant biotechnology. Plant Biotechnol. Rep. 2012, 6, 1–15. [Google Scholar] [CrossRef] [PubMed] [Green Version]
  37. Okazaki, Y.; Kamide, Y.; Hirai, M.Y.; Saito, K. Plant lipidomics based on hydrophilic interaction chromatography coupled to ion trap time-of-flight mass spectrometry. Metabolomics 2013, 9, 121–131. [Google Scholar] [CrossRef] [Green Version]
  38. Shinozaki, K.; Sakakibara, H. Omics and bioinformatics: An essential toolbox for systems analyses of plant functions beyond 2010 Plant Cell Physiol. Plant Cell Physiol. 2009, 50, 1177–1780. [Google Scholar] [CrossRef] [PubMed] [Green Version]
  39. Gunasekaran, D.; Bunawan, H.; Ismail, I.; Noor, N.M. Data on Fourier transform-infrared of Cosmos caudatus Kunth. tissues analyzed with chemometric analysis. Data Br. 2018, 19, 1423–1427. [Google Scholar] [CrossRef]
  40. Mediani, A.; Abas, F.; Khatib, A.; Maulidiani, H.; Shaari, K.; Choi, Y.H.; Lajis, N.H. 1H-NMR-based metabolomics approach to understanding the drying effects on the phytochemicals in Cosmos caudatus. Food Res. Int. 2012, 49, 763–770. [Google Scholar] [CrossRef]
  41. Javadi, N.; Abas, F.; Hamid, A.A.; Simoh, S.; Shaari, K.; Ismail, I.S.; Mediani, A.; Khatib, A. GC-MS-Based Metabolite Profiling of Cosmos caudatus Leaves Possessing Alpha-Glucosidase Inhibitory Activity. J. Food Sci. 2014, 79, 1130–1136. [Google Scholar] [CrossRef] [PubMed]
  42. Abdul-Rahman, A.; Goh, H.H.; Loke, K.K.; Noor, N.M.; Aizat, W.M. RNA-seq analysis of mangosteen (Garcinia mangostana L.) fruit ripening. Genom. Data 2017, 12, 159–160. [Google Scholar] [CrossRef]
  43. Haas, B.J.; Papanicolaou, A.; Yassour, M.; Grabherr, M.; Blood, P.D.; Bowden, J.; Couger, M.B.; Eccles, D.; Li, B.; Lieber, M. De novo transcript sequence reconstruction from RNA-seq using the Trinity platform for reference generation and analysis. Nat. Protoc. 2013, 8, 1494–1512. [Google Scholar] [CrossRef] [PubMed]
  44. Pertea, G.; Huang, X.; Liang, F.; Antonescu, V.; Sultana, R.; Karamycheva, S.; Lee, Y.; White, J.; Cheung, F.; Parvizi, B. TIGR Gene Indices clustering tools (TGICL): A software system for fast clustering of large EST datasets. Bioinformatics 2003, 19, 651–652. [Google Scholar] [CrossRef] [Green Version]
  45. Mi, H.; Muruganujan, A.; Casagrande, J.T.; Thomas, P.D. Large-scale gene function analysis with the PANTHER classification system. Nat. Protoc. 2013, 8, 1551–1566. [Google Scholar] [CrossRef] [PubMed]
  46. Kanehisa, M.; Sato, Y.; Morishima, K. BlastKOALA and GhostKOALA: KEGG tools for functional characterization of genome and metagenome sequences. J. Mol. Biol. 2016, 428, 726–731. [Google Scholar] [CrossRef] [Green Version]
  47. Jones, P.; Binns, D.; Chang, H.-Y.; Fraser, M.; Li, W.; McAnulla, C.; McWilliam, H.; Maslen, J.; Mitchell, A.; Nuka, G. InterProScan 5: Genome-scale protein function classification. Bioinformatics 2014, 30, 1236–1240. [Google Scholar] [CrossRef] [PubMed] [Green Version]
  48. Garzón, G.A.; Narváez, C.E.; Riedl, K.M.; Schwartz, S.J. Chemical composition, anthocyanins, non-anthocyanin phenolics and antioxidant activity of wild bilberry (Vaccinium meridionale Swartz) from Colombia. Food Chem. 2010, 122, 980–986. [Google Scholar] [CrossRef]
  49. Rosli, M.A.F.; Azizan, K.A.; Baharum, S.N.; Goh, H.H. Mass spectrometry data of metabolomics analysis of Nepenthes pitchers. Data Br. 2017, 14, 295–297. [Google Scholar] [CrossRef]
  50. Xia, J.; Sinelnikov, I.V.; Han, B.; Wishart, D.S. MetaboAnalyst 3.0—making metabolomics more meaningful. Nucleic Acids Res. 2015, 43, W251–W257. [Google Scholar] [CrossRef] [Green Version]
  51. Rohs, R.; Jin, X.; West, S.M.; Joshi, R.; Honig, B.; Mann, R.S. Origins of specificity in protein-DNA recognition. Annu. Rev. Biochem. 2010, 79, 233–269. [Google Scholar] [CrossRef] [Green Version]
  52. Hudson, W.H.; Ortlund, E.A. The structure, function and evolution of proteins that bind DNA and RNA. Nat. Rev. Mol. Cell Biol. 2014, 15, 749–760. [Google Scholar] [CrossRef] [Green Version]
  53. Gurung, N.; Ray, S.; Bose, S.; Rai, V. A broader view: Microbial enzymes and their relevance in industries, medicine, and beyond. Biomed Res. Int. 2013, 2013. [Google Scholar] [CrossRef] [PubMed] [Green Version]
  54. Ravindran, R.; Jaiswal, A.K. Enzymes in bioconversion and food processing. In Enzymes in Food Technology; Springer: Berlin/Heidelberg, Germany, 2018; pp. 19–40. [Google Scholar]
  55. Dahl, S.G.; Sylte, I.; Ravna, A.W. Structures and models of transporter proteins. J. Pharmacol. Exp. Ther. 2004, 309, 853–860. [Google Scholar] [CrossRef] [Green Version]
  56. Rameneni, J.J.; Choi, S.R.; Chhapekar, S.S.; Kim, M.-S.; Singh, S.; Yi, S.Y.; Oh, S.H.; Kim, H.; Lee, C.Y.; Oh, M.-H. Red Chinese cabbage transcriptome analysis reveals structural genes and multiple transcription factors regulating reddish purple color. Int. J. Mol. Sci. 2020, 21, 2901. [Google Scholar] [CrossRef] [Green Version]
  57. Lloyd, A.; Brockman, A.; Aguirre, L.; Campbell, A.; Bean, A.; Cantero, A.; Gonzalez, A. Advances in the MYB–bHLH–WD repeat (MBW) pigment regulatory model: Addition of a WRKY factor and co-option of an anthocyanin MYB for betalain regulation. Plant Cell Physiol. 2017, 58, 1431–1441. [Google Scholar] [CrossRef] [Green Version]
  58. Mihaleva, V.V.; Vorst, O.; Maliepaard, C.; Verhoeven, H.A.; de Vos, R.C.H.; Hall, R.D.; van Ham, R.C.H.J. Accurate mass error correction in liquid chromatography time-of-flight mass spectrometry based metabolomics. Metabolomics 2008, 4, 171–182. [Google Scholar] [CrossRef]
  59. Guo, B.; Wang, M.; Liu, Y.; Zhou, J.; Dai, H.; Huang, Z.; Shen, L.; Zhang, Q.; Chen, B. Wide-scope screening of illegal adulterants in dietary and herbal supplements via rapid polarity-switching and multistage accurate mass confirmation using an LC-IT/TOF hybrid instrument. J. Agric. Food Chem. 2015, 63, 6954–6967. [Google Scholar] [CrossRef] [PubMed]
  60. Stroh, J.G.; Petucci, C.J.; Brecker, S.J.; Huang, N.; Lau, J.M. Automated sub-ppm mass accuracy on an ESI-TOF for use with drug discovery compound libraries. J. Am. Soc. Mass Spectrom. 2007, 18, 1612–1616. [Google Scholar] [CrossRef] [Green Version]
  61. V. González de Peredo, A.; Vázquez-Espinosa, M.; Espada-Bellido, E.; Jiménez-Cantizano, A.; Ferreiro-González, M.; Amores-Arrocha, A.; Palma, M.; G. Barroso, C.; F. Barbero, G. Development of new analytical microwave-assisted extraction methods for bioactive compounds from myrtle (myrtus communis L.). Molecules 2018, 23, 2992. [Google Scholar] [CrossRef] [PubMed] [Green Version]
  62. Yoshimura, Y.; Zaima, N.; Moriyama, T.; Kawamura, Y. Different localization patterns of anthocyanin species in the pericarp of black rice revealed by imaging mass spectrometry. PLoS ONE 2012, 7, e31285. [Google Scholar] [CrossRef]
  63. Yang, H.; Kim, H.W.; Kwon, Y.S.; Kim, H.K.; Sung, S.H. Fast and Simple Discriminative Analysis of Anthocyanins-Containing Berries Using LC/MS Spectral Data. Phytochem. Anal. 2017, 28, 416–423. [Google Scholar] [CrossRef] [PubMed]
  64. Cooney, J.M.; Jensen, D.J.; McGhie, T.K. LC-MS identification of anthocyanins in boysenberry extract and anthocyanin metabolites in human urine following dosing. J. Sci. Food Agric. 2004, 84, 237–245. [Google Scholar] [CrossRef]
  65. Di Stefano, V.; Pitonzo, R.; Novara, M.E.; Bongiorno, D.; Indelicato, S.; Gentile, C.; Avellone, G.; Bognanni, R.; Scandurra, S.; Melilli, M.G. Antioxidant activity and phenolic composition in pomegranate (Punica granatum L.) genotypes from south Italy by UHPLC–Orbitrap-MS approach. J. Sci. Food Agric. 2019, 99, 1038–1045. [Google Scholar] [CrossRef] [PubMed]
  66. Slimestad, R.; Solheim, H. Anthocyanins from black currants (Ribes nigrum L.). J. Agric. Food Chem. 2002, 50, 3228–3231. [Google Scholar] [CrossRef]
  67. Diretto, G.; Jin, X.; Capell, T.; Zhu, C.; Gomez-Gomez, L. Differential accumulation of pelargonidin glycosides in petals at three different developmental stages of the orange-flowered gentian (Gentiana lutea L. var. aurantiaca). PLoS ONE 2019, 14, e0212062. [Google Scholar] [CrossRef]
  68. Longo, L.; Vasapollo, G. Anthocyanins from bay (Laurus nobilis L.) berries. J. Agric. Food Chem. 2005, 53, 8063–8067. [Google Scholar] [CrossRef] [PubMed]
  69. Stashenko, E.; Mejía, J.; Sierra, L.J.; Bernal, D.C.; Gualteros, L.; Carrillo, K.; Martínez, J.R. Flower metabolomics: Volatile compound profile, antioxidant capacity and lc-ms-tof identification of flavonoids in various tropical flowers. Planta Med. 2015, 81, PW_201. [Google Scholar] [CrossRef]
  70. Banaszewski, K.; Park, E.; Edirisinghe, I.; Cappozzo, J.C.; Burton-Freeman, B.M. A pilot study to investigate bioavailability of strawberry anthocyanins and characterize postprandial plasma polyphenols absorption patterns by Q-TOF LC/MS in humans. J. Berry Res. 2013, 3, 113–126. [Google Scholar] [CrossRef]
  71. Iwashina, T. Flavonoid properties of five families newly incorporated into the order Caryophyllales. Bull. Natl. Mus. Nat. Sci. 2013, 39, 25–51. [Google Scholar]
  72. Cabrita, L.; Frøystein, N.Å.; Andersen, Ø.M. Anthocyanin trisaccharides in blue berries of Vaccinium padifolium. Food Chem. 2000, 69, 33–36. [Google Scholar] [CrossRef]
  73. Giordano, L.; Coletta, W.; Rapisarda, P.; Donati, M.B.; Rotilio, D. Development and validation of an LC-MS/MS analysis for simultaneous determination of delphinidin-3-glucoside, cyanidin-3-glucoside and cyanidin-3-(6-malonylglucoside) in human plasma and urine after blood orange juice administration. J. Sep. Sci. 2007, 30, 3127–3136. [Google Scholar] [CrossRef] [PubMed]
  74. Stein-Chisholm, R.E.; Beaulieu, J.C.; Grimm, C.C.; Lloyd, S.W. LC–MS/MS and UPLC–UV evaluation of anthocyanins and anthocyanidins during rabbiteye blueberry juice processing. Beverages 2017, 3, 56. [Google Scholar] [CrossRef] [Green Version]
  75. Li, D.; Meng, X.; Li, B. Profiling of anthocyanins from blueberries produced in China using HPLC-DAD-MS and exploratory analysis by principal component analysis. J. Food Compos. Anal. 2016, 47, 1–7. [Google Scholar] [CrossRef]
  76. Šavikin, K.; Zdunić, G.; Janković, T.; Gođevac, D.; Stanojković, T.; Pljevljakušić, D. Berry fruit teas: Phenolic composition and cytotoxic activity. Food Res. Int. 2014, 62, 677–683. [Google Scholar] [CrossRef]
  77. Mertz, C.; Gancel, A.-L.; Gunata, Z.; Alter, P.; Dhuique-Mayer, C.; Vaillant, F.; Perez, A.M.; Ruales, J.; Brat, P. Phenolic compounds, carotenoids and antioxidant activity of three tropical fruits. J. Food Compos. Anal. 2009, 22, 381–387. [Google Scholar] [CrossRef]
  78. Zhang, Y.Z.; Xu, S.Z.; Cheng, Y.W.; Ya, H.Y.; Han, J.M. Transcriptome analysis and anthocyanin- related genes in red leaf lettuce. Genet Mol Res. 2016, 15, 1–11. [Google Scholar] [CrossRef]
  79. Tu, Y.; Liu, F.; Guo, D.; Fan, L.; Zhu, Z.; Xue, Y.; Gao, Y.; Guo, M. Molecular characterization of flavanone 3-hydroxylase gene and flavonoid accumulation in two chemotyped safflower lines in response to methyl jasmonate stimulation. BMC Plant Biol. 2016, 16, 1–12. [Google Scholar] [CrossRef] [PubMed] [Green Version]
  80. Khumkarjorn, N.; Thanonkeo, S.; Yamada, M.; Thanonkeo, P. Cloning and expression analysis of a flavanone 3-hydroxylase gene in Ascocenda orchid. J. Plant Biochem. Biotechnol. 2017, 26, 179–190. [Google Scholar] [CrossRef]
  81. Singh, K.; Kumar, S.; Yadav, S.K.; Ahuja, P.S. Characterization of dihydroflavonol 4-reductase cDNA in tea [Camellia sinensis (L.) O. Kuntze]. Plant Biotechnol. Rep. 2009, 3, 95–101. [Google Scholar] [CrossRef]
  82. Ahmed, N.U.; Park, J.-I.; Jung, H.-J.; Yang, T.-J.; Hur, Y.; Nou, I.-S. Characterization of dihydroflavonol 4-reductase (DFR) genes and their association with cold and freezing stress in Brassica rapa. Gene 2014, 550, 46–55. [Google Scholar] [CrossRef] [PubMed]
  83. Saito, K.; Kobayashi, M.; Gong, Z.; Tanaka, Y.; Yamazaki, M. Direct evidence for anthocyanidin synthase as a 2-oxoglutarate-dependent oxygenase: Molecular cloning and functional expression of cDNA from a red forma of Perilla frutescens. Plant J. 1999, 17, 181–189. [Google Scholar] [CrossRef] [Green Version]
  84. Chuan-Li, Z.; Peng, C.; Yue-Ming, Z.; Chang-Yuan, Z.; Dan-Hong, S.; Fei, J. Full Length cDNA Cloning and Expression Analysis of UFGT Gene from Ginkgo biloba. Acta Hortic. Sin. 2012, 39, 1903. [Google Scholar]
  85. Wu, X.; Gong, Q.; Ni, X.; Zhou, Y.; Gao, Z. UFGT: The key enzyme associated with the petals variegation in Japanese apricot. Front. Plant Sci. 2017, 8, 108. [Google Scholar] [CrossRef] [PubMed] [Green Version]
  86. Boss, P.K.; Davies, C.; Robinson, S.P. Anthocyanin composition and anthocyanin pathway gene expression in grapevine sports differing in berry skin colour. Aust. J. Grape Wine Res. 1996, 2, 163–170. [Google Scholar] [CrossRef]
  87. Boss, P.K.; Davies, C.; Robinson, S.P. Expression of anthocyanin biosynthesis pathway genes in red and white grapes. Plant Mol. Biol. 1996, 32, 565–569. [Google Scholar] [CrossRef]
  88. Hu, C.; Gong, Y.; Jin, S.; Zhu, Q. Molecular analysis of a UDP-glucose: Flavonoid 3-O-glucosyltransferase (UFGT) gene from purple potato (Solanum tuberosum). Mol. Biol. Rep. 2011, 38, 561–567. [Google Scholar] [CrossRef]
  89. Stommel, J.R.; Lightbourn, G.J.; Winkel, B.S.; Griesbach, R.J. Transcription factor families regulate the anthocyanin biosynthetic pathway in Capsicum annuum. J. Am. Soc. Hortic. Sci. 2009, 134, 244–251. [Google Scholar] [CrossRef] [Green Version]
  90. Zhou, H.; Peng, Q.; Zhao, J.; Owiti, A.; Ren, F.; Liao, L.; Wang, L.; Deng, X.; Jiang, Q.; Han, Y. Multiple R2R3-MYB transcription factors involved in the regulation of anthocyanin accumulation in peach flower. Front. Plant Sci. 2016, 7, 1557. [Google Scholar] [CrossRef]
  91. Feller, A.; Machemer, K.; Braun, E.L.; Grotewold, E. Evolutionary and comparative analysis of MYB and bHLH plant transcription factors. Plant J. 2011, 66, 94–116. [Google Scholar] [CrossRef] [PubMed]
  92. D’Amelia, V.; Aversano, R.; Batelli, G.; Caruso, I.; Castellano Moreno, M.; Castro-Sanz, A.B.; Chiaiese, P.; Fasano, C.; Palomba, F.; Carputo, D. High AN 1 variability and interaction with basic helix-loop-helix co-factors related to anthocyanin biosynthesis in potato leaves. Plant J. 2014, 80, 527–540. [Google Scholar] [CrossRef] [PubMed] [Green Version]
  93. Liu, Y.; Lin-Wang, K.; Espley, R.V.; Wang, L.; Yang, H.; Yu, B.; Dare, A.; Varkonyi-Gasic, E.; Wang, J.; Zhang, J. Functional diversification of the potato R2R3 MYB anthocyanin activators AN1, MYBA1, and MYB113 and their interaction with basic helix-loop-helix cofactors. J. Exp. Bot. 2016, 67, 2159–2176. [Google Scholar] [CrossRef]
  94. Hichri, I.; Barrieu, F.; Bogs, J.; Kappel, C.; Delrot, S.; Lauvergeat, V. Recent advances in the transcriptional regulation of the flavonoid biosynthetic pathway. J. Exp. Bot. 2011, 62, 2465–2483. [Google Scholar] [CrossRef] [Green Version]
  95. Elomaa, P.; Uimari, A.; Mehto, M.; Albert, V.A.; Laitinen, R.A.E.; Teeri, T.H. Activation of anthocyanin biosynthesis in Gerbera hybrida (Asteraceae) suggests conserved protein-protein and protein-promoter interactions between the anciently diverged monocots and eudicots. Plant. Physiol. 2003, 133, 1831–1842. [Google Scholar] [CrossRef] [Green Version]
  96. Espley, R.V.; Hellens, R.P.; Putterill, J.; Stevenson, D.E.; Kutty-Amma, S.; Allan, A.C. Red colouration in apple fruit is due to the activity of the MYB transcription factor, MdMYB10. Plant. J. 2007, 49, 414–427. [Google Scholar] [CrossRef] [Green Version]
  97. Chiu, L.-W.; Zhou, X.; Burke, S.; Wu, X.; Prior, R.L.; Li, L. The purple cauliflower arises from activation of a MYB transcription factor. Plant. Physiol. 2010, 154, 1470–1480. [Google Scholar] [CrossRef] [PubMed] [Green Version]
  98. Ohno, S.; Hosokawa, M.; Hoshino, A.; Kitamura, Y.; Morita, Y.; Park, K.-I.; Nakashima, A.; Deguchi, A.; Tatsuzawa, F.; Doi, M. A bHLH transcription factor, DvIVS, is involved in regulation of anthocyanin synthesis in dahlia (Dahlia variabilis). J. Exp. Bot. 2011, 62, 5105–5116. [Google Scholar] [CrossRef] [Green Version]
  99. Butelli, E.; Licciardello, C.; Zhang, Y.; Liu, J.; Mackay, S.; Bailey, P.; Reforgiato-Recupero, G.; Martin, C. Retrotransposons control fruit-specific, cold-dependent accumulation of anthocyanins in blood oranges. Plant. Cell 2012, 24, 1242–1255. [Google Scholar] [CrossRef] [PubMed] [Green Version]
  100. Liu, F.; Yang, Y.; Gao, J.; Ma, C.; Bi, Y. A comparative transcriptome analysis of a wild purple potato and its red mutant provides insight into the mechanism of anthocyanin transformation. PLoS ONE 2018, 13, e0191406. [Google Scholar] [CrossRef] [Green Version]
  101. Jaakola, L.; Poole, M.; Jones, M.O.; Kämäräinen-Karppinen, T.; Koskimäki, J.J.; Hohtola, A.; Häggman, H.; Fraser, P.D.; Manning, K.; King, G.J. A SQUAMOSA MADS box gene involved in the regulation of anthocyanin accumulation in bilberry fruits. Plant. Physiol. 2010, 153, 1619–1629. [Google Scholar] [CrossRef] [Green Version]
  102. Zhang, J.; Xu, H.; Wang, N.; Jiang, S.; Fang, H.; Zhang, Z.; Yang, G.; Wang, Y.; Su, M.; Xu, L. The ethylene response factor MdERF1B regulates anthocyanin and proanthocyanidin biosynthesis in apple. Plant. Mol. Biol. 2018, 98, 205–218. [Google Scholar] [CrossRef] [PubMed]
  103. Yao, G.; Ming, M.; Allan, A.C.; Gu, C.; Li, L.; Wu, X.; Wang, R.; Chang, Y.; Qi, K.; Zhang, S. Map-based cloning of the pear gene MYB 114 identifies an interaction with other transcription factors to coordinately regulate fruit anthocyanin biosynthesis. Plant. J. 2017, 92, 437–451. [Google Scholar] [CrossRef] [Green Version]
  104. An, J.; Zhang, X.; You, C.; Bi, S.; Wang, X.; Hao, Y. Md WRKY 40 promotes wounding-induced anthocyanin biosynthesis in association with Md MYB 1 and undergoes Md BT 2-mediated degradation. New Phytol. 2019, 224, 380–395. [Google Scholar] [CrossRef]
  105. Cyboran-Mikołajczyk, S.; Jurkiewicz, P.; Hof, M.; Kleszczyńska, H. The Impact of O-Glycosylation on Cyanidin Interaction with POPC Membranes: Structure-Activity Relationship. Molecules 2018, 23, 2771. [Google Scholar] [CrossRef] [PubMed] [Green Version]
  106. Landi, M.; Tattini, M.; Gould, K.S. Multiple functional roles of anthocyanins in plant-environment interactions. Environ. Exp. Bot. 2015, 119, 4–17. [Google Scholar] [CrossRef]
  107. Ren, J.; Liu, Z.; Chen, W.; Xu, H.; Feng, H. Anthocyanin degrading and chlorophyll accumulation lead to the formation of bicolor leaf in ornamental kale. Int. J. Mol. Sci. 2019, 20, 603. [Google Scholar] [CrossRef] [PubMed] [Green Version]
  108. Lee, D.W.; Collins, T.M. Phylogenetic and ontogenetic influences on the distribution of anthocyanins and betacyanins in leaves of tropical plants. Int. J. Plant. Sci. 2001, 162, 1141–1153. [Google Scholar] [CrossRef]
  109. Aras, A.; Cevahir, G.; Yentür, S.; Eryılmaz, F.; Sarsağ, M.; Çağ, S. Investigation of anthocyanin localization in various parts of Impatiens balsamina L. Biotechnol. Biotechnol. Equip. 2007, 21, 69–73. [Google Scholar] [CrossRef] [Green Version]
  110. Zhu, H.; Zhang, T.J.; Zhang, P.; Peng, C.L. Pigment patterns and photoprotection of anthocyanins in the young leaves of four dominant subtropical forest tree species in two successional stages under contrasting light conditions. Tree Physiol. 2016, 36, 1092–1104. [Google Scholar] [CrossRef] [PubMed] [Green Version]
  111. Zhang, T.-J.; Chow, W.S.; Liu, X.-T.; Zhang, P.; Liu, N.; Peng, C.-L. A magic red coat on the surface of young leaves: Anthocyanins distributed in trichome layer protect Castanopsis fissa leaves from photoinhibition. Tree Physiol. 2016, 36, 1296–1306. [Google Scholar] [CrossRef] [Green Version]
  112. Hong, Y.; Tang, X.; Huang, H.; Zhang, Y.; Dai, S. Transcriptomic analyses reveal species-specific light-induced anthocyanin biosynthesis in chrysanthemum. BMC Genom. 2015, 16, 1–18. [Google Scholar] [CrossRef] [PubMed] [Green Version]
  113. Suzuki, K.; Suzuki, T.; Nakatsuka, T.; Dohra, H.; Yamagishi, M.; Matsuyama, K.; Matsuura, H. RNA-seq-based evaluation of bicolor tepal pigmentation in Asiatic hybrid lilies (Lilium spp.). BMC Genom. 2016, 17, 1–19. [Google Scholar] [CrossRef] [PubMed] [Green Version]
  114. Deng, C.; Li, S.; Feng, C.; Hong, Y.; Huang, H.; Wang, J.; Wang, L.; Dai, S. Metabolite and gene expression analysis reveal the molecular mechanism for petal colour variation in six Centaurea cyanus cultivars. Plant. Physiol. Biochem. 2019, 142, 22–33. [Google Scholar] [CrossRef]
  115. Seyedreihani, S.F.; Tan, T.-C.; Alkarkhi, A.F.M.; Easa, A.M. Total phenolic content and antioxidant activity of Ulam raja (Cosmos caudatus) and quantification of its selected marker compounds: Effect of extraction. Int. J. Food Prop. 2017, 20, 260–270. [Google Scholar] [CrossRef]
Figure 1. Length distribution of de novo assembled unigenes and coding sequences (CDS).
Agronomy 11 00661 g001
Figure 2. Distribution of the homology search of unigenes against the non-redundant (NR) protein database, (A) E-value distribution of the top Blastx hits against the NR database for each unigene; (B) Similarity distribution of the top Blastx hits against the NR database for each unigene.
Agronomy 11 00661 g002
Figure 3. Average abundance of protein classes in the different tissues of Cosmos caudatus transcriptome. The area under each pie represents the percentage (%) value of an actual number of transcripts.
Agronomy 11 00661 g003
Figure 4. Histogram of gene ontology analysis of the number of transcripts annotated for C. caudatus. The classification was according to three main GO domains; (A) biological process, (B) molecular function, (C) cellular component.
Agronomy 11 00661 g004
Figure 5. Unigenes from C. caudatus transcripts involved in the anthocyanin biosynthetic pathway. The number in brackets indicates the number of unigenes identified for the corresponding gene. The molecular structure of each compound was retrieved from the online database (KEGG and ChemSpider).
Agronomy 11 00661 g005
Figure 6. Unigenes of C. caudatus of transcription factors (TFs) in anthocyanin regulation. Graphs indicate the number of unigenes identified for the corresponding gene.
Agronomy 11 00661 g006
Figure 7. Heatmap of the most significant metabolites of different abundance levels marking the divergence between the flower, leaf, root, and stem tissues of C. caudatus. Anthocyanins in the heatmap are labelled, showing pelargonidin, cyanidin, and delphinidin derivatives in high abundance in flower tissue. In contrast, delphinidin derivatives were detected in high abundance in the leaf tissue compared to the stem and root.
Agronomy 11 00661 g007
Figure 8. Transverse anatomy sections of different tissues of C. caudatus, root: (A,B), stem: (C,D), leaf petiole: (E,F), and floral petal: (G,H). (A,C,E,G) are under magnification 10×, whereas (B,D,F,H) are under magnification 20×, of the respective tissue’s focused region (black box). Black arrows indicate localization of anthocyanins (pigmentation) at the adaxial epidermis, and blue arrows point to the localization in the papillae.
Agronomy 11 00661 g008
Figure 9. Schematic diagram showing the anthocyanin biosynthesis occurrence in four different tissues (leaf, flower, stem, and root) of C. caudatus Kunth. using three independent platforms: transcriptomics, metabolomics, and anatomy. (A) The 11 main structural genes responsible for the anthocyanin biosynthetic pathway and its regulatory genes were annotated from transcriptome data of the RNA of four different tissues of C. caudatus Kunth., assembled as a single set of metadata for gene identification. (B) LC-MS detected three major anthocyanin peaks in four tissues of the species studied (3 biological replicates each) based on m/z values obtained from the chromatogram. (C) Transverse sectioning of the different tissues studied showed anthocyanin localized cell parts through the naturally occurring coloration observed under the light microscope.
Agronomy 11 00661 g009
Table 1. Statistics of complete transcriptome assembly.
AttributesUnigenesCDS
Total unigenes187,206167,252
GC%41.8943.84
Contig N50551468
Median contig length308258
Average contig length476.71
Total assembled bases89,243,338
Table 2. Statistics of annotation results against public databases.
DatabaseNumber of UnigenesPercentages of Unigenes
NR95,94351.25
Swiss-Prot71,60738.25
Interpro75,62940.40
KEGG49,98426.7
GO70,06537.43
Table 3. The domain prediction for four key genes in the anthocyanin biosynthetic pathway (F3H, DFR, LDOX, and UFGT) identified from C. caudatus transcript against InterProScan software.
Genes Domain Hit (InterProScan)
F3HIPR005123: Oxoglu/Fe-dep_dioxygenase
PS51471: FE2OG_OXY
PF03171: 2OG-FeII_Oxy
IPR026992: DIOX_N
PF14226: DIOX_N
DFRIPR001509: Epimerase_deHydtase
PF01370: Epimerase
LDOXIPR005123: Oxoglu/Fe-dep_dioxygenase
PF03171: 2OG-FeII_Oxy
PS51471: FE2OG_OXY
UFGTIPR035595: UDP_glycos_trans_CS
PS00375: UDPGT
Table 4. Anthocyanidins and their substitutions.
Agronomy 11 00661 i001
Anthocyanin/AnthocyanidinMolecular
Weight (g/mol)
R1R2R3R4
Cyanidin287.24OHHHH
Pelargonidin271.24HHHH
Delphinidin303.24OHOHHH
Cyanidin-3-O-pentoside419.35OHHPentoseH
Cyanidin-3-O-rutinoside (rhamnohexoside)595.53OHHRutinoseH
Cyanidin-3-O-hexoside449.38OHHHexoseH
Pelargonidin-3-O-hexoside433.38HHHexoseH
Pelargonidin-3,5-O-dihexoside595.53HHHexoseHexose
Pelargonidin-3-O-(6-p-coumaroyl)hexoside579.53HHp-CoumaroylhexoseH
Pelargonidin-3-O-glucuronoside447.37HHGlucuronideH
Delphinidin-3-O-rhamnoside449.38OHOHRhamnoseH
Delphinidin-3-O-hexoside465.38OHOHHexoseH
Delphinidin-3-O-aldopentoside435.35OHOHAldopentoseH
Delphinidin-3-O-rutinoside611.52OHOHRutinoseH
Table 5. Anthocyanins detected in C. caudatus tissues.
AnthocyaninCalculated Molecular Ion
[M]+, (m/z)
Observed [M]+, m/z (Accurate Mass Error)Retention Time,
tR (min)
Molecular Formulap-ValueReferences
Cyanidin-3-O-pentoside419.0973419.0967
(0.6 mDa, 1.4 ppm)
9.99 minC20H19O10+0.049875[61,62]
Cyanidin-3-O-rutinoside (rhamnoglucoside)595.1657595.1656
(0.1 mDa, 0.2 ppm)
7.64 minC27H31O15+2.91 × 10⁻⁷[62,63,64]
Cyanidin-3-O-glucoside449.1078449.1085
(0.7 mDa, 1.5 ppm)
8.98 minC21H21O11+6.48 × 10⁻⁹[62,65]
Pelargonidin-3-O-glucoside433.1129433.1133
(0.4 mDa, 1.0 ppm)
8.98 minC21H21O10+1.08 × 10⁻⁸[62,65]
Pelargonidin-3,5-O-dihexoside595.1657595.1655
(0.2 mDa, 0.4 ppm)
8.16 minC27H31O15+1.89 × 10⁻⁵[65,66]
Pelargonidin-3-O-(6-p-coumaroyl)
hexoside
579.1497579.1491
(0.6 mDa, 1.0 ppm)
8.19 minC30H27O12+7.74 × 10⁻⁹[67,68]
Pelargonidin-3-O-glucuronide447.0922447.0917
(0.5 mDa, 1.0 ppm)
9.93 minC21H19O11+4.57 × 10⁻⁸[69,70]
Delphinidin-3-O-rhamnoside449.1078449.1078
(0.0 mDa, 0.0 ppm)
9.69 minC21H21O11+6.74 × 10⁻⁹[71,72]
Delphinidin-3-O-glucoside465.1028465.1027
(0.1 mDa, 0.2 ppm)
9.28 minC21H21O12+1.47 × 10⁻⁸[62,73]
Delphinidin-3-O-aldopentoside435.0922435.0916
(0.5 mDa, 1.2 ppm)
9.61 minC20H19O11+9.57 × 10⁻⁹[74,75]
Delphinidin-3-O-rutinoside611.1607611.1606
(0.1 mDa, 0.1 ppm)
8.94 minC27H31O16+6.63 × 10⁻⁸[76,77]
Publisher’s Note: MDPI stays neutral with regard to jurisdictional claims in published maps and institutional affiliations.

