Article

Strategic Tillage Effects on Crop Yields, Soil Properties, and Weeds in Dryland No-Tillage Systems

by
Augustine K. Obour
1,*,
Johnathon D. Holman
2,
Logan M. Simon
1 and
Alan J. Schlegel
3
1
Agricultural Research Center-Hays, Kansas State University, Hays, KS 67601, USA
2
Southwest Research-Extension Center, Kansas State University, Garden City, KS 67846, USA
3
Southwest Research-Extension Center, Kansas State University, Tribune, KS 67879, USA
*
Author to whom correspondence should be addressed.
Agronomy 2021, 11(4), 662; https://doi.org/10.3390/agronomy11040662
Submission received: 16 February 2021 / Revised: 27 March 2021 / Accepted: 29 March 2021 / Published: 31 March 2021

Abstract

:
Long-term no-till (NT) systems in the semiarid central Great Plains of the United States require flexible management strategies to minimize the impacts of herbicide resistant (HR) kochia (Kochia scoparia L.) and tumble windmill grass (Chloris verticillata Nutt.) as well as nutrient stratification on soil and crop productivity. This study examined strategic tillage (ST) to control HR weeds and improve crop yields in an otherwise long-term NT cropping system. Treatments were three crop rotations: (1) continuous winter wheat (Triticum aestivum L.) (WW); (2) wheat-fallow (WF); and (3) wheat-grain sorghum (Sorghum bicolor L.)-fallow (WSF); as main plots. Subplots were reduced tillage (RT), continuous NT, and ST of NT. Results showed ST and RT treatments provided significant control of HR weeds. Soil water content at wheat planting was significantly less with RT compared to NT or ST. Strategic tillage did not affect wheat or grain sorghum yields, but RT decreased sorghum yields by 15% compared to NT. Increasing cropping intensity reduced wheat yields. Strategic tillage reduced bulk density and had no effect on aggregate size distribution or mean weight diameter (MWD) compared to NT though RT reduced the proportion of large macroaggregates and MWD. Similarly, ST compared to NT had no effect on soil organic carbon (SOC) or nitrogen (N) concentrations. Soil phosphorus (P) was not different among the tillage treatments though RT increased potassium (K) concentration near the soil surface. The SOC, MWD, and micronutrient availability were greatest with WW though it had significantly lower pH and K concentration. Our results suggest ST could provide a mitigation option for HR weeds in NT systems with little impact on crop yields and soil properties.

1. Introduction

Adoption of no-tillage (NT) has allowed for more efficient soil water storage and greater cropping intensity in dryland production systems across the semiarid central Great Plains (CGP) of the United States [1,2]. No-tillage systems have provided several benefits including the ability of growers to manage greater hectares of cropland with fewer total inputs [1], reductions in soil erosion from wind and water, accretion of soil organic carbon (SOC), and improvements of soil structure [2,3,4]. However, there are concerns about the long-term sustainability of such NT systems due to build-up of herbicide-resistant (HR) weed populations, soil compaction, soil ruts, and varmint (Taxidea taxus) holes causing a rough surface for field operations, as well as stratification of pH, nutrients, and SOC in the top few centimeters of the soil profile [5,6]. These conditions can lead to reductions in the availability and uptake of nutrients to growing crops as well as an increased risk of nitrogen (N) and phosphorus (P) losses in surface runoff to the environment.
These emerging challenges in long-term NT systems have prompted the need for more flexible management strategies without compromising improvements in soil properties accrued under NT management. Strategic tillage (ST), which refers to the practice of occasional tillage in otherwise NT cropping systems, is one possible solution for HR weed and nutrient stratification issues in long-term NT [5,7,8,9]. Strategic tillage with a sweep plow timed when soil erosion risk is low in an otherwise NT cropping system could help manage HR weed populations and reduce stratification of soil properties [5,7]. After the one-time tillage operation, the field would go back to NT production [5]. This ST approach could increase productivity and profitability of dryland cropping systems in the semiarid CGP.
However, ST effects on crop yields and soil properties are unclear particularly in water-limited environments where susceptibility to wind erosion can be high. Few studies have investigated the effects of ST on soils that have been in long-term continuous NT under dryland conditions. Previous studies showed ST in otherwise NT systems had neutral or positive effects on crop yields [7,9,10,11,12]. For example, a study in eastern Nebraska showed one-time tillage of NT soils with a moldboard plow had no effect on crop yields and water stable aggregates [13]. Similarly, five years after the introduction of one-time tillage with a moldboard plow, Wortmann et al. [14] reported no differences in corn (Zea mays L.) and soybean (Glycine max L. Merr.) yields, water stable aggregates, and SOC compared to strict NT management. However, others like Grandy et al. [15] suggest tillage of any type in long-term NT systems can significantly decrease soil aggregation and increase SOC and N losses in such a way that all improvements in soil properties gained through NT can be lost within a short period following the implementation of tillage.
In western Kansas, Obour et al. [6] reported greater P concentration and soil acidification near the upper surface of soils under NT. Correcting the stratification of P and soil pH with a ST operation could increase nutrient availability for plant uptake in soils under NT. One-time tillage of NT with a moldboard plow was reported to significantly aid in the redistribution of soil acidity [16]. However, in Saskatchewan, Canada, Baan et al. [10] reported no difference in pH and SOC when one-time ST with a 1.8 m cultivator equipped with 30 cm sweeps was implemented in otherwise NT systems. In New South Wales, Australia, no significant difference in soil water content, pH, bulk density, electrical conductivity, P concentration, or SOC was observed when one-time tillage with a chisel cultivator or disc chain was implemented [9]. The authors reported marginal differences in weed populations as well as no impact on wheat yields.
In western Nebraska, ST with a moldboard plow in a NT dryland winter wheat-fallow cropping system resulted in significant control of winter annual grass weeds while retaining many of the soil property benefits of NT [7]. It is therefore plausible that ST operations could be utilized to alleviate issues of HR perennial grass weeds such as three-awn grass (Aristida purpurea Nutt.) and tumble windmill grass (Chloris verticillata Nutt.), as well as kochia (Kochia scoparia L.) and Palmer amaranth (Amaranthus palmeri S. Watson) that have become a major challenge in NT crop production [17]. For example, inadequate control of invasive tumble windmill grass could cause significant competition with wheat and sorghum resulting in yield reductions. Moreover, effective weed control is the key to NT crop production, hence the presence of HR kochia and Palmer amaranth pose a challenge to profitability of dryland NT systems. There is evidence that some producers are reintroducing tillage as a cost-effective means of controlling HR weeds in otherwise NT systems. The overall impetus for tillage by growers is the economic cost of managing HR weeds in NT systems. With the current low grain commodity prices, growers are considering ST as an economical option to manage HR weeds that developed through continuous NT. Although research efforts investigating the use of ST to manage weeds has been conducted in Australia and the northern Great Plains region of Canada, to our knowledge, few studies [7] have investigated the effects of ST on soils that have been in long-term continuous NT (>40 year) under dryland conditions in the semiarid CGP. Current HR weeds and nutrient stratification issues in long-term NT require developing flexible management options that will maintain crop productivity and soil properties. We hypothesized that ST with a sweep plow would be effective in controlling HR kochia as well as shallow rooted three-awn and tumble windmill grass weeds with no negative impacts on soil properties or crop yields. Therefore, the objectives of the current study were to determine (1) the effects of ST in long-term NT cropping systems on soil water content at winter wheat planting and crop yield; (2) the effectiveness of ST to redistribute soil nutrients and acidity as well as to control perennial grass and HR kochia, and (3) the effects on soil chemical and physical properties following tillage of otherwise long-term NT.

2. Materials and Methods

2.1. Study Set-Up

This study was conducted from summer of 2016 through fall 2018 using long-term tillage and crop rotation experimental plots established in 1976 at the Kansas State University Agricultural Research Center-Hays near Hays, KS (38°86′ N, 99°27′ W, 609 m above sea level). The soil at the study site was mapped as a Crete silt loam (Fine, smectitic, mesic Pachic Udertic Argiustolls), which consists of deep, moderately well drained soils formed from loess material. The experimental design was a randomized complete block with three replications in a split-plot treatment structure. Main plots were three crop rotations [continuous winter wheat (WW), wheat-fallow (WF), wheat-sorghum-fallow (WSF)] and two tillage treatments (RT and NT) as sub-plots. Every phase of each crop rotation and tillage system combination were present in each replication every year of the study. For example, the other phase of WF is fallow-wheat (FW), WSF has two other phases, fallow-wheat-sorghum (FWS) and sorghum-fallow-wheat (SFW). However, WW has only one phase (see Supplemental Figure S1). Individual plots sizes were 12.2 m wide by 24.4 m long.
In the summer of 2016 (July), the study was modified to implement one-time strategic tillage (ST) to manage HR kochia and perennial grass weeds such as three-awn and tumble windmill grasses by splitting the long-term NT plots into two equal plots of 6.1 m wide by 24.4 m long. One-half was left in continuous NT and the other half was tilled. This resulted in three main plots of crop rotations and three tillage sub-plots (RT, continuous NT, and ST of NT; see Supplemental Figure S2). The ST plots were first tilled to a depth of 7.5 cm with a Quinstar Fallow Master sweep plow (Quinstar Equipment Company, Quinter, KS, USA) equipped with pickers to ensure complete control of the HR kochia and shallow-rooted HR three-awn and tumble windmill grasses. This was followed by a second tillage operation 3 days later with the same sweep plow to a depth of 15 cm for soil mixing and redistribution of pH and nutrients. All tillage operations in these wheat-based rotations were performed in July prior to winter wheat planting in October. For the crop rotation with sorghum (WSF), tillage operations occurred in May before sorghum planting in June. Tillage in the RT treatment was accomplished with residue saving implements including a V-blade (Premier Tillage, Quinter, KS, USA) and Fallow Master sweep plow. Two to three tillage operations were performed in the RT plots over the fallow period before winter wheat planting in the WF or WSF rotation. One tillage operation occurred in the RT plots ahead of sorghum planting in WSF or wheat planting in the WW plot [18].

2.2. Weed Density Evaluation

In order to assess the effectiveness of ST as a weed management tool, weed seedlings including kochia and perennial grass weeds in each plot were evaluated 1 month following tillage operations. Weed densities were measured in each plot by counting the total number of weeds within three randomly placed 1 m2 quadrats in each plot (see Supplemental Figure S2). The average of the three counts were computed to represent weed density within each plot [19]).

2.3. Soil Physical Properties

Soil water content at winter wheat planting from each plot was determined gravimetrically to 150 cm in 30 cm depth increments in all plots prior to planting in the 2016 and 2017 growing seasons. Two soil cores were taken with a Giddings probe (Giddings Machine Company, Windsor, CO, USA) from the center of each plot and data averaged for a single soil water content measurement. Soil cores were weighed wet, then placed in an oven at 105 °C for at least 48 h, and then weighed dry. Data was used to estimate soil water content at wheat planting for each tillage and crop rotation combination [19].
Soil compaction and structural changes are major concerns when long-term NT fields are disturbed by tillage. Soil cores were taken from 0 to 15, and 15 to 30 cm depths three months after ST for determination of bulk density and at 0 to 5 cm for water stable aggregates in the fallow phase of the rotations before winter wheat planting in both 2016 and 2017. Briefly, a portion of the samples taken at each depth were dried at 105 °C for 48 h. and bulk density determined by mass of oven-dry soil divided by volume of the core [20]. Soil samples collected at 0 to 5 cm with a flat shovel were air-dried and passed through sieves with 4.75 to 8 mm mesh to obtain air-dry aggregates of 4.75 to 8 mm diameter. These samples were used for the determination of water stable aggregates by the wet-sieving method [21]. Sand corrections were done for each aggregate size fraction and the data used to compute aggregate size distribution and MWD of water stable aggregates for each treatment [21].

2.4. Soil Chemical Properties

Soil samples were taken from the 0 to 5 cm, 5 to 15, and 15 to 30 cm soil depths three months following tillage operations but before wheat planting, air-dried, and ground to pass through a 2 mm sieve. The sieved soil samples were analyzed for pH and soil extractable nutrients at the Kansas State University Soil Testing Laboratory using standard soil testing procedures [22]. Briefly, soil pH was determined potentiometrically by an electrode [23]. Soil nitrate-N (NO3-N) and ammonium-N (NH4-N) concentrations in samples were determined colorimetrically after the soil samples were extracted with 2 M KCl. Available P was determined by the Mehlich-3 extraction method [24], and P concentration following extraction was measured using inductively coupled plasma-optical emission spectrometry (ICP-OES). The exchangeable Ca, Mg, and K concentrations were determined by ICP-OES after NH4OAc extraction [25]; Fe, Mn, and Zn were determined with the DTPA extraction method [26]; and nutrient concentrations were measured using atomic absorption spectrometry. A portion of the samples were ground with a mortar and pestle to pass through a 0.25 mm sieve and SOC concentration was determined by dry combustion using a CN analyzer after pretreating samples with 10% (v/v) HCl to removed carbonates [27].

2.5. Evaluation of Crop Yields

Winter wheat and grain sorghum yields were determined by harvesting an area 1.5 m wide by 24.4 m long from the center of each plot using a Massey Ferguson 8XP small plot combine harvester (Massey Ferguson, Duluth, GA, USA). Winter wheat was harvested in July while grain sorghum harvesting was done in October in each year of the study. Grain moisture content were determined using a DICKEY-john grain moisture tester (DICKEY-john Inc., Auburn, IL, USA), and yield of both wheat and grain sorghum adjusted to 13.5% moisture content [3].

2.6. Statistical Analysis

Data were subjected to ANOVA as a split-plot design using the PROC MIXED procedure of SAS ver. 9.4 [28]. The ANOVA for crop yield and soil water content was combined across years with crop rotation, tillage, and year as fixed effects and replications as random. Soil properties were analyzed with crop rotations, tillage, and soil sampling depth as fixed effects while replications and their interactions were considered random effects. The LSMEANS procedure of PROC MIXED along with adjusted Tukey was used for mean comparisons. Interactions and treatment effects were considered significant when F test p-values were ≤ 0.05.

3. Results

3.1. Precipitation

Precipitation amounts varied over the study period. The long-term (30 year) average precipitation at the experimental site was 580 mm which was less than the total annual rainfall received in the years of this evaluation (2017 and 2018). Total precipitation in March through June of 2017 was greater than the long-term average (Table 1). Notwithstanding, rainfall in July 2017 was only 39 mm, representing 46% of the long-term average rainfall. This short-term drought created water stress conditions for grain sorghum. The 2018 growing season was relatively wet with precipitation exceeding the long-term monthly average amounts except from February through April (Table 1). Typical of the CGP, year-year variation in precipitation had a significant impact on grain yield over the 2 year study.

3.2. Weed Counts, and Soil Water Content

Tillage × crop rotation interaction had a significant effect (p < 0.001) on weed counts. Averaged across the 2 years, weed counts were significantly less with RT and ST compared to soils under NT irrespective of crop rotation (Figure 1). In general, three-awn and tumble windmill grasses as well as HR kochia were the dominant weeds at the experimental site and densities were greater in the WSF systems compared to WF.
Soil water content at winter wheat planting was significantly (p = 0.001) affected by tillage × crop rotation interaction. The soil water stored with NT was similar to that of ST but both were greater than that measured with RT in crop rotations that had fallow (Figure 2a). However, with the WW system, tillage operations as either ST or RT decreased soil water content at winter wheat planting compared to NT (Figure 2a). Averaged across crop rotations, soil water content was 336 mm with NT or ST, and 306 mm with RT over the 2 years (Table 2). Similarly, the year × crop rotation interaction affected soil water content. In 2016, soil water content decreased with increasing cropping intensity, mostly due to increased crop water use. However, in 2017, soil water content at winter wheat planting was not different among the crop rotations (Figure 2b). Averaged across the 2 years and tillage treatments, soil water content with WF was 343 mm, which was greater than 330 mm for WSF or 307 mm for the WW system (Table 2).

3.3. Bulk Density and Aggregate Size Fractions

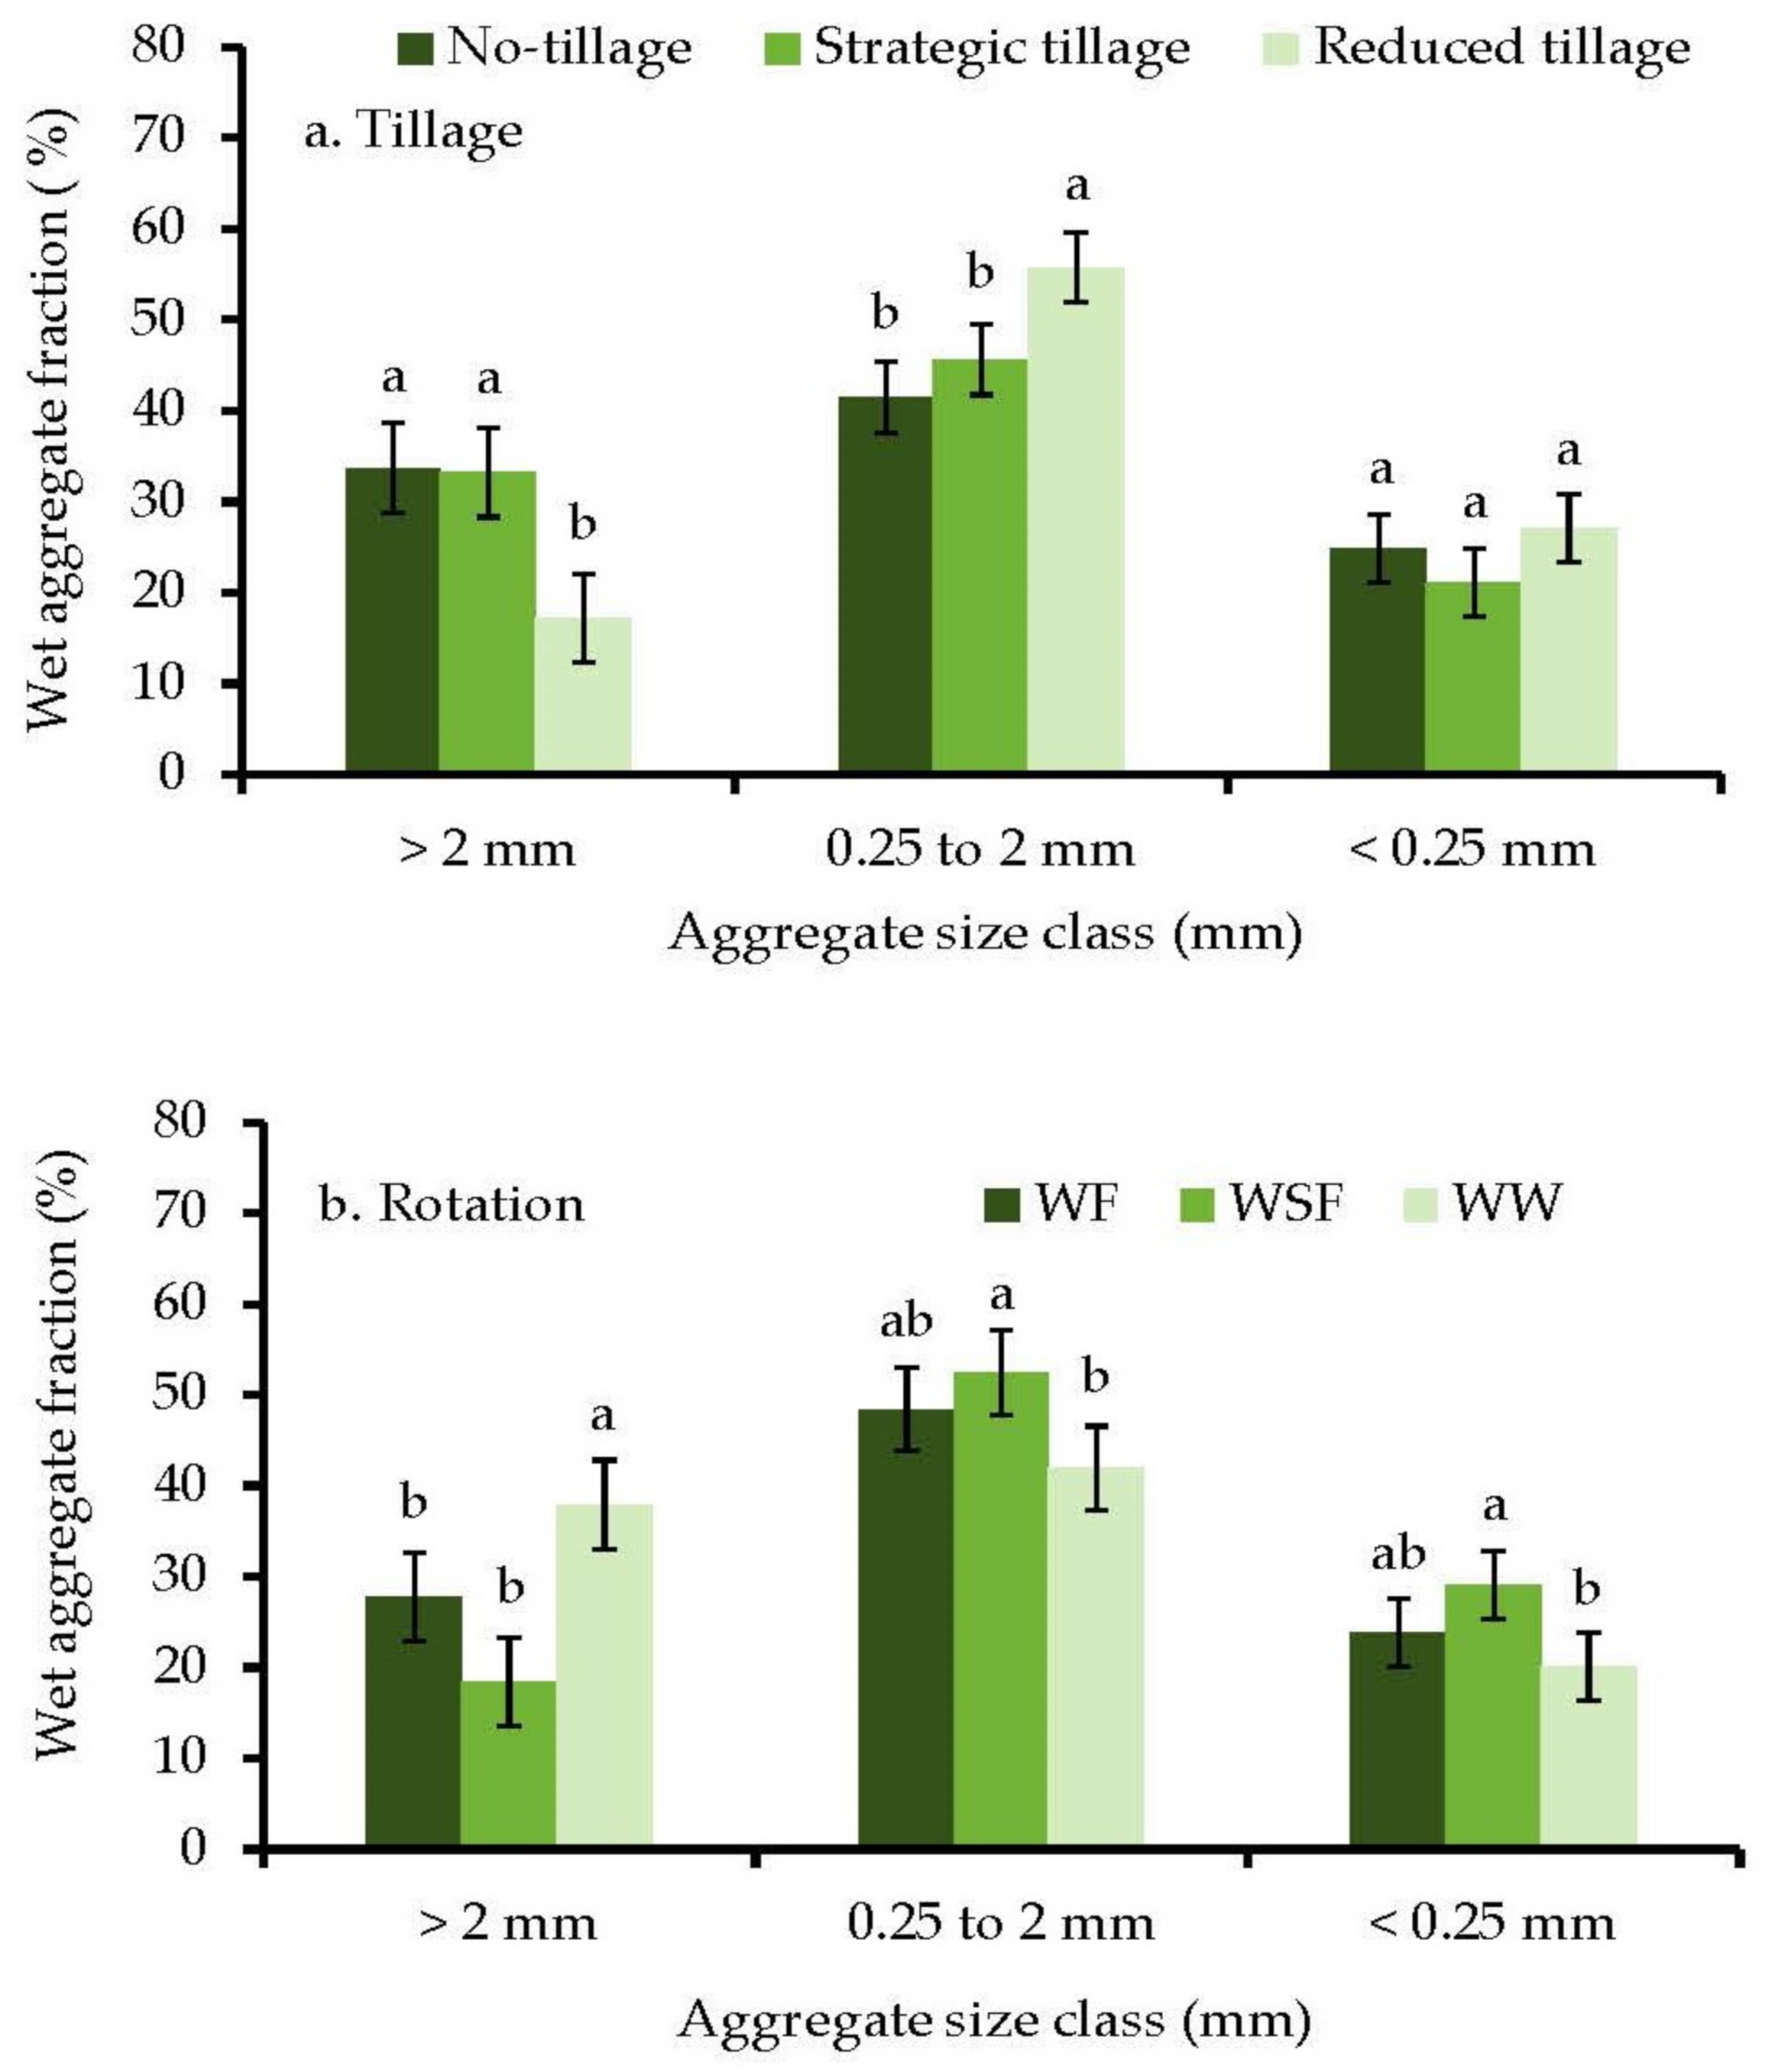
Soil bulk density in the 0 to 15 cm depth at about three months after tillage averaged 1.26 g cm−3 with NT and 1.19 g cm−3 with ST or RT (Table 2). Bulk density in the 0 to 15 cm depth was less for WW compared with WF or WSF. Bulk density in the 15 to 30 cm depth was unaffected by crop rotation or tillage (Table 2). The distribution of aggregate sizes in the 0 to 5 cm depth was similar for NT and ST but RT had relatively less macroaggregates of > 2 mm and more of aggregates < 0.25 mm compared with NT and ST (Figure 3a). The MWD of aggregates differed among tillage practices, and was 1.05 mm for NT, 1.06 mm for ST and 0.69 mm for RT (Table 2). Aggregates > 2 mm were greater and aggregates < 0.25 mm tended to be less in soils under WW compared to WF or WSF (Figure 3b). In general, the proportion in each aggregate size fraction was not different between WF and WSF crop rotations. The MWD differed among crop rotations and averaged 1.17 mm with WW, 0.93 for WF and 0.72 mm for WSF (Table 2).

3.4. Soil pH and Soil Organic Carbon

The mean soil pH in 2017 measured at 0 to 5 cm depth was 5.6 and was unaffected by tillage and the tillage × rotation interaction. Soil pH in the upper 0 to 5 cm was markedly lower than that measured at 5 to 15 cm or 15 to 30 cm, but the depth effect was greater with WW compared to WF or WSF accounting for the rotation ×sampling depth interaction (Table 3). The SOC concentration was significantly affected by rotation × sampling depth with 27% greater SOC in the 0 to 5 cm depth with WW compared to WF and WSF at the same depth (Table 3). Similarly, the tillage × sampling depth interaction was significant with 17% less SOC with RT compared to ST and NT (Table 4). The SOC concentrations below 5 cm depth were unaffected by tillage or crop rotation.

3.5. Nitrogen, Phosphorus and Potassium

Tillage × sampling depth interaction had an effect on NO3-N concentration measured at the soil surface (Table 4). Across rotations, NO3-N concentration in the 0 to 5 cm depth with ST was greater than NT or RT. The concentration of NO3-N was unaffected by tillage in either the 5 to 15 or 15 to 30 cm depths. Averaged across crop rotations, soil NH4-N in the 0 to 5 cm depth with ST or RT was less compared to NT (Table 4). Tillage had no effect on NH4-N concentration below the 5 cm depth. Soil P concentration was unaffected by tillage or crop rotation. Soil P concentration averaged 41 mg kg−1 in the 0 to 5 cm depth, which was greater than P concentrations of 16.7 mg kg−1 at the 5 to 15 cm or 15 to 30 cm (6.3 mg kg−1) depths. The Mehlich-3 K concentration in the 0 to 5 cm depth was less with ST compared to soils under RT accounting for the tillage × sampling depth interaction (Table 4). Averaged across tillage treatments, K concentration in the 0 to 15 cm was greater with WF compared to WSF or WW (Table 3). Crop rotation or tillage system had no effect on K concentration at 15 to 30 cm depth. There was a significant positive correlation between SOC and P or NO3-N concentration (Table 5).

3.6. Micronutrients: Fe, Cu, Mn, Zn

The concentration of Zn, Mn and Cu were unaffected by tillage. Across crop rotations and sampling depth, Fe concentration was less with RT compared with soils under NT or ST. The concentrations of Cu, Fe or Mn in the 0 to 15 cm were greater with WW compared with WF or WSF. Micronutrient concentrations were similar among the crop rotations in the 15 to 30 cm depth (Table 3).

3.7. Grain Yields

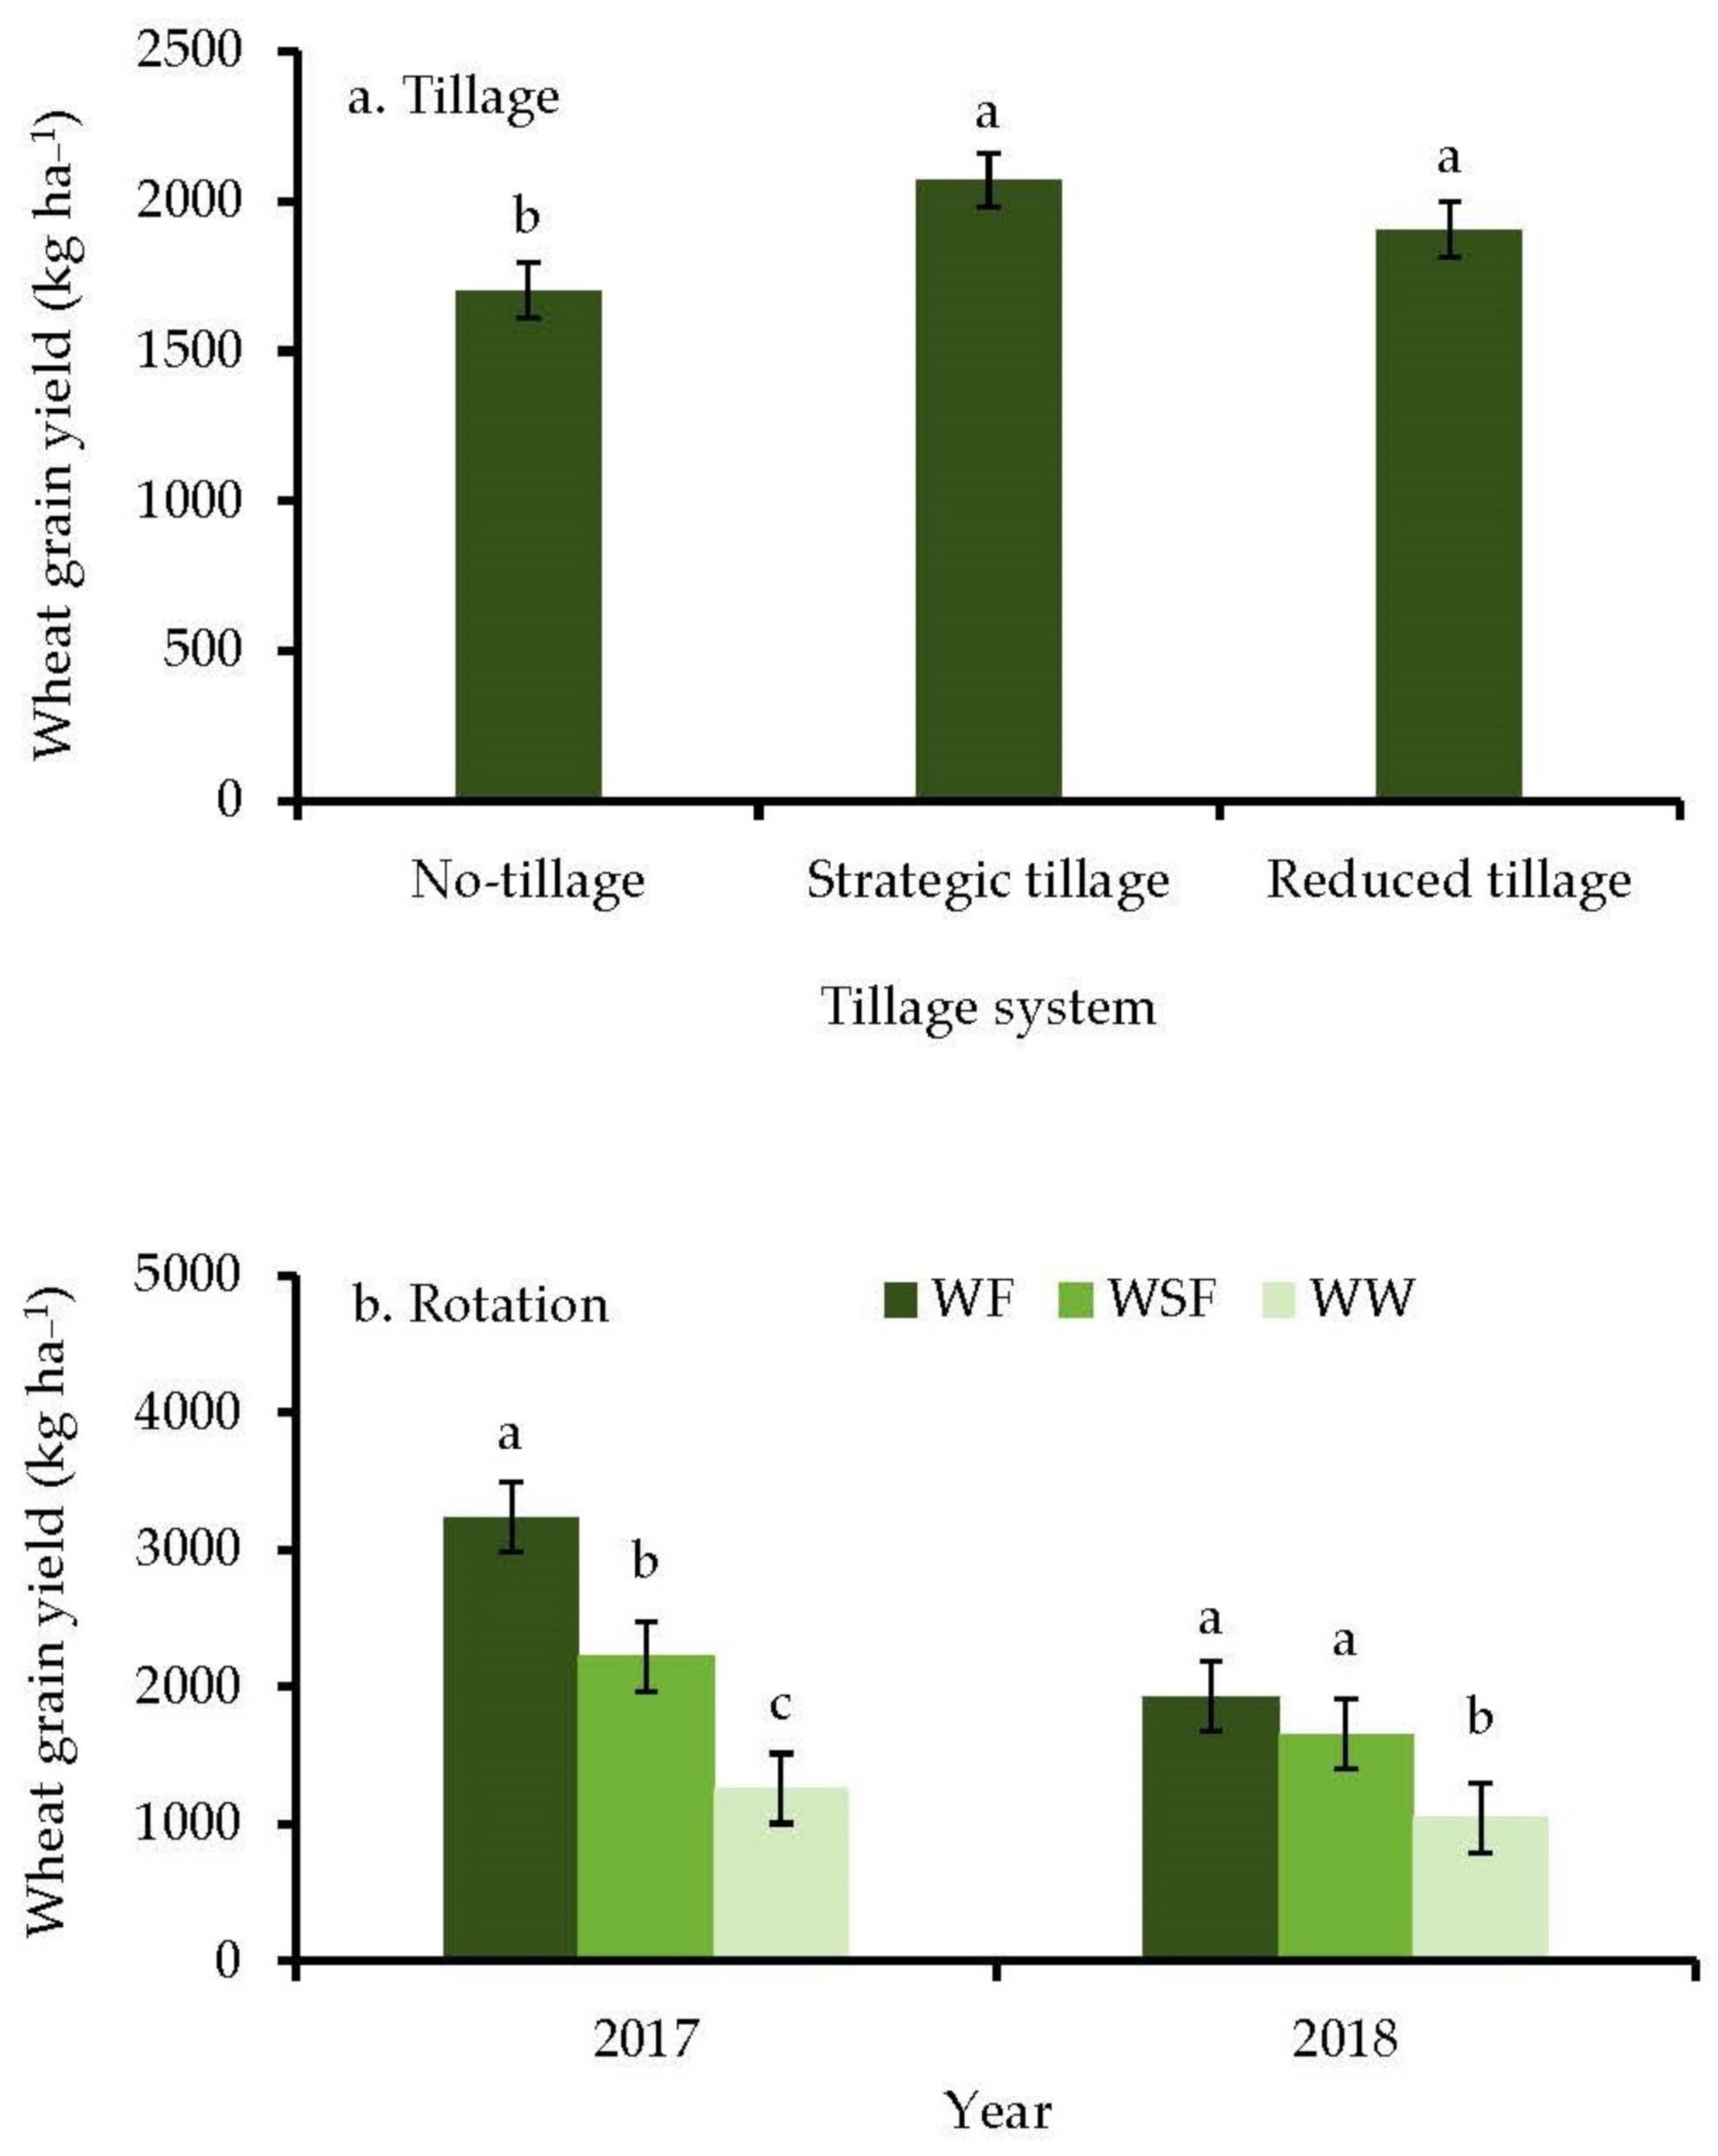
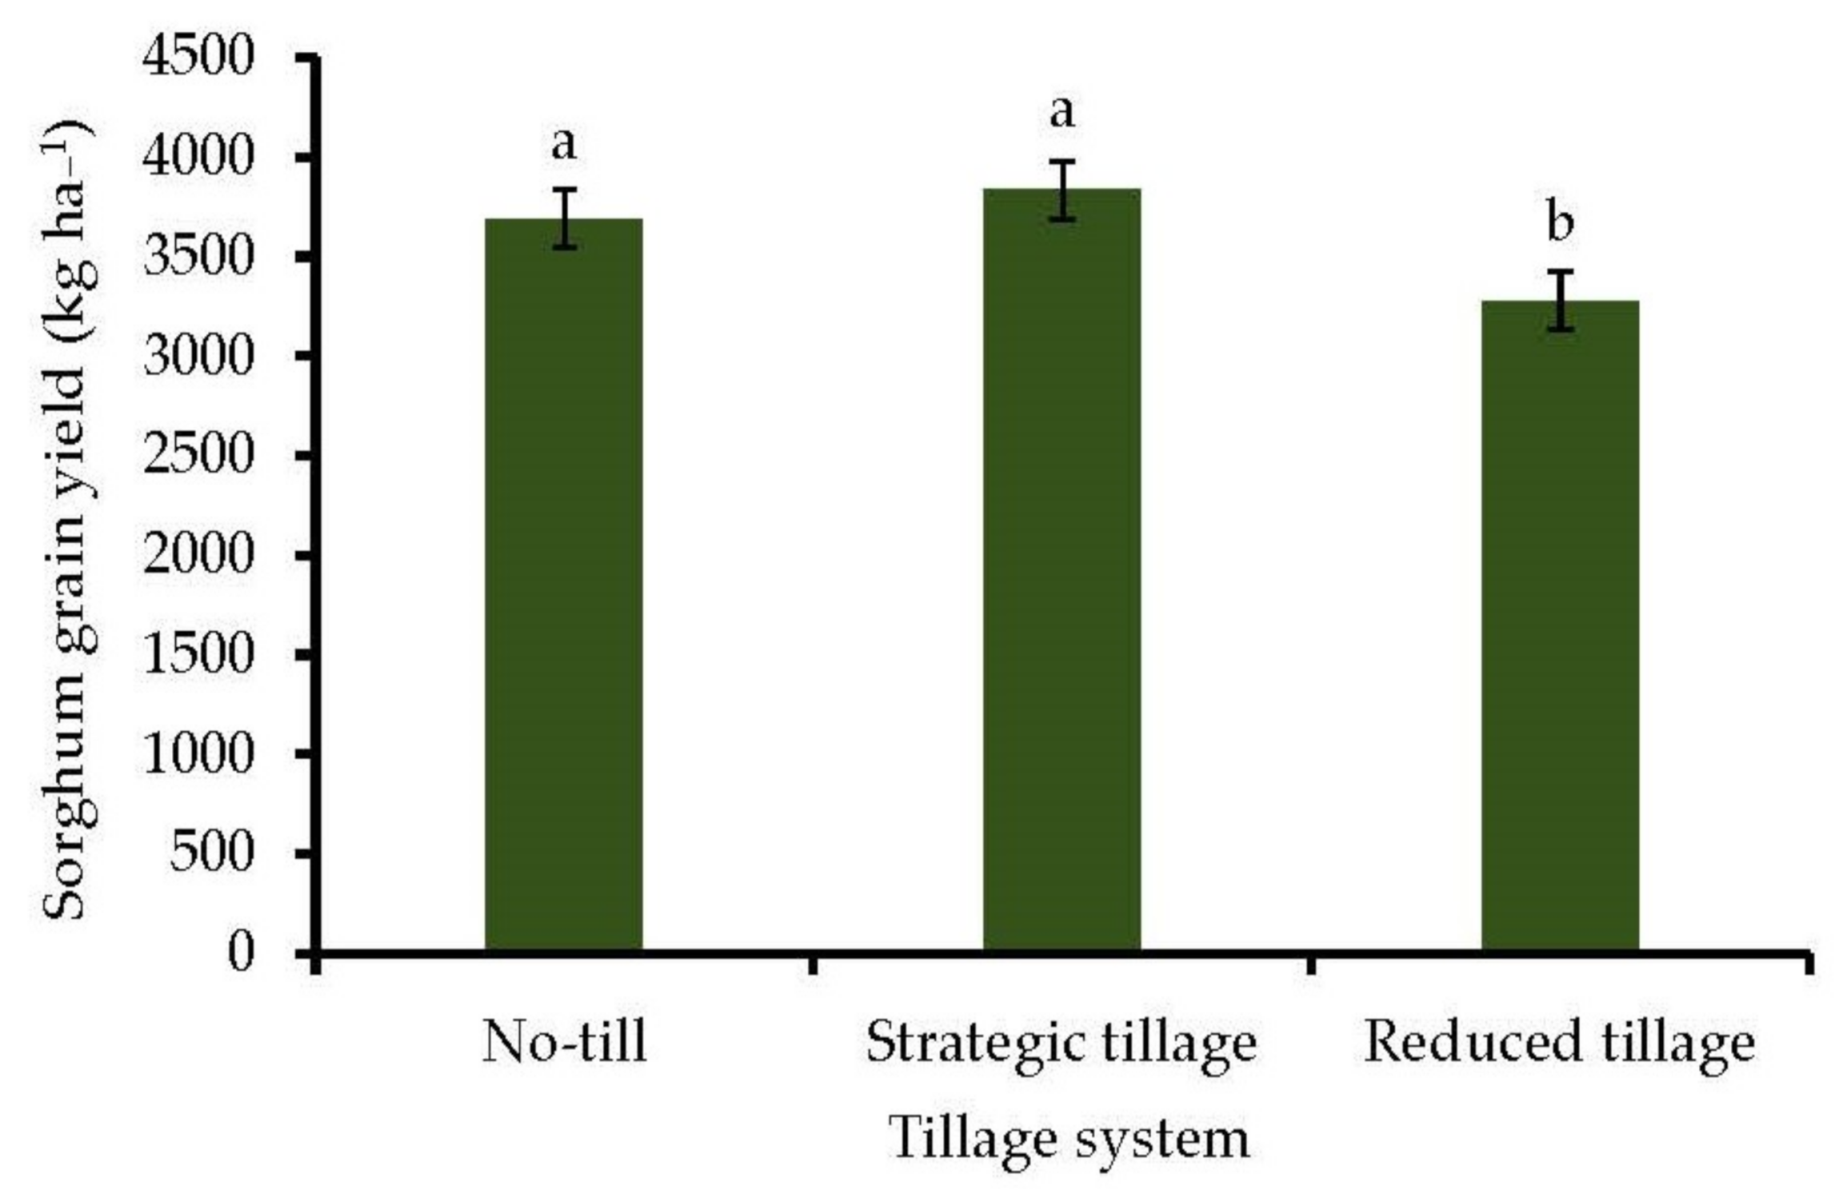
Winter wheat grain yield differed among tillage practices. Across the 2 year and crop rotations, yield with NT was 1702 kg ha−1, which was less than that obtained with ST or with RT (Figure 4a). The crop rotation × year interaction had an effect on winter wheat grain yield with greater rotation effects in 2017 than in 2018 (Figure 4b). Winter wheat grain yields decreased with increasing cropping intensity with WF > WSF > WW irrespective of year (Figure 4b). Mean sorghum grain yield in 2017 was 2941 kg ha−1 and 4525 kg ha−1 in 2018. Sorghum grain yield with ST and NT were not different, but both were greater than RT (Figure 5).

4. Discussion

4.1. Strategic Tillage Effects

Findings of this study confirm our hypothesis, suggesting occasional ST could be used to manage perennial grasses and HR kochia as well as three-awn and tumble windmill grass weeds that have developed because of long-term NT with little effects on crop yields or soil properties. In the present study, ST of long-term NT or RT resulted in significantly less weed density than NT. This is consistent with previous findings that reported decreases in weed population densities with one-time tillage of NT soils [7,11]. Three-awn and tumble windmill grasses had been a significant weed problem at the experimental site, and one-time ST with the sweep plow used in this study provided effective control. Notwithstanding, ST provided good soil-to-seed contact that increased the amount of volunteer wheat in the WW system. This required an herbicide application to control the volunteer wheat prior planting the next crop.
In the present study, soil water content at wheat planting three months following ST was similar to long-term NT in the WF and WSF rotations. This agrees with the findings of Crawford et al. [11], who reported soil water content measured 3-months after imposition of ST was not significantly different from that of NT in a study in Australia.
Still, NT had 4.4% more soil water stored than ST and 15.7% more than RT for soils under WW (Figure 2a). The different response to tillage among the crop rotations was due to differences in the length of the fallow period. The fallow period between crops in WF was 14 months compared to the 10 month fallow in WSF or 3 month fallow in WW. Tillage operations during fallow will reduce soil water content for the next crop, particularly in WW which has a short window for soil water recharge before planting of the next wheat crop. Therefore, potential for soil water loss with tillage operations would be WW >WSF > WF.
Our results also showed the potential for ST or RT to reduced soil bulk density within the top 0 to 15 cm of the soil compared to long-term NT. This was possibly because of the disturbance from tillage operations loosening the soil resulting in a short-term decrease in soil bulk density to the tilled depth. Other studies in dryland systems also reported decreased bulk density associated with tillage of long-term NT soils [7,10,11]. In Australia, Crawford et al. [11] reported a decrease in bulk density due to one-time ST in the top 10 cm depth compared with NT, consistent with results in the present study.
One-time ST had no effect on aggregate size distribution or MWD of aggregates. This agrees with others [10,13,29] who found single tillage of NT soils had no negative effect on aggregate stability. In contrast to our findings, ST with a moldboard plow decreased MWD of aggregates at the surface 0 to 10 cm soil depth compared to NT, while significantly increasing MWD measured at 10 to 20 cm or 20 to 30 cm depths [12]. This may have occurred because moldboard plowing turned over surface soil with greater SOC and stable aggregates into the subsoil resulting in the observed greater aggregate stability in this layer for the ST treatments compared to NT. Although not significant, we observed a nominal shift in the proportion of small macroaggregates (2 mm to 0.25 mm) with ST in the present study (Figure 3a). This suggests that increasing the frequency of ST could have negative impacts on aggregate stability similar to RT operations by reducing the proportion of larger macroaggregates in the soil. Previous studies in New South Wales, Australia, showed effects of a single ST operation on water stable aggregates ranged from 0 to 14% loss in the proportion of macroaggregates, and a recovery time of 1 to 2 year [29]. Therefore, we recommend ST croplands revert to NT until such time that grass and other HR weed infestations reduce crop productivity before implementing another tillage operation.
In the present study, tillage had no significant effect on soil pH. This was expected because, even though soil pH was vertically stratified, the ST tillage operations in this study caused little soil mixing and redistribution of soil from the subsoil which had relatively greater pH or basic cations to provide some buffering against pH changes. In contrast to previous studies that suggest tillage of any type in NT systems can decrease soil aggregation and increase SOC losses [15], implementing ST in the current study had no effect on SOC concentration (Table 4) or aggregate stability (Figure 3a). The SOC with NT measured in the soil surface was similar to ST, suggesting limited SOC loss occurred with ST. Crawford et al. [11] found one-time ST had no negative effect on SOC concentrations at 0 to 20 cm measured 3 or 12 months after tillage treatments across 5 sites in Australia. Similarly, Liu et al. [9] in Australia, and Baan et al. [10] in Canada, and Quincke et al. [13] and Wortmann et al. [14] in Nebraska, USA, reported SOC concentration was not affected by a single ST operation, consistent with our findings. The significantly greater concentration of SOC in the 0 to 5 cm depth observed with NT or ST compared to RT treatments was because of less soil disturbance and more residue retention with NT that resulted in greater accumulation of SOC near the surface of soils under NT or ST. Several studies in the semiarid Great Plains have reported gains in SOC in the upper surface of soils under NT but no difference among tillage systems for the subsurface [6,30]. This observation is partly due to low precipitation that reduces the amount of biomass production and residue return to the surface limiting SOC accretion to the upper 0 to 10 cm of the soil.
The tillage effect on NO3-N was only significant in the surface 0 to 15 cm and tended to be greater in soils under ST particularly in the top 0 to 5 cm. This observation was possibly due to greater mineralization of SOC following ST of the long-tern NT soil that had accumulated more SOC. This is supported by results of the correlation analysis that showed SOC was positively correlated with NO3-N concentration (Table 5). Expectedly, NH4-N concentration measured in the surface 0 to 5 cm was greatest with NT. This corresponded well with greater concentration of SOC in soils under NT. Soil K concentration at the surface was increased with RT, possibly because of turnover of soil K from the subsurface with annual tillage. The tillage effects on available P were not significant though the P concentration was greater in the surface 0 to 15 cm compared to the subsurface. This finding suggests one time ST operations with the sweep plow used in the present study was not effective to provide sufficient soil mixing to redistribute soil nutrients to prevent P stratification. Results in the present study showed tillage had no effect on Cu, Mn or Zn concentrations. However, ST or NT significantly increased soil Fe concentration compared to RT. The differences could be due to greater SOC concentration in soils under the NT or ST treatments. In the present study, there was a significant positive correlation between SOC and the concentrations of Fe, Mn or Zn (Table 5). This is consistent with previous studies that showed greater Fe concentrations in soils under NT were due to increases in SOM content associated with NT systems [6].
In the semiarid central Great Plains, wheat and sorghum yields are directly proportional to the amount of available soil water at planting as well as growing season precipitation [31,32]. Soil water content at wheat planting with NT was similar to ST but greater than with RT (Figure 2a). However, wheat yields over the 2 year with NT was 30% and 16% less than with ST and RT, respectively. This result of no negative effects of tillage treatments on wheat yield agrees with reports [18,33,34,35] that concluded tillage had minimal effect on wheat yield. In the present study, tumble windmill grass competed with wheat in the NT plots for water and nutrients, which caused yield reductions compared with ST or RT treatments that had less weed pressure (Figure 1). Similar to wheat, ST had no effect on sorghum grain yield though RT reduced sorghum yield compared to NT. Across the 2 year., sorghum yield was 13 and 17% greater with NT and ST, respectively, compared to RT (Figure 5).
This result is consistent with previous studies that concluded NT sorghum yields are greater than that from RT [34,36]. In the present study, soil water content with NT was greater compared to RT. Plants rely on stored profile water at planting when growing season precipitation is low. This was most evident in July of the 2017 growing season when dry conditions existed (Table 1) that caused greater water stress in the RT treatments and a subsequent reduction in grain yield. Overall, the results of no negative effect of ST on either wheat or sorghum yield is in agreement with previous reports [9,10,11,14,29] that concluded a single ST event of an otherwise NT system had little effect on crop yield.

4.2. Crop Rotation Effect

Findings of the present study showed cropping sequence had a significant impact on crop productivity and soil properties because of differences in soil water dynamics and amounts of residue returned to the soil. In general, soil water content at wheat planting was least in the more intensive WW cropping system (Figure 2a) that resulted in a corresponding decrease in wheat yield compared to WF or WSF (Figure 4b). The fallow period in WF or WSF stores soil water for the next wheat crop and, in this study, replacing fallow by continuous cropping caused yield depressions. This is consistent with other studies [37,38,39,40,41] that concluded wheat yields from intensified rotations are less than those that have a fallow period ahead of wheat to replenish soil water depletions. Notwithstanding, the continuous WW system had reduced soil bulk density as well as improved MWD and proportions of large macroaggregates near the soil surface (Figure 3a). Similarly, the concentrations of SOC increased in soils under WW compared to WF or WSF. This observation was because of the greater amount of residue inputs in the WW system that increased SOC accumulation. Others [42,43,44,45] have reported greater SOC concentration in surface soils of intensified crop rotations in the Great Plains as well.
In the present study, however, soil K concentration in the 0 to 15 cm of the soil decreased with increasing cropping intensification compared to WF (Table 3), and could possibly be explained by greater K removal from continuous cropping. Soil pH measured in the surface 0 to 5 cm was markedly less in soils under WW (Table 3), possibly because of more frequent annual application of urea-based N fertilizer to the WW plots. The nitrification of NH4+ to NO3 from fertilizer application releases H+ that lower the soil pH [46]. The DTPA extractable Cu, Fe and Mn concentrations were greater in soils under WW compared to WF or WSF. The differences were partly due to the decrease in soil pH which is known to cause significant increases in micronutrient availability [6]. There was a negative correlation between soil pH and concentrations of Fe, Mn or Zn (Table 5), hence WW which had lower pH will increase micronutrient availability. Soils under WW had greater SOC concentration, which may also increase micronutrient levels similar to that reported in previous studies [47,48].

5. Summary and Conclusions

Findings showed one-time ST was effective at controlling tumble windmill grass and HR kochia and had no negative impacts on soil water content at wheat planting. Strategic tillage decreased bulk density and had no effect on water stable aggregates. However, long-term RT negatively affected the proportion of large macroaggregates and MWD. Similarly, ST did not influence SOC and N concentrations compared to long-term NT. Soil P concentration was not different among the tillage treatments though RT had increased K concentration near the upper surface. The ST treatment did not affect wheat and sorghum yields though RT decreased sorghum yield compared to NT or ST. Wheat yields differed among the crop rotation systems with the least yield obtained in the more intensified rotation of WW. The SOC, MWD, and micronutrient availability were greatest with WW. However, continuous annual cropping caused a significant decline in pH and K concentration. Based on our results, ST could provide a mitigation option for HR weeds in NT crop production with little impact on crop yields and soil properties. However, additional research is needed to determine how frequently ST can be utilized without negative soil and crop yield impacts. Still, future agriculture production is projected to shift from conventional farming practices to more sustainable production systems that will increase food, fiber and livestock production with less impact on the environment. In these systems, weed management will likely involve integrated management programs that combines less tillage, less herbicide use and diversified crop rotations with nutrient dense alternative crops for human consumption.

Supplementary Materials

The following are available online at https://www.mdpi.com/article/10.3390/agronomy11040662/s1, Figure S1: Experimental layout of one replication with crop rotation and tillage systems randomized. Bolded letters within each crop rotation label indicate crop phases (wheat, sorghum, or fallow). Tillage operations (reduced tillage, strategic tillage or no-tillage) is indicated by different patterns, Figure S2: No-till (a, left) and strategic tillage (a, right) following tillage and fertilizer applications in fallow. A 1 m−2 quadrat (b) in the field to measure density of herbicide tolerant windmill grass and other annual weeds.

Author Contributions

Conceptualization, methodology and investigation, A.K.O. and J.D.H.; data curation; writing—original draft preparation, A.K.O. and L.M.S.; writing—review and editing; visualization; supervision, A.K.O., J.D.H., L.M.S. and A.J.S.; project administration, A.K.O.; funding acquisition, A.K.O., J.D.H. and A.J.S. All authors have read and agreed to the published version of the manuscript.

Funding

This research was funded by USDA National Institute of Food and Agriculture (Hatch project no. 1004296), and USDA-ARS Ogallala Aquifer grant program (Grant no. 58-3090-5-007).

Institutional Review Board Statement

Not applicable.

Informed Consent Statement

Not applicable.

Data Availability Statement

Data are available on request from the corresponding author.

Acknowledgments

This work was supported by the USDA National Institute of Food and Agriculture (Hatch project no. 1004296), and USDA-ARS Ogallala Aquifer grant program (Grant no. 58-3090-5-007). This is contribution number 20-067-J from the Kansas Agricultural Experiment Station.

Conflicts of Interest

The authors declare no conflict of interest.

References

  1. Triplett, G.B.; Dick, W.A. No-tillage crop production: A revolution in agriculture! Agron. J. 2008, 100, 153–165. [Google Scholar] [CrossRef]
  2. Hansen, N.C.; Allen, B.L.; Baumhardt, R.L.; Lyon, D.J. Research achievements and adoption of no-till, dryland cropping in the semi-arid U.S. Great Plains. Field Crops Res. 2012, 132, 196–203. [Google Scholar] [CrossRef] [Green Version]
  3. Baumhardt, R.L.; Schwartz, R.C.; Jones, O.R.; Scanlon, B.R.; Reedy, R.C.; Marek, G.W. Long-term conventional and no-tillage effects on field hydrology and yields of a dryland crop rotation. Soil Sci. Soc. Am. J. 2017, 81, 200–209. [Google Scholar] [CrossRef]
  4. Blanco-Canqui, H.; Ruis, S.J. No-tillage and soil physical environment. Geoderma 2018, 326, 164–200. [Google Scholar] [CrossRef]
  5. Dang, Y.P.; Moody, P.W.; Bell, M.J.; Seymour, N.P.; Dalal, R.C.; Freebairn, D.M.; Walker, S.R. Strategic tillage in no-till farming systems in Australia’s northern grains-growing regions: II. Implications for agronomy, soil and environment. Soil Tillage Res. 2015, 152, 115–123. [Google Scholar] [CrossRef]
  6. Obour, A.K.; Mikha, M.M.; Holman, J.D.; Stahlman, P.W. Changes in soil surface chemistry after fifty years of tillage and nitrogen fertilization. Geoderma 2017, 308, 46–53. [Google Scholar] [CrossRef]
  7. Kettler, T.A.; Lyon, D.J.; Doran, J.W.; Powers, W.L.; Stroup, W.W. Soil quality assessment after weed-control tillage in a wheat-fallow cropping system. Soil Sci. Soc. Am. J. 2000, 64, 339–346. [Google Scholar] [CrossRef] [Green Version]
  8. Dang, Y.P.; Seymour, N.P.; Walker, S.R.; Bell, M.J.; Freebairn, D.M. Strategic tillage in no-till farming systems in Australia’s northern grains-growing regions: I. Drivers and implementation. Soil Tillage Res. 2015, 152, 104–114. [Google Scholar] [CrossRef]
  9. Liu, H.; Crawford, M.; Carvalhais, L.C.; Dang, Y.P.; Dennis, P.G.; Schenk, P.M. Strategic tillage on a Grey Vertosol after fifteen years of no-till management had no short-term impact on soil properties and agronomic productivity. Geoderma 2016, 267, 146–155. [Google Scholar] [CrossRef]
  10. Baan, C.D.; Grevers, M.C.J.; Schoenau, J.J. Effects of a single cycle of tillage on long-term no-till prairie soils. Can. J. Soil Sci. 2009, 89, 521–530. [Google Scholar] [CrossRef]
  11. Crawford, M.; Rincon-Florez, V.; Balzer, A.; Dang, Y.P.; Carvalhais, L.C.; Liu, H.; Schenk, P.M. Changes in the soil quality attributes of continuous no-till farming systems following a strategic tillage. Soil Res. 2015, 53, 263–273. [Google Scholar] [CrossRef]
  12. Çelik, I.; Günal, H.; Acar, M.; Acir, N.; Barut, Z.B.; Budak, M. Strategic tillage may sustain the benefits of long-term no-till in a Vertisol under Mediterranean climate. Soil Tillage Res. 2019, 185, 17–28. [Google Scholar] [CrossRef]
  13. Quincke, J.A.; Wortmann, C.S.; Mamo, M.; Franti, T.; Drijber, R.A.; Garcia, J.P. One-time tillage of no-till systems: Soil physical properties, phosphorus runoff, and crop yield. Agron. J. 2007, 99, 1104–1110. [Google Scholar] [CrossRef]
  14. Wortmann, C.S.; Drijber, R.A.; Franti, T.G. One-time tillage of no-till cropland five years post-tillage. Agron. J. 2010, 102, 1302–1307. [Google Scholar] [CrossRef]
  15. Grandy, A.S.; Robertson, G.P.; Thelen, K.D. Do productivity and environmental trade-offs justify periodically cultivating no-till cropping systems? Agron. J. 2006, 98, 1377–1383. [Google Scholar] [CrossRef]
  16. Garcia, J.P.; Wortmann, C.S.; Mamo, M.; Drijber, R.; Tarkalson, D. One-time tillage of no-till: Effects on nutrients, mycorrhizae, and phosphorus uptake. Agron. J. 2007, 99, 1093–1103. [Google Scholar] [CrossRef]
  17. Kumar, V.; Obour, A.; Jha, P.; Liu, R.; Manuchehri, M.R.; Dille, J.A.; Holman, J.; Stahlman, P.W. Integrating cover crops for weed management in the semi-arid U.S. Great Plains: Opportunities and challenges. Weed Sci. 2020, 68, 311–323. [Google Scholar] [CrossRef]
  18. Thompson, C.A. Winter wheat and grain sorghum production as influenced by depth of soil water, tillage and cropping system. J. Soil Water Conserv. 2001, 56, 56–63. [Google Scholar]
  19. Obour, A.K.; Holman, J.D.; Dille, J.A.; Kumar, V.V. Effects of spring-planted cover crops on weed suppression and winter wheat grain yield in western Kansas. Kans. Agric. Exp. Stn. Res. Rep. 2019. [Google Scholar] [CrossRef] [Green Version]
  20. Grossman, R.B.; Reinsch, T.G. Bulk density and linear extensibility. In Methods of Soil Analysis; Part 4. SSSA Book Series 5; Dane, J.H., Topp, G.C., Eds.; SSSA: Madison, WI, USA, 2002; pp. 201–225. [Google Scholar]
  21. Nimmo, J.R.; Perkins, K.S. Aggregate stability and size distribution. In Methods of Soil Analysis; Part 4. SSSA Book Series 5; Dane, J.H., Topp, G.C., Eds.; SSSA: Madison, WI, USA, 2002; pp. 317–327. [Google Scholar]
  22. Leikam, D.F.; Lamond, R.E.; Mengel, D.B. Soil Test Interpretations and Fertilizer Recommendations. MF-2586. MF-2586. Kansas State University, Agric. Expt. Station and Coop. Ext. Serv. Manhattan, KS. 2003. Available online: http://www.ksre.k-state.edu/bookstore/pubs/mf2586.pdf (accessed on 10 September 2019).
  23. Thomas, G.W. Soil pH and soil acidity. In Methods of Soil Analysis Part 3: Chemical Methods; Sparks, D.L., Ed.; Soil Science Society of America: Madison, WI, USA, 1996; pp. 475–490. [Google Scholar]
  24. Mehlich, A. Mehlich 3 soil test extractant: A modification of the Mehlich 2 extractant. Commun. Soil Sci. Plant Anal. 1984, 15, 1409–1416. [Google Scholar] [CrossRef]
  25. Knudsen, D.; Peterson GAPratt, P.F. Lithium, sodium, and potassium. In Methods of Soil Analysis, Part 2, 2nd ed.; Page, A.L., Ed.; American Society of Agronomy: Madison, WI, USA, 1982; pp. 225–246. [Google Scholar]
  26. Lindsay, W.L.; Norvell, W.A. Development of a DTPA soil test for zinc, iron, manganese, and copper. Soil Sci. Soc. Am. J. 1978, 42, 421–428. [Google Scholar] [CrossRef]
  27. Nelson, D.W.; Sommers, L.E. Total carbon, organic carbon and organic matter. In Methods of Soil Analysis Part 3: Chemical Methods; Sparks, D.L., Ed.; Soil Science Society of America: Madison, WI, USA, 1996; pp. 961–1010. [Google Scholar]
  28. SAS Institute Inc. Statistical Analysis System; SAS Institute Inc.: Cary, NC, USA, 2016. [Google Scholar]
  29. Conyers, M.; van der Rijt, V.; Oates, A.; Poile, G.; Kirkegaard, J.; Kirkby, C. The strategic use of minimum tillage within conservation agriculture in southern New South Wales, Australia. Soil Tillage Res. 2019, 193, 17–26. [Google Scholar] [CrossRef]
  30. Mikha, M.M.; Vigil, M.F.; Benjamin, J.G. Long-term tillage impacts on soil aggregation and carbon dynamics under wheat-fallow in the central Great Plains. Soil Sci. Soc. Am. J. 2013, 77, 594–605. [Google Scholar] [CrossRef]
  31. Stone, L.R.; Schlegel, A.J. Yield-water supply relationships of grain sorghum and winter wheat. Agron. J. 2006, 98, 1359–1366. [Google Scholar] [CrossRef]
  32. Schlegel, A.J.; Assefa, Y.; Haag, L.A.; Thompson, C.R.; Holman, J.D.; Stone, L.R. Yield and soil water in three dryland wheat and grain sorghum rotations. Agron. J. 2017, 109, 227–238. [Google Scholar] [CrossRef] [Green Version]
  33. Vyn, T.J.; Sutton, J.C.; Raimbault, B.A. Crop sequence and tillage effects on winter wheat development and yield. Can. J. Plant Sci. 1991, 71, 669–676. [Google Scholar] [CrossRef] [Green Version]
  34. Schlegel, A.J.; Assefa, Y.; Haag, L.A.; Thompson, C.R.; Stone, L.R. Long-term tillage on yield and water use of grain sorghum and winter wheat. Agron. J. 2018, 110, 269–280. [Google Scholar] [CrossRef] [Green Version]
  35. Schlegel, A.J.; Dhuyvetter, K.C.; Thompson, C.R.; Havlin, J.L. Agronomic and economic impacts of tillage and rotation on wheat and sorghum. J. Prod. Agric. 1999, 12, 629–636. [Google Scholar] [CrossRef]
  36. Unger, P.W. Tillage effects on dryland wheat and sorghum production in the southern Great Plains. Agron. J. 1994, 86, 310–314. [Google Scholar] [CrossRef]
  37. Holman, J.; Arnet, K.; Dille, A.; Maxwell, S.; Obour, A.; Roberts, T.; Roozeboom, K.; Schlegel, A. Can cover (or forage) crops replace fallow in the semiarid Central Great Plains? Crop Sci. 2017, 58, 932–944. [Google Scholar] [CrossRef] [Green Version]
  38. Nielsen, D.C.; Vigil, M.F. Wheat yield and yield stability of eight dryland crop rotations. Agron. J. 2018, 110, 594–601. [Google Scholar] [CrossRef] [Green Version]
  39. Obour, A.K.; Chen, C.; Sintim, H.Y.; McVay, K.; Lamb, P.; Obeng, E.; Mohammed, Y.A.; Khan, Q.; Afshar, R.K.; Zheljazkov, V.D. Camelina sativa as a fallow replacement crop in wheat based crop production systems in the US Great Plains. Ind. Crops Prod. 2018, 111, 22–29. [Google Scholar] [CrossRef]
  40. Armstrong, R.D.; Perris, R.; Munn, M.; Dunsford, K.; Robertson, F.; Hollaway, G.J.; O’Leary, G.J. Effects of long-term rotation and tillage practice on grain yield and protein of wheat and soil fertility on a Vertosol in a medium-rainfall temperate environment. Crop Pasture Sci. 2019, 70, 1–15. [Google Scholar] [CrossRef]
  41. Schlegel, A.J.; Assefa, Y.; Haag, L.A.; Thompson, C.R.; Stone, L.R. Soil water and water use in long-term dryland crop rotations. Agron. J. 2019, 111, 2590–2599. [Google Scholar] [CrossRef] [Green Version]
  42. Bowman, R.A.; Vigil, M.F.; Nielsen, D.C.; Anderson, R.L. Soil organic matter changes in intensively cropped dryland systems. Soil Sci. Soc. Am. J. 1999, 63, 186–191. [Google Scholar] [CrossRef]
  43. Blanco-Canqui, H.; Holman, J.D.; Schlegel, A.J.; Tatarko, J.; Shaver, T.M. Replacing fallow with cover crops in a semiarid soil: Effects on soil properties. Soil Sci. Soc. Am. J. 2013, 77, 1026–1034. [Google Scholar] [CrossRef] [Green Version]
  44. Sherrod, L.A.; McMaster, G.S.; Delgado, J.A.; Schipanski, M.E.; Fonte, S.J.; Montenieri, R.L.; Larson, K. Soil carbon pools in dryland agroecosystems as affected by several years of drought. J. Environ. Qual. 2018, 47, 766–773. [Google Scholar] [CrossRef] [Green Version]
  45. Sherrod, L.A.; Peterson, G.A.; Westfall, D.G.; Ahuja, L.R. Soil organic carbon pools after 12 years in no-till dryland agroecosystems. Soil Sci. Soc. Am. J. 2005, 69, 1600–1608. [Google Scholar] [CrossRef] [Green Version]
  46. Barak, P.; Jobe, B.O.; Kreuger, A.R.; Peterson, L.A.; Laird, D.A. Effects of long-term soil acidification due to nitrogen fertilizer inputs in Wisconsin. Plant Soil 1997, 197, 61–69. [Google Scholar] [CrossRef]
  47. Aziz, I.; Mahmood, T.; Islam, K.R. Effect of long-term no-till and conventional tillage practices on soil quality. Soil Tillage Res. 2013, 131, 28–35. [Google Scholar] [CrossRef]
  48. Moreira, S.G.; Prochnow, L.I.; Kiehl, J.C.; Pauletti, V.; Martin-Neto, L. Chemical forms in soil and availability of manganese and zinc to soybean in soil under different tillage systems. Soil Tillage Res. 2016, 163, 41–53. [Google Scholar] [CrossRef]
Figure 1. Tillage and crop rotation effects on weed count one month after tillage in 2016 and 2017. Means followed by the same lower-case letter(s) within a crop rotation are not significantly different using the least squares means (LSMEANS) and adjusted Tukey multiple comparison procedure (p > 0.05). WF = Wheat-fallow; WSF = wheat-sorghum-fallow; WW = Wheat-wheat.
Agronomy 11 00662 g001
Figure 2. Soil water content at winter wheat planting as influenced by (a) tillage × crop rotation and (b) crop rotation at sowing time of wheat in 2016 and 2017. Means followed by the same lower-case letter(s) within crop rotation or year are not significantly different using the least squares means (LSMEANS) and adjusted Tukey multiple comparison procedure (p > 0.05). WF = Wheat-fallow; WSF = wheat-sorghum-fallow; WW = Wheat-wheat.
Agronomy 11 00662 g002
Figure 3. Soil aggregate size distribution as affected by (a) tillage and (b) crop rotation. Means followed by the same lower-case letter(s) within aggregate size classes are not significantly different using the least squares means (LSMEANS) and adjusted Tukey multiple comparison procedure (p > 0.05). WF = Wheat-fallow; WSF = wheat-sorghum-fallow; WW = Wheat-wheat.
Agronomy 11 00662 g003
Figure 4. Winter wheat grain yield averaged over 2017 and 2018 growing season at Hays, KS affected (a) tillage and (b) crop rotation system. Means followed by the same lower-case letter(s) within a crop rotation or year are not significantly different using the least squares means (LSMEANS) and adjusted Tukey multiple comparison procedure (p > 0.05). WF = Wheat-fallow; WSF = wheat-sorghum-fallow; WW = Wheat-wheat.
Agronomy 11 00662 g004
Figure 5. Grain sorghum yield as affected by tillage averaged over 2017 and 2018 growing seasons at Hays, KS. Means followed by the same lower-case letter (s) within are not significantly different using the least squares means (LSMEANS) and adjusted Tukey multiple comparison procedure (p > 0.05).
Agronomy 11 00662 g005
Table 1. Monthly precipitation amounts at Hays, KS from 2016 to 2018.
MonthPrecipitation
20162017201830-Year Average
mm
January17321111
February183419
March14382032
April1901991954
May7711612382
June879710088
July883919585
August967813575
September53559857
October175017137
November3062122
December1515818
Total702714955580
Table 2. Soil bulk density in the 0 to 15 and 15 to 30 cm depth, mean weight diameter (MWD) of soil aggregates from the 0 to 5 cm depth and soil water content from the 0 to 150 cm depth at wheat planting as affected by tillage and crop rotation system.
0 to 15 cm15 to 30 cmMWDSoil Water Storage (mm)
Tillage SystemBulk Density (g cm−3)mm201620172-Year Avg.
NT §1.26 ± 0.10 a 1.19 ± 0.09 a1.05 ± 0.4 a340 ± 27 a332 ± 18 a336 ± 23 a
ST1.19 ± 0.09 b1.19 ± 0.09 a1.06 ± 0.6 a345 ± 25 a328 ± 16 a336 ± 22 a
RT1.19 ± 0.11 b1.18 ± 0.06 a0.69 ± 0.2 b310 ± 38 b306 ± 19 a308 ± 29 b
Crop RotationBulk Density (g cm−3)MWDSoil Water Storage (mm)
WF1.22 ± 0.12 ab1.21 ± 0.07 a0.93 ± 0.5 b358 ± 15 a328 ± 10 a343 ± 20 a
WSF1.25 ± 0.08 a1.17 ± 0.11 a0.72 ± 0.3 b337 ± 22 a323 ± 18 ab330 ± 21 a
WW1.17 ± 0.09 b1.18 ± 0.05 a1.17 ± 0.4 a300 ± 32 b315 ± 29 b307 ± 30 b
‡ Means followed by the same letter (s) within columns are not significantly different using the least squares means (LSMEANS) and adjusted Tukey multiple comparison procedure (p > 0.05). Means are followed by ± one standard deviation from the mean. § NT = no-tillage, ST = Strategic tillage; RT = reduced tillage; WF = Wheat-fallow; WSF = wheat-sorghum-fallow; WW = Wheat-wheat.
Table 3. Soil organic carbon, pH, potassium, iron, manganese, and copper concentrations as affected by crop rotation and soil sampling depth.
Rotation0–5 cm5–15 cm15–30 cm0–5 cm5–15 cm15-30 cm0–5 cm5–15 cm15–30 cm
Soil pHSoil organic carbonPotassium
g kg−1mg kg−1
WF §5.71 ± 0.20 a 6.17 ± 0.12 ab6.89 ± 0.10 a13.6 ± 0.8 b11.4 ± 0.6 a8.9 ± 0.8 a558 ± 40 a559 ± 28 a544 ± 36 a
WSF5.87 ± 0.22 a6.29 ± 0.18 a6.86 ± 0.10 a13.7 ± 1.6 b11.2 ± 0.5 a9.2 ± 0.5 a539 ± 43 ab511 ± 28 b523 ± 21 a
WW5.27 ± 0.22 b6.06 ± 0.44 b6.99 ± 0.21 a17.4 ± 5.1 a12.2 ± 1.9 a10.0 ± 1.2 a516 ± 46 b528 ± 26 b544 ± 30 a
IronManganeseCopper
mg kg−1
WF53.3 ± 7.1 b39.1 ± 7.5 b22.3 ± 1.5 a27.2 ± 4.1 b20.9 ± 2.6 ab11.7 ± 1.9 a1.5 ± 0.06 b1.4 ± 0.13 a1.2 ± 0.06 a
WSF46.8 ± 6.9 b34.6 ± 5.3 b22.2 ± 3.0 a25.8 ± 4.4 b20.1 ± 2.8 b12.0 ± 1.6 a1.5 ± 0.11 b1.4 ± 0.13 a1.3 ± 0.07 a
WW77.3 ± 11.3 a45.7 ± 14.6 a22.2 ± 3.4 a42.6 ± 6.8 a24.6 ± 9.7 a11.5 ± 3.1 a1.6 ± 0.11 a1.4 ± 0.18 a1.2 ± 0.07 a
‡ Means followed by the same letter (s) within columns are not significantly different using the least squares means (LSMEANS) and adjusted Tukey multiple comparison procedure (p > 0.05). Data for each depth are averaged across three tillage treatments and three replications (n = 9), followed by ± one standard deviation from the mean. § WF = Wheat-fallow; WSF = wheat-sorghum-fallow; WW = Wheat-wheat.
Table 4. Soil organic carbon, nitrogen (N), and potassium concentrations as affected by tillage operation and soil sampling depth.
Tillage0–55–1515–300–55–1515–300–55–1515–300–55–1515–30
cm
Soil Organic CarbonNitrate-NAmmonium-NPotassium
g kg−1mg kg−1
NT §16.7 ± 4.9 a 11.8 ± 0.9 a9.2 ± 0.8 a33.2 ± 9.4 ab16.3 ± 6.8 a7.6 ± 2.2 a13.2 ± 6.9 a3.3 ± 1.6 a2.6 ± 0.7 a516 ± 29 b538 ± 40 a543 ± 34 a
ST15.1 ± 2.8 a12.0 ± 1.7 a9.9 ± 0.9 a37.4 ± 9.4 a16.9 ± 6.4 a9.9 ± 2.9 a8.3 ± 4.3 b3.2 ± 1.9 a2.6 ± 0.6 a515 ± 27 b517 ± 27 a535 ± 31 a
RT13.2 ± 1.1 b11.0 ± 0.6 a9.1 ± 1.1 a30.7 ± 6.9 b15.8 ± 3.1 a11.2 ± 1.1 a4.4 ± 1.6 c2.7 ± 0.7 a2.5 ± 0.8 a582 ± 39 a543 ± 28 a535 ± 25 a
‡ Means followed by the same lower-case letter(s) within columns are not significantly different using the least squares means (LSMEANS) and adjusted Tukey multiple comparison procedure (p > 0.05). Data for each depth are averaged across three crop rotations and three replicates (n = 9), followed by ± one standard deviation from the mean. § NT = No-tillage; ST = Strategic tillage; RT = Reduced tillage.
Table 5. Correlation coefficients of soil organic carbon (SOC), pH, nitrate, phosphorus (P), Potassium (K), iron (Fe), zinc (Zn) and manganese (Mn) concentrations measured three months after tillage operations.
ParameterSOCpHNO3-NPKZnFe
pH−0.71 ***
NO30.62 ***−0.69 ***
P0.73 ***−0.76 ***0.83 ***
K−0.17−0.030.050.09
Zn0.53 ***−0.54 ***0.53 ***0.63 ***0.11
Fe0.79 ***−0.89 ***0.61 ***0.76 ***−0.080.55 ***
Mn0.76 ***−0.92 ***0.53 ***0.66 ***−0.070.46 ***0.90 ***
*** p ≤ 0.001.
Publisher’s Note: MDPI stays neutral with regard to jurisdictional claims in published maps and institutional affiliations.