Article

Management to Promote Flowering Understoreys Benefits Natural Enemy Diversity, Aphid Suppression and Income in an Agroforestry System

1
School of Agriculture, Policy and Development, University of Reading, Reading RG6 6EU, UK
2
Centre for Environmental and Climate Science, Lund University, 223 62 Lund, Sweden
3
MV Agroecological Research Centre, 7750-217 Espirito Santo, Mértola, Portugal
4
Organic Research Centre, Cirencester GL7 6JN, UK
*
Author to whom correspondence should be addressed.
Agronomy 2021, 11(4), 651; https://doi.org/10.3390/agronomy11040651
Submission received: 26 February 2021 / Revised: 24 March 2021 / Accepted: 25 March 2021 / Published: 29 March 2021
(This article belongs to the Special Issue Alley Cropping—Agroforestry Systems)

Abstract

:
Agroforestry systems, where productive trees are integrated into agricultural land, can deliver benefits to biodiversity, natural pest control, and pollination, but the effects are highly variable. Recent advances in our understanding of flower strips in agricultural systems suggest that the management of the tree row understorey could be an important contributor to this variation. Here, we compare two cutting regimes for an understorey, originally seeded with the same flower mix, in the tree rows of an apple-arable agroforestry system: (i) uncut vegetation to promote a flowering understorey, and (ii) regularly mown vegetation. We recorded the effects of management on invertebrate pests, natural enemies, and pollinators, in both the apple and arable components. Apple trees above flowering understoreys supported significantly: (i) more natural enemies early in the season, (ii) fewer aphid colonies, (iii) fewer aphid-damaged fruits, and (iv) higher pollinator visitation, compared with those above mown understoreys. In the arable crop alleys, both the taxonomic richness and Shannon diversity of ground-based natural enemies were significantly higher adjacent to flowering understoreys, compared with those adjacent to mown understoreys, early in the season. Financial modelling based on aphid damage to apples, mowing costs, and income from Countryside Stewardship grants, indicated that flowering understoreys increased farm income by GBP 231.02 per ha of agroforestry compared with mown understoreys. Our results provide the first empirical evidence that management to promote flowering understoreys in agroforestry systems can be a win-win option to improve invertebrate diversity, associated ecosystem services, and farm income.

1. Introduction

The intensification of agricultural production, including habitat loss and the increased use of inputs such as pesticides, has been identified as a major cause of the global decline in invertebrate diversity [1,2]. This loss of diversity can lead to a reduction in associated regulating ecosystem services, such as the natural regulation of agricultural pests through natural enemy (predator and parasitoid) activity, and insect pollination of agricultural crops [3,4,5]. This in turn can increase reliance on artificial inputs to maintain and improve food production in ways widely deemed to be environmentally damaging and unsustainable [6,7]. Sustainable intensification aims to reduce agriculture’s dependence on external inputs by restoring natural processes and ecosystem services in tandem with improving agricultural productivity, for example, by integrating habitats for naturally occurring pollinators and natural enemies within agricultural fields or landscapes [8,9]. One such form of sustainable intensification is agroforestry, which is loosely defined as the deliberate incorporation of productive trees into livestock or arable farming systems [10].
Agroforestry systems in arable settings (termed silvoarable systems) typically comprise an alley-cropping configuration in temperate regions, where single rows of trees are separated by alleys of combinable crops, usually between 12 and 50 m in width to allow for access by modern arable farm machinery. The integration of trees into arable fields can increase biodiversity and regulating ecosystem services, relative to monocultures [11,12,13]. In a meta-analysis of European agroforestry systems, Torralba et al. [11] showed that overall biodiversity in all types of agroforestry systems was significantly higher than in monocultures of either agriculture or forestry, but was not significant for silvoarable systems. Furthermore, this positive effect in all agroforestry systems was not statistically significant for insect diversity. While other recent meta-analyses report that agroforestry systems decrease pest abundance and increase abundances of both pollinators and the natural enemies of pests, some individual studies find the opposite effect [14,15]. As such, there is a need to improve our mechanistic understanding of the effects of agroforestry systems on functional biodiversity [14,16].
Ecological research on agroforestry systems has traditionally focussed on the biodiversity benefits of trees as providers of food sources, such as flowers, fruits, and organic matter, in addition to indirect benefits such as alternative prey/hosts and favourable microclimates for both soil and arboreal insects [12,17]. In-field plant diversification is known to provide benefits to pollinators and predators of pests [18]; therefore, management of the understorey beneath the trees that would promote plant diversity could contribute to invertebrate diversity by providing ground-level cover for overwintering, and additional food sources such as pollen and nectar [14,19]. Recent research has demonstrated that incorporating flower strips into agricultural systems can benefit pollinators, natural enemies, and pest control services, although proximity to flower strip and age are important factors for pollinators [20,21,22,23]. The incorporation of flower strips into tree row understoreys in silvoarable systems could provide even greater benefits, because the density of tree rows is typically higher than for flower strips which are usually restricted to field margins [24].
Two previous studies have investigated the impact of understorey management on invertebrate natural enemies and/or pests in temperate silvoarable systems, by comparing vegetated understoreys with chemically weeded controls. In a study of three invertebrate taxa across three UK silvoarable systems, higher numbers of spiders and fewer slugs were captured in arable alleys adjacent to understoreys sown with a grass-clover mix than unvegetated understoreys, while the responses of carabid beetles varied according to species and site [25]. In a subsequent study in a silvoarable system in France, understoreys sown with a flower mix had no observable effect on grain aphid colonies or their natural enemies in the adjacent crop, although the flower mix did not establish as intended [26]. However, there remains a lack of evidence for the effects of these various understorey management options on both biodiversity and, of more relevance to farmers, financial outputs [27]. While flower mixes with infrequent cutting are often favoured by agroforestry farmers in the UK, on the presumption that this could provide habitat for beneficial insects in both the fruit and arable crops [28], intensive management of the understorey through regular mowing or chemical weeding has been recommended in alley-cropped silvoarable systems to restrict the spread of arable weeds [29].
Silvoarable systems with apple trees offer an ideal experimental system with which to evaluate the combined biodiversity and financial costs and benefits of understorey management. Apple trees are becoming a popular choice in new silvoarable systems particularly in the UK, and are suitable and viable options elsewhere in temperate regions [30], because of their potential to provide a quicker return on investment than timber, and limited shade impacts on the arable crop [28]. Apples are also highly dependent on insect pollination [31] and are susceptible to insect pest damage in the absence of pesticide application [32]. In these silvoarable systems, it is common that a mixture of commercial and heritage apple varieties is grown, which are targeted at local specialised markets. For example, at the farm on which we conducted the current study, the apples are sold as a premium heritage juice product directly to the local public, which avoids any requirement to meet fruit appearance criteria that apply to eating and cooking apple markets.
In this study, we sought to advance and broaden previous research of understorey management in agroforestry systems by considering management effects on invertebrate diversity, functional groups, resultant ecosystem service provision, and the financial costs and benefits, in both the tree and arable components of an apple-arable agroforestry system. We compare understoreys originally sown with the same flower mix but subject to two different cutting regimes, comprising management to promote flowering understoreys and frequently mown understoreys. We chose this approach rather than testing chemically weeded understoreys, because farmers typically value the environmental benefits of agroforestry systems and thus cutting is a more likely option in practice [33,34]. Specifically, our aims were to compare the effects of understorey management on (i) invertebrate pests, natural enemies, and pollinators in apple trees, in addition to fruit pest damage and pollination, and (ii) invertebrate diversity, pests, natural enemies, and yield, in the arable component. We also investigated seasonal patterns, where relevant. Finally, we aimed to predict the financial implications of understorey management, incorporating statistically significant findings of ecosystem service provision.

2. Materials and Methods

2.1. Study Site

The study site comprised a silvoarable agroforestry system in Nottinghamshire, UK (0°54′38″ W, 52°59′19″ N). We selected the site because it: (i) is a working farm and therefore reflects real-world conditions, (ii) has established trees (planted in early 2014), (iii) is flexible in terms of management requirements and environmental stewardship agreements which allowed for the understorey to be experimentally manipulated, and (iv) contains distinct single species/variety tree blocks so that species/variety could be controlled within the experimental design. This silvoarable system occupied a 5.6 ha field. The trees were mostly apples Malus domestica on semi-dwarfing rootstocks arranged in single rows, each tree separated by 3 m within the rows, with a 3 m wide understorey. The apple trees are pruned annually but fruits were not thinned during the study year. The tree rows were seeded with a wildflower mix in 2014, which established well. The most frequent species comprised Festuca rubra, Holcus lanatus, Deschampsia cespitosa, Leucanthemum vulgare, Picris echioides, Prunella vulgaris and Lotus corniculatus (see Table S1 for plant species list). Prior to this study, the understorey was subject to infrequent mowing to promote flowering, typically comprising two late-season cuts. The arable alleys between the tree rows were 24 m wide, sown with barley during spring of the study year (2020). Other crops in the rotation included winter wheat (2019 harvest) and oilseed rape (2018 harvest). The soil texture is defined as a ‘slightly acid loamy and clayey soil with impeded drainage’ [35]. The farm follows the principles of Integrated Farm Management, practising conservation tillage, minimising pesticide use in the arable component, and avoiding pesticide application to the apple trees.

2.2. Experimental Design

Five experimental treatment blocks were selected within the site, each block containing one apple tree variety (Lord Derby, Spartan, King of the Pippins, Bramley’s Seedling, D’Arcy Spice). The blocks were distributed across four tree rows, with each block occupying part of a single tree row (Figure 1). Therefore, two blocks were located in the same tree row, however they were separated by 60 m. The location and lengths of experimental blocks were constrained by the locations and extent of each apple variety, hence it was necessary to include some blocks near the field edges. This potential bias was accounted for by alternating the arrangement of management treatments, and by testing distance from boundary as a fixed effect in the statistical models (described below).
Each block was between 42 and 60 m long by 3 m wide (the width of the tree row), the length of which was equally divided into two management treatments, comprising unmown vegetation to promote flowering (‘flowering understoreys’), and a frequently mown treatment to suppress flowering (‘mown understoreys’) (Figure 1 and Figure 2). The two treatments contained similar plant communities, having been sown with the same mix in 2014. In the mown understoreys, vegetation was cut as short as possible using a petrol strimmer initially in November 2019 and then approximately once per month over five occasions in spring/summer 2020, commencing on 24th April (Table S2. Cutting was undertaken immediately after sampling visits, to minimise any effects of disturbance on capture rates. The outer thirds of the flowering understoreys (and sections outside of the experimental areas) were cut once during the winter of 2019/2020 as part of standard farm operations, but were not cut during the 2020 growing season.

2.3. Sampling Techniques

A variety of sampling techniques were used to address the objectives of the study (Table 1 and Table S2). Each sampling technique was replicated four times within each treatment per block (Figure 3), except arable yield samples which were replicated twice within each treatment block. This led to a total of 40 samples for each sampling technique (except arable yield), for each visit (4 sample locations × 2 treatments × 5 blocks). Pitfall traps, sticky traps, and grain samples were sited 0.5 m into the adjacent crop alley, to sample the effect of the understorey treatment on the adjacent crop and its invertebrate community. This distance was selected to minimise interference from other understorey treatments. Previous data from this site and two other sites showed limited spatial effects of diversity and richness metrics across alleys [36], therefore samples at this distance can be expected to be broadly representative of the arable alley. No pitfall traps were installed within the tree rows because vegetation structure can bias capture rates [37] and the ground-based invertebrate community is more relevant to the arable cropping area. Invertebrate specimens captured using pitfall traps and sticky traps were stored in a freezer and identified using an optical microscope. The taxonomic resolution selected for each taxon was that which was sufficient to establish functional group (see Table S3).

2.4. Analysis

All analysis was undertaken using R version 3.5.2 [42], with the packages lme4 [43] and MASS [44] used for model building. Prior to model building, the distribution of the response variable versus each fixed effect was visually inspected. Linear mixed models were used for data conforming to a normal distribution. Where the data were positively skewed, Poisson generalized linear mixed models (GLMMs) were initially applied. The residuals of the Poisson GLMMs were then inspected for heteroscedasticity, and negative binomial GLMMs fitted if necessary. Binomial GLMMs were used for proportion data, including apple pest damage and apple seed counts, fitted with an observation-level random effect to account for overdispersion. The significance of fixed effects was tested using the package ‘lmerTest’ [45].
Each response variable was visually explored for seasonal patterns in the data. Broadly, one of two types of model was then fitted (Table 2). The first model type was applied to response variables with possible seasonal effects, and aimed to assess understorey treatment effects over the season. The model therefore included a fixed interaction effect between understorey treatment and sampling visit, with the main effect for treatment removed. This approach allowed the effect of understorey treatment to be tested separately for each sampling visit. Sample block was included as a random effect. The second model type aimed to assess overall understorey treatment effects, where seasonal patterns were not apparent in the data. In this case understorey treatment was the single fixed effect, with two random effects comprising sample block and visit (where more than one visit was made). To account for potential effects arising from distance from field boundary, this was included as a fixed effect in GLMMs for invertebrate community or abundance response variables, where it was a statistically significant variable (p-value < 0.05), as shown in Table 2.
Taxonomic richness and Shannon diversity were calculated separately for pitfall traps and sticky traps using the most precise resolution in the dataset, including taxa at lower resolutions (e.g., family), in the R package ‘vegan’ [46]. For the arable pest models, the data were subset to only include the sample method with the greatest capture rate for the response taxon, while sample visits with very low capture rates for the response taxon were excluded from the analysis if necessary to improve model fit.
The effect of understorey treatment on the natural enemy community was investigated using partial redundancy analysis (pRDA) in the ‘vegan’ package [46]. Natural enemy taxa were the response variables, understorey treatment and distance from field boundary were explanatory variables, and sampling block and visit were ‘partialled out’ covariables. Response variables were chord-transformed to account for the high proportion of zeros [47]. Statistical significance was tested using the ‘anova.cca’ function in the ‘vegan’ package, using 9999 permutations. Effects on natural enemy traits were also investigated according to the same method, using an existing trait database [36], but the results were not close to significance (p-value > 0.1) and are not presented. Similarly, the diversity of functional effect traits was investigated based on the approach in Greenop et al. [48] and adapted in Staton et al. [36], but the results were not close to significance (p-value > 0.1) and are not presented.
Finally, we evaluated the financial implications of differing aphid damage to apple fruits (in the form of stunted fruit growth), mowing costs, and grant payments between understorey management treatments. Fruits were visually inspected for other damage including from other pests, moulds and diseases (see Table S2 for methodology), but the damage incurred did not significantly differ between management treatments (as set out in the Results) and they were therefore not included in the financial calculations, aside of omitting damaged apples from the alternative eating/cooking pricing scenario at Text S1. The income difference (ID, Equation (1)) between flowering and mown understoreys was calculated as (i) the mean cost of aphid damage (CAD) to apples in mown understoreys minus the mean cost of aphid damage in flowering understoreys, plus (ii) the reduction in the cost of mowing (CM), assuming mown understoreys were cut five times per year and flowering understoreys once, with each cut costing GBP 2.70 per ha of agroforestry (assuming tree rows occupy 10% of the field) [49], plus (iii) Countryside Stewardship AB8 grants (G) of GBP 53.90 per ha of agroforestry for the flowering understorey treatment only, because this grant places restrictions on cutting frequency and timing.
ID = mean(CAD)mown − mean(CAD)unmown + CM + G
The cost of aphid damage (CAD, Equation (2)) was calculated for each block by estimating potential yield (by assuming all aphid-damaged apples were fully developed and harvestable) minus actual yield, using predicted apple weights (W) (derived from measured apple widths, see Text S2 [50]), total apples per tree (TA), and aphid-damaged apples (AD) on each sample tree (T). These were measured according to the descriptions in Table S2. Yield loss to aphids per tree was then multiplied by trees per ha (TH), assumed to be 108, and apple price (AP), which comprised a heritage juice price of GBP 1600/t. This was based on the price that the study farm sold their juice to the public during 2020 (GBP 4 per litre, assuming 2.5 kg of fruit produces 1 litre of juice). An alternative price scenario was also tested, comprising a conventional eating/cooking apple market using national average prices [51] and excluding apples damaged by pests or disease (see Text S1). Variable costs of GBP 376.80/t were subtracted from both price scenarios, to account for harvesting, packing, transport, and commission [52]. Separate calculations were performed for each sample block, followed by a mean across all varieties. All ‘per hectare’ values were based on a hectare of agroforestry, rather than a hectare of trees. Seed costs were not included in the calculations, because costs of flower mixes and standard permanent pasture mixes from major seed suppliers were comparable and therefore not expected to contribute to the income difference between understorey treatments.
CAD = ((WT × TAT) − (WT × (TAT − ADT)) × TH × AP

3. Results

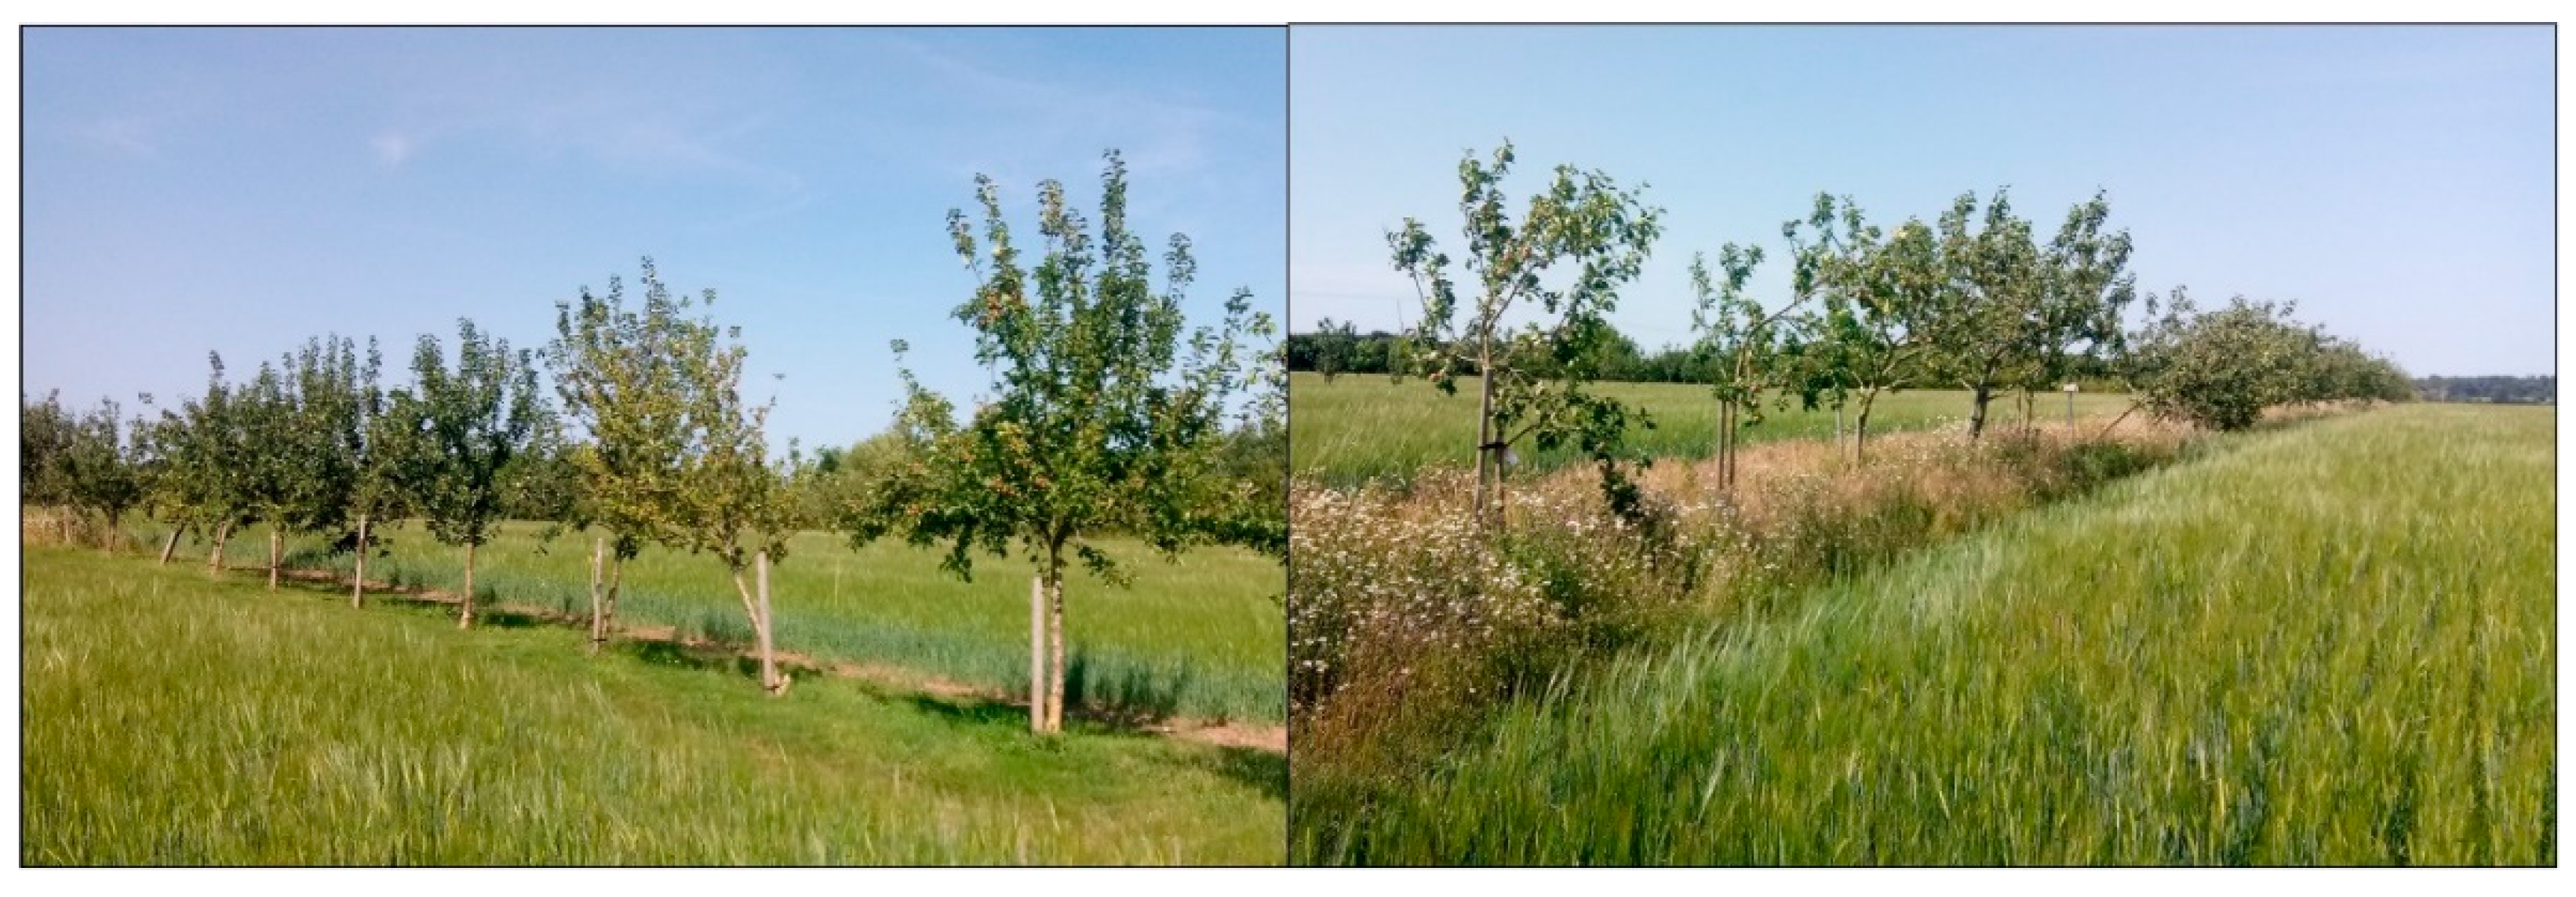
The understorey managements were successfully implemented, with the flowering and mown treatments becoming more visually different as the season progressed (Figure S1). The flowering understoreys (and tree rows outside the experimental blocks) supported a diverse and abundant floral resource, particularly in late May and June. Leucanthemum vulgare flowers were particularly frequent, along with tall tussocky grasses such as Dactylis glomerata and Deschampsia cespitosa. The mown sections, although containing the same plant species, were characterised by a low grassy sward with sparse flowers throughout the study period. The barley in the crop alleys was sown in early April, which was later than intended due to wet weather, and although it did establish, its growth was hindered by a prolonged warm, dry period after sowing. The apple trees produced a successful harvest. The two trapping sampling methods (pitfall and sticky) captured more than 11000 specimens each, while the two in-field counting methods yielded 969 and 184 observations for apple pests/natural enemies and pollinators, respectively (Table 3).

3.1. Effects on Functional Groups, Fruit Damage and Pollination in Apple Trees

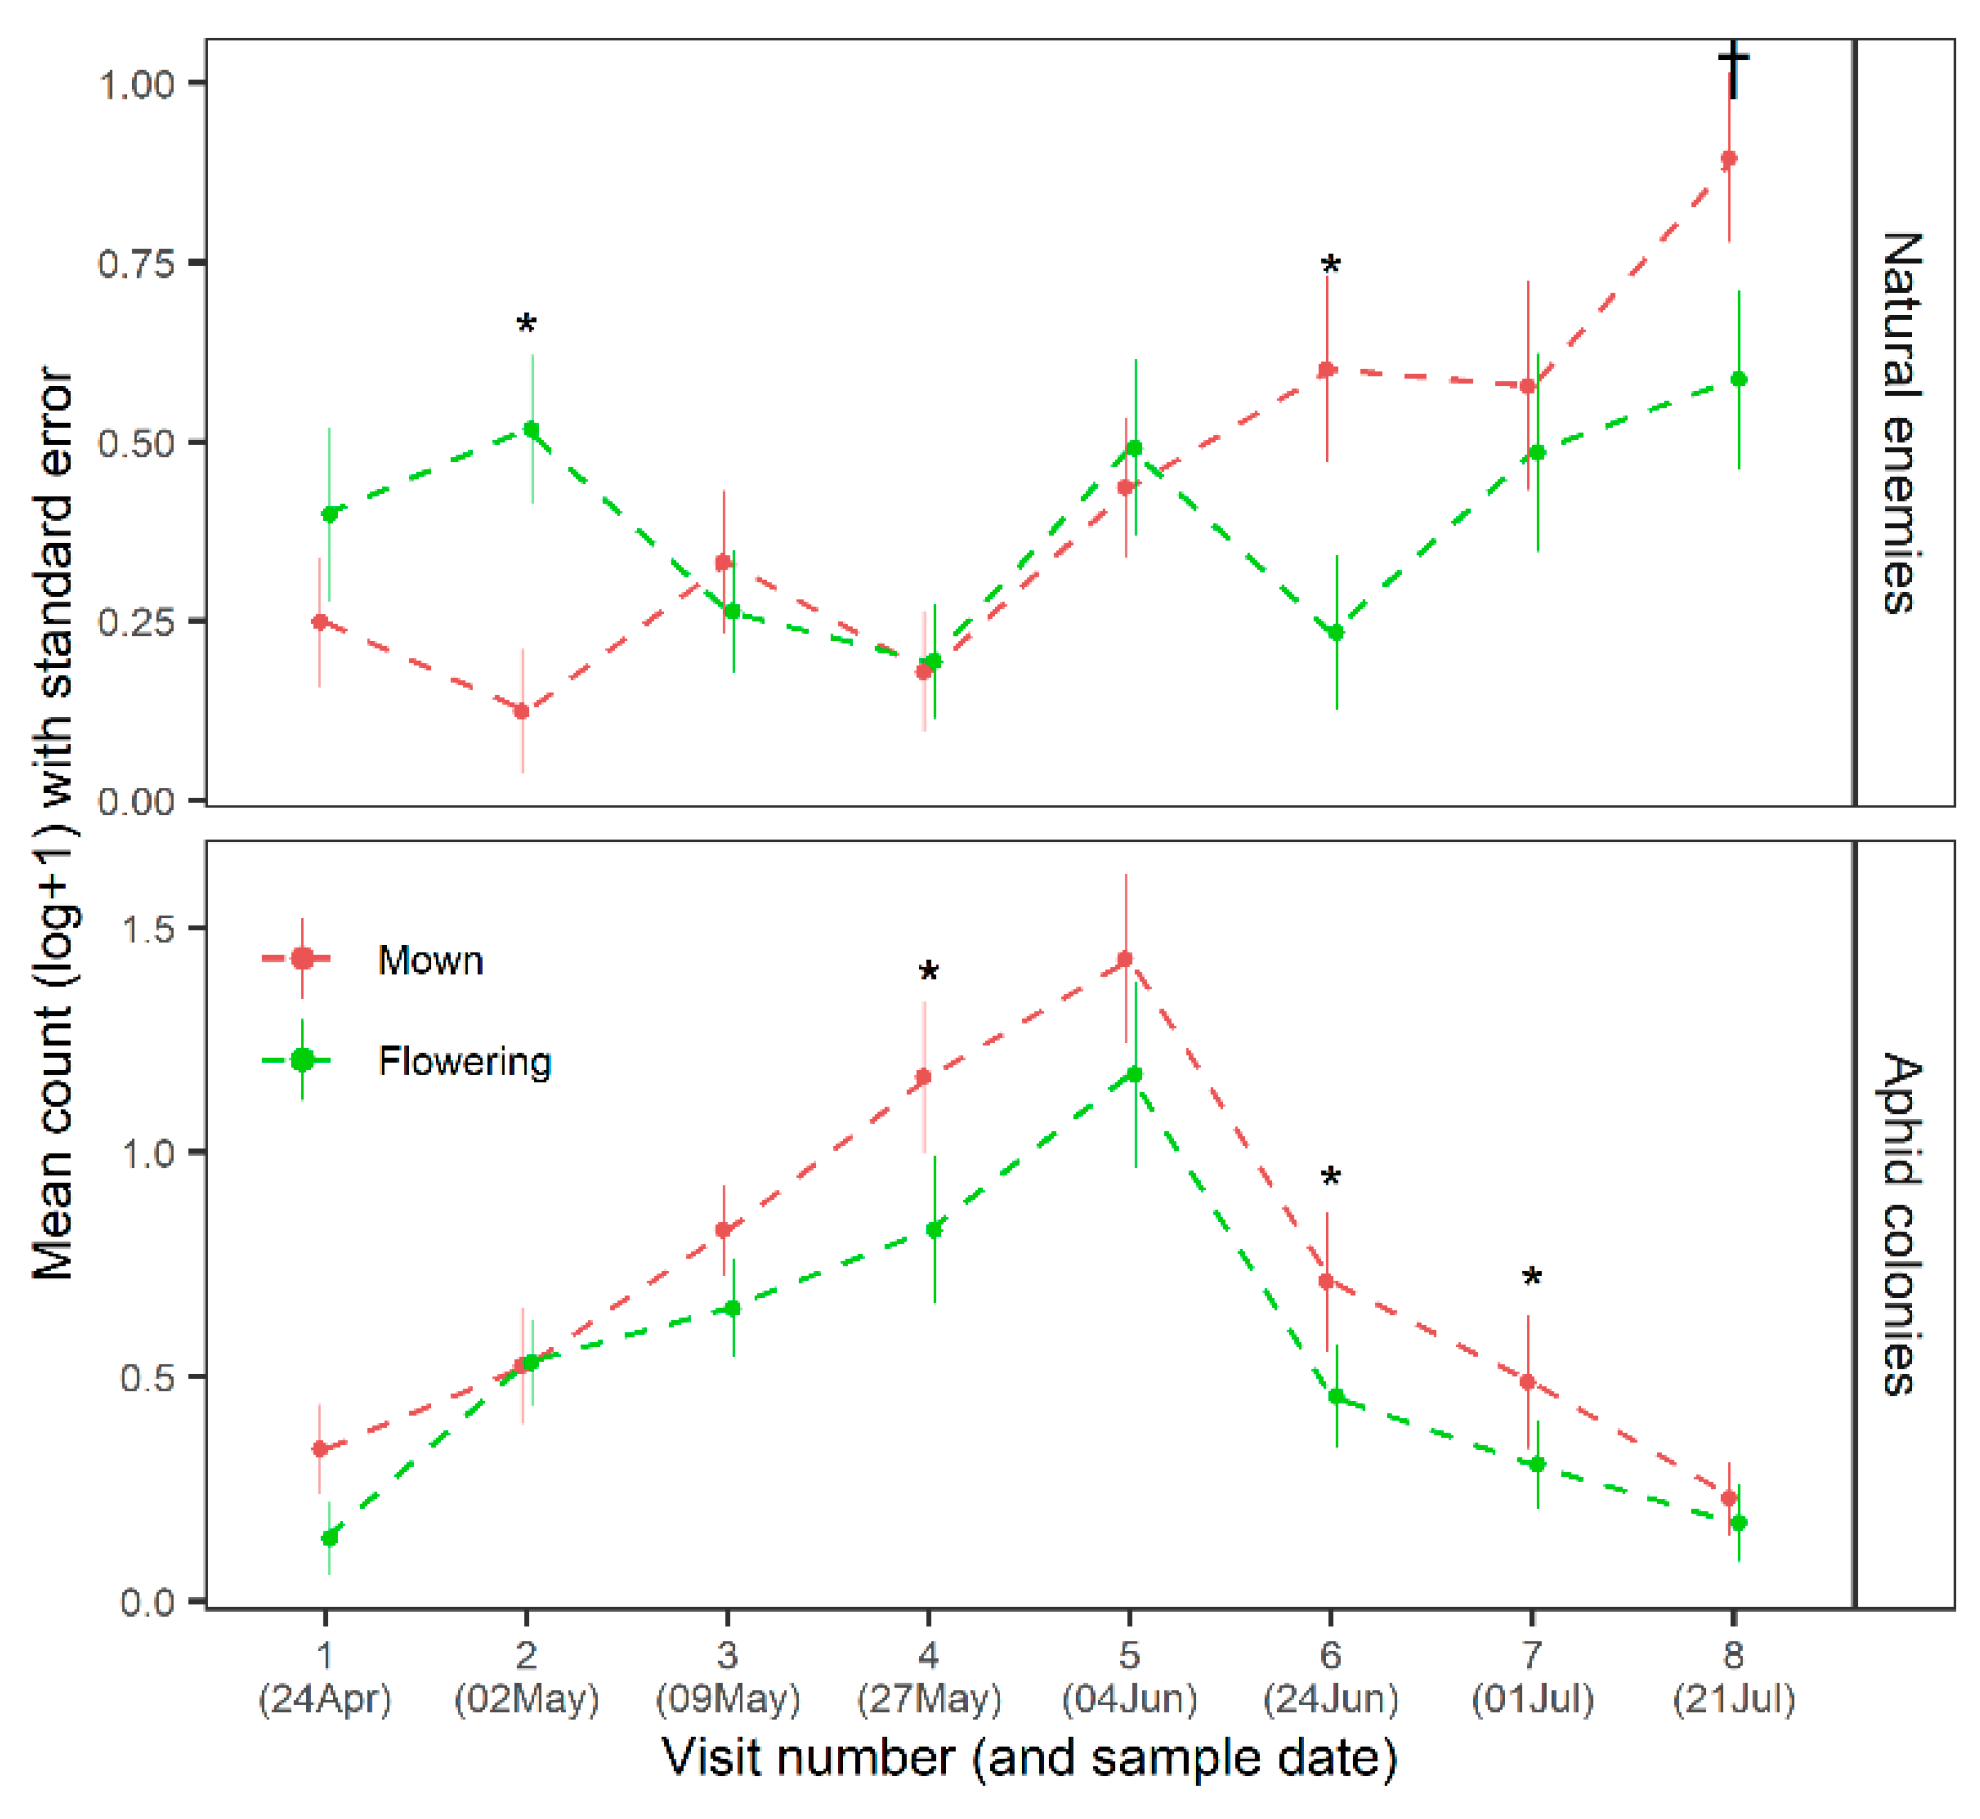
Apple trees above flowering understoreys supported significantly fewer aphid colonies compared with mown understoreys, for pooled sample visits (Poisson GLMM, z = −0.388, p-value <0.001). This effect was observed in all but one of the five sample blocks (Table S5). Aphid colony numbers were significantly lower in trees above flowering than mown understoreys on three of eight sample visits, according to a separate model which used a sample visit interaction term (Figure 4). Dysaphis plantaginea accounted for 82% of colonies, with other species comprising Rhopalosiphum insertum, Dysaphis devecta and Aphis pomi.
For the natural enemies in apple trees, we found a significant interaction between understorey management and visit number. Trees over flowering understoreys supported significantly more natural enemies in early May, but the pattern was reversed in late June (Figure 4). Spiders (Araneae) were the most abundant group of natural enemies in apple trees, followed by earwigs (Dermaptera).
Apple fruit damage by aphids was significantly lower above flowering than mown understoreys (mean 13.0% damage above flowering versus 26.9% above mown understoreys, see Table 4 for model outputs). This effect was consistent for four sample blocks, while aphid damage was very low (<1% of fruits) in the remaining sample block. Apple damage from other insects or scab disease was not significantly affected by understorey management.
Pollinator visitation was significantly higher in apple trees above flowering understoreys than mown understoreys (Poisson GLMM, z = 2.220, p-value = 0.026). This effect was observed in four of the five sample blocks (Table S5). Apis mellifera accounted for 86% of the pollinator visits, therefore a taxonomic analysis was not feasible. There was no significant difference of understorey management on the number of seeds per apple, which indicates pollination level (mean above flowering = 6.50, mown = 6.14, binomial GLMM, z = 1.560, p-value = 0.133), or on apple yield (mixed model, t = 0.982, p-value = 0.333).

3.2. Effects on the Arable Community and Productivity

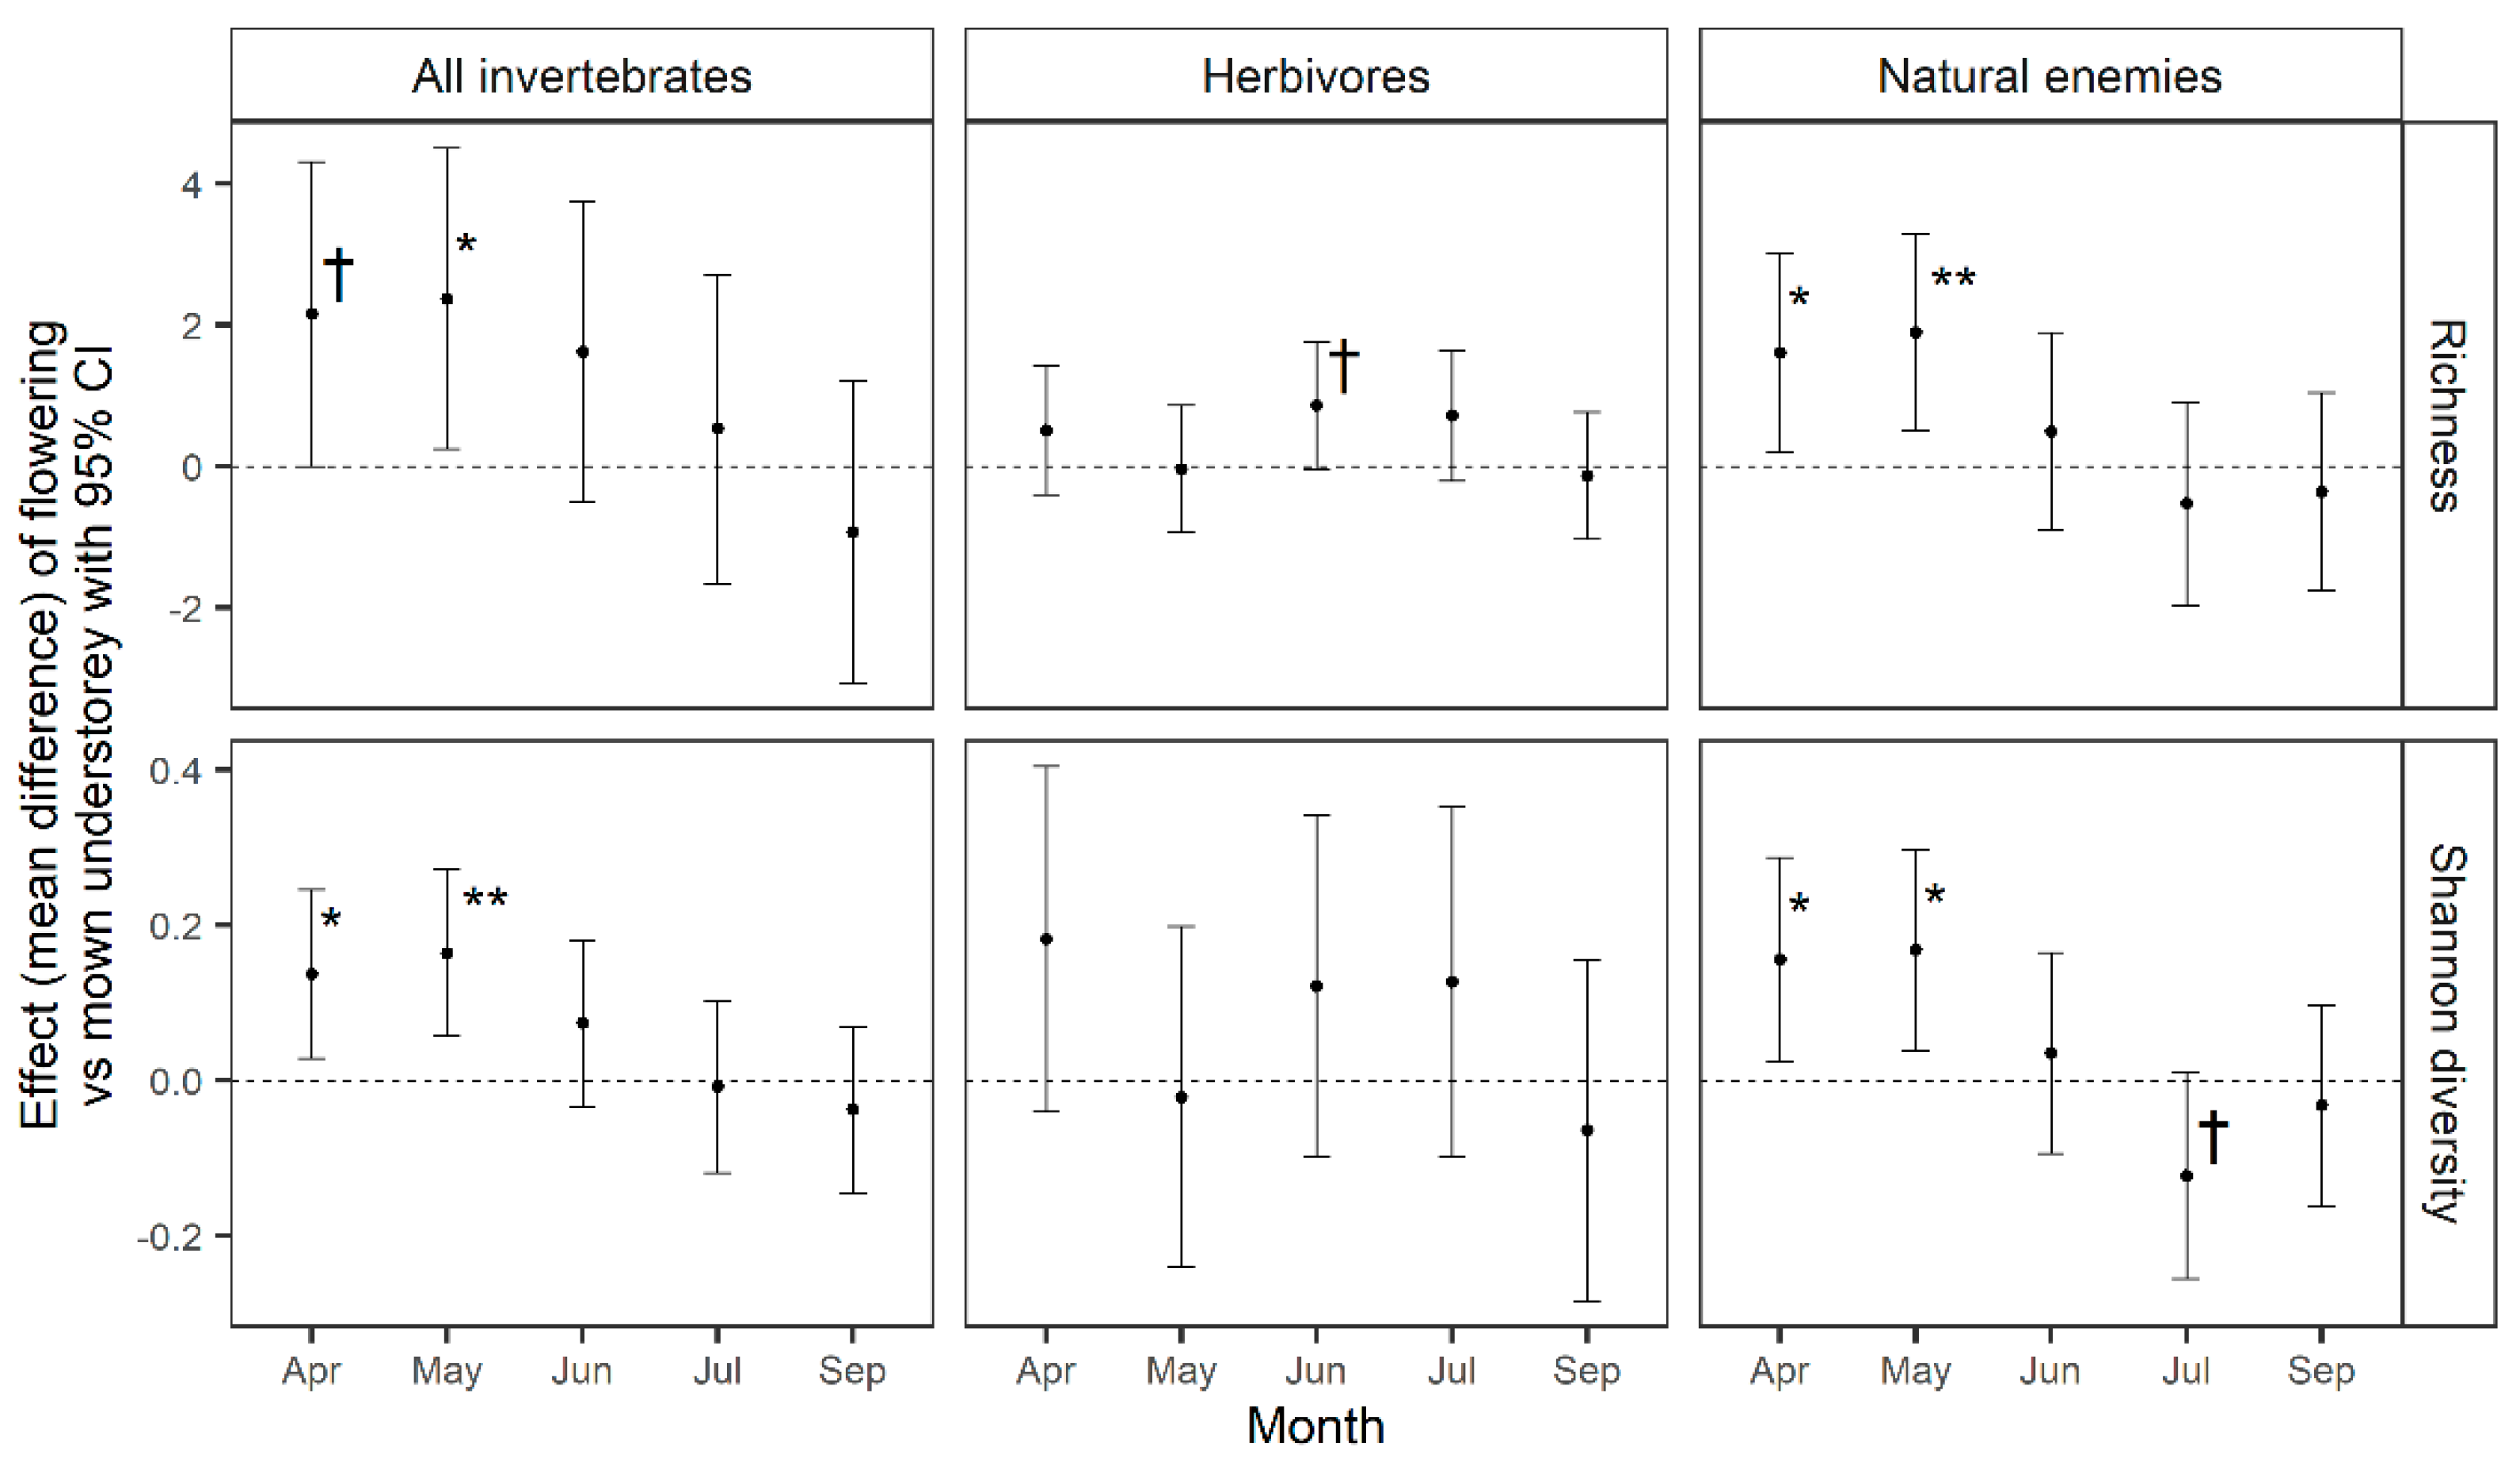
Shannon diversity and taxonomic richness of invertebrates captured in pitfall traps was significantly higher in crop alleys adjacent to flowering than mown understoreys in April and May, but over the following months this effect decreased and was not significant (Figure 5, Table S7). This early-season effect was more pronounced for natural enemies than herbivores, which showed no significant difference in any month (Figure 5). The effect on natural enemies was consistent for all five sample blocks in May (Table S8). There were no significant effects of understorey management on richness or diversity of sticky trap communities, in any month (Table S9).
Thrips (Thyanoptera) were significantly less abundant in arable alleys adjacent to flowering than mown understoreys, and this effect was consistent for all sample blocks (Table S5). None of the remaining five arable pest taxa showed a significant difference in abundance between understorey managements, although four of the taxa were less abundant in arable alleys adjacent to flowering than mown understoreys (Table S4). However, overall insect captures on sticky traps were significantly lower adjacent to flowering understoreys (Poisson GLMM, estimate = −0.150, z-value = −8.180, p-value < 0.001), suggesting that insect movement rather than abundance may have been lower adjacent to the flowering understoreys.
Understorey management had no significant effect on natural enemy community composition in pitfall traps (F = 1.458, p-value = 0.089), although lycosid spiders had a relatively strong association with crop alleys adjacent to mown rather than flowering understoreys (Figure S2). Barley yield sampled 0.5 m from the understoreys was not significantly affected by understorey management (mixed model, t-value = −0.197, p-value = 0.846).

3.3. Financial Modelling

According to our financial model of apple damage by aphids, mowing costs, and Countryside Stewardship grants, flowering understoreys increased farm income by a mean of GBP 231.02 per ha of agroforestry, when basing income on heritage juice prices that were equivalent to those currently achieved at the study site. This compares to a mean increased income of GBP 167.99 per ha under a hypothetical eating/cooking market (Text S1). There was large variation among sample blocks, because aphid damage between management treatments differed for each block, with the largest effect observed for the Lord Derby variety. Aphid damage to apples was the major contributor to income differences, followed by grants from Countryside Stewardship, while mowing costs had a minor contribution (Table 5).

4. Discussion

Our results show that the flowering understoreys delivered multiple benefits for invertebrate diversity and associated ecosystem services, compared with mown understoreys which comprised the same plant community but were subject to frequent cutting. In trees above flowering understoreys, natural enemy abundance was significantly higher in early May, while aphid colonies and aphid-damaged fruits were significantly less numerous overall. In addition, pollinator visitation to apple flowers was significantly higher in the trees above flowering understoreys. Arable alleys adjacent to flowering understoreys supported significantly higher Shannon diversity and taxonomic richness of ground-based invertebrate natural enemies early in the season. There were also some indications of pest suppression in alleys adjacent to flowering understoreys; however, this result should be interpreted with caution because it could be affected by sampling method biases. Flowering understoreys were predicted to improve farm income compared with mown understoreys, according to our case study’s financial model of aphid damage, mowing costs and grant payments.

4.1. Effects in the Apple Trees: Natural Pest Control and Pollination

We found that flowering understoreys increased natural enemy abundance in apple trees early in the season, reduced aphid colony density, and reduced the number of apples lost to aphid damage, which is supported by previous research of flower strips in insecticide-free apple orchards [53,54]. However, to our knowledge, this study is the first to report lower apple damage at harvest and, as a consequence, financial benefits of flowering strips for apple production. This could be because damaged fruits were not removed as part of farm management in this study, whereas fruit thinning in previous studies could have masked any effect on fruit damage [53]. Bottom-up mechanisms could play a role in aphid suppression, for example flowering understoreys could intercept more water, reducing uptake by trees, which reduces aphid attraction [55]. A more plausible mechanism for aphid suppression above the flowering understoreys could be the higher natural enemy abundance early in the season, given the importance of early season control for aphid growth [55], while spider abundance the previous autumn has been linked to rosy apple aphid control [56].
The early season benefit of flowering understoreys to arboreal natural enemies could be attributable to favourable shelter conditions during winter, and/or the availability of alternative prey sources in the understorey early in the season and at the end of the previous year [reviewed in 57]. We found higher natural enemy abundance above mown than above flowering understoreys later in the season, possibly because higher aphid colony density attracts aphidophagous predators [53]. However, these aphid colonies quickly die off before autumn, and the flowering understoreys are likely to support higher availability of alternative non-pest prey [57,58]. Although we could not disentangle the relative contributions of different natural enemy taxa, previous studies of flower strips in orchards have found contrasting roles of different natural enemy guilds in suppressing aphids [53,56], suggesting that the promotion of the whole natural enemy community is the most promising solution [55].
The lack of significant effects of understorey management on apple damage from other pests such as Cydia pomonella is consistent with the current literature of flower strips in orchards, where effects on C. pomonella damage are weak and inconsistent, and vary among studies and study years [53,59,60]. We also found no significant effects of understorey management on apple scab, although there appears to be a lack of evidence as to the effects of flower strips in orchards on this disease.
Agroforestry systems have been shown to increase the abundance and species richness of pollinators and pollination of phytometers relative to monoculture controls [14,16]. Our findings suggest that understorey management is an important factor driving this effect. We found higher pollinator visitation to apple flowers above flowering than mown understoreys, despite a sparse flower resource in the understorey at the time of apple flowering and the small scale of the plots compared with the foraging distances of pollinators [61]. Nevertheless, this result is supported by studies of apple orchards where flower cover increased pollinator visitation [32,62]. The lack of corresponding effect on apple pollination is also supported by a previous study of apple orchards, which found that although flower strips increased pollination visitation, apple fruit set was more strongly related to wild insect richness and andrenid bee visitation, neither of which responded to the presence of flower strips [62]. Understorey management could influence the availability of bee nesting resources such as bare ground and tussocks at larger spatial scales, given that the dominant pollinators in UK apple orchards tend to be ground-nesting bees [31], although this was unlikely to affect our results at the temporal and spatial scales of this study. Furthermore, the high proportion of Apis mellifera in our data suggests that the effect was driven by attraction to the foraging rather than nesting resource. The inclusion of flowering understoreys into agroforestry systems could improve yield and/or quality of pollination-dependent arable crops such as oilseed rape, which receives higher pollination service adjacent to flower strips [63]. In addition, flowering understoreys could improve the long-term stability of pollinator populations and pollination service by providing seasonal continuity of floral resources [64].

4.2. Effects in the Arable Crop: Invertebrate Diversity and Natural Pest Control

Our finding of significantly higher richness and Shannon diversity of natural enemies in flowering versus mown understoreys early in the season is consistent with findings from flower strips in arable fields [65,66]. Various mechanisms have been proposed to explain how flower strips can benefit natural enemies, including provision of shelter during winter, nectar and pollen, and alternative prey or hosts [21]. The stronger effect early in the season, prior to any substantial flowering, suggests that the vegetation structure during winter was a more important driver than flowering resources such as nectar and pollen, albeit this was only over one season. This is consistent with a study which found that overwintering natural enemies were more associated with understorey vegetation strips than crop alleys in an agroforestry system [19]. In addition, flower strips with high vegetation cover and plant diversity have been shown to be important for overwintering ground-based natural enemies and pollinating flies [24], while tussocky grass cover is important for the functional diversity of overwintering carabid beetles [67].
We also found significantly fewer thrips in arable alleys adjacent to flowering compared with mown understoreys. However, pooled sticky trap captures were significantly lower adjacent to flowering than mown understoreys, which could be explained by flowers ‘competing’ with sticky traps for insect visitation. Similar biases have been reported in pollinator sampling using pan traps [68]. Therefore, we would recommend additional sampling methods such as visual counts or damage assessments in future studies to confirm this finding. Nevertheless, the findings potentially indicate an improved level of natural pest control adjacent to the flowering understoreys. Arable crop yields did not significantly differ between understorey treatments, providing no evidence for any short-term reduction in crop pest damage adjacent to flowering understoreys. This is consistent with a meta-analysis of flower strips in agriculture, which found that although flower strips significantly increased pest control services, there was no significant effect on crop yield [23]. In the longer-term, the higher richness and diversity of natural enemies adjacent to flowering understoreys could improve the stability and resilience of this ecosystem service to environmental change [69,70].

4.3. Financial Implications

Our financial model found that flowering understoreys improved farm income compared with mown understoreys, because of the lower apple damage by aphids (mean income increase of GBP 163.62), grant payments (mean income increase of GBP 53.90) and lower mowing costs (mean income increase of GBP 13.50, all per ha of agroforestry). The overall mean income increase of GBP 231.02 compares to a forecasted gross margin of GBP 1,962 per ha for a wheat-apple agroforestry system at peak production, adapting the gross margin by Briggs and Knight [71] according to the mean apple yields and price applied in our study. An alternative pricing scenario based on a conventional eating/cooking apple market also predicted higher income arising from flowering than mown understoreys, although the increase was slightly reduced (GBP 167.99 per ha of agroforestry, see Text S1), because of the lower apple prices.
Therefore, lower aphid damage provides a financial incentive for the adoption of understorey management to promote flowering, although the potential for ecological disservices such as rodent damage and weed competition requires further assessment. The minor contribution of mowing costs to the financial output suggests that flowering understoreys would have similar financial benefits over an intermediate management regime, for example with two or three cuts per year, assuming similar levels of aphid damage to the mown management in this study. Our results suggest that specialised heritage juicing is a favourable option for these agroforestry systems, because of the potential to attract premium prices and the inconsequence of fruit appearance.

4.4. Constraints

It is important that the dispersal ability and movement patterns of species are taken into account in the interpretation of results from plot-scale studies [72,73]. The effects we find in this study could be less than those achievable under field-scale conditions because of insect movement between treatments and into and out of experimental blocks [72,74]. Furthermore, the scale of the study is considerably less than typical pollinator dispersal distances [61], which would mask any effects of nesting resource availability. This was a one-year study, and therefore stronger contrasts between the two management regimes might be expected over a longer time period. Nevertheless, the understorey vegetation was established six years prior to the study and subsequently managed to promote flowering, giving time for species to colonise and populations to establish, for example six years is beyond the time at which pollination services are maximised with flower strip age [23]. Our financial model is based on a case study over a single year and does not take into account other factors such as long-term tree growth and productivity, and should therefore be interpreted with caution.

4.5. Potential Disadvantages of Flowering Understoreys

Although we found multiple benefits of flowering understoreys for invertebrate diversity and associated ecosystem services, from a wider perspective there are a number of potential disadvantages. For example, flowering understoreys could increase rodent pest densities, competition with the trees for resources such as water and nutrients, spread of weeds, frost damage to apple trees, and labour to collect windfall apples [29,75]. To some extent, appropriate management such as timing of the annual cut could help to mitigate these disadvantages [75]. These factors require further economic assessment and should be considered when developing management options.

4.6. Recommendations for Future Research

Given these findings, we recommend that future studies which aim to evaluate the effects of alley-cropping agroforestry systems on biodiversity take into account understorey management and its interaction with season, which could be key factors influencing the previously observed heterogeneity in effects [14,15]. In addition, the scale of plot manipulation should be considered, given species movement patterns, as discussed above. Finally, studies should aim to quantify the results in ways which are meaningful to practitioners, such as yield and profit [27].

5. Conclusions

This study is the first to demonstrate the value of flowering understoreys in a silvoarable system for invertebrate richness and diversity, associated ecosystem services, and farm income. Flowering understoreys increased predator densities in apple trees, decreased aphid colony growth, decreased aphid damage to apples, and increased pollinator visitation to apple flowers, while increasing ground-based natural enemy diversity in the adjacent arable crop. Therefore, flowering understoreys appear to be a win-win management option in terms of biodiversity, associated ecosystem services, and farm income, although wider issues such as resource competition between understorey vegetation and trees should also be considered. We recommend that understorey management is taken into account in studies of biodiversity in alley-cropping systems, and recommend further confirmation of these results at other sites and at larger spatial scales.

Supplementary Materials

The following are available online at https://www.mdpi.com/article/10.3390/agronomy11040651/s1, Figure S1: Photographs of understorey management treatments over the season, Figure S2: Effect of understorey management and distance from boundary on natural enemy taxa, Table S1: Understorey plant species list, Table S2: Sampling methodology, Table S3: Taxonomic resolution, Table S4: Model outputs for pest abundance, Table S5: Block-level analysis, Table S6: Model outputs for natural enemies and aphids, Table S7: Diversity model outputs, Table S8: Block-level analysis for natural enemy diversity, Table S9: Model outputs for sticky traps, Text S1: Alternative apple price scenario, Text S2: Calculation of predicted apple weights from width measurements.

Author Contributions

Conceptualization, all authors; methodology, all authors; formal analysis, T.S.; investigation, T.S.; data curation, T.S.; writing—original draft preparation, T.S.; writing—review and editing, all authors; visualization, T.S.; supervision, R.G.; project administration, T.S.; funding acquisition, R.G. All authors have read and agreed to the published version of the manuscript.

Funding

This work was funded by the Natural Environmental Research Council and University of Reading (via the QMEE CDT, grant number NE/R012229/1), and Formas (140649).

Institutional Review Board Statement

Not applicable.

Informed Consent Statement

Not applicable.

Data Availability Statement

The data presented in this study are openly available in NERC’s Environmental Information Data Centre at https://doi.org/10.5285/83a10b11-23ef-4378-a56d-c63cce365275 (accessed on 25 March 2021).

Acknowledgments

We thank David Rose and FarmEco Community Care Ltd. for allowing access to the study site and facilitating the experimental design. Helen Chesshire (The Woodland Trust) helped identify the study site. We are grateful to two anonymous reviewers for their constructive comments on the manuscript.

Conflicts of Interest

The authors declare no conflict of interest.

References

  1. Sánchez-Bayo, F.; Wyckhuys, K.A.G. Worldwide Decline of the Entomofauna: A Review of Its Drivers. Biol. Conserv. 2019, 232, 8–27. [Google Scholar] [CrossRef]
  2. Wagner, D.L. Insect Declines in the Anthropocene. Annu. Rev. Entomol. 2020, 65, 457–480. [Google Scholar] [CrossRef] [Green Version]
  3. Rusch, A.; Chaplin-Kramer, R.; Gardiner, M.M.; Hawro, V.; Holland, J.; Landis, D.; Thies, C.; Tscharntke, T.; Weisser, W.W.; Winqvist, C. Agricultural Landscape Simplification Reduces Natural Pest Control: A Quantitative Synthesis. Agric. Ecosyst. Environ. 2016, 221, 198–204. [Google Scholar] [CrossRef] [Green Version]
  4. Deguines, N.; Jono, C.; Baude, M.; Henry, M.; Julliard, R.; Fontaine, C. Large-Scale Trade-off between Agricultural Intensification and Crop Pollination Services. Front. Ecol. Environ. 2014, 12, 212–217. [Google Scholar] [CrossRef]
  5. Kremen, C.; Williams, N.M.; Thorp, R.W. Crop Pollination from Native Bees at Risk from Agricultural Intensification. Proc. Natl. Acad. Sci. USA 2002, 99, 16812–16816. [Google Scholar] [CrossRef] [Green Version]
  6. Pretty, J. Agricultural Sustainability: Concepts, Principles and Evidence. Philos. Trans. R. Soc. B Biol. Sci. 2008, 363, 447–465. [Google Scholar] [CrossRef] [Green Version]
  7. Tilman, D.; Cassman, K.G.; Matson, P.A.; Naylor, R.; Polasky, S. Agricultural Sustainability and Intensive Production Practices. Nature 2002, 418, 671–677. [Google Scholar] [CrossRef]
  8. Pretty, J.; Benton, T.G.; Bharucha, Z.P.; Dicks, L.V.; Flora, C.B.; Godfray, H.C.J.; Goulson, D.; Hartley, S.; Lampkin, N.; Morris, C.; et al. Global Assessment of Agricultural System Redesign for Sustainable Intensification. Nat. Sustain. 2018, 1, 441–446. [Google Scholar] [CrossRef]
  9. Tittonell, P. Ecological Intensification of Agriculture-Sustainable by Nature. Curr. Opin. Environ. Sustain. 2014, 8, 53–61. [Google Scholar] [CrossRef]
  10. Gordon, A.M.; Newman, S.M.; Coleman, B.R.W.; Thevathasan, N.V. Temperate agroforestry: An overview. In Temperate Agroforestry Systems; Gordon, A.M., Newman, S.M., Coleman, B.R.W., Eds.; CABI: Wallingford, UK, 2018; pp. 1–6. [Google Scholar]
  11. Torralba, M.; Fagerholm, N.; Burgess, P.J.; Moreno, G.; Plieninger, T. Do European Agroforestry Systems Enhance Biodiversity and Ecosystem Services? A Meta-Analysis. Agric. Ecosyst. Environ. 2016, 230, 150–161. [Google Scholar] [CrossRef] [Green Version]
  12. Tsonkova, P.; Böhm, C.; Quinkenstein, A.; Freese, D. Ecological Benefits Provided by Alley Cropping Systems for Production of Woody Biomass in the Temperate Region: A Review. Agrofor. Syst. 2012, 85, 133–152. [Google Scholar] [CrossRef]
  13. Smith, J.; Pearce, B.D.; Wolfe, M.S. Reconciling Productivity with Protection of the Environment: Is Temperate Agroforestry the Answer? Renew. Agric. Food Syst. 2013, 28, 80–92. [Google Scholar] [CrossRef]
  14. Staton, T.; Walters, R.J.; Smith, J.; Girling, R.D. Evaluating the Effects of Integrating Trees into Temperate Arable Systems on Pest Control and Pollination. Agric. Syst. 2019, 176, 102676. [Google Scholar] [CrossRef]
  15. Pumariño, L.; Sileshi, G.W.; Gripenberg, S.; Kaartinen, R.; Barrios, E.; Muchane, M.N.; Midega, C.; Jonsson, M. Effects of Agroforestry on Pest, Disease and Weed Control: A Meta-Analysis. Basic Appl. Ecol. 2015, 16, 573–582. [Google Scholar] [CrossRef]
  16. Varah, A.; Jones, H.; Smith, J.; Potts, S.G. Temperate Agroforestry Systems Provide Greater Pollination Service than Monoculture. Agric. Ecosyst. Environ. 2020, 301, 107031. [Google Scholar] [CrossRef]
  17. Jose, S. Agroforestry for Conserving and Enhancing Biodiversity. Agrofor. Syst. 2012, 85, 1–8. [Google Scholar] [CrossRef]
  18. Lichtenberg, E.M.; Kennedy, C.M.; Kremen, C.; Batáry, P.; Berendse, F.; Bommarco, R.; Bosque-Pérez, N.A.; Carvalheiro, L.G.; Snyder, W.E.; Williams, N.M.; et al. A Global Synthesis of the Effects of Diversified Farming Systems on Arthropod Diversity within Fields and across Agricultural Landscapes. Glob. Chang. Biol. 2017, 23, 4946–4957. [Google Scholar] [CrossRef] [Green Version]
  19. Boinot, S.; Poulmarc’h, J.; Mézière, D.; Lauri, P.É.; Sarthou, J.P. Distribution of Overwintering Invertebrates in Temperate Agroforestry Systems: Implications for Biodiversity Conservation and Biological Control of Crop Pests. Agric. Ecosyst. Environ. 2019, 285, 106630. [Google Scholar] [CrossRef]
  20. Hatt, S.; Francis, F.; Xu, Q.; Wang, S.; Osawa, N. Perennial Flowering Strips for Conservation Biological Control of Insect Pests: From Picking and Mixing Flowers to Tailored Functional Diversity. In Integrative Biological Control. Progress in Biological Control; Hokkanen, H., Gao, Y., Eds.; Springer: Cham, Switzerland, 2020; Volume 20, pp. 57–71. [Google Scholar]
  21. Gurr, G.M.; Wratten, S.D.; Landis, D.A.; You, M. Habitat Management to Suppress Pest Populations: Progress and Prospects. Annu. Rev. Entomol. 2017, 62, 91–109. [Google Scholar] [CrossRef]
  22. Ganser, D.; Albrecht, M.; Knop, E. Wildflower Strips Enhance Wild Bee Reproductive Success. J. Appl. Ecol. 2020, 58, 486–495. [Google Scholar] [CrossRef]
  23. Albrecht, M.; Kleijn, D.; Williams, N.M.; Tschumi, M.; Blaauw, B.R.; Bommarco, R.; Campbell, A.J.; Dainese, M.; Drummond, F.A.; Entling, M.H.; et al. The Effectiveness of Flower Strips and Hedgerows on Pest Control, Pollination Services and Crop Yield: A Quantitative Synthesis. Ecol. Lett. 2020, 23, 1488–1498. [Google Scholar] [CrossRef]
  24. Ganser, D.; Knop, E.; Albrecht, M. Sown Wildflower Strips as Overwintering Habitat for Arthropods: Effective Measure or Ecological Trap? Agric. Ecosyst. Environ. 2019, 275, 123–131. [Google Scholar] [CrossRef]
  25. Burgess, P.J.; Incoll, L.D.; Hart, B.J.; Beaton, A.; Piper, R.W.; Seymour, I.; Reynolds, F.H.; Wright, C.; Pilbeam, D.J.; Graves, A.R. The Impact of Silvoarable Agroforestry with Poplar on Farm Profitability and Biological Diversity. Final Report to DEFRA; Cranfield University: Bedfordshire, UK, 2003; pp. 1–63. [Google Scholar]
  26. Smits, N.; Dupraz, C.; Dufour, L. Unexpected Lack of Influence of Tree Rows on the Dynamics of Wheat Aphids and Their Natural Enemies in a Temperate Agroforestry System. Agrofor. Syst. 2012, 85, 153–164. [Google Scholar] [CrossRef]
  27. Kleijn, D.; Bommarco, R.; Fijen, T.P.M.; Garibaldi, L.A.; Potts, S.G.; van der Putten, W.H. Ecological Intensification: Bridging the Gap between Science and Practice. Trends Ecol. Evol. 2019, 34, 154–166. [Google Scholar] [CrossRef] [PubMed] [Green Version]
  28. Newman, S.M.; Pilbeam, D.J.; Briggs, S. Agroforestry in the UK. In Temperate Agroforestry Systems; Gordon, A.M., Newman, S.M., Coleman, B.R.W., Eds.; CABI: Wallingford, UK, 2018; pp. 72–97. [Google Scholar]
  29. Reubens, B. Managing the Tree Row Understorey in Agroforestry Systems; AFINET: Lugo, Spain, 2018; pp. 1–2. [Google Scholar]
  30. Gao, L.; Xu, H.; Bi, H.; Xi, W.; Bao, B.; Wang, X.; Bi, C.; Chang, Y. Intercropping Competition between Apple Trees and Crops in Agroforestry Systems on the Loess Plateau of China. PLoS ONE 2013, 8, e70739. [Google Scholar] [CrossRef]
  31. Garratt, M.P.D.; Breeze, T.D.; Boreux, V.; Fountain, M.T.; McKerchar, M.; Webber, S.M.; Coston, D.J.; Jenner, N.; Dean, R.; Westbury, D.B. Apple Pollination: Demand Depends on Variety and Supply Depends on Pollinator Identity. PLoS ONE 2016, 11, e0153889. [Google Scholar] [CrossRef] [Green Version]
  32. Samnegård, U.; Alins, G.; Boreux, V.; Bosch, J.; García, D.; Happe, A.K.; Klein, A.M.; Miñarro, M.; Mody, K.; Porcel, M.; et al. Management Trade-Offs on Ecosystem Services in Apple Orchards across Europe: Direct and Indirect Effects of Organic Production. J. Appl. Ecol. 2019, 56, 802–811. [Google Scholar] [CrossRef] [Green Version]
  33. Graves, A.R.; Burgess, P.J.; Liagre, F.; Pisanelli, A.; Paris, P.; Moreno, G.; Bellido, M.; Mayus, M.; Postma, M.; Schindler, B.; et al. Farmer Perceptions of Silvoarable Systems in Seven European Countries. Adv. Agrofor. 2008, 6, 67–86. [Google Scholar] [CrossRef]
  34. García de Jalón, S.; Burgess, P.J.; Graves, A.; Moreno, G.; McAdam, J.; Pottier, E.; Novak, S.; Bondesan, V.; Mosquera-Losada, R.; Crous-Durán, J. How Is Agroforestry Perceived in Europe? An Assessment of Positive and Negative Aspects by Stakeholders. Agrofor. Syst. 2018, 92, 829–848. [Google Scholar] [CrossRef] [Green Version]
  35. Cranfield University the Soils Guide. Available online: https://www.landis.org.uk (accessed on 11 January 2021).
  36. Staton, T.; Walters, R.J.; Smith, J.; Breeze, T.D.; Girling, R.D. Evaluating a Trait-based Approach to Compare Natural Enemy and Pest Communities in Agroforestry vs. Arable Systems. Ecol. Appl. 2021, e2294. [Google Scholar] [CrossRef]
  37. Thomas, C.F.G.; Brown, N.J.; Kendall, D.A. Carabid Movement and Vegetation Density: Implications for Interpreting Pitfall Trap Data from Split-Field Trials. Agric. Ecosyst. Environ. 2006, 113, 51–61. [Google Scholar] [CrossRef]
  38. Webber, S.M.; Garratt, M.P.D.; Lukac, M.; Bailey, A.P.; Huxley, T.; Potts, S.G. Quantifying Crop Pollinator-Dependence and Pollination Deficits: The Effects of Experimental Scale on Yield and Quality Assessments. Agric. Ecosyst. Environ. 2020, 304, 1–8. [Google Scholar] [CrossRef]
  39. Lang, A. The Pitfalls of Pitfalls: A Comparison of Pitfall Trap Catches and Absolute Density Estimates of Epigeal Invertebrate Predators in Arable Land. J. Pest Sci. 2000, 73, 99–106. [Google Scholar] [CrossRef]
  40. Woodcock, B.A. Pitfall trapping in ecological studies. In Insect Sampling in Forest Ecosystems; Leather, S., Ed.; Blackwell: Oxford, UK, 2005; pp. 37–57. [Google Scholar]
  41. AHDB. Encyclopaedia of Pests and Natural Enemies in Field Crops; AHDB: Kenilworth, UK, 2015; pp. 1–200. [Google Scholar]
  42. R Core Team. R: A Language and Environment for Statistical Computing; R Foundation for Statistical Computing: Vienna, Austria, 2018. [Google Scholar]
  43. Bates, D.; Mächler, M.; Bolker, B.; Walker, S. Fitting Linear Mixed-Effects Models Using Lme4. J. Stat. Softw. 2015, 67, 1–48. [Google Scholar] [CrossRef]
  44. Venables, W.N.; Ripley, B.D. Modern Applied Statistics with S, 4th ed.; Springer: New York, NY, USA, 2002; pp. 1–495. [Google Scholar]
  45. Kuznetsova, A.; Brockhoff, P.B.; Christensen, R.H.B. LmerTest Package: Tests in Linear Mixed Effects Models. J. Stat. Softw. 2017, 82, 1–26. [Google Scholar] [CrossRef] [Green Version]
  46. Oksanen, J.; Blanchet, F.G.; Friendly, M.; Kindt, R.; Legendre, P.; McGlinn, D.; Minchin, P.R.; O’Hara, R.B.; Simpson, G.L.; Solymos, P.; et al. Vegan: Community Ecology Package. Available online: https://cran.r-project.org/web/packages/vegan/index.html (accessed on 27 March 2021).
  47. Legendre, P.; Gallagher, E.D. Ecologically Meaningful Transformations for Ordination of Species Data. Oecologia 2001, 129, 271–280. [Google Scholar] [CrossRef]
  48. Greenop, A.; Woodcock, B.A.; Wilby, A.; Cook, S.M.; Pywell, R.F. Functional Diversity Positively Affects Prey Suppression by Invertebrate Predators: A Meta-Analysis. Ecology 2018, 99, 1771–1782. [Google Scholar] [CrossRef] [PubMed] [Green Version]
  49. Lampkin, N.; Measures, M.; Padel, S. 2017 Organic Farm Management Handbook, 11th ed.; Organic Research Centre: Newbury, UK, 2017; pp. 1–256. [Google Scholar]
  50. Garratt, M.P.D.; Fountain, M.T.; McKerchar, M.; Webber, S.M. Valuing Insect Pollinators for UK Apple Production; University of Reading: Reading, UK, 2016. [Google Scholar] [CrossRef]
  51. Defra National Average Wholesale Prices of Home-Grown Horticultural Produce. Available online: https://www.gov.uk/government/statistical-data-sets/wholesale-fruit-and-vegetable-prices-weekly-average (accessed on 9 February 2021).
  52. Redman, G. John Nix Pocketbook for Farm Management 2018, 48th ed.; Agro Business Consultants: Melton Mowbray, UK, 2017. [Google Scholar]
  53. Cahenzli, F.; Sigsgaard, L.; Daniel, C.; Herz, A.; Jamar, L.; Kelderer, M.; Jacobsen, S.K.; Kruczyńska, D.; Matray, S.; Porcel, M.; et al. Perennial Flower Strips for Pest Control in Organic Apple Orchards—A Pan-European Study. Agric. Ecosyst. Environ. 2019, 278, 43–53. [Google Scholar] [CrossRef]
  54. Herz, A.; Cahenzli, F.; Penvern, S.; Pfiffner, L.; Tasin, M.; Sigsgaard, L. Managing Floral Resources in Apple Orchards for Pest Control: Ideas, Experiences and Future Directions. Insects 2019, 10, 247. [Google Scholar] [CrossRef] [Green Version]
  55. Rousselin, A.; Bevacqua, D.; Sauge, M.H.; Lescourret, F.; Mody, K.; Jordan, M.O. Harnessing the Aphid Life Cycle to Reduce Insecticide Reliance in Apple and Peach Orchards. A Review. Agron. Sustain. Dev. 2017, 37, 1–13. [Google Scholar] [CrossRef] [Green Version]
  56. Cahenzli, F.; Pfiffner, L.; Daniel, C. Reduced Crop Damage by Self-Regulation of Aphids in an Ecologically Enriched, Insecticide-Free Apple Orchard. Agron. Sustain. Dev. 2017, 37, 1–8. [Google Scholar] [CrossRef] [Green Version]
  57. Pfiffner, L.; Wyss, E. Use of sown wildflower strips to enhance natural enemies of agricultural pests. In Ecological Engineering for Pest Management: Advances in Habitat Manipulation for Arthropods; Gurr, G.M., Wratten, S.D., Altieri, M.A., Eds.; CABI: Wallingford, UK, 2004; pp. 165–186. [Google Scholar]
  58. Wyss, E. The Effects of Artificial Weed Strips on Diversity and Abundance of the Arthropod Fauna in a Swiss Experimental Apple Orchard. Agric. Ecosyst. Environ. 1996, 60, 47–59. [Google Scholar] [CrossRef]
  59. Markó, V.; Jenser, G.; Mihályi, K.; Hegyi, T.; Balázs, K. Flowers for Better Pest Control? Effects of Apple Orchard Groundcover Management on Mites (Acari), Leafminers (Lepidoptera, Scitellidae), and Fruit Pests. Biocontrol Sci. Technol. 2012, 22, 39–60. [Google Scholar] [CrossRef]
  60. Sigsgaard, L. Conservation Biological Control of Codling Moth, Cydia Pomonella. IOBC/WPRS Bull. 2014, 100, 123–126. [Google Scholar]
  61. Gardner, E.; Breeze, T.D.; Clough, Y.; Smith, H.G.; Baldock, K.C.R.; Campbell, A.; Garratt, M.P.D.; Gillespie, M.A.K.; Kunin, W.E.; McKerchar, M.; et al. Reliably Predicting Pollinator Abundance: Challenges of Calibrating Process-Based Ecological Models. Methods Ecol. Evol. 2020, 11, 1673–1689. [Google Scholar] [CrossRef]
  62. Campbell, A.J.; Wilby, A.; Sutton, P.; Wäckers, F.L. Do Sown Flower Strips Boost Wild Pollinator Abundance and Pollination Services in a Spring-Flowering Crop? A Case Study from UK Cider Apple Orchards. Agric. Ecosyst. Environ. 2017, 239, 20–29. [Google Scholar] [CrossRef] [Green Version]
  63. Sutter, L.; Albrecht, M.; Jeanneret, P. Landscape Greening and Local Creation of Wildflower Strips and Hedgerows Promote Multiple Ecosystem Services. J. Appl. Ecol. 2018, 55, 612–620. [Google Scholar] [CrossRef]
  64. Timberlake, T.P.; Vaughan, I.P.; Memmott, J. Phenology of Farmland Floral Resources Reveals Seasonal Gaps in Nectar Availability for Bumblebees. J. Appl. Ecol. 2019, 56, 1585–1596. [Google Scholar] [CrossRef]
  65. Tschumi, M.; Albrecht, M.; Collatz, J.; Dubsky, V.; Entling, M.H.; Najar-Rodriguez, A.J.; Jacot, K. Tailored Flower Strips Promote Natural Enemy Biodiversity and Pest Control in Potato Crops. J. Appl. Ecol. 2016, 53, 1169–1176. [Google Scholar] [CrossRef] [Green Version]
  66. Ditner, N.; Balmer, O.; Beck, J.; Blick, T.; Nagel, P.; Luka, H. Effects of Experimentally Planting Non-Crop Flowers into Cabbage Fields on the Abundance and Diversity of Predators. Biodivers. Conserv. 2013, 22, 1049–1061. [Google Scholar] [CrossRef] [Green Version]
  67. Woodcock, B.A.; Redhead, J.; Vanbergen, A.J.; Hulmes, L.; Hulmes, S.; Peyton, J.; Nowakowski, M.; Pywell, R.F.; Heard, M.S. Impact of Habitat Type and Landscape Structure on Biomass, Species Richness and Functional Diversity of Ground Beetles. Agric. Ecosyst. Environ. 2010, 139, 181–186. [Google Scholar] [CrossRef]
  68. O’Connor, R.S.; Kunin, W.E.; Garratt, M.P.D.; Potts, S.G.; Roy, H.E.; Andrews, C.; Jones, C.M.; Peyton, J.M.; Savage, J.; Harvey, M.C.; et al. Monitoring Insect Pollinators and Flower Visitation: The Effectiveness and Feasibility of Different Survey Methods. Methods Ecol. Evol. 2019, 10, 2129–2140. [Google Scholar] [CrossRef]
  69. Jonsson, M.; Kaartinen, R.; Straub, C.S. Relationships between Natural Enemy Diversity and Biological Control. Curr. Opin. Insect Sci. 2017, 20, 1–6. [Google Scholar] [CrossRef]
  70. Dainese, M.; Martin, E.A.; Aizen, M.A.; Albrecht, M.; Bartomeus, I.; Bommarco, R.; Carvalheiro, L.G.; Chaplin-Kramer, R.; Gagic, V.; Garibaldi, L.A.; et al. A Global Synthesis Reveals Biodiversity-Mediated Benefits for Crop Production. Sci. Adv. 2019, 5, 1–13. [Google Scholar] [CrossRef] [PubMed] [Green Version]
  71. Briggs, S.; Knight, I. The economic case for agroforestry. In The Agroforestry Handbook; Raskin, B., Osborn, S., Eds.; Soil Association Limited: Bristol, UK, 2019; pp. 95–141. [Google Scholar]
  72. Prasifka, J.R.; Hellmich, R.L.; Dively, G.P.; Lewis, L.C. Assessing the Effects of Pest Management on Nontarget Arthropods: The Influence of Plot Size and Isolation. Environ. Entomol. 2005, 34, 1181–1192. [Google Scholar] [CrossRef]
  73. Merckx, T.; Feber, R.E.; Dulieu, R.L.; Townsend, M.C.; Parsons, M.S.; Bourn, N.A.D.; Riordan, P.; Macdonald, D.W. Effect of Field Margins on Moths Depends on Species Mobility: Field-Based Evidence for Landscape-Scale Conservation. Agric. Ecosyst. Environ. 2009, 129, 302–309. [Google Scholar] [CrossRef]
  74. Bennett, A.B.; Gratton, C. Measuring Natural Pest Suppression at Different Spatial Scales Affects the Importance of Local Variables. Environ. Entomol. 2012, 41, 1077–1085. [Google Scholar] [CrossRef] [Green Version]
  75. Pfiffner, L.; Jamar, L.; Cahenzli, F.; Korsgaard, M.; Swiergiel, W.; Sigsgaard, L. Perennial Flower Strips-a Tool for Improving Pest Control in Fruit Orchards; Research Institute of Organic Agriculture: Frick, Switzerland, 2018; pp. 1–16. [Google Scholar]
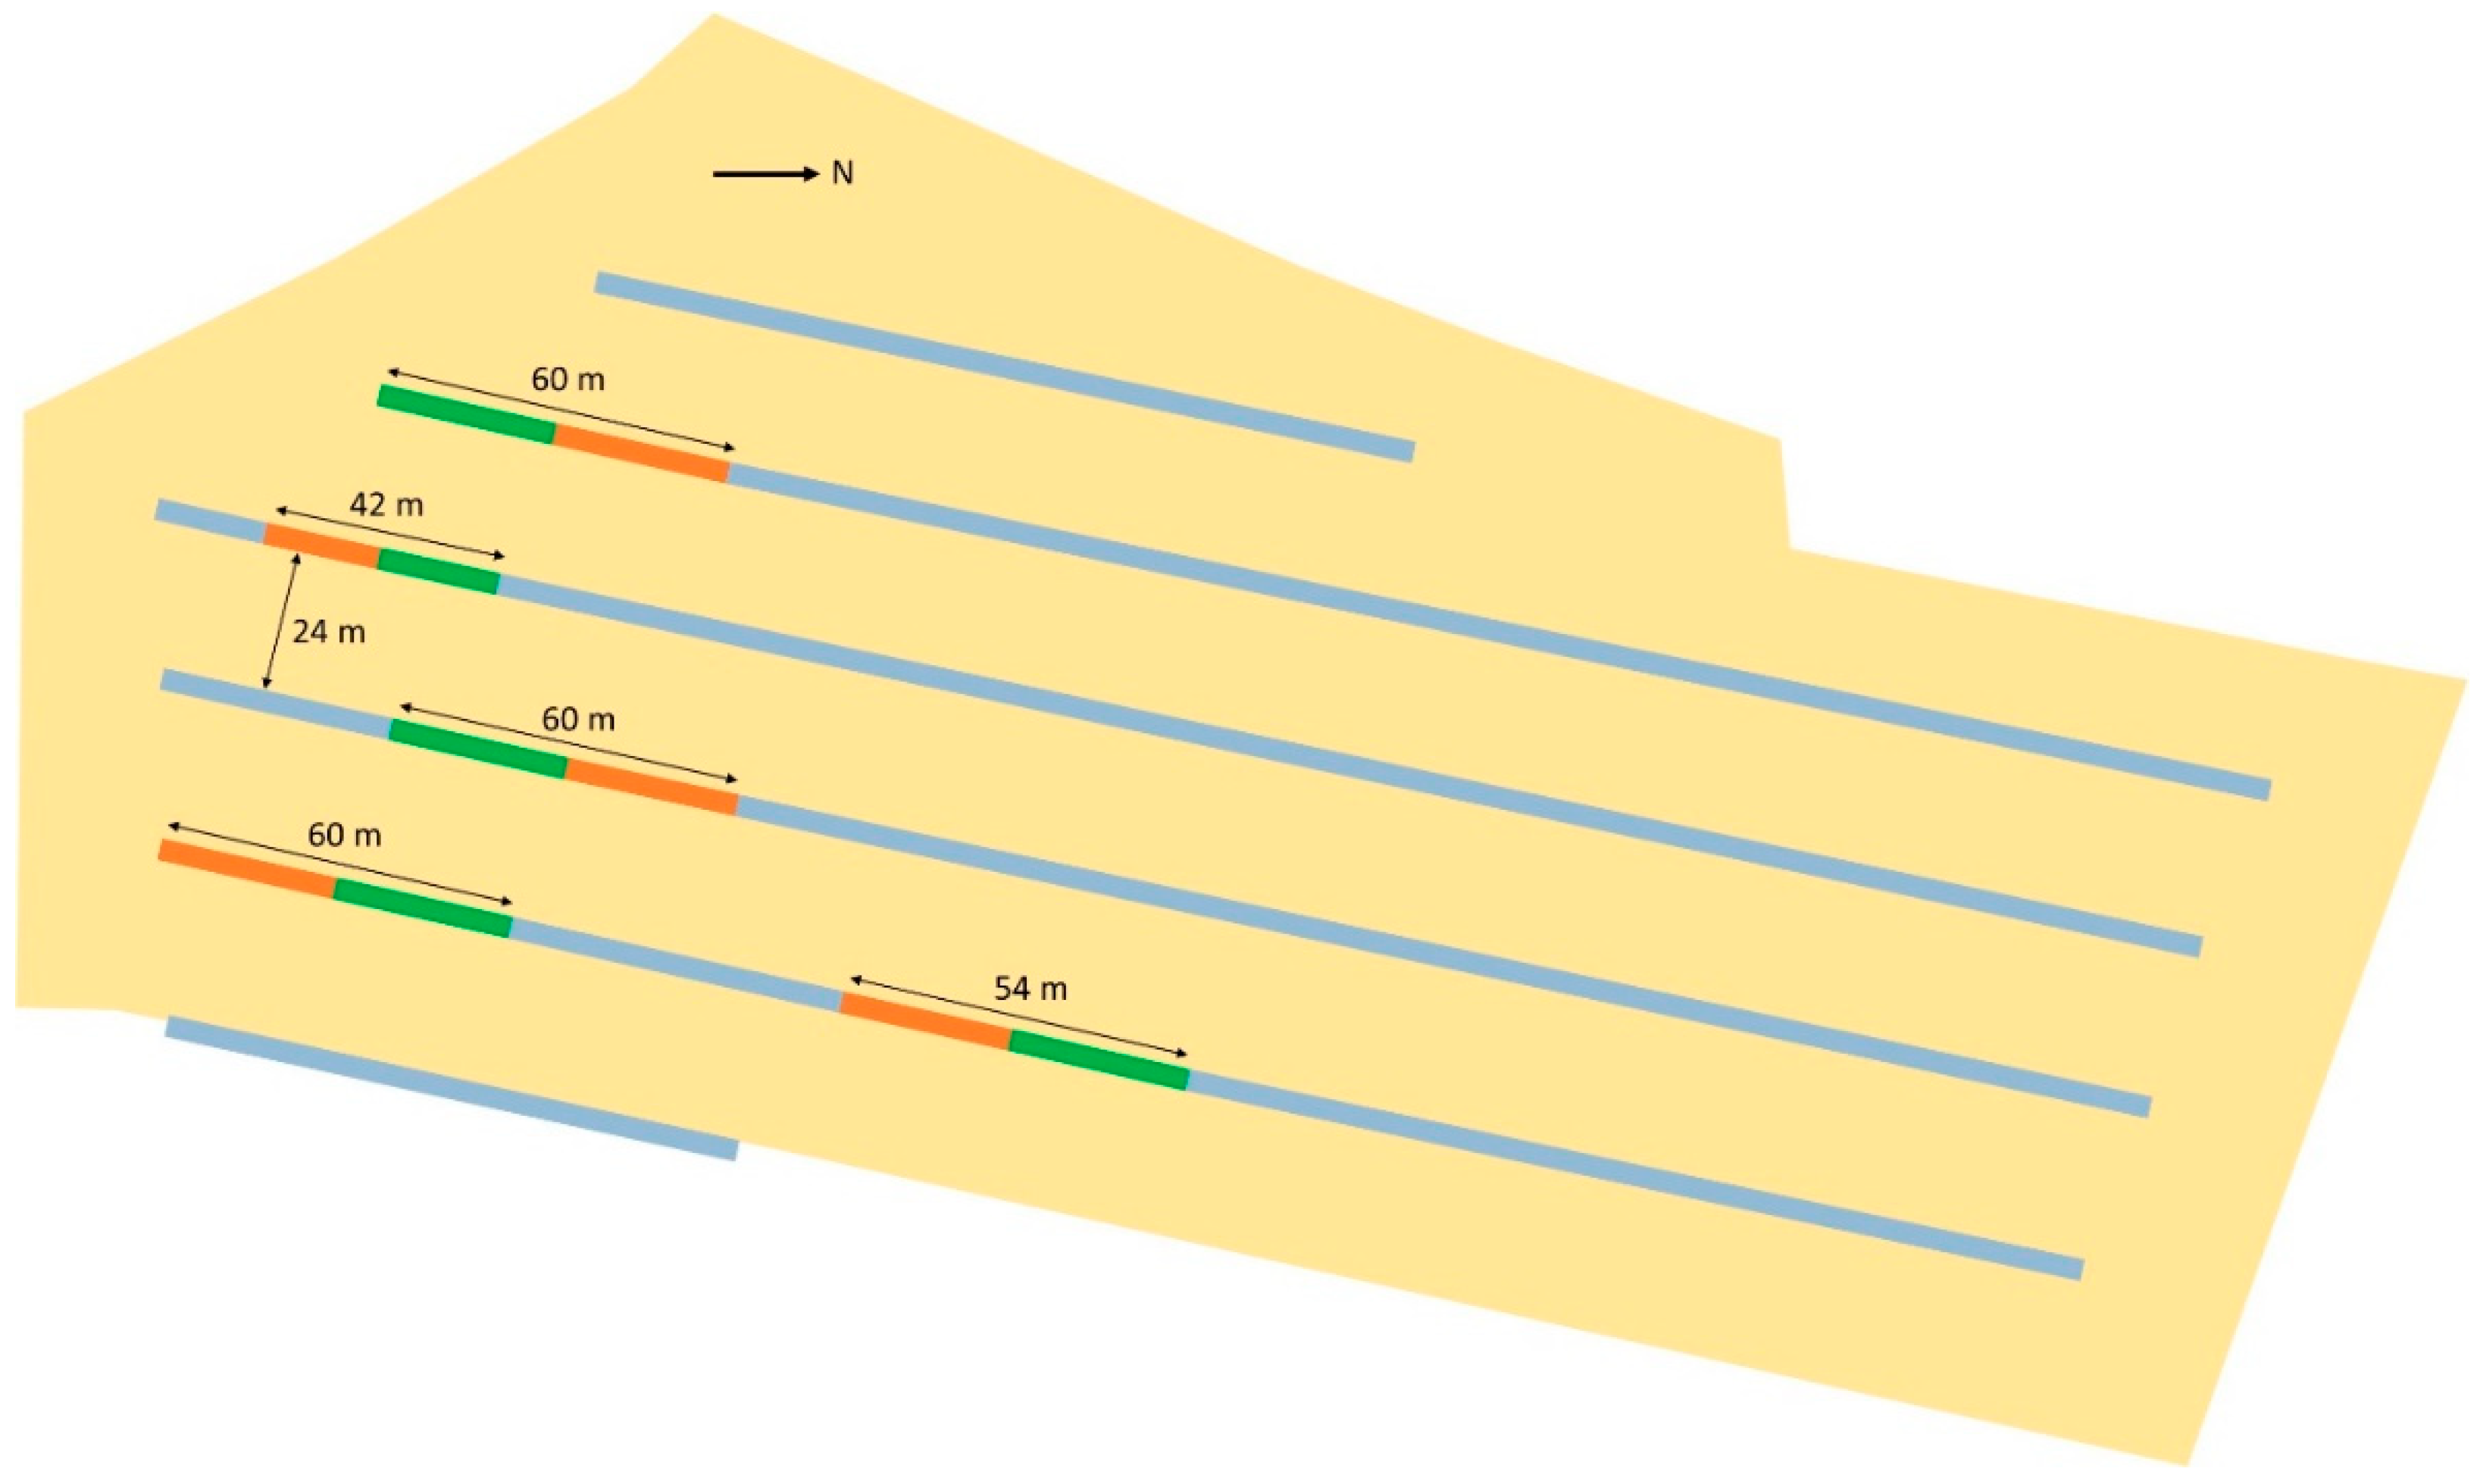
Figure 1. Schematic of the study field, where light orange = arable cropping, green = flowering understorey, orange = mown understorey, light blue = tree rows outside the experimental blocks, but subject to the same management as the flowering understoreys. All tree rows contained the same seed mix; treatments differed only in cutting frequency.
Agronomy 11 00651 g001
Figure 2. Photos of mown (left) and flowering (right) understoreys, taken in June 2020.
Agronomy 11 00651 g002
Figure 3. Arrangement of sampling locations within a representative treatment block. Trees outlined in red were sampled (visual searches for pests and natural enemies, pollinator visitation and seed counts), while the outer three trees (outlined in black) were unsampled buffer areas. The red dots represent sample locations within the adjacent arable alley (pitfall traps and sticky traps). The distance between each tree was 3 m.
Agronomy 11 00651 g003
Figure 4. Number of aphid colonies and natural enemies on apple trees across the season, above mown and flowering understoreys. Bars represent standard errors. Symbols refer to p-values, where * < 0.05, † < 0.1. See Table S6 for model outputs.
Agronomy 11 00651 g004
Figure 5. Effects of understorey management on invertebrate diversity and richness in pitfall traps. Effects are represented by mean difference between flowering and mown treatments, hence points above the dashed line (y = 0) represent higher richness/diversity in arable alleys adjacent to flowering than mown understoreys. Effect sizes and confidence intervals are based on the outputs of mixed models where richness or diversity of each trophic level was the response variable, and the interaction between treatment and month was the fixed effect, with block as a random effect. Symbols refer to p-values, where ** < 0.01, * < 0.05, † < 0.1. See Table S7 for model outputs.
Agronomy 11 00651 g005
Table 1. Summary of sampling techniques used in the study. For further information on sampling methodology, see Table S2.
PurposeSampling TechniqueTemporal Replication
Invertebrate natural enemies and pests in the tree componentVisual searches of treesEight visits between May and July
Apple pest and disease damageVisual pest and disease assessmentOne visit (July for diseases and pests except aphids, September for aphid damage)
Apple pollinatorsFlower visitation countsTwo complete visits plus one partial visit to a block still in flower (late April and early May)
Apple pollinationApple seed counts [38]One visit in September
Apple yieldFruit count and widthOne visit in September
Invertebrate diversity, natural enemies, and pests 1 in the arable componentPitfall traps [39,40]Five visits (April, May, June, July, September)
Sticky trapsThree visits (May, June, July)
Arable yieldGrain samplesOne visit in August
1. Arable pests were defined as those included in AHDB’s field crop pest encyclopaedia [41].
Table 2. Model building specifications, showing which fixed and random effects were applied to each response variable. ‘Treatment’ fixed effect refers to understorey management (flowering or mown). The main effect of treatment was removed from the ‘treatment vs. visit interaction’ model, to test treatment separately for each visit. Bracket symbols represent where the variable was applied to some models within that category.
ResponseSampling MethodsFixed EffectsRandom Effects
TreatmentTreatment vs. Visit InteractionDistance from BoundaryBlockVisit
Pooled aphid colonies in apple trees–seasonal effectsVisual searches
Pooled aphid colonies in apple trees–overall effectsVisual searches
Pooled natural enemies in apple treesVisual searches
Apple damage by aphids, other insects, and scabVisual searches
Pollinator visitation to apple flowersFlower visitation counts
Apple seed countApple seed count
(nested with sample tree)
Apple yieldApple yield
Richness and Shannon diversity (separately for herbivores, natural enemies, pooled invertebrates)Separately for pitfall and sticky traps (●)
Abundances of six arable pest taxaSee Table S4
Pooled aerial insect capturesSticky traps
Arable yieldGrain samples
Table 3. Total numbers of invertebrate specimens and taxonomic groups counted from each sampling method.
Sampling MethodTotal Count/Number of SpecimensTaxonomic Groups
Apple pest and natural enemy visual counts969 127
Pollinator counts1845
Pitfall traps15318121
Sticky traps1189974
1. Aphids were counted by colony rather than per individual.
Table 4. Effects of understorey management on apple damage, according to negative binomial GLMMs. Positive estimated regression parameters represent association with flowering understoreys. ‘Other insect damage’ includes Cydia pomonella, Operophtera brumata, and capsid damage, which were too infrequent to be analysed separately.
Apple DamageEstimateStandard ErrorZ ValueP-ValueR2 MarginalR2 Conditional
Aphids−0.8460.127−6.678<0.0010.0470.155
Other insect damage0.0930.2370.3920.695<0.001<0.001
Scab0.0020.1630.0090.993<0.0010.114
Table 5. Predicted changes in income (GBP/ha of agroforestry) arising from using a flowering understorey relative to a mown understorey. Positive values represent higher income (or less cost) from using the flowering understorey. Flower mix grants are for Countryside Stewardship AB8. The ‘Spartan’ block results should be interpreted with caution, because aphid damage was very low (<1%).
Apple VarietyPredicted Increase in Income from Reduced Apple Yield Loss to AphidsIncome from Flower Mix GrantReduction in Mowing CostsTotal Predicted Increase in Income from Flowering Understoreys Relative to Mown Understoreys
Lord Derby580.2253.9013.50647.62
Spartan−11.6955.71
King of the Pippins−32.2335.17
Bramley’s Seedling173.72241.12
D’Arcy Spice108.07175.47
Mean163.6253.9013.50231.02
Publisher’s Note: MDPI stays neutral with regard to jurisdictional claims in published maps and institutional affiliations.