Article

Rotation and Fertilization Effects on Soil Quality and Yields in a Long Term Field Experiment

Department of Agricultural and Food Sciences, Alma Mater Studiorum University of Bologna, 40127 Bologna, Italy
*
Author to whom correspondence should be addressed.
Agronomy 2021, 11(4), 636; https://doi.org/10.3390/agronomy11040636
Submission received: 22 February 2021 / Revised: 4 March 2021 / Accepted: 25 March 2021 / Published: 26 March 2021
(This article belongs to the Section Farming Sustainability)

Abstract

:
Understanding the complex relationships among soil quality, crop productivity, and management practices would help to develop more sustainable agricultural production systems. In this study, we investigated the combined effects of crop rotations and fertilization treatments on soil quality and crop yield in a long term (about 50 years) field experiment. Crop rotations included continuous corn (Zea mays L.), a 2 year corn-wheat (Triticum aestivum L.) rotation, and a 9 year corn-wheat-corn-wheat-corn-wheat-alfalfa-alfalfa-alfalfa (Medicago sativa L.) rotation. Fertilization treatments included control, mineral fertilization with urea and triple superphosphate, and amendment with cattle manure. Crop rotations and fertilization treatments were combined in a factorial experimental design with two replications for each rotation and six replications for each fertilization treatment. The continuous corn and the corn-wheat rotations had negative effects on the main soil quality indicators considered (carbon (C) and nitrogen (N) pools, microbial biomass and activity). On the contrary, the 9 year rotation had positive effects on soil organic carbon (+24%) and total nitrogen (+23%) but resulted in impoverished available P (−5%). Positive effects on soil microbial biomass (+37% of microbial biomass C and +23% of microbial biomass N) and activity (+19%) were also observed. Soil amendment with manure built up soil organic carbon (+13%), increased nutrient content (+31% of extractable C and +19% of extractable N), including that of available P (+47%), and stimulated microbial growth (+34%) and activity (+8%). As compared to manure, mineral fertilization increased the soil nutrient content to a lesser extent. This study showed that the combined use of rotations, including legume forage crops, and soil amendment with manure may help preserve soil quality and crop productivity in the long term.

1. Introduction

Crop rotation and manure application have been fundamental components of farming for centuries. With the increased production of mineral fertilizers during the mid-20th century, extensive crop rotations relying on organic soil amendments were supplanted by intensive monocultures or short rotations. However, these intensively managed systems brought along soil quality degradation problems and increased production costs [1]. The 21st century has seen growing awareness that, besides providing food, agricultural production systems should also preserve the quality of soils and their ability to provide environmental services [2,3].
The impact of continuous monoculture systems varies depending on many factors such as crop type, climate, and soil characteristics, and it is generally negative in terms of soil functioning [2,4,5]. Crop rotations are therefore essential components for the development of sustainable agricultural production systems [6,7]. In general, crop rotations help to preserve soil quality, improving properties such as soil structure and organic matter (OM) content [2]. Crop rotations also provide better weed control, increase crop water and nutrient use efficiency (NUE), and reduce diseases pressure, with positive effects on crop yield [8].
Legume forage crops are commonly used in rotations as a source of nitrogen (N) for a following non legume crop and for maintaining soil N levels. Atmospheric nitrogen (N2) fixation by legumes is in the range of 24–250 kg N ha−1 per season, with alfalfa (Medicago sativa L.) showing the highest fixation rate [9]. Furthermore, deep-rooted legume crops, such as alfalfa, are able to reach deep residual soil N and increase N availability to subsequent shallow-rooted crops [1]. The positive effects of rotations, including forage legumes, go beyond an improvement of N availability. Inclusion of legume forage crops in the rotation increases soil stability, soil porosity, and available soil water [10]. Furthermore, the low carbon-to-nitrogen (C:N) ratio of organic residues derived from forage legumes combined with greater temporal diversity in cropping sequences and with a reduced tillage frequency may increase the retention of soil C and N [7]. Therefore, growing grain crops in rotations that include forage legumes as alfalfa may be a more sustainable practice than growing grain crops in either monoculture or short rotations [1].
Long term soil amendment with manure in some cases could lead to phosphorus (P) accumulation and losses due to excessive application in respect to crops demand [11], to heavy metals accumulation such as copper and zinc [12], and to potentially toxic organic contaminants, e.g., antibiotics and hormones [13]. However, in many other cases, soil amendments with manure have been associated with improved soil properties such as increased soil organic carbon (SOC) content, total nitrogen content (TN), and enhanced pH. Specifically, in long term (from 14 to 44 years) experimental fields located in Nothern Italy has been observed an increased SOC content by 13–35%, increased TN content by 20–30%, and enhanced pH by 4–9% [14,15,16,17]. Soil organic matter is thought to drive the productivity and the sustainability of agricultural systems, as it provides an N reservoir and increases soil water holding capacity (WHC) and soil levels of nutrients.
When changing land use from continuous monoculture to a complex crop rotation, a key soil quality indicator, such as soil organic matter (SOM) content, may require more than 40 years to reach a new equilibrium [18]. Similarly, the effects of reduced tillage frequency and organic soil amendment may take decades before being detectable [19,20]. Therefore, long term field experiments are required to predict soil management impacts on soil quality and provide leading indicators of sustainability [21].
An appropriate crop rotation can increase or maintain SOM and improve soil chemical and physical properties. The rational application of manure and fertilizers can also contribute to an increase in soil nutrients and/or soil C stock, with positive effects on soil quality. Furthermore, both crop rotation and manure amendments have been shown to improve grain yield as compared to continuous cropping systems treated with mineral fertilizers [8,22,23,24]. However, the combined effect of different management practices is more complex and less studied. According to Norris and Congreves (2018) [3], we hypothesize that these practices could be properly combined into a management system with an additive or synergistic effect on soil quality and crop productivity [3].
We therefore investigated the residual effects of long term crop rotations and fertilization treatments on soil quality and crop production in a sub-humid temperate agroecosystem of the Po valley (Italy) for sustainable agriculture. We hypothesized that, after a long term period, crop rotation including legume forage and manure amendment would positively impact soil quality by increasing SOM and stimulating soil microbial biomass and activity, with positive effects also on crop yield.

2. Materials and Methods

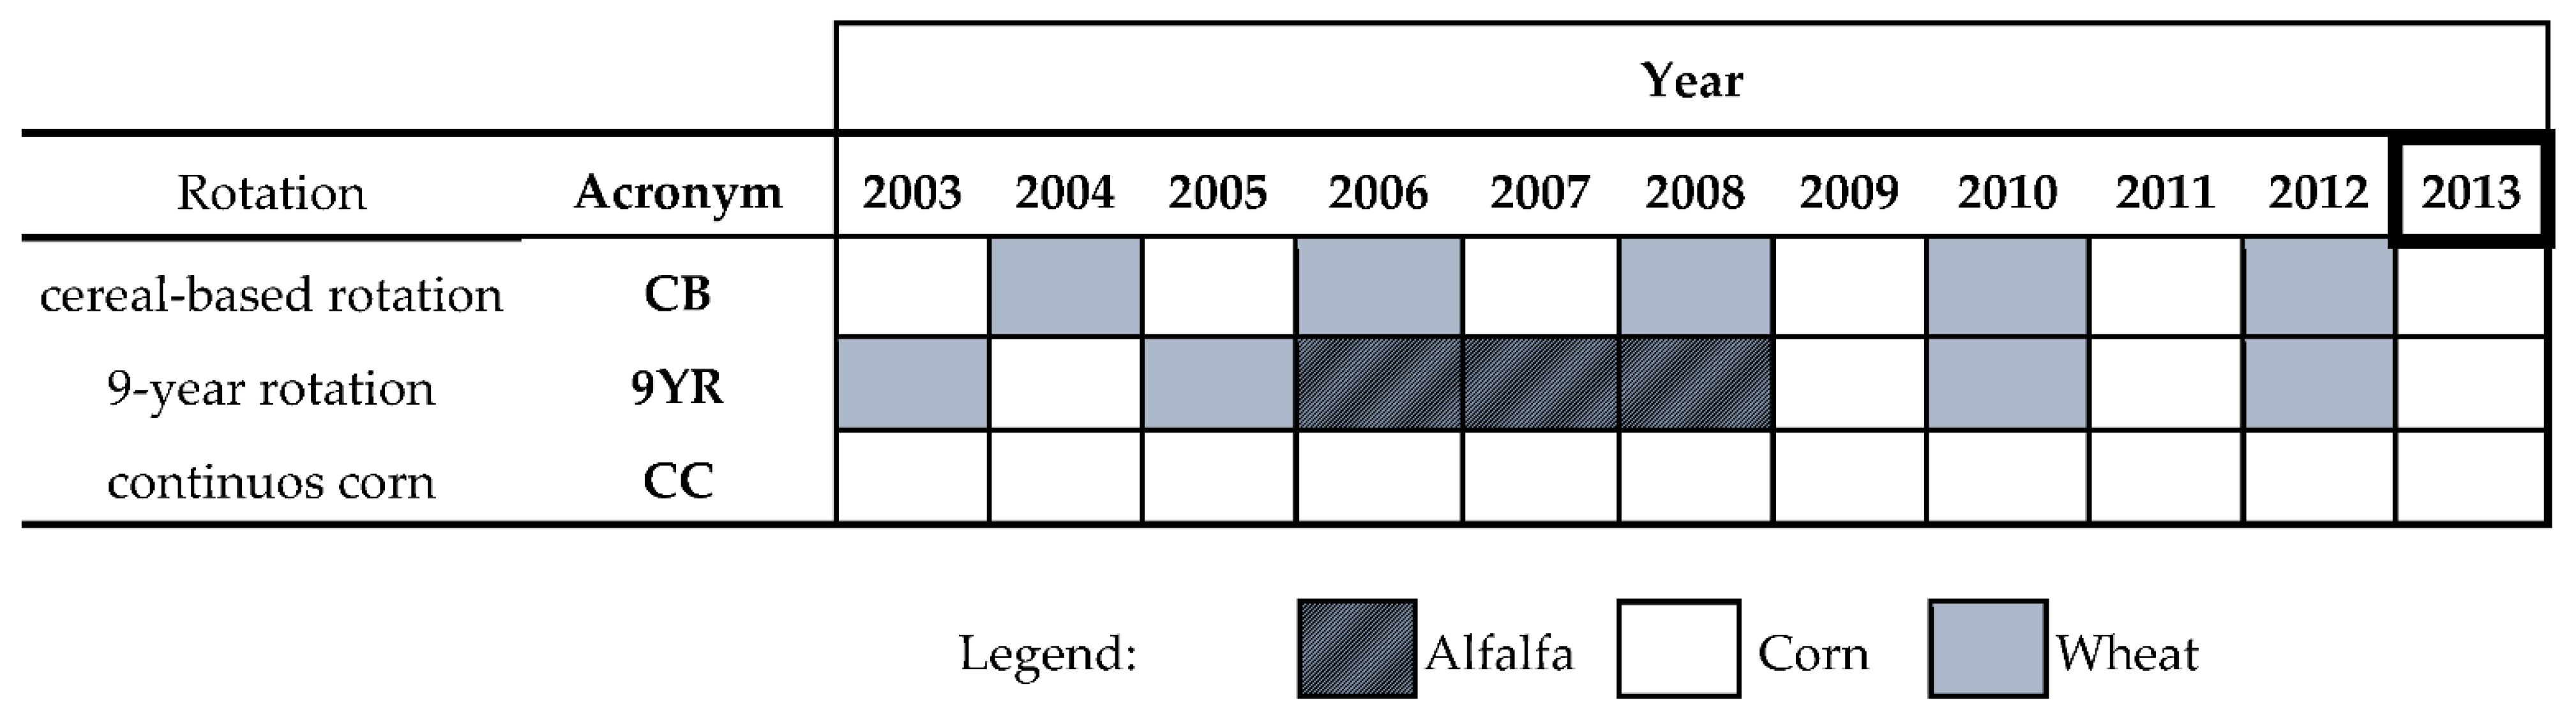
2.1. Study Site and Experimental Design

The study site was a long term field experiment started in 1966 at the University of Bologna Experimental Farm in the southeast of the Po valley (Italy, 44°33′ N, 11° 24′ E; 23 m a.s.l.), where the climate is humid subtropical (Cfa, Köppen classification), and the mean annual precipitation and temperature for the area are 747 mm and 14.2 °C, respectively.
The soil was a fine silty, mixed, mesic Udic Ustochrept (USDA Soil Taxonomy, 1999) and, in 1966, it had 7.7 g kg−1 of SOC, 1.1 g kg−1 of total N, a C:N ratio of 7.0, 19 mg kg−1 of available P, a pH in water of 6.9, and trace of carbonates [25].
The experimentation consisted in a long term comparison of three agricultural rotations and three fertilization treatments (Figure 1), which were combined in a split-plot design with two replications for each rotation (main plots) and six replications for each fertilization treatment (sub-plots of 52 m2).
The three rotations tested were:
  • CC: continuous corn (Zea mays L.);
  • CB: 2 year cereal-based rotation of corn (Zea mays L.) and wheat (Triticum aestivum L.);
  • 9YR: 9 year rotations consisting of corn-wheat-corn-wheat-corn-wheat-alfalfa-alfalfa-alfalfa (Medicago sativa L.).
Since the setup of the experiment, five rotation cycles were completed and the sixth was at its second year (Figure 1). Therefore, soil sampling occurred in the same day, after the harvesting of corn.
Fertilization treatments included:
  • CK: unfertilized control;
  • NP: mineral N and phosphorous (P) fertilization;
  • M: cattle manure fertilization.
In the NP fertilization treatment, N was supplied to grain crops as urea at the annual rate of 120 kg N ha−1 under corn cultivation and of 75 kg N ha−1 under wheat cultivation. Urea was supplied in two applications: 30% at the end of tillering and 70% at the beginning of stem elongation in wheat; 50% at seeding and 50% at the fourth leaf stage in corn. The alfalfa phase of the 9 year rotation received no N fertilizer. Phosphorous was supplied at seeding as superphosphate every other year for grain crops and in the first year of cultivation for alfalfa. The rate was 50 kg P2O5 ha−1 for grain crops and 75 kg P2O5 ha−1 for alfalfa. In the M treatment, 4.5 Mg dry matter ha−1 of cattle manure was supplied every other year for grain crops and in the first year of cultivation for alfalfa. Expressed as a percentage of its dry weight, cattle manure contained in average 33% of organic C, 2.6% of total N, and 1.0% of total P, with a C:N ratio of 12 [26].
The soil was yearly mouldboard ploughed to 0.4 m depth, approximately, within the end of September, with the exception of the years cultivated with alfalfa, which is ploughed only once every three years before its seeding. Wheat straw and corn stalks were always removed from the field soon after harvest. The crops were cultivated in agreement with the typical practices in use in Northern Italy, and more details are reported elsewhere [17].

2.2. Soil Sampling and Analysis

In September 2013, after harvesting and before soil management, nine surface soil samples (0–20 cm) were collected from each plot (52 m2) with an auger and combined to form one composite sample, thus obtaining a total of 18 samples. Freshly sampled soil was sieved at 2 mm and thoroughly mixed. Soil water content was determined by drying soil samples to constant weigth at 105 °C. Soil pH was measured using a glass electrode in 1:5 (v:v) suspensions of air dried soil in 10 mM CaCl2. Soil organic C and total N (TN) were determined on air dried, finely ground soil aliquots with an elemental analyzer (CHNS-O Elemental Analyzer 1110, Thermo Scientific GmbH, Dreieich, Germany). Ammonium (NH4+-N) and nitrate (NO3-N) nitrogen were determined by an automatic analyzer (AACE 5.46, Bran Luebbe GmbH, Norderstedt, Germany) using the ISO 14256-2 method (2005) [27]. Soil available P (POlsen) was determined following the method reported by Olsen et al. (1954) [28].
Soil extractable carbon (Cext) and N (Next) as well as microbial biomass C (MBC) and microbial N (MBN) were determined using the chloroform-fumigation extraction method [29]. The soil microbial activity was determined as the hydrolysis rate of fluoresceine diacetate (FDA) using the method reported by Swisher and Carroll (1980) [30]. The activity of 8 soil extracellular hydrolytic enzymatic activities was determined using 4-methylumbelliferone (MUF) conjugates (Table S1) following the procedure reported by Giacometti et al. (2014) [31]. Rates of fluorescence increase were converted into enzyme activity (nmol MUF g−1 h−1) according to German et al. (2011) [32]. The specific soil enzymatic activities were calculated by dividing the enzymatic activity with the MBC, and they can be considered an index of soil quality [33,34,35]. Using the natural logarithm of the soil enzymatic activities involved in C, N, and P cycles, the soil ecosystem ratios of C:N, C:P, and N:P acquisition activity (enz C:N, enz C:P, enz N:P) were calculated according to Sinsabaugh et al. (2008) [36]. Finally, crop yields were determined by harvesting the central part of each plot. Corn yield in 2013 was expressed as grain on dry weight.

2.3. Data Handling and Statistics

Results of soil analysis were expressed on oven-dried basis. All statistical analyses were carried out in the R environment [37]. For each soil parameter, a split-plot ANOVA was used to evaluate the effects of the two factors, rotation and fertilization, as well as their interaction. Means were separated by calculating Fisher’s least significant difference (LSD) test. Marginal means of interaction between rotation and fertilization were not reported, as the statistical analysis did not highlight significant differences. The principal component analysis (PCA) was done using the “princomp” function in the R environment using the correlation matrix (Table S2). The scores of the main principal component (PC) were analysed with a split-plot ANOVA in order to determine the dominant discriminating factor (rotation or fertilization) for each PC [38].

3. Results

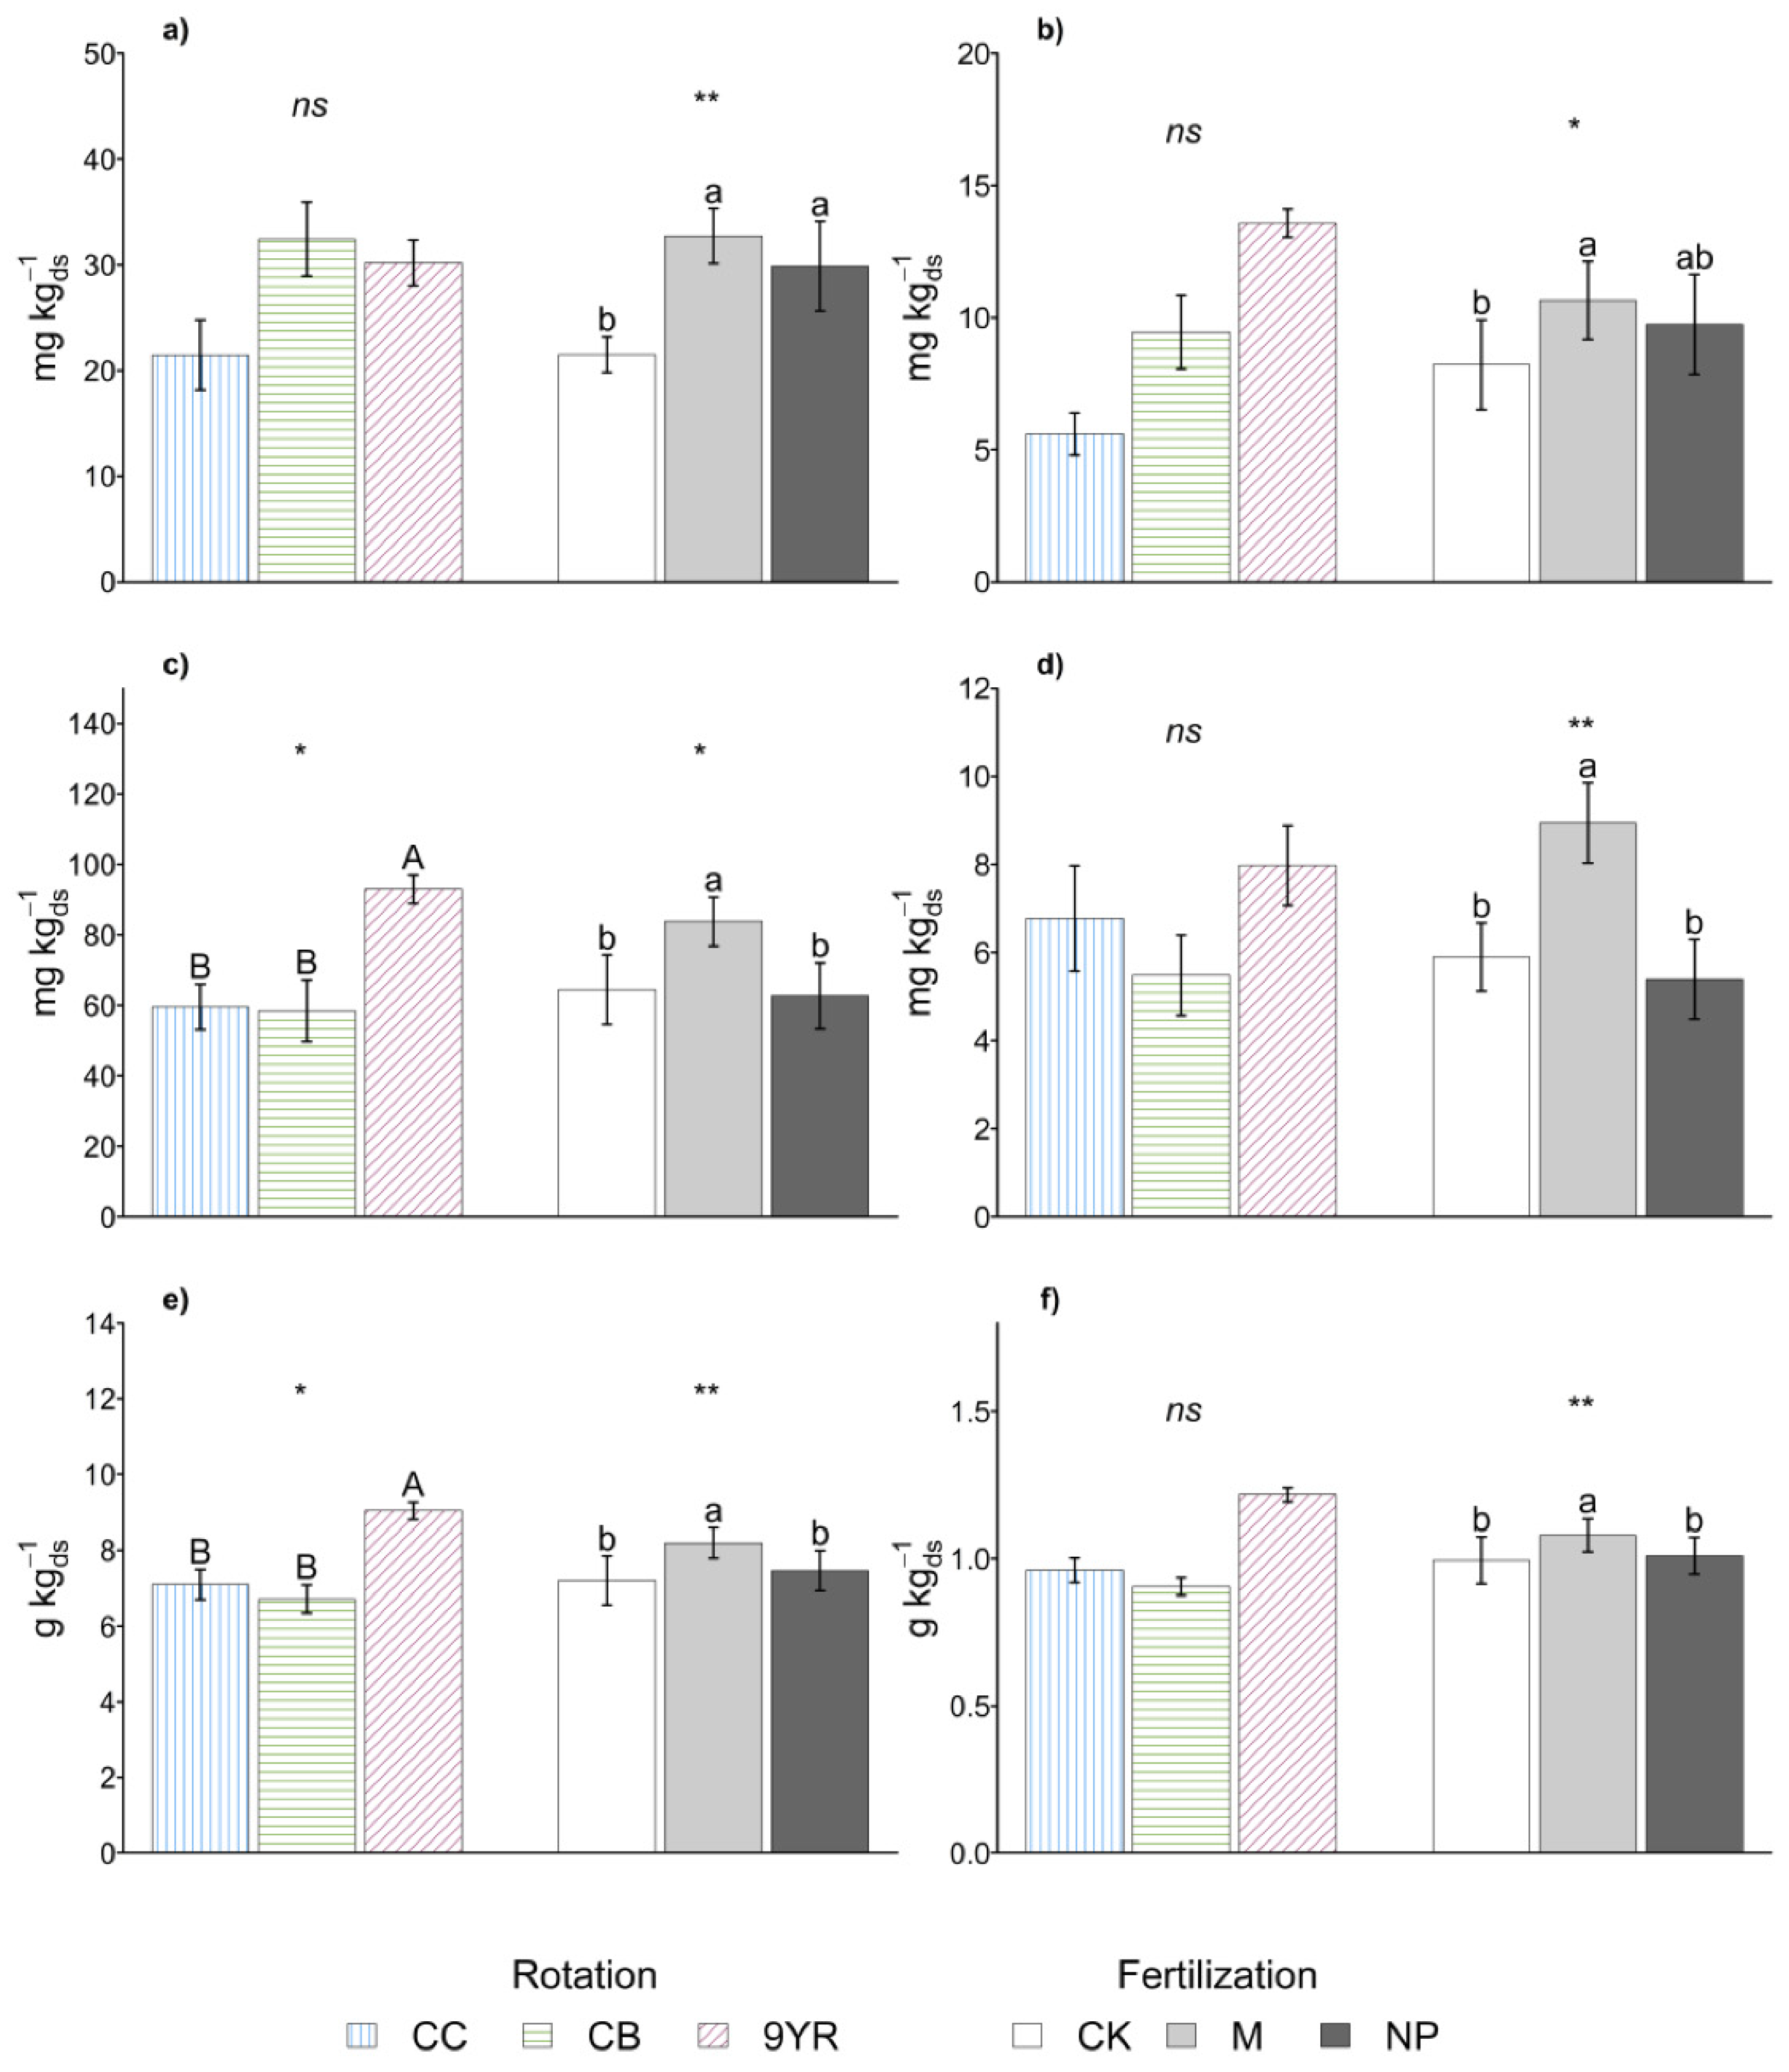
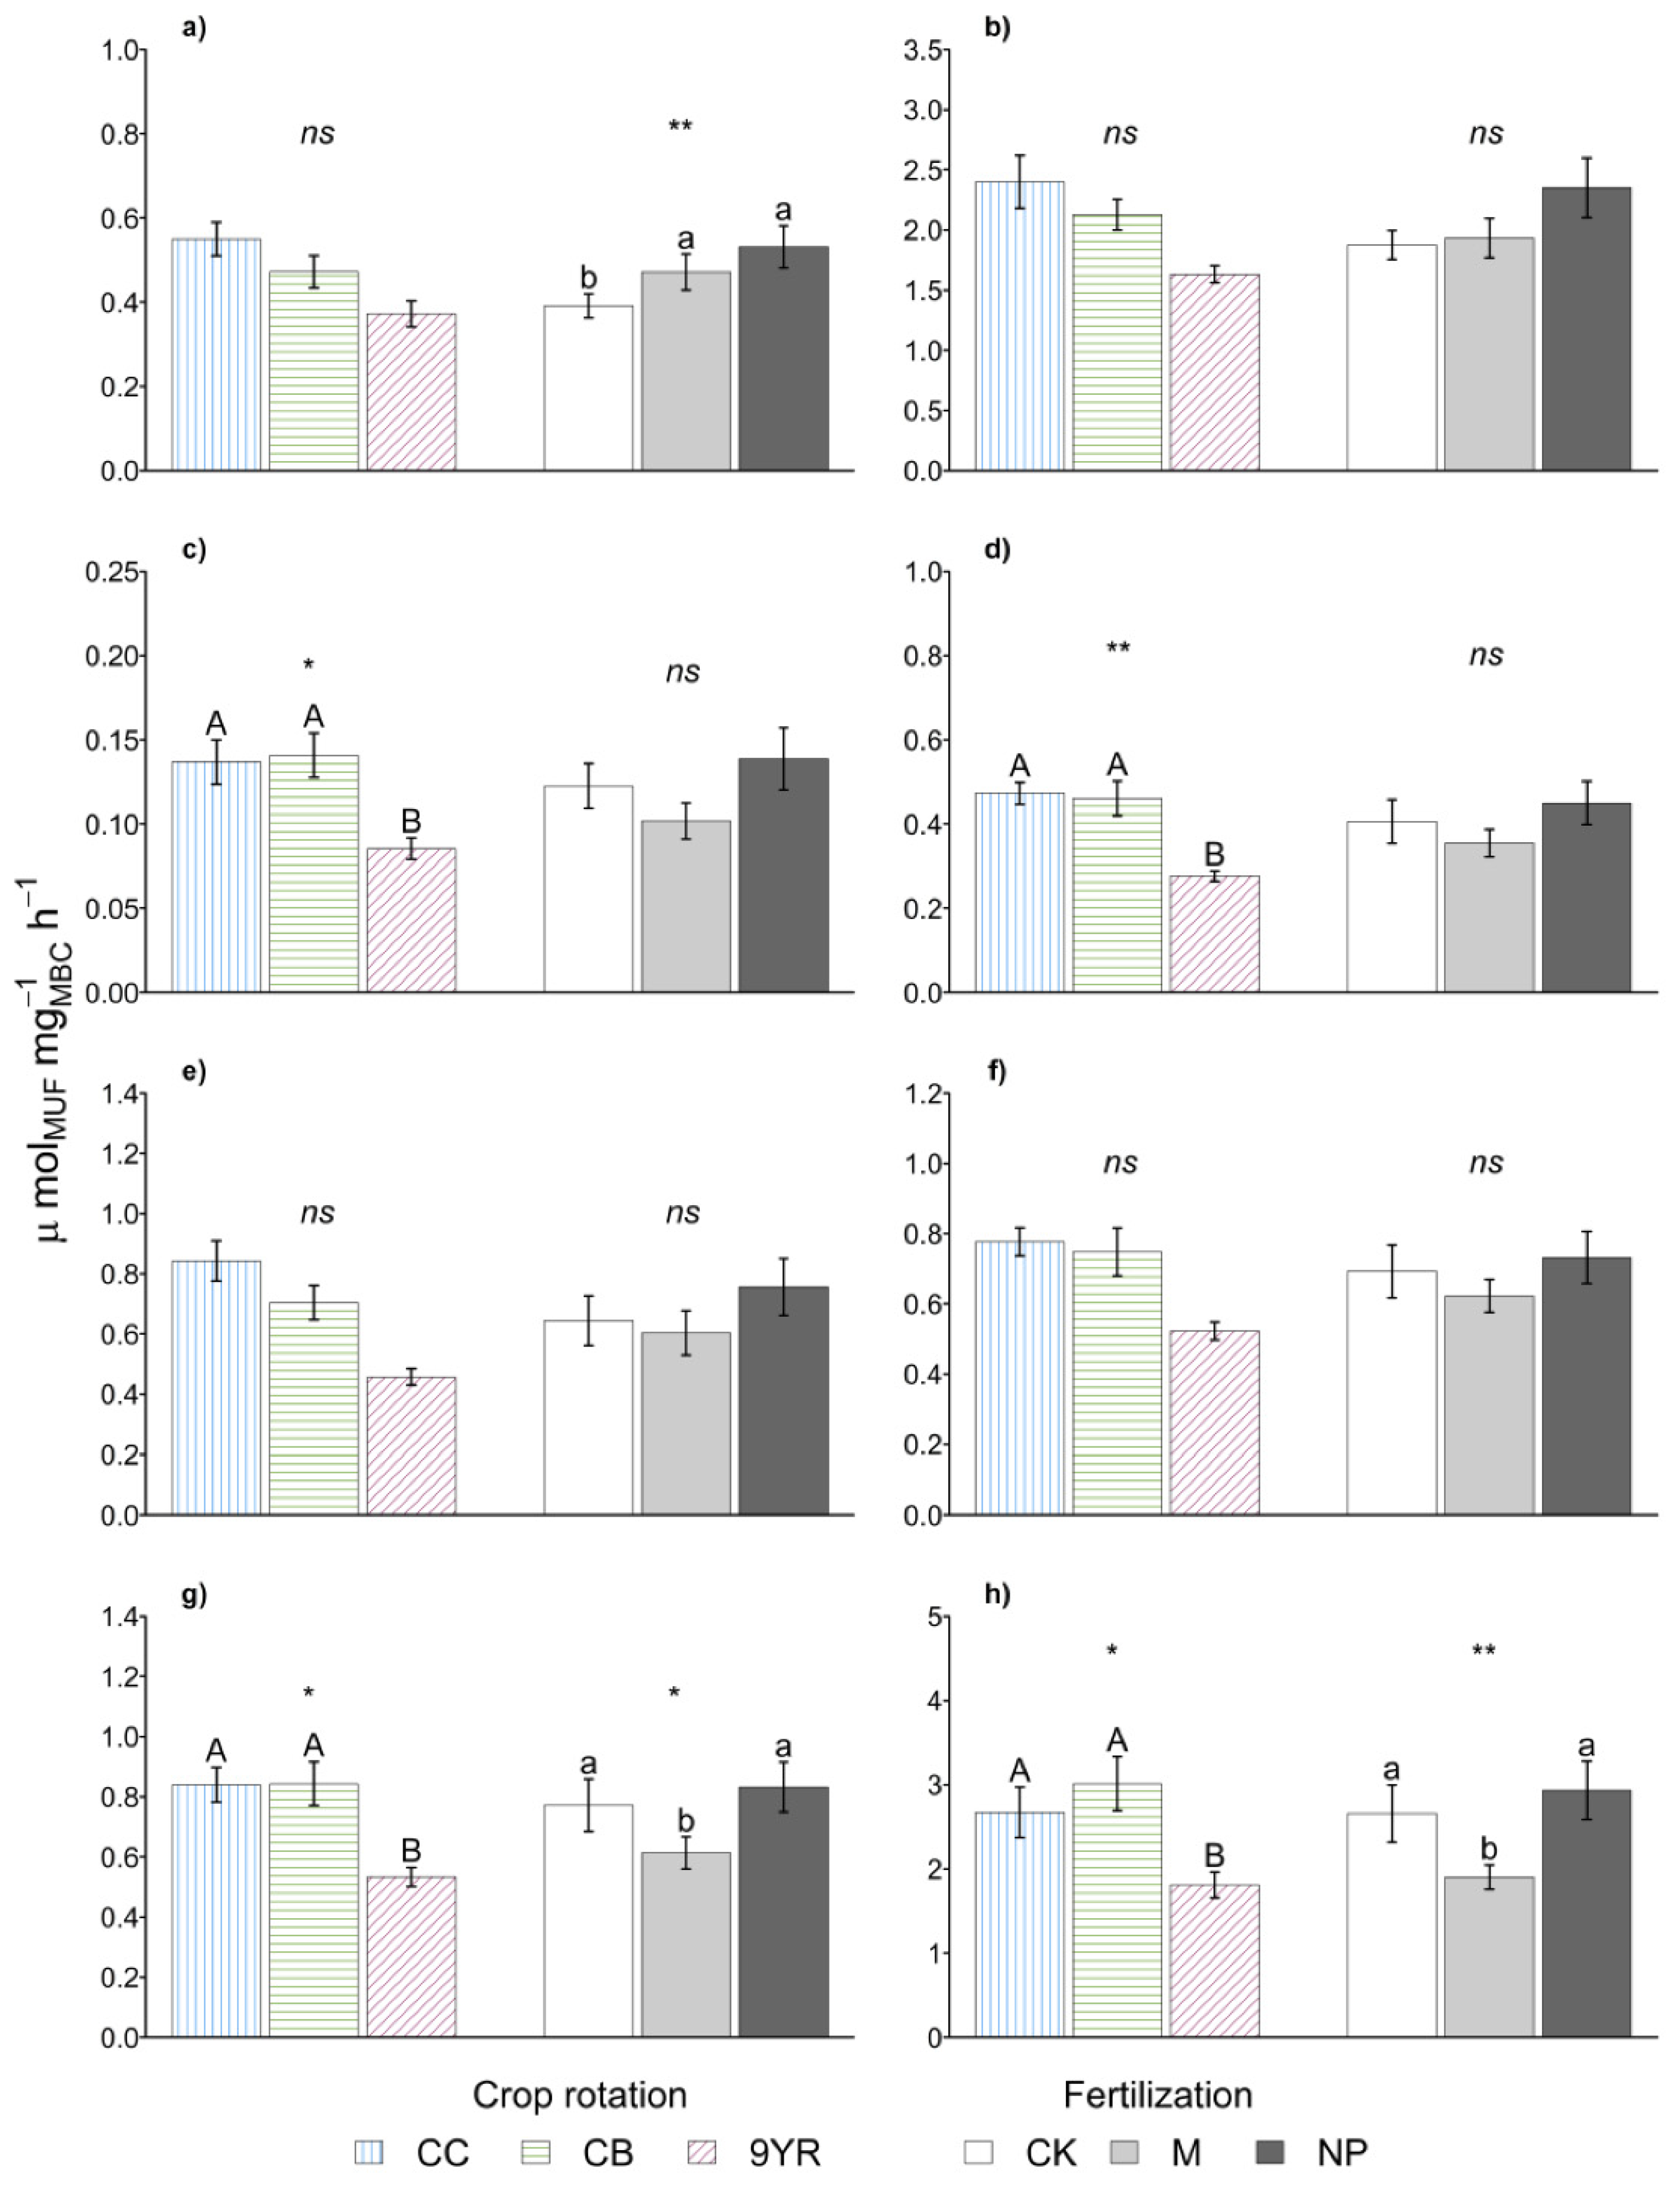
3.1. Crop Rotations Effects on Soil Biochemical Indicators

Crop rotations impacted more on soil C than N pools (Figure 2). Specifically, with the 9YR rotation, the MBC and the SOC content increased by up to 37% and 24%, respectively (Figure 2c,e), compared to the other rotations. A similar trend could be observed also for total and microbial N pools (Figure 2d,f) that increased by up to 23% with the 9YR vs. the other two crop rotations. Instead, crop rotations did not significantly affect the labile fraction of soil C and N (Figure 2a,b); decreased Cext and Next contents (−46% and −106%, respectively) were observed with CC rotation compared to the other rotations studied.
Different crop rotations did not show a statistically significant impact on the other biochemical parameters measured (Table 1). However, some of these parameters (NO3-N, MBC:SOC, and yield) had p-values close to the level of significance (α = 0.05). Specifically, in correspondence of the 9YR rotation soil, NO3-N content and MBC:SOC ratio increased by up to 50% and 18%, respectively, and yields were reduced by 34% in correspondence of the CB rotation.
As for the biochemical parameters, the soil enzymatic activities (Table 2) and the derived soil ecosystem ratios (Table 3) were not affected by the crop rotations factor. Instead, the calculated specific soil enzyme activities (Figure 3) showed the higher values in continuous corn and cereal based rotations, while the 9YR highlighted the lowest specific activities. Significant differences between the rotations were determined only for specific α-glucosidase, β-xylosidase, phosphodiesterase, and phosphomonoesterase activities, while in the other cases, the same trend was observed.

3.2. Fertilization Treatments Effects on Soil Biochemical Indicators

Soil C and N pools were significantly affected by the fertilization treatments (Figure 2). Specifically, lower values of the extractable pool (Figure 2a,b) were measured under unfertilized CK plots, while both the fertilizers applied enhanced Cext (29%) and Next (17%) content. The other two C and N pools (microbial and total, Figure 2c–f) showed the same response with higher values measured in soil amended with manure, while no significant differences were observed between the untreated control and the NP fertilization treatment. Specifically, manure addition led to increases of MBC and MBN content of 27% and 40%, respectively, while it induced increases of SOC and TN contents that were only of 13% and 9%, respectively.
C:N ratio, NH4+-N, and MBC:SOC ratio did not show significant differences for the fertilization treatments (Table 1); on the contrary, soil pH, NO3-N, and POlsen concentrations as well as FDA were higher with manure addition. Finally, corn yield results highlighted lower values in the control without differences between the other two fertilization treatments.
The activity of the investigated hydrolases (Table 2) showed significant differences only for the fertilization treatments. Specifically, the activities of β-cellobiosidase, β-glucosidase, β-xylosidase, and arylsulfatase peaked under the manure addition. Similarly, the ecosystem ratios, which are based on the enzymatic activity values, showed significant differences only in relation to the treatments with higher C:P and N:P, corresponding to those plots that received manure (Table 3).
Finally, fertilization treatment significantly affected the soil specific enzymatic activities, with manure addition that induced the lower specific phosphodiesterase and phosphomonoesterase activities (Figure 3). The other specific soil enzymatic activities showed the same trend with the exception of the specific β-cellobiosidase activity, in which a lower value was observed in the untreated control.

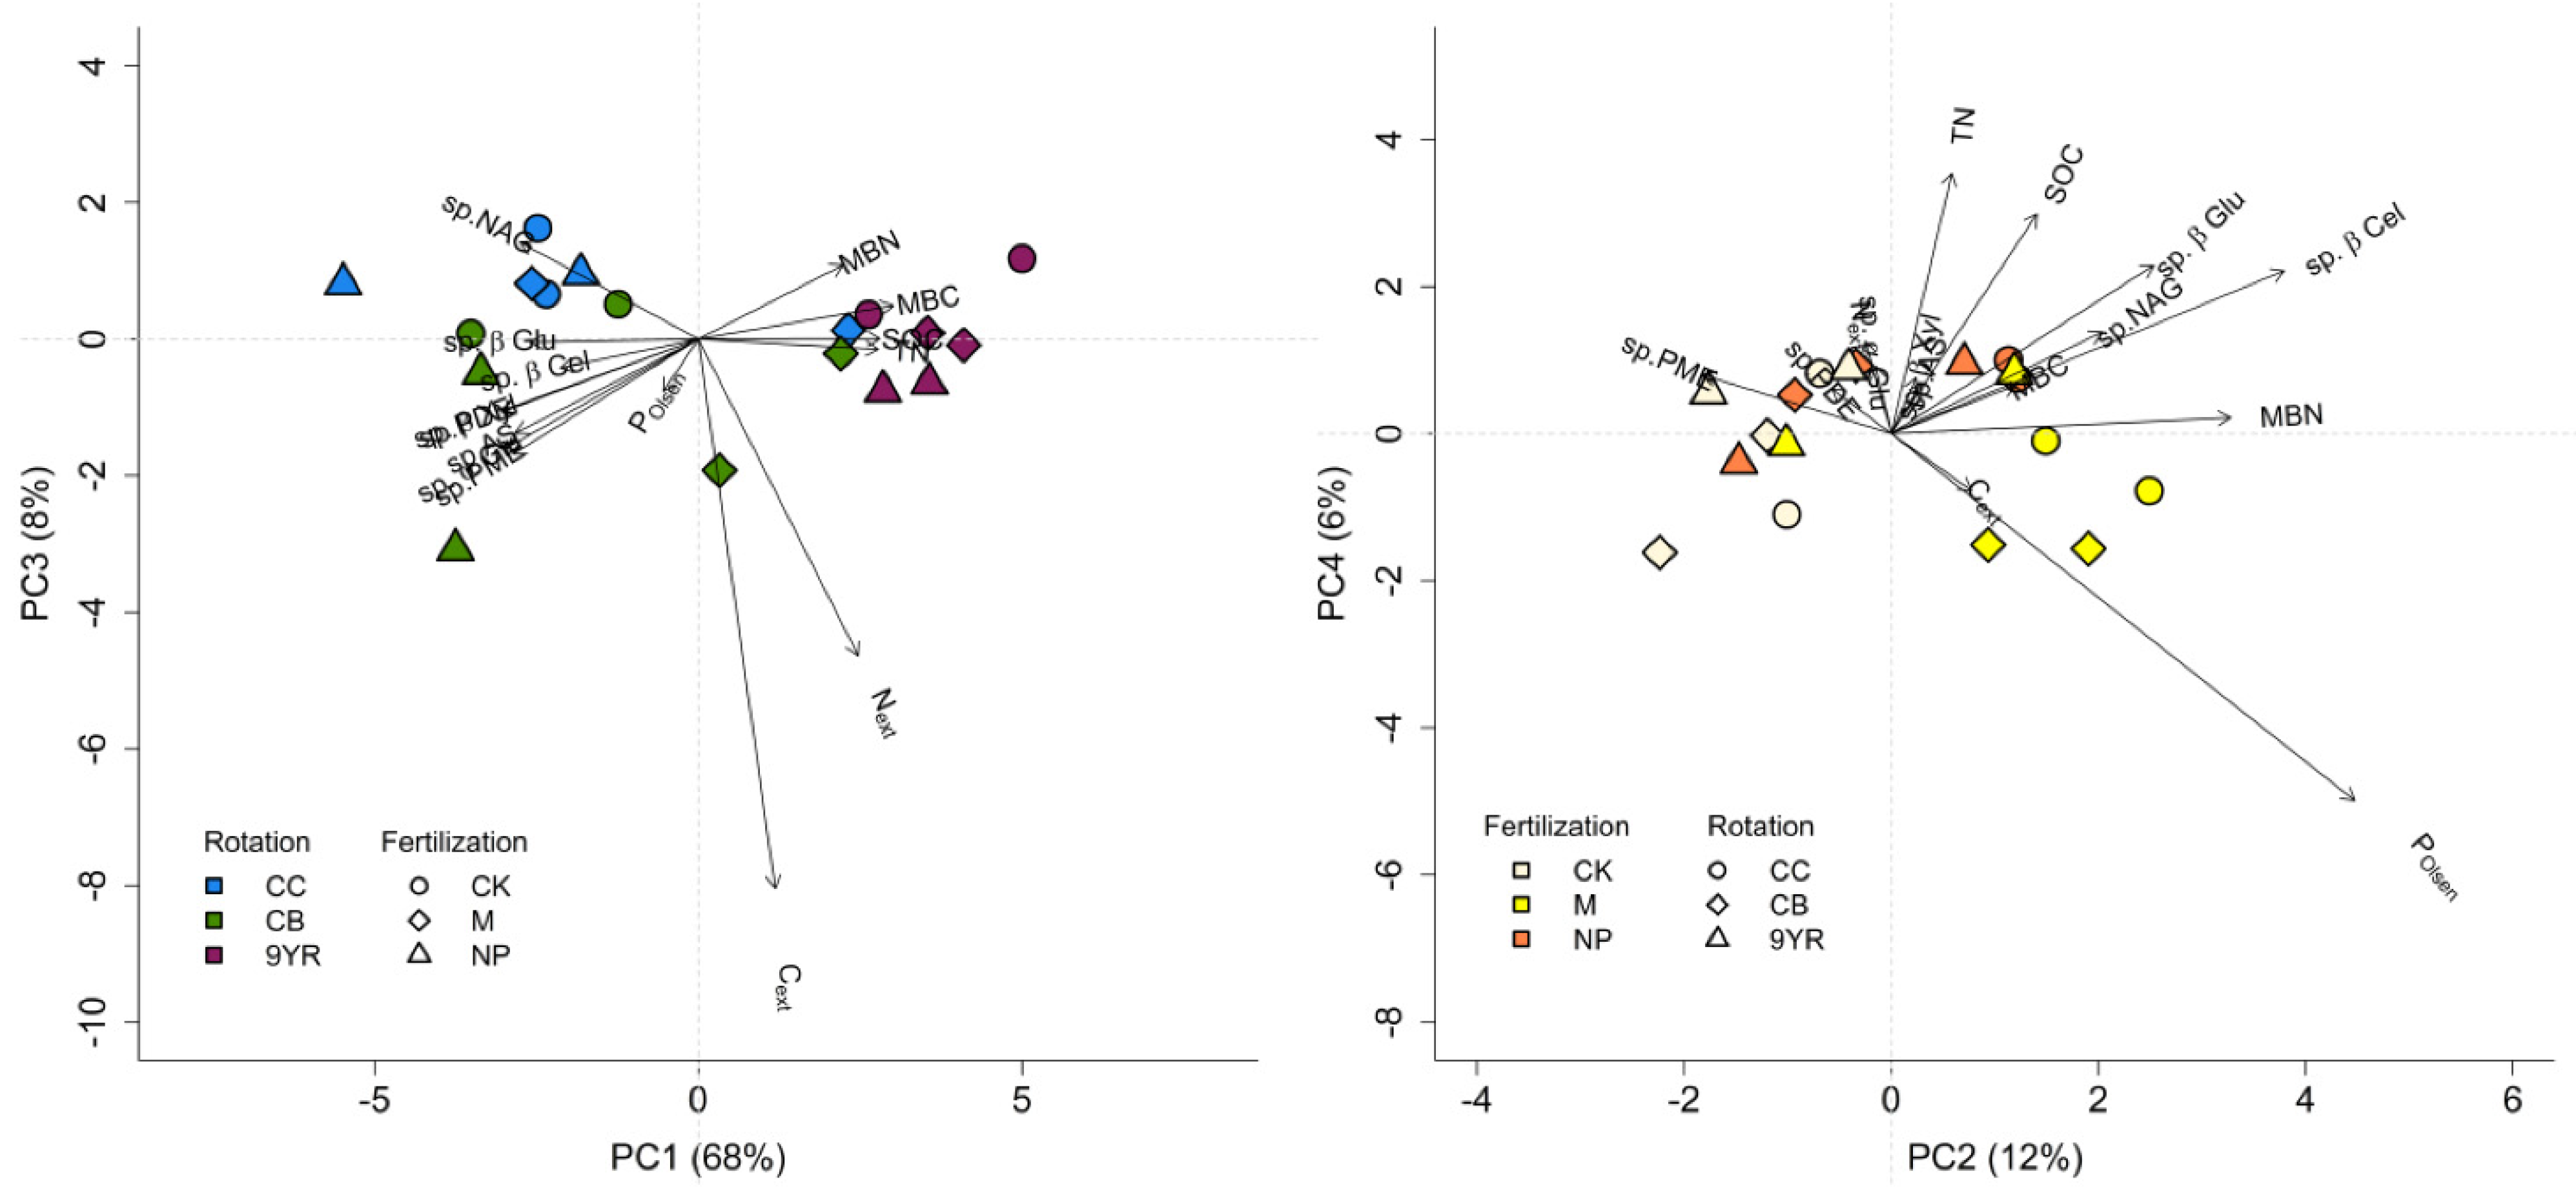
3.3. Principal Component Analysis

The principal component analysis was carried out on Cext, Next, SOC, TN, MBC, MBN, and POlsen, and all the specific enzymatic activities were measured.
The PCA showed that the first two principal components accounted for 68% and 12% of the total variance, respectively (Table 4). However, evaluating through an ANOVA the discriminating factors dominance on the PC of the considered factors (rotation and fertilization), it emerged that rotation significantly impacted PC1 and PC3 (p-value < 0.001 and 0.022, respectively), while fertilization resulted in lower p-values (0.003 and 0.018, respectively) in correspondence to PC2 and PC4 (Table 4).
Therefore, the PCA plot (Figure 4) was done according to the ANOVA results. The left panel of Figure 4 highlights the separation of the 9YR rotation from the CC and the CB rotations; the CC and CB rotations resulted to be mainly characterized by the specific hydrolytic enzyme activities, while the 9YR rotation appeared to be mainly defined by soil microbial biomass (MBC and MBN), SOC, and TN parameters. In the right panel of Figure 4, PC2 and PC4 are reported, as PC was mainly dominated by fertilization factor; in this case, manure addition was separate from the untreated control and the mineral fertilization, with manure principally characterized by soil POlsen, Cext, and MBN content.

4. Discussion

Most of the available information on the effects of agricultural practices on soil quality originates from experiments in which single factors were manipulated. However, the soil quality is an integration of soil processes and provides a measure of change in soil condition as related to factors such as land use, climate patterns, and agricultural practices [39]. For this reason, we chose a long term field experiment in which both crop rotations and fertilizations were manipulated. Indeed, only with a long term field experiment is it possible to divide the effect of climate patterns from that of agricultural practices on soil quality. Moreover, between the agricultural practices, crop rotations and fertilizations are the main important factors affecting the key function of soil—the capacity to store organic C [40].

4.1. The Crop Rotations Factor

Soil organic C and TN were maximum in the 9YR, confirming that forage legumes inclusion in the long term rotations had a positive impact on soil C storage [7] and soil N content [41]. This positive effect may be attributed to the reduction of tillage during this crop phase and to the increased inputs of organic residues with low C:N ratio. In fact, according to Drinkwater et al. (1998) and Campbell et al. (2000) [18,42], the presence of legumes in the crop rotation may increase the conversion efficiency of crop residue C to SOC. On the other hand, in these treatments, POlsen was lower. Over time, rotations that include forage legumes may become P-limited due to the high removal of P in the form of multiple hay cuttings and to the fact that alfalfa has high P requirements [1,43].
In accordance with SOC and TN data, under continuous corn and cereal based rotation, lower values of microbial biomass, microbial activity, and MBC:SOC ratio were observed; similar results were obtained in other studies where corn and/or wheat were cultivated in mono- and multi-cropping rotations that, in some cases, included also a leguminous crop [24,38,44]. In these studies, the inclusion of a leguminous crop and the intercropping in general favoured the microbial biomass more than the monocropping system. Moreover, under the CC and the CB rotations were measured the higher specific soil enzymatic activities, indicating that the reduced microbial community was mainly focused on the enzymes production. This could be interpreted as CC and CB rotations not favouring sufficient conditions for the microbial community development; in fact, the specific soil enzymatic activities are considered as a stress index for soil microbial biomass [35].
On the other hand, under the 9YR rotation, the microbial proliferation was stimulated by the increased availability of substrates and, as a result, MBC and MBN were higher than other rotations with no significant increase of the specific soil enzymatic activities.
These results were confirmed by the PCA that highlighted that crop rotation mainly impacted soil microbial biomass and activity more than soil C, N, and P availability (Figure 4). Indeed, the three crop rotations considered were characterized by the microbial biomass and by the specific enzymatic activities. In particular, the increased soil microbial biomass content and the reduced soil specific enzymatic activities determined in the 9YR could have led to the increased SOC and TN content, confirming that the inclusion of a leguminous crop could bring significant advantages in terms of soil quality and soil organic C storage.

4.2. The Fertilization Factor

Regarding the effects of fertilization, SOC, TN, nitrates, and POlsen were maximum under manure, confirming that long term organic amendment increased SOM content and provided a nutrient reservoir [7,45]. On the contrary, NP fertilization did not increase SOC and, as compared to manure, improved soil nutrients content to a lesser extent. The use of inorganic fertilizers can increase plant biomass production, which in turn can increase the amount of residues returned to the soil [46], but it has been shown that long term application of N fertilizers may stimulate C mineralization, resulting in depletion of organic C [15,47], in particular in the climate pattern of this site.
The increase in POlsen observed under manure may be attributed to the manure N:P ratio (4:1) that was lower than the N:P ratio estimated for cereals uptake (8:1), and this could have contributed to P accumulation in soil [48]. Furthermore, as compared to the NP fertilization treatment, the amount of P supplied with manure before sowing alfalfa was higher. As observed by Wortman et al. (2011) [7], long term amendment with manure increased soil pH, bringing it close to values at which P availability was maximum. This higher P availability with manure addition led to a higher microbial biomass demand in C and N in order to maintain the soil microbial biomass C:N:P stoichiometry [36]. This microbial biomass need in C and N could be observed by the ecosystem ratios. Indeed, as reported by Sinsabaugh et al. (2008) [36], the ecosystem ratios are a measure of the enzymatic resources for the acquisition of an element compared to others (e.g., the acquisition of organic P and N relative to C). In the case of this study, the C:P and the N:P ecosystem ratios were higher under manure addition, meaning that microbial biomass activity to recover C and N was higher compared to the activity to recover P (which was available in greater extent compared to C and N). The ecosystem ratios were confirmed in the enzymatic activities; indeed, while the activities of the enzymes involved in C and N cycles were higher under manure addition, the PME and the PDE activities showed comparable results within the three treatments considered.
Among the fertilization treatments, MBC and MBN values were maximum under manure treatment, in which the positive effect on soil microbial biomass is a well-documented phenomenon [49,50,51] and is mainly due to the fact that manure sustains microbial proliferation by available organic C and slow release of nutrients [52]. The use of inorganic fertilizers can increase plant biomass production, which in turn can increase the amount of residue returned to the soil with positive effects on soil biological activity [46]. However, in our study, we observed that NP fertilization did not increase SOC and resulted in a slight acidification of soil, both negative conditions for the proliferation of soil microorganisms [53]. The MBC:SOC ratio followed the same trend observed for MBC and MBN, suggesting that not only the quantity of substrate but also its availability played a role in determining soil microbe response to the different treatments.
The lower specific activity of the soil enzymes involved in C and P processes was measured in the manure fertilization. On the other hand, the NP fertilization, compared to manure, induced a disequilibrium in the microbial stoichiometry balance, disadvantaging the microbial biomass (lower MBC and MBN compared to manure) and therefore leading to a higher production of those soil enzymes involved in C and P recovery for microorganisms [54,55].
Finally, the adequate P availability under manure may also enhance biological N2 fixation with positive effects also on the non-legume crops [56]; this finding was confirmed in the PCA, where soil P availability content and MBN strongly characterized the manure fertilization treatment.

5. Conclusions

The results indicated that the long term use of a complex rotation including alfalfa improved soil C and N pools and soil microbial biomass and activity with positive effects on soil quality and functionality. On the contrary, continuous corn and corn-wheat rotations had negative effects on the considered soil quality indicators, but no differences in corn yield were observed between the crop rotations. Soil amendment with manure built up soil organic C stocks and acted as a nutrient reservoir, increasing soil TN and mineral N and effectively avoiding P depletion, with positive effects on corn yield.
The use of the specific enzymatic activities and the ecosystem ratios has proven to be useful to better understand and describe the effects that different agronomic management practices can have on the various pools of C, N, and P in the soil.
Long rotations including legume forage crops and soil amendments with manure could be considered a sustainable agricultural practice in the area of study in terms of both soil quality maintenance and crop productivity. Nevertheless, in this study, no significant differences emerged when observing the interaction between crop rotation and fertilization treatment. This bring to the supposition that crop rotation and fertilization practices have a direct impact on different soil indicators (such as the microbial biomass content, C, N, and P availability, and enzymatic activities), thus leading to overall effects that are given more by the sum than by the interaction of these two agronomic practices. Indeed, the PCA highlighted this concept, as the rotations including legume forage crops and the soil amendments with manure were characterized by different soil indicators—in the first case, the microbial biomass, and in the second case, C and P availability. Ultimately, both the agronomic strategies brought about higher soil organic C content and higher soil quality and functionality, which probably were reached in different ways.

Supplementary Materials

The following are available online at https://www.mdpi.com/article/10.3390/agronomy11040636/s1, Table S1: Enzymes included in the study, abbreviations, corresponding MUF substrates and final substrate concentrations, Table S2: Correlation matrix of the main soil properties measured.

Author Contributions

Conceptualization, C.G., C.M., C.C. and L.C.; Investigation, C.G. and L.T.; Resources, G.B. and C.C.; data curation, M.M.; writing—original draft preparation, C.G. and M.M.; writing—review and editing, M.M. and L.C.; supervision, C.M. and C.C. All authors have read and agreed to the published version of the manuscript.

Funding

This research received no external funding.

Institutional Review Board Statement

Not applicable.

Informed Consent Statement

Not applicable.

Acknowledgments

We would like to thank Angelo Alfano for the collaboration during the laboratory analysis and Paola Gioacchini for performing CHN-O and TOC-VCPH/CPN measurements.

Conflicts of Interest

The authors declare no conflict of interest.

References

  1. Riedell, W.E.; Pikul, J.L.; Jaradat, A.A.; Schumacher, T.E. Crop rotation and nitrogen input effects on soil fertility, maize mineral nutrition, yield and seed composition. Agron. J. 2009, 101, 870–879. [Google Scholar] [CrossRef] [Green Version]
  2. Liu, X.; Herbert, S.J.; Hashemi, A.M.; Zhang, X.; Ding, G. Effects of agricultural management on soil organic matter and carbon transformation—A review. Plant Soil Environ. 2006, 52, 531–543. [Google Scholar] [CrossRef] [Green Version]
  3. Norris, C.E.; Congreves, K.A. Alternative management practices improve soil health indices in intensive vegetable cropping systems: A review. Front. Environ. Sci. 2018, 6, 50. [Google Scholar] [CrossRef]
  4. Acosta-Martinez, V.; Zobeck, T.M.; Allen, V. Soil microbial, chemical and physical properties in continuous cotton and integrated crop-livestock systems. Soil Sci. Soc. Am. J. 2004, 68, 1875–1884. [Google Scholar] [CrossRef] [Green Version]
  5. Bardgett, R.D.; Van Der Putten, W.H. Belowground biodiversity and ecosystem functioning. Nature 2014, 515, 505–511. [Google Scholar] [CrossRef] [PubMed]
  6. Ball, B.C.; Bingham, I.; Rees, R.M.; Watson, C.A.; Litterick, A. The role of crop rotations in determining soil structure and crop growth conditions. Can. J. Soil Sci. 2005, 85, 557–577. [Google Scholar] [CrossRef] [Green Version]
  7. Wortman, S.E.; Galusha, T.D.; Mason, S.T.; Francis, C.A. Soil fertility and crop yields in long-term organic and conventional cropping systems in Eastern Nebraska. Renew. Agric. Food Syst. 2011, 27, 200–216. [Google Scholar] [CrossRef]
  8. Karlen, D.L.; Varvel, G.E.; Bullock, D.G.; Cruse, R.M. Crop rotations for the 21st century. Adv. Agron. 1994, 53, 1–44. [Google Scholar]
  9. Kaiser, V.M. Metabolism and growth. In Mineral Nutrition of Plants: Principles and Perspectives; Epstein, E., Bloomm, A.J., Eds.; Sinauer Associates, Inc.: Sunderland, MA, USA, 2005. [Google Scholar]
  10. Riley, H.; Pommeresche, R.; Eltun, R.; Hansen, S.; Korsaeth, A. Soil structure, organic matter and earthworm activity in a comparison of cropping systems with contrasting tillage, rotations, fertilizer levels and manure use. Agric. Ecosyst. Environ. 2008, 124, 275–284. [Google Scholar] [CrossRef] [Green Version]
  11. Lehmann, J.; Lan, Z.; Hyland, C.; Sato, S.; Solomon, D.; Ketterins, Q.M. Long-Term Dynamics of Phosphorus Forms and Retention in Manure-Amended Soils. Environ. Sci. Technol. 2005, 39, 6672–6680. [Google Scholar] [CrossRef]
  12. Ogiyama, S.; Sakamoto, K.; Suzuki, H.; Ushio, S.; Anzai, T.; Inubushi, K. Accumulation of Zinc and Copper in an Arable Field after Animal Manure Application. Soil Sci. Plant Nutr. 2005, 51, 801–808. [Google Scholar] [CrossRef] [Green Version]
  13. Ghirardini, A.; Grillini, V.; Verlicchi, P. A review of the occurrence of selected micropollutants and microorganisms in different raw and treated manure—Environmental risk due to antibiotics after application to soil. Sci. Total Environ. 2020, 707, 136118. [Google Scholar] [CrossRef]
  14. Courtier-Murias, D.; Simpson, A.J.; Marzadori, C.; Baldoni, G.; Ciavatta, C.; Fernández, J.M.; López-de-Sá, E.G.; Plaza, C. Unraveling the long-term stabilization mechanisms of organic materials in soils by physical fractionation and NMR spectroscopy. Agric. Ecosyst. Environ. 2013, 171, 9–18. [Google Scholar] [CrossRef] [Green Version]
  15. Giacometti, C.; Demyan, M.S.; Cavani, L.; Marzadori, C.; Ciavatta, C.; Kandeler, E. Chemical and microbiological soil quality indicators and their potential to differentiate fertilization regimes in temperate agroecosystems. Appl. Soil Ecol. 2013, 64, 32–48. [Google Scholar] [CrossRef]
  16. Mazzon, M.; Cavani, L.; Margon, A.; Sorrenti, G.; Ciavatta, C.; Marzadori, C. Changes in soil phenol oxidase activities due to long-term application of compost and mineral N in a walnut orchard. Geoderma 2018, 316, 70–77. [Google Scholar] [CrossRef]
  17. Triberti, L.; Nastri, A.; Baldoni, G. Long-term effects of crop rotation, manure and mineral fertilisation on carbon sequestration and soil fertility. Eur. J. Agron. 2016, 74, 47–55. [Google Scholar] [CrossRef]
  18. West, T.O.; Post, W.M. Soil organic carbon sequestration rates by tillage and crop rotation: A global data analysis. Soil Sci. Soc. Am. J. 2002, 66, 1930–1946. [Google Scholar] [CrossRef] [Green Version]
  19. Campbell, C.A.; Zentener, R.P.; Liang, B.C.; Roloff, G.; Gregorich, E.G.; Blomert, B. Organic C accumulation in soil over 30 years in semiarid southwestern Saskatchewan—Effect of crop rotation and fertilizers. Can. J. Soil Sci. 2000, 80, 179–192. [Google Scholar] [CrossRef]
  20. Karlen, D.L.; Cambardella, C.A.; Kovar, J.L.; Colvin, T.S. Soil quality response to long-term tillage and crop rotation practices. Soil Tillage Res. 2013, 133, 54–64. [Google Scholar] [CrossRef] [Green Version]
  21. Körschens, M. The importance of long-term field experiments for soil science and environmental research—A review. Plant Soil Environ. 2006, 52, 1–8. [Google Scholar]
  22. D’Hose, T.; Cougnon, M.; De Vliegher, A.; Vandecasteele, B.; Viaene, N.; Cornelis, W.; Van Bockstaele, E.; Reheul, D. The positive relationship between soil quality and crop production: A case study on the effect of farm compost application. Appl. Soil Ecol. 2014, 75, 189–198. [Google Scholar] [CrossRef]
  23. Luo, G.; Li, L.; Friman, V.P.; Guo, J.; Guo, S.; Shen, Q.; Ling, N. Organic amendments increase crop yields by improving microbe-mediated soil functioning of agroecosystems: A meta-analysis. Soil Biol. Biochem. 2018, 124, 105–115. [Google Scholar] [CrossRef]
  24. Song, Y.N.; Zhang, F.S.; Marschner, P.; Fan, F.L.; Gao, H.M.; Bao, X.G.; Sun, J.H.; Li, L. Effect of intercropping on crop yield and chemical and microbiological properties in rhizosphere of wheat (Triticum aestivum L.), maize (Zea mays L.) and faba bean (Vicia faba L.). Biol. Fertil. Soils 2007, 43, 565–574. [Google Scholar] [CrossRef]
  25. Plaza, C.; Gollany, H.T.; Baldoni, G.; Polo, A.; Ciavatta, C. Predicting long-term organic carbon dynamics in organically amended soils using the CQESTR model. J. Soils Sediments 2012, 12, 486–493. [Google Scholar] [CrossRef]
  26. Triberti, L.; Nastri, A.; Giordani, G.; Comellini, F.; Baldoni, G.; Toderi, G. Can mineral and organic fertilization help sequestrate carbon dioxide in cropland? Eur. J. Agron. 2008, 29, 13–20. [Google Scholar] [CrossRef]
  27. ISO 14256-2. Soil Quality—Determination of Nitrate, Nitrite and Ammonium in Field-Moist Soils by Extraction with Potassium Chloride Solution—Part 2: Automated Method with Segmented Flow Analysis; International Organization for Standardization: Geneva, Switzerland, 2005. [Google Scholar]
  28. Olsen, S.R.; Cole, C.V.; Watanabe, F.S.; Dean, L.A. Estimation of Available Phosphorus in Soils by Extraction with Sodium Bicarbonate (No. 939); US Department of Agriculture Circular: Washington, DC, USA, 1954. [Google Scholar]
  29. Brookes, P.C.; Landman, A.; Pruden, G.; Jenkinson, D.S. Chloroform fumigation and the release of soil N: A rapid direct extraction method to measure microbial biomass in soil. Soil Biol. Biochem. 1985, 17, 837–842. [Google Scholar] [CrossRef]
  30. Swisher, R.; Carroll, G.C. Fluorescein diacetate hydrolysis as an estimator of microbial biomass on coniferous needle surfaces. Microb. Ecol. 1980, 6, 217–226. [Google Scholar] [CrossRef]
  31. Giacometti, C.; Cavani, L.; Baldoni, G.; Ciavatta, C.; Marzadori, C.; Kandeler, E. Microplate-scale fluorometric soil enzyme assays as tools to assess soil quality in a long-term agricultural field experiment. Appl. Soil Ecol. 2014, 75, 80–85. [Google Scholar] [CrossRef]
  32. German, D.P.; Weintraub, M.N.; Grandy, A.S.; Lauber, C.L.; Rinkes, Z.L.; Allison, S.D. Optimization of hydrolytic and oxidative enzyme methods for ecosystem studies. Soil Biol. Biochem. 2011, 43, 1387–1397. [Google Scholar] [CrossRef]
  33. Gil-Sotres, F.; Trasar-Cepeda, C.; Leirós, M.C.; Seoane, S. Different approaches to evaluating soil quality using biochemical properties. Soil Biol. Biochem. 2005, 37, 877–887. [Google Scholar] [CrossRef]
  34. Kandeler, E.; Eder, G. Effect of cattle slurry in grassland on microbial biomass and on activities of various enzymes. Biol. Fertil. Soils 1993, 16, 249–254. [Google Scholar] [CrossRef]
  35. Trasar-Cepeda, C.; Leirós, M.C.; Gil-Sotres, F. Hydrolytic enzyme activities in agricultural and forest soils. Some implications for their use as indicators of soil quality. Soil Biol. Biochem. 2008, 40, 2146–2155. [Google Scholar] [CrossRef] [Green Version]
  36. Sinsabaugh, R.L.; Lauber, C.L.; Weintraub, M.N.; Ahmed, B.; Allison, S.D.; Crenshaw, C.; Contosta, A.R.; Cusack, D.; Frey, S.; Gallo, M.E.; et al. Stoichiometry of soil enzyme activity at global scale. Ecol. Lett. 2008, 11, 1252–1264. [Google Scholar] [CrossRef]
  37. R Core Team. R: A Language and Environment for Statistical Computing; R Foundation for Statistical Computing: Vienna, Austria, 2020. [Google Scholar]
  38. McDaniel, M.D.; Grandy, S. Soil microbial biomass and function are altered by 12 years of crop rotation. Soil J. 2016, 2, 583–599. [Google Scholar] [CrossRef] [Green Version]
  39. Doran, J.W.; Coleman, D.C.; Bezdicek, D.F.; Stewart, B.A. Defining Soil Quality for a Sustainable Environment; Special Pubblication 35; Soil Science Society of America: Madison, WI, USA, 1994. [Google Scholar]
  40. Wiesmeier, M.; Urbanskia, L.; Hobleya, E.; Langc, B.; von Lützowa, M.; Marin-Spiottad, E.; van Wesemaele, B.; Rabotf, E.; Ließf, M.; Garcia-Francoa, N.; et al. Soil organic carbon storage as a key function of soils—A review of drivers and indicators at various scales. Geoderma 2019, 333, 149–162. [Google Scholar] [CrossRef]
  41. Glasener, K.M.; Wagger, M.G.; MacKown, C.T.; Volk, R.J. Contributions of shoot and root nitrogen-15 labelled legume nitrogen sources to a sequence of three cereal crops. Soil Biol. Biochem. 2002, 66, 523–530. [Google Scholar]
  42. Drinkwater, L.E.; Wagoner, P.; Sarrantonio, M. Legume-based cropping systems have reduced carbon and nitrogen losses. Nature 1998, 396, 262–265. [Google Scholar] [CrossRef]
  43. Welsh, C.; Tenuta, M.; Flaten, D.N.; Thiessen-Martens, J.R.; Entz, M.H. High yielding organic crop management decreases plant-available but not recalcitrant soil phosphorous. Agron. J. 2009, 101, 1027–1035. [Google Scholar] [CrossRef]
  44. Moore, J.M.; Klose, S.; Tabatabai, M.A. Soil microbial biomass carbon and nitrogen as affected by cropping systems. Boil Fertil Soils 2000, 31, 200–210. [Google Scholar] [CrossRef]
  45. Acosta-Martínez, V.; Tabatabai, M.A. Phosphorous Cycle Enzymes. In Methods of Soil Enzymology; Dick, R.P., Ed.; Soil Science Society of America: Madison, WI, USA, 2011; pp. 161–183. [Google Scholar]
  46. Dick, R.P. A review: Long-term effects of agricultural systems on soil biochemical and microbial parameters. Agric. Ecosyst. Environ. 1992, 40, 25–36. [Google Scholar] [CrossRef]
  47. Green, C.J.; Blackmer, A.M.; Horton, R. Nitrogen effects on conservation of carbon during corn residue decomposition in soil. Soil Sci. Soc. Am. J. 1995, 59, 453–459. [Google Scholar] [CrossRef]
  48. Bullock, L.R.; Brosius, M.; Evanylo, G.K.; Ristaino, J.B. Organic and synthetic fertility amendments influence soil microbial, physical and chemical properties on organic and conventional farms. Appl. Soil Ecol. 2002, 19, 147–160. [Google Scholar] [CrossRef]
  49. Kandeler, E.; Stemmer, M.; Klimanek, E. Response of soil microbial biomass, urease and xylanase within particle size fractions to long-term soil management. Soil Biol. Biochem. 1999, 31, 261–273. [Google Scholar] [CrossRef]
  50. Böhme, L.; Langer, U.; Böhme, F. Microbial biomass, enzyme activities and microbial community structure in two European long-term field experiments. Agric. Ecosyst. Environ. 2005, 109, 141–152. [Google Scholar] [CrossRef]
  51. Marinari, S.; Mancinelli, R.; Campiglia, E.; Grego, S. Chemical and biological indicators of soil quality in organic and conventional farming systems in central Italy. Ecol. Indic. 2006, 6, 701–711. [Google Scholar] [CrossRef]
  52. Liang, B.C.; MacKenzie, A.F.; Schnitzer, M.; Monreal, C.M.; Voroney, P.R.; Beyaert, R.P. Management-induced changes in labile soil organic matter under continuous corn in eastern Canadian soils. Biol. Fertil. Soils 1998, 26, 88–94. [Google Scholar] [CrossRef]
  53. Wallenstein, M.D.; McNulty, S.; Fernandez, I.J.; Boggs, J.; Schlesinger, W.H. Nitrogen fertilization decreases forest soil fungal and bacterial biomass in three long-term experiments. For. Ecol. Manag. 2006, 222, 459–468. [Google Scholar] [CrossRef]
  54. Chen, J.; Luo, Y.; Van Groenigen, K.J.; Hungate, B.A.; Cao, J.; Zhou, X.; Wang, R.W. A keystone microbial enzyme for nitrogen control of soil carbon storage. Sci. Adv. 2018, 4, 2–8. [Google Scholar] [CrossRef] [Green Version]
  55. Zhang, Q.; Feng, J.; Wu, J.; Zhang, D.; Chen, Q.; Li, Q.; Long, C.; Feyissa, A.; Cheng, X. Variations in carbon-decomposition enzyme activities respond differently to land use change in central China. Land Degrad. Dev. 2019, 30, 459–469. [Google Scholar] [CrossRef]
  56. Hardarson, G.; Atkins, C. Optimising biological N2 fixation by legumes in farming systems. Plant Soil 2003, 252, 41–54. [Google Scholar] [CrossRef]
Figure 1. Representation of the rotation from the 2003 until the 2013 (time of soil sampling) season. Each rotation has two field replicates. CC: continuous corn; CB: 2 year cereal-based rotation of corn; 9YR: 9 year rotations consisting of corn-wheat-corn-wheat-corn-wheat-alfalfa-alfalfa-alfalfa.
Agronomy 11 00636 g001
Figure 2. Marginal means of soil (a) extractable carbon, (b) extractable nitrogen, (c) microbial biomass carbon (MBC), (d) microbial biomass nitrogen (MBN), (e) organic carbon, (f) total nitrogen for crop rotation and fertilization effects. Error bars represent standard errors. Different upper-case and lower-case letters indicate significant differences (p-value < 0.05), respectively, between rotation and between fertilization as determined by the Fisher’s least significant difference (LSD) test. Statistical significance of the differences according to the ANOVA (ns p < 0.05; * p ≤ 0.05; ** p ≤ 0.01; *** p ≤ 0.001).
Agronomy 11 00636 g002
Figure 3. Marginal means of specific (a) β-cellobiosidase, (b) β-glucosidase, (c) α-glucosidase, (d) β-xylosidase, (e) N-acetyl-β-glucosaminidase, (f) arylsulfatase, (g) phosphodiesterase, (h) phosphomonoesterase soil enzymatic activities for rotation and fertilization effects. Error bars represent standard errors. Different upper-case and lower-case letters indicate significant differences (p-value < 0.05), respectively, between rotation and between fertilization as determined by the Fisher’s LSD test. Statistical significance of the differences according to the ANOVA (ns p < 0.05; * p ≤ 0.05; ** p ≤ 0.01; *** p ≤ 0.001).
Agronomy 11 00636 g003
Figure 4. Principal component analysis plot including the soil C and N pools, the bioavailable phosphorous (P), and the specific soil enzymatic activities: extractable C and N (Cext, Next), microbial biomass C and N (MBC, MBN), total N (TN), soil organic C (SOC), available P (POlsen), β-glucosidase (sp.β-Glu), α-glucosidase (sp.α-Glu), β-xylosidase (sp.β-Xyl), β-cellobiosidase (sp.β-Cel), N-acetyl-β-glucosaminidase (sp.NAG), phosphomonoesterase (sp.PME), and phosphodiesterase (sp.PDE) activities. Left panel: principal components 1 and 3, where rotation is dominant discriminating factor; right panel: principal components 2 and 4, where fertilization is dominant discriminating factor. See Table 4 for PCA and ANOVA results.
Agronomy 11 00636 g004
Table 1. Marginal means of soil pH, carbon (C):nitrogen (N) ratio, ammonium (NH4+-N), nitrate (NO3-N), available phosphorous (POlsen), MBC: soil organic carbon (SOC) ratio, fluoresceine diacetate hydrolysis (FDA), and corn yield for rotation and fertilization effects. Different upper-case and lower-case letters indicate significant differences (p-value < 0.05), respectively, between rotation and between fertilization as determined by the Fisher’s LSD test. NP: mineral N and phosphorous (P) fertilization. CK: unfertilized control.
FactorspHC:NNH4+-NNO3-NPOlsenMBC:SOCFDAYield
mg kg−1mg kg−1mg kg−1%mg kg−1 h−1Mgdm ha−1
Rotation (R)
CC6.40 7.37 5.516.4623.60.82844.14.89
CB6.03 7.406.1210.622.50.85443.43.60
9YR6.007.432.3717.114.31.0354.24.74
p-value0.7240.9550.2630.0730.1660.0580.1940.087
Fertilization (F)
CK6.07 b7.225.239.69 b14.1 c0.87443.7 b2.87 b
NP5.94 b7.384.7711.5 ab18.1 b0.82048.1 ab5.72 a
M6.42 a7.653.4412.6 a26.4 a1.0350.0 a4.64 a
p-value0.0250.0580.0860.0470.0020.0640.0410.004
R × F
p-value0.2160.1800.4360.1770.0630.4750.2250.093
Table 2. Marginal means of soil β-cellobiosidase (β-cell), β-glucosidase (β-glu), α-glucosidase (α-glu), β-xylosidase (β-xyl), N-acetyl-β-glucosaminidase (NAG), arylsulfatase (AS), phosphodiesterase (PDE), and phosphomonoesterase (PME) activities for rotation and fertilization effects. Different upper-case and lower-case letters indicate significant differences (p-value < 0.05), respectively, between rotation and between fertilization as determined by the Fisher’s LSD test.
FactorsHydrolytic Enzyme Activities (nmolMUF g−1ds h−1)
β-Cellβ-gluα-gluβ-xylNAGASPDEPME
Rotation (R)
CC32.21397.7927.548.745.148.4151
CB27.31217.7625.440.241.346.2162
9YR34.81527.8325.542.348.549.1165
p-value0.2810.1470.9900.6500.1000.2370.7610.793
Fertilization (F)
CK24.6 c116 b7.3123.9 b41.441.4 b45.7155
NP31.4 b139 a7.8625.9 b42.842.8 b48.4168
M39.4 a160 a8.2928.6 a50.650.6 a49.5153
p-value<0.0010.0110.4680.0080.0650.0320.2750.284
R × F
p-value0.0420.1390.6250.3160.2660.4420.3060.225
Table 3. Marginal means of soil ecosystem ratios for rotation and fertilization effects. Different upper-case and lower-case letters indicate significant differences (p-value < 0.05), respectively, between rotation and between fertilization as determined by the Fisher’s LSD test.
FactorsEcosystem Ratios
enz C:Nenz C:Penz N:P
Rotation (R)
CC1.371.010.733
CB1.420.9690.684
9YR1.441.000.696
p-value0.2970.4010.240
Fertilization (F)
CK1.410.969 b0.686 b
NP1.410.986 b0.700 b
M1.401.03 a0.738 a
p-value0.9670.0010.013
R × F
p-value0.4870.0250.075
Table 4. Analysis of variance of results from the principal component analysis (PCA) (Figure 4) with respect to crop rotation and fertilization. Significant comparisons are in bold.
ANOVA ParameterPC1PC2PC3PC4
Proportion of variance (%)681286
ANOVA factorFp-valueFp-valueFp-valueFp-value
Rotation (R)24.5<0.0014.190.0576.440.0224.970.040
Fertilization (F)13.80.02913.20.0033.950.0646.860.018
R × F1.120.4101.170.3920.720.6022.700.109
Significant comparison9YR > CB = CC
M > CK > NP
CC = CB = 9YR
M > NP > CK
CC > 9YR > CB
NP = M = CK
9YR > CC > CB
NP > CK > M
Publisher’s Note: MDPI stays neutral with regard to jurisdictional claims in published maps and institutional affiliations.

