Article

Changes in the Bio-Availability of Phosphorus in Pyrochars and Hydrochars Derived from Sewage Sludge after Their Amendment to Soils

by
Marina Paneque
1,2,*,
José María de la Rosa
1,
Antonio F. Patti
3 and
Heike Knicker
1
1
Department of Biochemistry, Plant and Microbial Ecology, Institute of Natural Resources and Agrobiology of Seville (IRNAS-CSIC), Reina Mercedes 10, 41012 Seville, Spain
2
Department of Medical Biochemistry and Biophysics, Umea University, SE-901 87 Umea, Sweden
3
School of Chemistry, Monash University, Clayton, VIC 3800, Australia
*
Author to whom correspondence should be addressed.
Agronomy 2021, 11(4), 623; https://doi.org/10.3390/agronomy11040623
Submission received: 8 March 2021 / Revised: 20 March 2021 / Accepted: 22 March 2021 / Published: 25 March 2021

Abstract

:
The expected shortage of global phosphate has enforced the search for alternative resources for P fertilizers. Therefore, the present study focuses on the turnover of phosphorus (P) of hydrochars and pyrochars derived from sewage sludge (SS) in soils during plant growth. We designed a pot experiment in which Lolium perenne L. was allowed to grow on a Calcic Cambisol amended with SS-derived chars. Hydrothermal carbonization (HTC) yielded the SS-hydrochars (200 °C, 260 °C; 30 min, 3 h), whereas the SS-pyrochars were obtained after dry pyrolysis (600 °C, 1 h). Increasing severity of HTC lowered the recovery of total P (PT) from the feedstock to 76%. The Olsen-P diminished from 4% PT in the untreated sludge to 1% PT in the hydrochars, whereas the pyrochars exhibited an Olsen-P between 3 and 6%. At the end of the pot experiment, the soils amended with pyrochars and with hydrochars produced at 200 °C contained more Olsen-P than the unamended soils, proving that P-rich chars can indeed serve as a P fertilizer. Part of the P sequestered in the chars turned into a mobile form during the experiment. After addition of our chars, the soil pH remained alkaline, allowing the conclusion that P could not have been solubilized through just abiotic processes. We suggest that biological and biochemical processes are involved in this mobilization. This work demonstrates that, in order to evaluate the efficiency of an organic amendment as a P fertilizer, the knowledge of their P availability alone is not sufficient and a better understanding of the biochemical processes involved in the cycling of its immobilized P is certainly required.

1. Introduction

The annual phosphorus (P) input required for agriculture in the European Union (EU) was estimated to be 3.85 million tons (P2O5) per year [1]. Most of this need is currently covered by inorganic P fertilizers derived from mined phosphate rocks—a non-renewable resource that is becoming increasingly scarce [2]. Thus, alternative P sources are urgently needed, among which P-rich organic residues should be considered.
More than 10 million tons of sewage sludge (SS), with an average P content of 28 g kg−1, are annually generated in the EU [3]. Therefore, this residue may indeed help for the reduction of our current dependence on phosphate rocks. However, SS applied on land not only has to meet with the established standards regarding pollutants but also requires a pretreatment destroying potential pathogens and reducing its fermentability. This may be achieved by dry pyrolysis or hydrothermal carbonization (HTC). Both technologies consist of the thermochemical conversion of biomass with minimal or zero oxygen supply in the absence (pyrolysis) or presence (HTC) of water [4,5]. The solid by-product that results from pyrolysis can be called biochar, if it meets the requirements of the International Biochar Initiative [6] or the European Biochar certificate [7]. Alternatively, it is often termed pyrochar. The product of HTC is usually called hydrochar. Both pyrolysis and HTC have been proposed as alternative options to convert SS into an added-value product that can be used as soil amendment or fertilizer [8,9]. Compared to composting, it is expected that such thermal treatments result in a more efficient C stabilization with less greenhouse gas emissions [3,10]. However, bearing in mind that thermal treatments do not only stabilize organic matter but also affect the nutrient contents, their plant availability, and may even generate toxic compounds, the suitability of this approach still needs to be investigated in more detail.
A transfer of P from labile, plant-available forms to more stable pools during both pyrolysis and HTC has been demonstrated, regardless of the feedstock [11,12,13,14]. Moreover, the interaction of the chars with minerals, organic matter and microorganisms present in the soil may alter P availability for plants once incorporated into the soil [15,16]. Therefore, understanding the impact of bio (pyro)- and hydrochars on soil P availability with cropping time is key to determine their potential as P fertilizers.
Applying a meta-analysis, Glaser et al. [17] concluded that biochar can enhance plant-available P in agricultural soils for at least five years. However, the influence of SS-derived biochars (pyrochars) on this parameter was not properly studied in that work due to the low number of studies and the high variability of the results [17]. Previous studies on the behavior of SS-derived hydrochars as a soil amendment revealed improved plant growth with respect to plants grown on unamended soils [18]. Despite the previously found evidence of P supply with SS-hydrochar addition, these studies focused mainly on the impact of SS-char-derived N. Indeed, the role of SS-derived hydrochars as source of P for soils has received little attention and the respective studies were focusing on the speciation of P forms accumulating in hydro- or pyrochars [18,19,20] rather than their fate after application to cropped soils.
In order to fill this knowledge gap, the present research takes the first step and focuses on the fate of P formerly sequestered in hydrochars and pyrochars from SS and produced under different HTC conditions after their amendment to a soil in which plants grew.
We were interested in proving the hypothesis that although most of their P is immobilized, SS hydrochars and pyrochars can provide sufficient plant-available P to allow plant growth. We were further elucidating if and to which extend P immobilized during HTC and dry pyrolysis remains sequestered after addition of the chars to soils in which plants are growing. Therefore, we studied the alteration of the amount of potentially plant available P (Olsen-P) derived from SS hydrochars and pyrochars after their amendment to a sandy loamy soil during an 80-day greenhouse pot experiment with Lolium perenne L. For comparison, a pyrochar of green waste was included in the study. Bearing in mind that soil pH affects P solubility, the pH values of the soils at the end of the experiment were also determined.

2. Materials and Methods

2.1. Sewage Sludge Collection and Char Production

The sewage sludges (SS) were provided by the Experimental Wastewater Treatment plant (CENTA) located in Carrion de los Céspedes (SW, Spain). They consisted of a primary sludge produced by the settlement of suspended organic matter in a pond, hereafter A_SS, and a secondary sludge produced in an extended aeration treatment system and finally stored in a thickener for reduction of its water content, further called T_SS. A brief description of the material is given in Paneque et al. [8].
The SS samples were subjected to two contrasting thermochemical carbonization processes. First, the A_SS and T_SS samples were mixed with water at a 1:2 ratio (SS:water, w:w) and hydrothermally carbonized (HTC) in a 1 L stirred pressure reactor (Parr reactor series 4520, Parr Instrument Company, Moline, IL, USA) at 200 °C and 260 °C for 30 min and 3 h with a heating rate of 3 °C min−1. The mixture was stirred during the whole reaction time at 90 rounds per minute. After turning off the reactor and cooling down for 15 h, the HTC slurry was filtered through fluted filter paper and the solids (A_HTC, T_HTC) were dried for 48 h at 60 °C. The heavy metal contents of the feedstock and produced hydrochars were reported in Paneque et al. [18] and were below the limit values for concentrations of heavy metals in sludge for use on land established by the European Community [21], except for Zn in the hydrochars derived from A_SS. However, their Zn concentration were between 1983 and 2162 mg kg−1, which is only slightly higher than the suggested threshold of 2000 mg kg−1.
In addition, the pyrochars A_Py and T_Py were obtained after pyrolyzing 200 g of dry SS in a close steel container in a preheated muffle oven at 600 °C for 1 h [8]. Here, only T_Py exceeded, with 5.3 mg kg−1 and 2432 mg kg−1, respectively [18], the heavy metal threshold concentration for Cd (5 mg kg−1) and Zn reported in the working document on sludge [21].
The third pyrochar, named W_Py, was bought from the company Swiss Biochar (Belmont sur Lausanne, Switzerland) and derived from urban green waste, grape pomace, wood, Miscanthus and other suitable green biomasses, which were pyrolyzed at 600 °C for 20 min in a continuous flow reactor.

2.2. Greenhouse Pot Experiment

A detailed description of this experiment is given in Paneque et al. [18]. Briefly, for the greenhouse pot experiment, we mixed 250 g of a sandy loamy soil from a Calcic Cambisol [22] with an amount of char that corresponds to an application rate of 5 and 25 t ha−1 (0.8 and 4% w/w, respectively). Those application rates were chosen based on previous studies showing that biochar application rates <30 t ha−1 led to better plant biomass production than higher rates [23]. With the amendment at a rate of 5 t ha−1, we intended to evaluate if such low application rates still affect plant growth [18]. Four replicates were prepared for each treatment (n = 4) by putting the mixed substrate into plastic containers, adding 25 certified seeds of Lolium perenne, and adjusting the soil humidity to 60% of the maximum water holding capacity (WHC). Additionally, 6 controls without any char amendment but with plants were prepared (n = 6). The pot experiment was conducted in a greenhouse at 25 °C and 14 h light day−1 for 80 days without adding an additional mineral nutrient solution. After 80 days, the experiment was terminated to avoid the impact of potential plant death on the P cycling. Each pot was irrigated manually with the same amount of water three times a week [18], which accounted to 145 L m−2 until the end of the experiment and corresponded to 662 L m−2 per year. This amount is similar to the natural average annual precipitation at the location of the greenhouse.

2.3. Characterization of the Chars and the Fresh and Incubated Soils

The pH and electrical conductivity (EC) of the chars were measured in distilled water (1:10, w/v) whereas for the soils those parameters were determined using the standard soil:water ratio of 1:2.5 w/v.
The calcium (Ca), magnesium (Mg), iron (Fe), aluminum (Al) and total phosphorus (PT) contents were extracted after digestion with aqua regia (1:3 v/v conc. HNO3/HCl) using a microwave oven (Microwave Laboratory Station Mileston ETHOS 900, Milestone s.r.l., Sorisole, Italy). The PT content of the extracts were quantified with an inductively coupled plasma-optical emission spectrometer (ICP-OES) (Varian ICP720-ES, Agilent, Santa Clara, CA, US) using the wavelength recommended by the company according to a standardized protocol. Extractable P (Olsen-P) was obtained with sodium carbonate at pH 8.5 [24]. We consider Olsen-P to approach the reservoir of plant-available P. The Olsen-P fraction was calculated as follows:
Olsen P   ( % ) =   Olsen P PT × 100

2.4. Calculations for the Characterization of the Behavior of Phosphorus

In order to evaluate the P dynamics in the char-amended soils we calculated Pdiff, which represents the differences between the amount of Olsen-P added with the char (Olsen-Padded-char) and the char-derived Olsen-P (Olsen-Pchar-end) recovered in the soil at the end of the experiment. In order to yield Olsen-Pchar-end, it was assumed that adding the char had only a negligible impact on the soil-derived Olsen-P; thus, this parameter should be similar for the amended and non-amended soils. This assumption allowed us to subtract the amount of Olsen-P in the amended pots, sampled at the end of the experiment from the amount of Olsen-P found in the respective control also obtained at the end of the experiment. For a better comparison of the data, Pdiff was normalized as Pdiff per kg of applied char (Pdiff-norm).

2.5. Statistical Analysis

The statistical analyses were achieved with SPSS version 17.0 (SPSS, Chicago, IL, USA). Data corresponding to the pH, EC and Olsen-P of the soil samples at the end of the experiment are presented as the mean values ± standard error of four replicates. Triplicates were analyzed in the case of Olsen-P of the pure hydro/pyrochars and the untreated soil. The significance of the impact of the different chars and application doses on Olsen-P extractable from the soils at the end of the experiment as well as the differences on Pdiff and Pdiff-norm were tested using the Kruskal–Wallis test followed by the Mann–Whitney U test since the data did not meet ANOVA assumptions. The normality and homoscedasticity of the data were tested by the application of Shapiro–Wilk and Levene tests, respectively. The used significance level was set to 0.05.

3. Results

3.1. pH and Electrical Conductivity (EC)

The HTC procedure resulted in a decrease in the pH from 7.4 and 7.5 for A_SS and T_SS, respectively, to values ranging between 6.2 and 6.7. Although the slightly increasing ash contents indicated an enrichment of salts, the alteration of the electrical conductivity with changing HTC conditions showed no clear tendency. Dry pyrolysis yielded pH values between 9.3 and 10 (Table 1).
The Calcic Cambisol used as soil matrix for the pot experiment exhibits a pH of 8.5 (Table 2), which is within the range expected for such soils in the sampled region [25]. At the end of the experiment, pH values ranging between 8.0 and 8.4 were determined for the control and the soils amended with 5 t ha−1. Most likely due to the lower pH of the hydrochar, its addition resulted in decreased soil alkalinity at the end of the experiment. Addition of 25 t ha−1 amendment decreased the pH of the amended soils at the end of the experiment to values between 7.0 and 8.5. Note that in both cases the pH of the soil-amendment mixture remained in the alkaline range.
The A_SS and T_SS showed 15 mS cm−1, which are high but similar ECs (Table 1). Applying HTC to SS resulted in a decrease in EC for A_HTC but an enhancement of this value for T_HTC. Dry pyrolysis of the SS lowered the EC to 9 and 6 mS cm−1, whereas for W_Py even smaller value of 1 mS cm−1 were detected and can be explained with the lower mineral content of the feedstock if compared to SS.
The original Calcic Cambisol exhibited an EC of 1.1 μS cm−1 (Table 1), which is in the range of those observed for this soil-type of the region [23]. Amendment of the hydrochars and the pyrochars with 5 t ha−1 produced minor to no changes in the soil EC sampled at the end of the experiment. However, hydrochars, applied at 25 t ha−1, increased the EC of the soil taken at the end of the experiment, which can be related to the high EC of the added char. Thus, the EC of the soils to which T hydrochars were applied at 25 t ha−1 ranged from 378 to 644 μS cm−1, whereas for those amended with A hydrochars, this parameter was between 231 and 380 μS cm−1. In accordance with the properties of the respective chars, the addition of_Py and T_Py increased soil EC at the end of the experiment to a lower extent than amendment with the hydrochars. W_Py had no impact on this parameter.

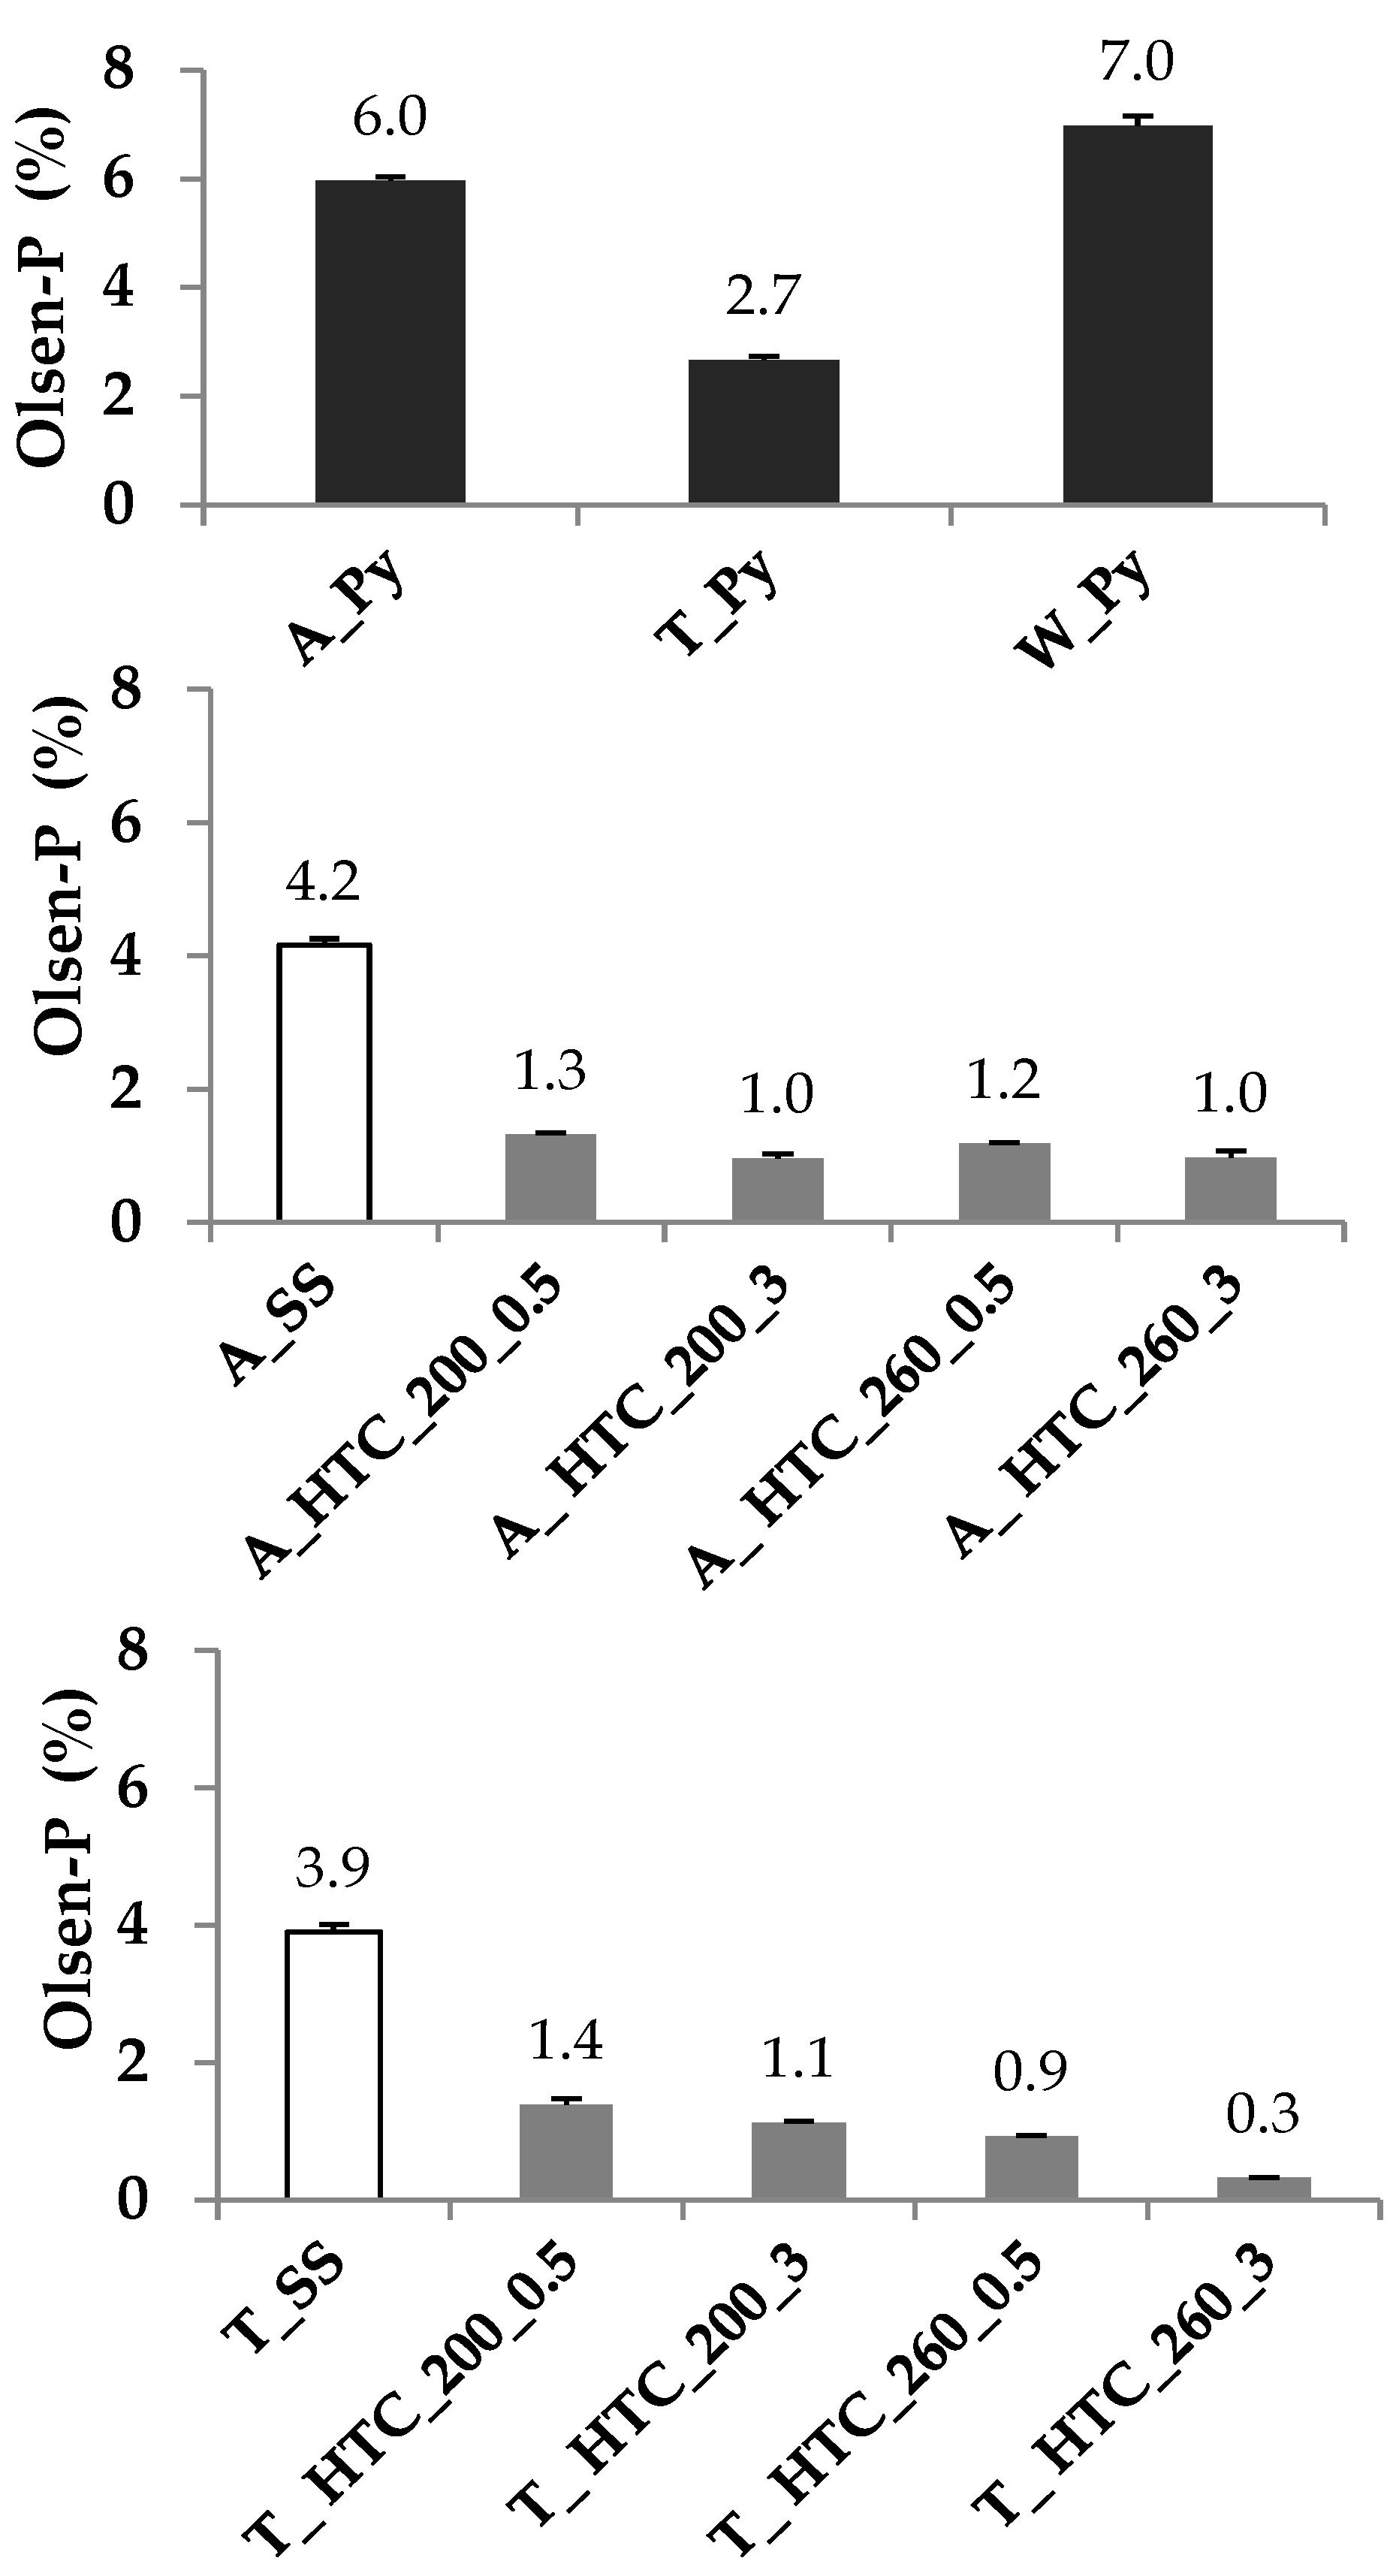
3.2. Contents of Total Phosporous (PT) and Olsen-P in the Feedstock and the Chars

Approximately 4% of the 12 and 17 g kg−1 of PT in A_SS and T_SS were extractable (Table 1; Figure 1) as Olsen-P. After thermal treatment of those samples, between 99 to 76% of their PT (Table 1) were recovered in the chars. The A_Py and T_Py pyrochars exhibited PT contents of 17 and 25 g kg−1, respectively, whereas PT in the hydrochars ranged between 14 and 22 g kg−1 (Table 1). Concomitantly with the increase in PT, a relative enrichment of Ca, Mg, Fe and Al was observed for the hydrochars prepared with increasing temperature (Table 1).

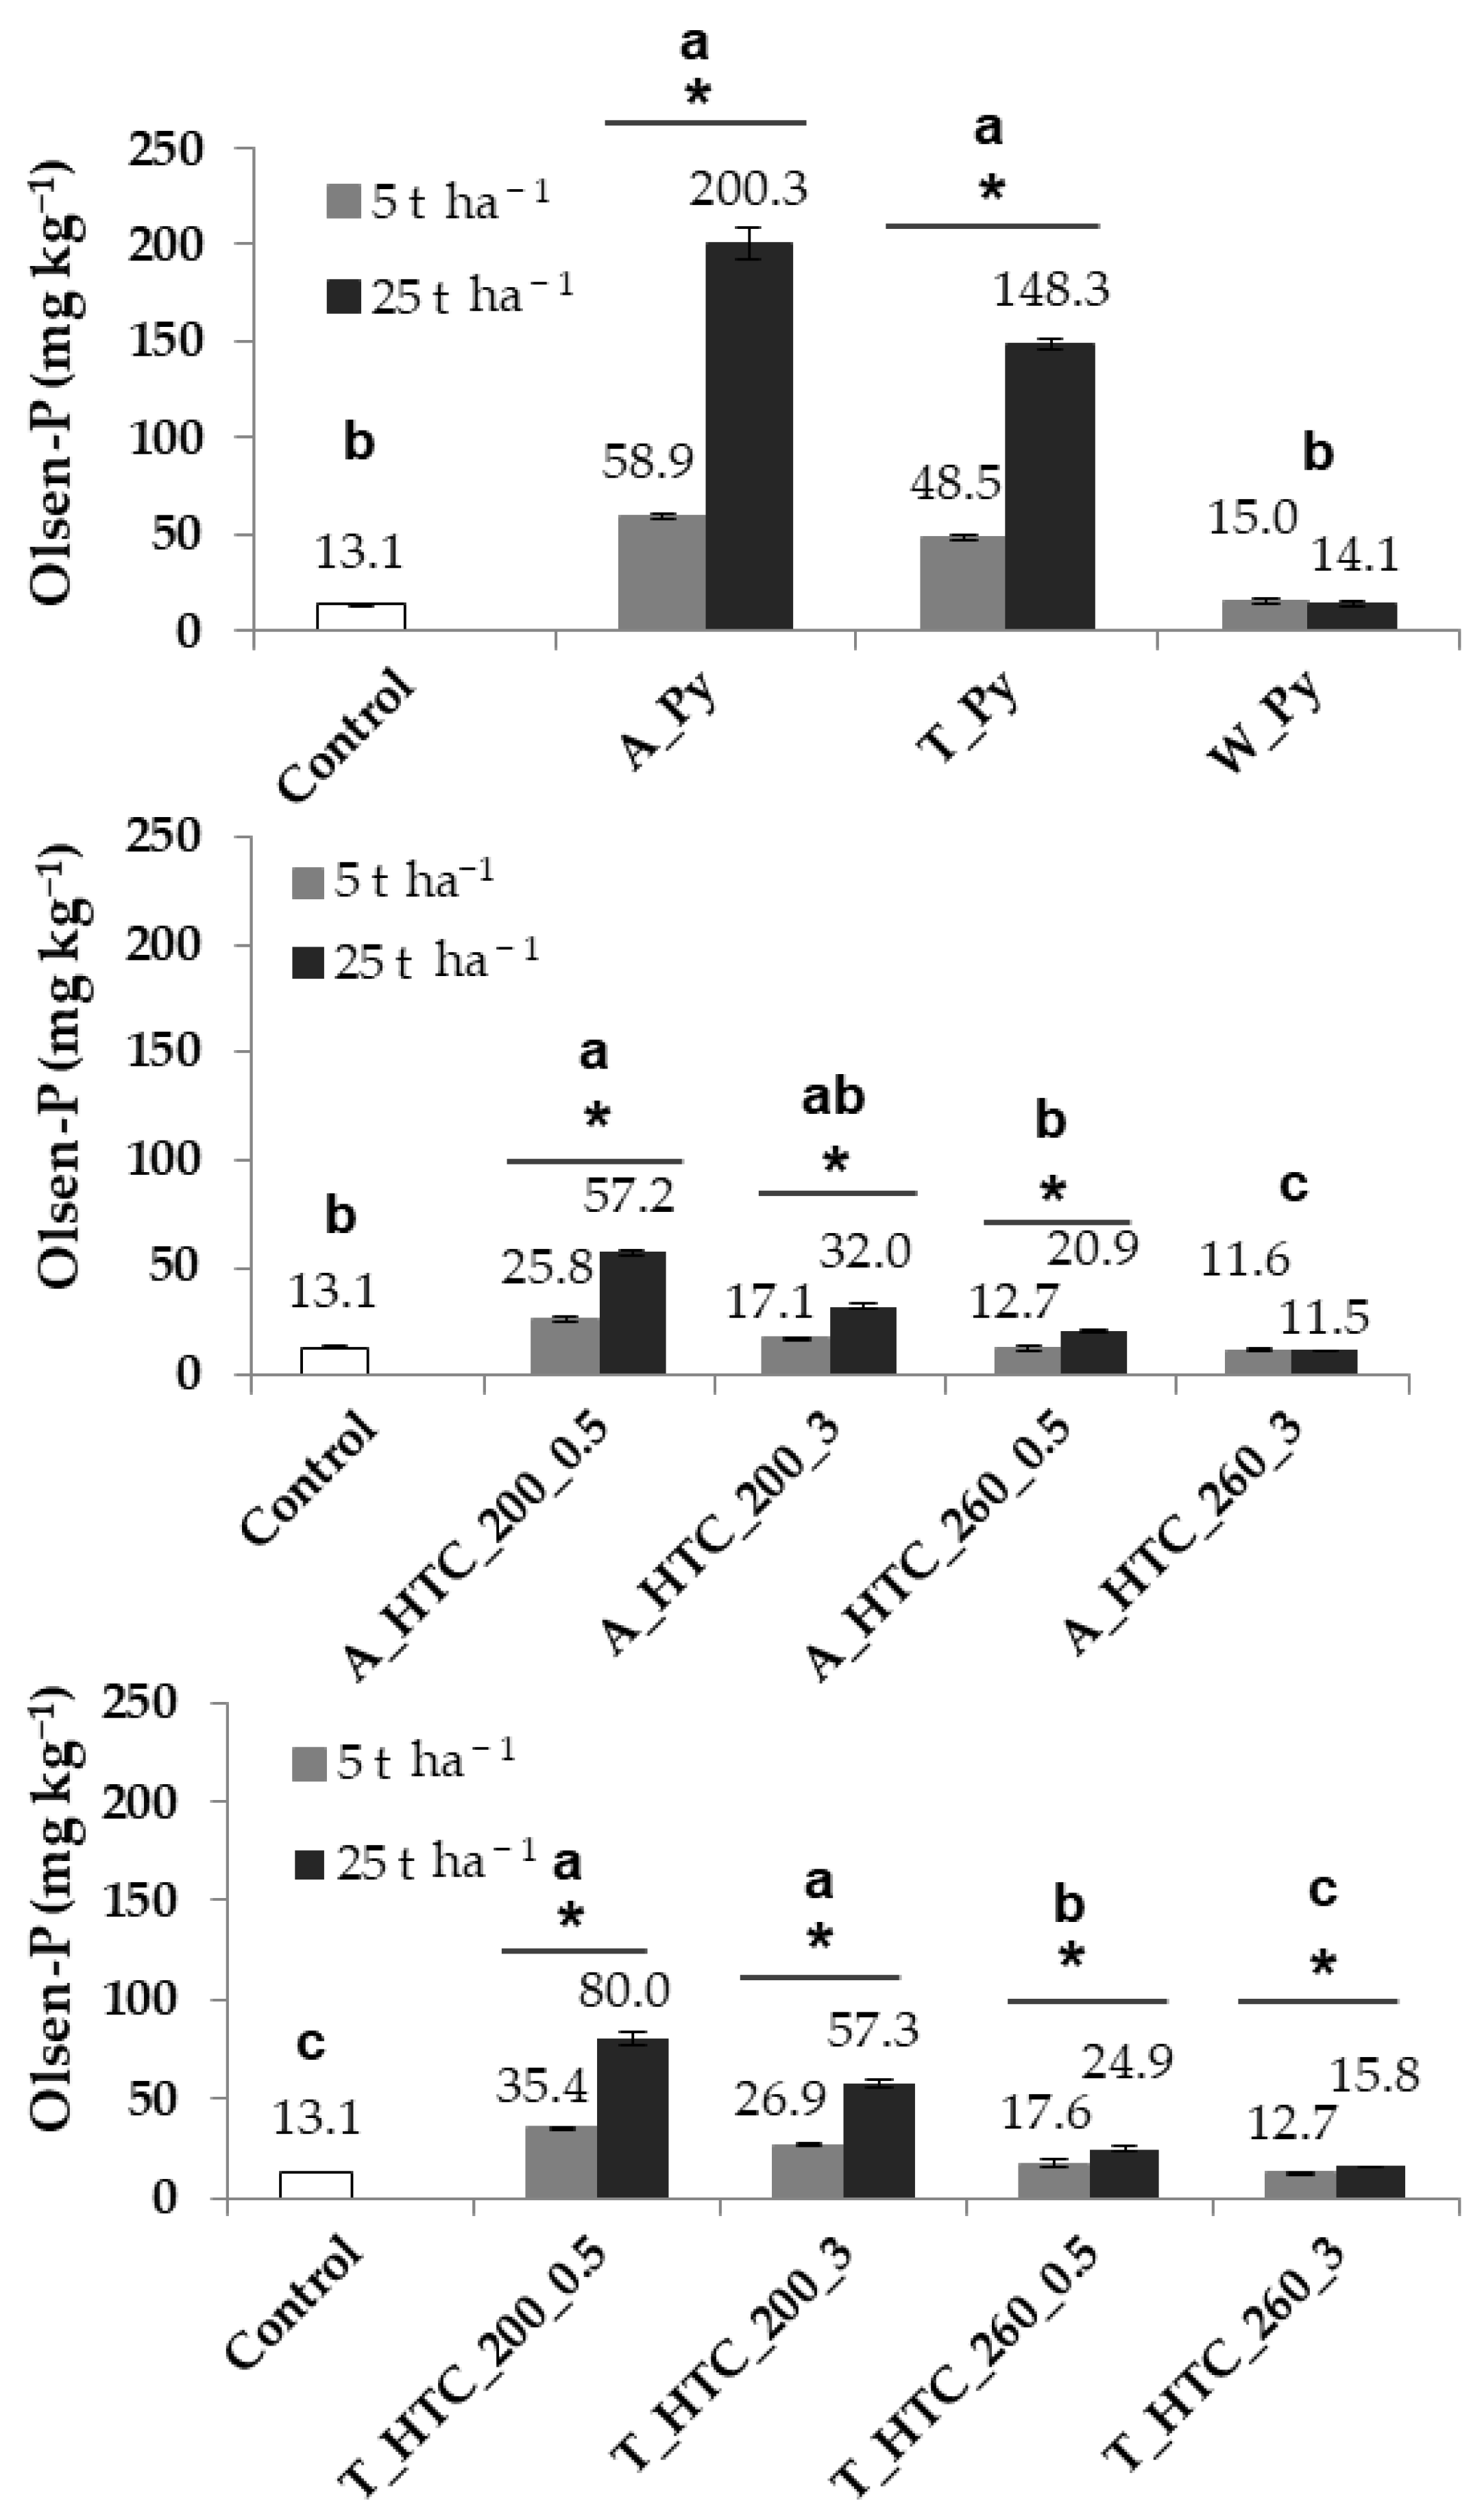
3.3. Contents of Total Phosporous (PT) and Olsen-P in the Soils Directly and 8 Weeks after Amendment of the Chars

Table 3 lists the content of PT in the amended soil and the amount of Olsen-P added to the soils with the amendment before starting the pot experiment. At the end of the experiment, 13 mg kg−1 Osen-P were extractable from the control soil (Figure 2), which is still in the range of the value determined for the fresh soil. In general, relative to the unamended control, most of the char-amended soils increased the amount of Olsen-P until the end of the cropping period. The impact of the hydrochars on the quantity of soil Olsen-P at end of the experiment declined with more severe hydrothermal conditions. Thus, the hydrochars obtained at 200 °C after 30 min charring yielded the highest amount of soil Olsen-P, whereas those produced at 260 °C for 3 h caused no impact on this parameter. Both A and T hydrochars showed a comparable behavior. However, the higher PT and Olsen-P contents of the T hydrochars led to slightly higher soil Olsen-P values. An augmentation of the application rate from 5 to 25 t ha−1 increased the soil Olsen-P at the end of the experiment, both for hydrochars and pyrochars. However, as expected from the contents of Olsen-P in the respective chars, the impact of SS-derived pyrochars was higher than that of the hydrochars. The soils amended with 5 t ha1 A_Py and T_Py showed a final Olsen-P concentration of 59 and 49 mg kg−1, respectively, whereas these values were between 3 and 4 times higher at the highest application rate. However, because of the low PT and Olsen-P contents of this W_Py, its addition to the soil did not affect this parameter at any dose.

4. Discussion

4.1. pH and Electrical Conductivity

At the end of the experiment, all the amended soils were still alkaline, although addition of the acid hydrochars have slightly declined the soil pH. Even the addition of the alkaline pyrochars caused a slight decrease in the soil pH at the end of the experiment. The release of root exudates, acidifying the soil, together with their inherent buffering capacity may explain these results. Bruun et al. [26] report minor changes of the pH after the addition of pyrochar even to an acidic soil. Since the impact on soil pH of both hydrochars and pyrochars at 5 t ha−1 is slight, we expected no beneficial effect on soil nutrients availability. However, the soil pH at the highest application dose was closer to neutrality and hence nutrient availability may have been favored. Moreover, small differences in soil pH have been proved to impact soil phosphatase activity and hence the mineralization of organic P in soils [27].
Our results indicated a decrease in EC during dry pyrolysis. Wang et al. [28] obtained comparable results for pyrolysis. Note that, in general, this parameter decreases with increasing temperature and residence time during char production, which is most likely due to the loss of the charged organic groups, such as the carboxyl groups. However, selective enrichment of minerals associated with the thermally induced loss of organic matter can lead to an opposite observation. Bearing in mind that the primary and secondary SS were derived from the same wastewater treatment plant and that the ash contents of the hydrochars of both sludges are comparable, the different behavior of their EC during HTC may be due to different chemical alterations of their organic matter, but may also be due to the cleaning process of the products after HTC. Here, the process water and unwanted soluble organic compounds, such as furfurals, were removed by washing and subsequent filtration. It may be assumed that this cleaning process affected the content of ions in the cleaned sample.
Most crops grow properly in soils with EC values between 100 and 1000 μS cm−1. On the other hand, soils with more than 2000 μS cm−1 are considered saline [29]. Although the EC of the pure hydrochars and pyrochars exceeded the abovementioned limits, their application to the soil at doses of 5 and 25 t ha−1 diluted their concentration sufficiently to maintain the EC of the soil below the salinity threshold.

4.2. Fate of Total P and Olsen P during HTC and Dry Pyrolysis of SS

Our SS reveal PT contents that correspond to approximately half of the average of 28 g kg−1 calculated for the SS produced in the EU from the data reported in [3]. This is likely due to the fact that, in contrast to common SS, our sludges derive from a wastewater treatment plant (WWTP) that processes the domestic wastewater of a small village with at most 3000 residents, whereas most of the common WWTPs process the wastewater of larger populations. In addition, considering that Al and Ca are the predominant metals of A_SS and T_SS (Table 1), Ca and Al phosphates are likely to dominate in our samples since the type of metal–phosphate complexes are strongly influenced by the composition of the feedstock.
The relative enrichment of PT after both pyrolysis and HTC has been previously described and is a consistent behavior [9,19,27]. This is partially related to the concomitant losses of carbon (C), nitrogen (N) and hydrogen (H) observed during the heat treatment [8] but can also be explained by heat-induced immobilization reactions. The underlying mechanisms explaining this immobilization of P, however, are not yet completely understood. Complexation of P with Al, Ca and Fe has been observed and suggested to play a key role [13,20,30]. Most likely, such mechanisms immobilized the P in our chars too, since a relative enrichment of Ca, Mg, Fe and Al occurred after both thermal treatments (Table 2). In addition, the physical constraints embedding P species into the char structure may also contribute to the increase in the non-extractable P fraction.
The amount of Olsen-P declined during HTC for both A_SS and T SS (Figure 1). This reduction was more pronounced with harsher production conditions and can be related to increasing formation of inorganic orthophosphates and other soluble P forms [20] and their removal with the process water. Differences in the efficiency of removing soluble P forms during the sample cleaning may also explain the differences in Olsen-P contents of the hydrochars produced under the same conditions but from a different feedstock. On the other hand, dry pyrolysis increases the amount of pyrophosphate and short chain polyphosphates [20], which stay in the residue and contribute to the preservation of a higher amount of Olsen-P in the pyrochars. The low Olsen-P content of W_Py can be associated with its low PT content.

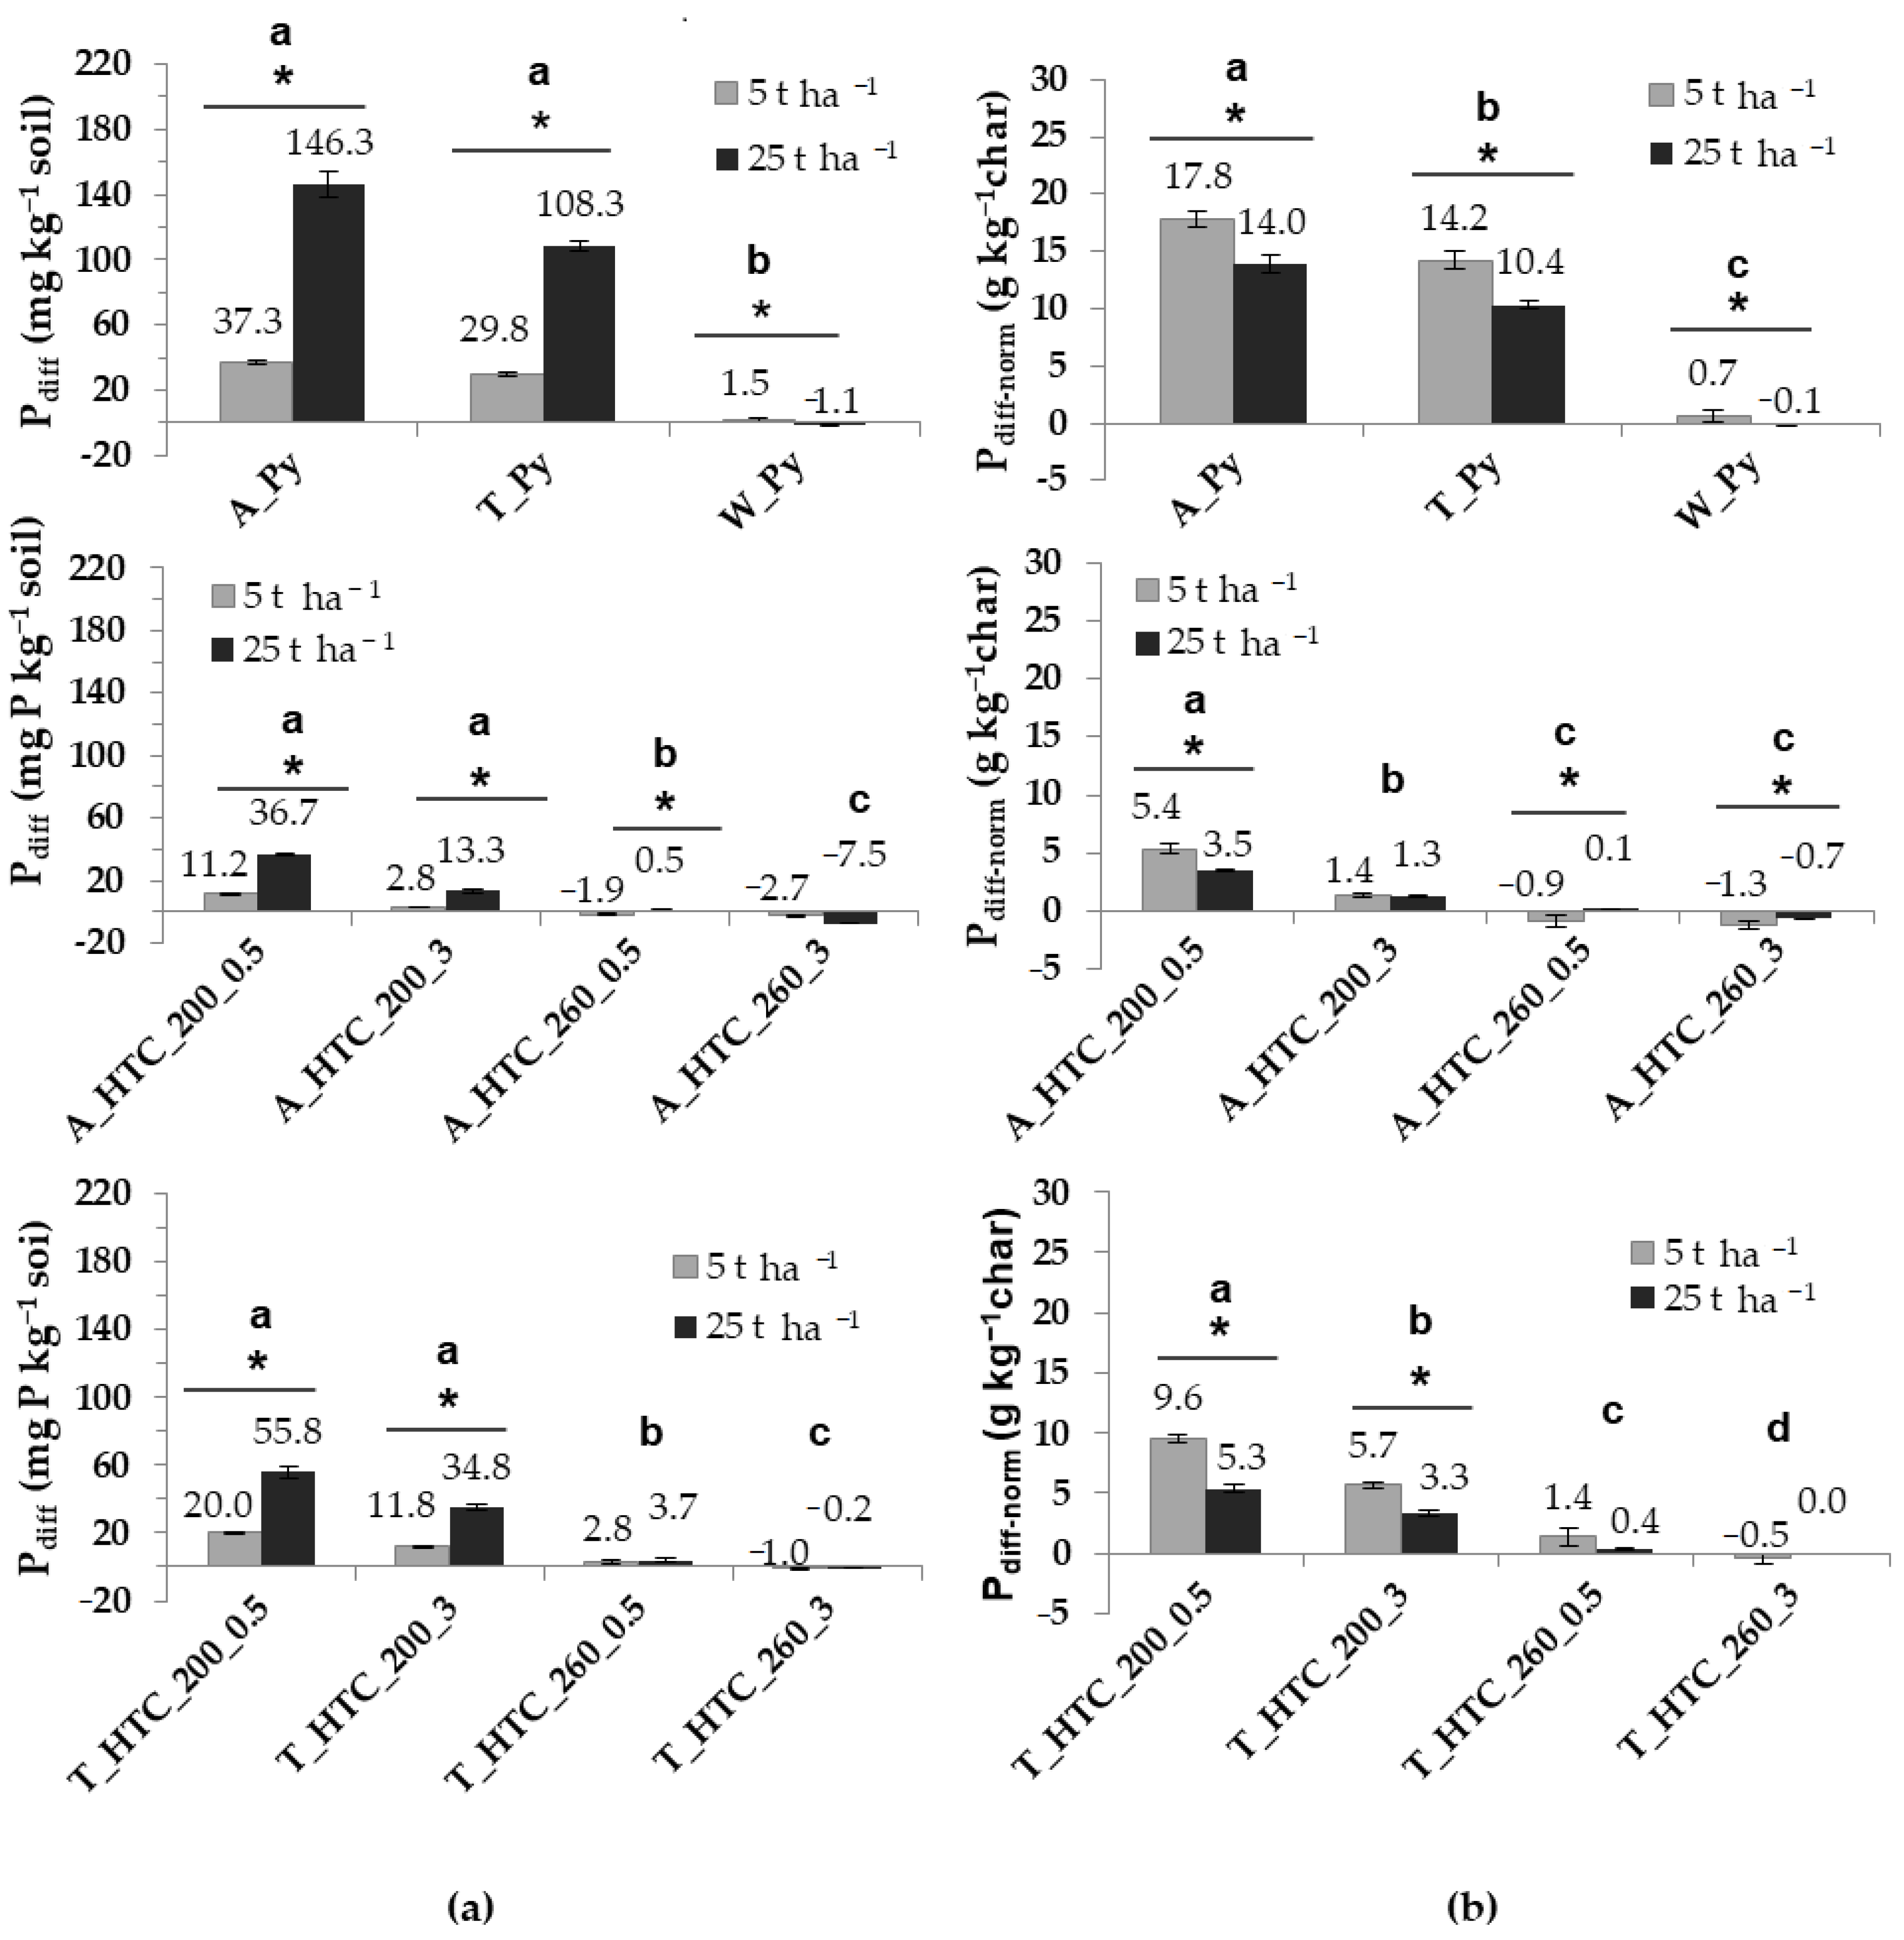
4.3. Phosphorus Dynamics during 80 Days of the Growing Period

For the discussion and evaluation of the P dynamics in the char-amended soils, we calculated Pdiff, which is the difference between the amount of char-derived Olsen-P at the end of the experiment relative to the amount of Olsen-P added with the amendment to the soil at the beginning of the experiment (Figure 3a). Negative values indicate efficient uptake by plants or immobilization by microbial growth and fixation/complexation with soil minerals. On the other hand, positive values evidence transformation of the originally insoluble char P to extractable forms occurring during plant growth, which even exceeded P immobilization. In our experiment, the pots amended with the hydrochars produced at 260 °C and W_Py showed very low or even negative Pdiff. Thus, it can be assumed that, during the experiment, almost all the Olsen-P of the chars was absorbed by the plants, immobilized by microorganisms and/or fixed with soil minerals. In contrast, the hydrochars produced at 200 °C and SS-derived pyrochars showed positive Pdiff values. Thus, the Pdiff of the hydrochars range between 35 and 0.3 mg kg−1 whereas for pyrochars it is between 146 and 30 mg kg−1, demonstrating a considerable net mobilization of char-derived insoluble P during cropping. A similar behavior was observed for pyrochars derived from animal waste [15,26].
Despite the char addition increasing the soil acidity in most cases, the soil pH did not reach the levels at which the phosphates that are fixed in mineral/metal complexes can solubilize easily through just abiotic processes. It is commonly assumed that in soils there are two main P solubility maxima, which occur around a pH of 4.5 and 6.5, respectively, coinciding with the lowest degree of P fixation by Ca, Al and Fe minerals [31]. Based on this, we concluded that biochemical processes played a key role for the mobilization of char-derived P during plant growth. Such processes include the activity of the phosphate-solubilizing microorganisms and the release of root exudates or siderophores [32]. Considering that the efficiencies of those reactions varied for the different chars strongly indicates that the chemical composition of the thermally produced P forms and their microbial degradability play an essential role with respect to their mobilization potential. In this context, one has also to bear in mind that amendment of the different chars may have resulted in a priming effect and affected the microbial activity to varying extents. This has already been described for manure biochar. Jin et al. [16] found that manure biochar affected phosphatase enzymatic activities and, hence, the mineralization of native soil organic P. This was explained by the impact of biochar on both soil pH and P composition.
For a better elucidation of the potential of our chars to release P, Pdiff was normalized as Pdiff per kg of char (Pdiff-norm) (Figure 3b). In accordance with the higher Pdiff in pyrochars compared to hydrochars, the net mobilization of P per kg of char was also higher for pyrochars than for hydrochars. Thus, the Pdiff-norm of A_Py and T_Py are between 18 and 10 g P kg−1 char, whereas for the hydrochars produced at 200 °C, this value lies between 10 and 1.3 g P kg−1 char. Note that compared to A_HTC the T_HTC yielded a higher P release, which is best explained with the higher PT contents of the latter compared to the former.
Inspecting the data in Figure 3a, the increase in Pdiff with enhancing the dose from 5 to 25 t ha−1 seems to be a logical consequence of the addition of higher amounts of PT. However, in our experiments, Pdiff-norm diminished with a higher application rate (Figure 3b); thus, P mobilization did not follow a linear correlation with PT addition. In search for an explanation, it is important to be aware of the difference between Olsen-P giving a number of potentially plant-available P and soil P that is really plant available. Whereas the latter strongly depends on soil pH, the first is defined by the pH of the extraction solution. Thus, although the different pH values were determined for the soils amended with 5 or 25 t ha−1, the extraction of both occurred under the same pH conditions. This excludes different soil pH values as an explanation for the non-linear relationship between char addition and Olsen-P content. In the same line, saturation of the soil solution with Olsen-P cannot have caused our result, since extraction shifts the equilibrium between dissolved and adsorbed or precipitated P towards dissolution.
Those considerations point again into the involvement of biochemical processes. They represent a complex interplay of metabolic pathways, which are regulated not only by substrate availability and P requirements but also by microbiome/biome composition, competition between plant and microorganism as well as the availability of organic C, N or other nutrients. We hypothesized that, at the beginning of the experiment, plant growth and microbial activity induced biochemical reactions that start the mobilization of char-derived P, irrespective of the P needs of the plants or the microorganisms. However, saturated microbial activity rather than substrate limitation or P need may be responsible for our observations.
Our observation indicated also that, in our system, P limitation did not occur. Paneque et al. [18] analyzed the impact of these same chars on Lolium perenne growth and found that plant growth was determined by the total and available N contents of the chars but not by their PT contents, which supports our results.

5. Conclusions

Except for A_Py, our results indicated the immobilization of P for both HTC and pyrolysis of SS. However, until the end of the experiment, both the addition of pyrochars or hydrochars produced at 200 °C increased the amount of soil Olsen-P compared to the control. Our calculations showed that this increase was not only explainable with the amount of Olsen-P added with the chars but must have been caused also by the transformation of originally non-extractable P of the chars into extractable forms during the cropping period.
Thus, in summary, we can conclude that both dry pyrolysis and, to a lower extent, low-temperature HTC can be promising techniques to produce treated SS with P-fertilizing properties. The immobilization/fixation of P caused by both thermal treatments may reduce fast P losses by leaching. In addition, the subsequent P release once the chars were applied to the soil indicates their suitability as slow-release P fertilizers. However, in order to elucidate the efficiency of this kind of fertilization, a better understanding of the impact of biochemical processes on the cycling of P immobilized in chars is needed.

Author Contributions

M.P., J.M.d.l.R., A.F.P. and H.K. conceived the work; conceptualization, M.P., J.M.d.l.R. and H.K.; methodology, M.P., H.K.; formal analysis, M.P.; resources, H.K.; data curation, M.P.; writing—original draft preparation, M.P.; writing—review and editing, M.P., J.M.d.l.R., A.F.P. and H.K.; supervision, H.K. and J.M.d.l.R.; project administration H.K.; funding acquisition, H.K. All authors have read and agreed to the published version of the manuscript.

Funding

This research was funded by the Spanish Ministry of Economy and Competitiveness, AEI/FEDER funds of the European Union (contract RYC2014-16338, projects PCGL2012-37041, CGL2015-64811-P and CGL2016-76498-R) and the Spanish Ministry of Education, Culture and Sport (Marina Paneque FPU fellowship, FPU 13/05831).

Institutional Review Board Statement

Not applicable.

Informed Consent Statement

Not applicable.

Data Availability Statement

Data will be made available upon request.

Acknowledgments

Carlos Aragón and the Experimental Wastewater Treatment plant (CENTA) are acknowledged for providing the sewage sludges. Jürgen Kern is thanked for providing the access to the laboratory of the Leibniz Institute for Agricultural Engineering and Bioeconomy (ATB) in Potsdam, Germany, for the production of the chars and Ulf Lüder is thanked for his assistance during the production process. The analytical service center of the ATB is thanked for providing the analytical data of the chars.

Conflicts of Interest

The authors declare no conflict of interest. The funders had no role in the design of the study; in the collection, analyses, or interpretation of data; in the writing of the manuscript, or in the decision to publish the results.

References

  1. Tóth, G.; Guicharnaud, R.-A.; Tóth, B.; Hermann, T. Phosphorus levels in croplands of the European Union with implications for P fertilizer use. Eur. J. Agron. 2014, 55, 42–52. [Google Scholar] [CrossRef]
  2. Cordell, D.; White, S. Tracking phosphorus security: Indicators of phosphorus vulnerability in the global food system. Food Secur. 2015, 7, 337–350. [Google Scholar] [CrossRef]
  3. Milieu Ltd., WRc and Risk & Policy Analysts Ltd (RPA). Environmental, Economic and Social Impacts of the Use of Sewage Sludge on Land. Final Report, Part I: Project Interim Reports, DG ENV.G.4/ETU/2008/0076r. 10.2.2010. Available online: https://ec.europa.eu/environment/archives/waste/sludge/pdf/part_i_report.pdf (accessed on 17 May 2020).
  4. Libra, J.A.; Ro, K.S.; Kammann, C.; Funke, A.; Berge, N.D.; Neubauer, Y.; Titirici, M.-M.; Fühner, C.; Bens, O.; Kern, J.; et al. Hydrothermal carbonization of biomass residuals: A comparative review of the chemistry, processes and applications of wet and dry pyrolysis. Biofuels 2011, 2, 71–106. [Google Scholar] [CrossRef] [Green Version]
  5. Lehmann, J.; Joseph, S. Biochar for Environmental Management: Science and Technology, 2nd ed.; Earthscan: London, UK, 2015. [Google Scholar]
  6. IBI International Biochar Initiative. Standardized Product Definition and Product Testing Guidelines for Biochar that is Used in Soil: Version Number 2.1; Zurich Open Repository and Archive: Zurich, Switzerland, 2015; Available online: https://www.biochar-international.org/wp-content/uploads/2018/04/IBI_Biochar_Standards_V2.1_Final.pdf (accessed on 17 March 2020).
  7. EBC. European Biochar Certificate—Guidelines for a Sustainable Production of Biochar; European Biochar Foundation: Arbaz, Switzerland, 2012; Version 8E 2019; Available online: http://www.european-biochar.org/biochar/media/doc/ebc-guidelines.pdf (accessed on 17 May 2020).
  8. Paneque, M.; De la Rosa, J.; Kern, J.; Reza, M.; Knicker, H. Hydrothermal carbonization and pyrolysis of sewage sludges: What happen to carbon and nitrogen? J. Anal. Appl. Pyrolysis 2017, 128, 314–323. [Google Scholar] [CrossRef] [Green Version]
  9. Frišták, V.; Pipíška, M.; Soja, G. Pyrolysis treatment of sewage sludge: A promising way to produce phosphorus fertilizer. J. Clean. Prod. 2018, 172, 1772–1778. [Google Scholar] [CrossRef]
  10. Lehmann, J.; Gaunt, J.; Rondon, M.B. Bio-char Sequestration in Terrestrial Ecosystems—A Review. Mitig. Adapt. Strat. Glob. Chang. 2006, 11, 403–427. [Google Scholar] [CrossRef]
  11. Wang, Y.; Lin, Y.; Chiu, P.C.; Imhoff, P.T.; Guo, M. Phosphorus release behaviors of poultry litter biochar as a soil amendment. Sci. Total Environ. 2015, 512–513, 454–463. [Google Scholar] [CrossRef] [PubMed]
  12. Dai, L.; Tan, F.; Wu, B.; He, M.; Wang, W.; Tang, X.; Hu, Q.; Zhang, M. Immobilization of phosphorus in cow manure during hydrothermal carbonization. J. Environ. Manag. 2015, 157, 49–53. [Google Scholar] [CrossRef] [PubMed]
  13. Li, M.; Tang, Y.; Lu, X.-Y.; Zhang, Z.; Cao, Y. Phosphorus speciation in sewage sludge and the sludge-derived biochar by a combination of experimental methods and theoretical simulation. Water Res. 2018, 140, 90–99. [Google Scholar] [CrossRef] [PubMed]
  14. Cui, X.; Yang, X.; Sheng, K.; He, Z.; Chen, G. Transformation of Phosphorus in Wetland Biomass during Pyrolysis and Hydrothermal Treatment. ACS Sustain. Chem. Eng. 2019, 7, 16520–16528. [Google Scholar] [CrossRef]
  15. Christel, W.; Bruun, S.; Magid, J.; Jensen, L.S. Phosphorus availability from the solid fraction of pig slurry is altered by composting or thermal treatment. Bioresour. Technol. 2014, 169, 543–551. [Google Scholar] [CrossRef] [PubMed]
  16. Jin, Y.; Liang, X.; He, M.; Liu, Y.; Tian, G.; Shi, J. Manure biochar influence upon soil properties, phosphorus distribution and phosphatase activities: A microcosm incubation study. Chemosphere 2016, 142, 128–135. [Google Scholar] [CrossRef] [PubMed]
  17. Glaser, B.; Lehr, V.-I. Biochar effects on phosphorus availability in agricultural soils: A meta-analysis. Sci. Rep. 2019, 9, 1–9. [Google Scholar] [CrossRef] [PubMed] [Green Version]
  18. Paneque, M.; Knicker, H.; Kern, J.; De La Rosa, J.M. Hydrothermal Carbonization and Pyrolysis of Sewage Sludge: Effects on Lolium perenne Germination and Growth. Agronomy 2019, 9, 363. [Google Scholar] [CrossRef] [Green Version]
  19. Wang, T.; Zhai, Y.; Zhu, Y.; Peng, C.; Wang, T.; Xu, B.; Li, C.; Zeng, G. Feedwater pH affects phosphorus transformation during hydrothermal carbonization of sewage sludge. Bioresour. Technol. 2017, 245, 182–187. [Google Scholar] [CrossRef] [PubMed]
  20. Fei, Y.-H.; Zhao, D.; Liu, Y.; Zhang, W.; Tang, Y.-Y.; Huang, X.; Wu, Q.; Wang, Y.-X.; Xiao, T.; Liu, C. Feasibility of sewage sludge derived hydrochars for agricultural application: Nutrients (N, P, K) and potentially toxic elements (Zn, Cu, Pb, Ni, Cd). Chemosphere 2019, 236, 124841. [Google Scholar] [CrossRef]
  21. European Commission. Working Document of Sludge, 3rd ed.; ENV-E-3/ LM; DG Environment: Brussels, Belgium, 27 April 2000. [Google Scholar]
  22. IUSS Working Group WRB. World Reference Base for Soil Resources 2014; World Soil Resources Report; FAO: Rome, Italy, 2014; Available online: http://www.fao.org/3/i3794en/I3794en.pdf (accessed on 4 September 2020).
  23. De La Rosa, J.M.; Paneque, M.; Miller, A.Z.; Knicker, H. Relating physical and chemical properties of four different biochars and their application rate to biomass production of Lolium perenne on a Calcic Cambisol during a pot experiment of 79 days. Sci. Total Environ. 2014, 499, 175–184. [Google Scholar] [CrossRef] [PubMed] [Green Version]
  24. Olsen, S.R.; Cole, C.V.; Watanabe, F.S.; Dean, L.A. Estimation of Available Phosphorus in Soils by Extraction with Sodium Bicarbonate; Report 939; United States Department of Agriculture: Washington, DC, USA, 1954.
  25. Paneque, M.; De La Rosa, J.M.; Franco-Navarro, J.D.; Colmenero-Flores, J.M.; Knicker, H. Effect of biochar amendment on morphology, productivity and water relations of sunflower plants under non-irrigation conditions. Catena 2016, 147, 280–287. [Google Scholar] [CrossRef] [Green Version]
  26. Bruun, S.; Harmer, S.L.; Bekiaris, G.; Christel, W.; Zuin, L.; Hu, Y.; Jensen, L.S.; Lombi, E. The effect of different pyrolysis temperatures on the speciation and availability in soil of P in biochar produced from the solid fraction of manure. Chemosphere 2017, 169, 377–386. [Google Scholar] [CrossRef] [PubMed]
  27. Colvan, S.; Syers, J.; O’Donnell, A. Effect of long-term fertiliser use on acid and alkaline phosphomonoesterase and phosphodiesterase activities in managed grassland. Biol. Fertil. Soils 2001, 34, 258–263. [Google Scholar] [CrossRef]
  28. Wang, T.; Camps-Arbestain, M.; Hedley, M.; Bishop, P. Predicting phosphorus bioavailability from high-ash biochars. Plant Soil 2012, 357, 173–187. [Google Scholar] [CrossRef]
  29. Soil Survey Division Staff. Soil Survey Manual. Soil Conservation Service; Handbook 18; United States Department of Agriculture: Washington, DC, USA, 1993.
  30. Huang, R.; Tang, Y. Evolution of phosphorus complexation and mineralogy during (hydro) thermal treatments of activated and anaerobically digested sludge: Insights from sequential extraction and P K-edge XANES. Water Res. 2016, 100, 439–447. [Google Scholar] [CrossRef] [PubMed] [Green Version]
  31. Penn, C.; Camberato, J. A Critical Review on Soil Chemical Processes that Control How Soil pH Affects Phosphorus Availability to Plants. Agriculture 2019, 9, 120. [Google Scholar] [CrossRef] [Green Version]
  32. Adhya, T.K.; Kumar, N.; Reddy, G.; Podile, A.R.; Bee, H.; Samantaray, B. Microbial mobilization of soil phosphorus and sustainable P management in agricultural soils. Curr. Sci. 2015, 108, 1280–1287. Available online: https://www.jstor.org/stable/24905489 (accessed on 17 March 2020).
Figure 1. P extracted by the Olsen method (Olsen-P) together with their standard deviation of the primary (A_SS) and secondary (T_SS) sewage sludges, their respective hydrochars produced at 200 °C and 260 °C for 0.5 h and 3 h (A_HTC 200_0.5/3, A_HTC 260_0.5/3, T_HTC 200_0.5/3, T_HTC 260_0.5/3), and their being pyrochars A_Py and T_Py and the green waste pyrochar (W_Py). Error bars represent the standard deviation of the mean (n = 3).
Agronomy 11 00623 g001
Figure 2. P extracted by the Olsen method (Olsen-P) in the control (soil without amendment but with plant growth) and hydrochar- and pyrochar-amended pots at 5 and 25 t ha−1 at the end of the greenhouse experiment. The hydrochars were produced from primary (A) and secondary sludge (T) at 200 °C and 260 °C for 0.5 h and 3 h (A_HTC 200_0.5/3, A_HTC 260_0.5/3; S_HTC 200_0.5/3, T_HTC 260_0.5/3). The pyrochars A_Py, T_Py were obtained from primary and secondary sludge and W_Py from green waste. The letters show significant differences between treatments. The above-line asterisks indicate significant differences between doses. Error bars represent the standard deviation of the mean (n = 4).
Agronomy 11 00623 g002
Figure 3. (a) Difference in Olsen-P (Pdiff) from the Olsen-P in the chars before starting and at the end of the experiment; (b) phosphorus release normalized to kg of added char (Pdiff-norm). The above-line asterisks indicate significant differences between doses. The letters show significant differences between treatments. The hydrochars were produced from primary (A) and secondary sludge (T) at 200 °C and 260 °C for 0.5 h and 3 h (A_HTC 200_0.5/3, A_HTC 260_0.5/3; S_HTC 200_0.5/3, T_HTC 260_0.5/3). The pyrochars A_Py and T_Py were obtained from primary and secondary sludge and W_Py from green waste. Error bars represent the standard deviation of the mean (n = 4).
Agronomy 11 00623 g003
Table 1. The pH, electrical conductivity (EC), ash and total P (PT) contents, as well as P recovery, concentrations of Olsen-P, Ca, Mg, Fe and Al for primary (A_SS) and secondary (T_SS) sewage sludges, for the respective hydrochars produced at 200 °C and 260 °C for 0.5 h and 3 h (A_HTC 200_0.5/3, A_HTC 260_0.5/3, S_HTC 200_0.5/3, T_HTC, T_HTC 260_0.5/3), the respective pyrochars being A_Py and T_Py, a pyrochar from green waste (W_Py) and for the soil. Except for the soil, the values for pH, electrical conductivity (EC), ash, PT, as well as Ca, Mg, Fe and Al for the hydro/pyrochars are average values provided by the analytical service of the producer. Olsen-P is given as the mean and the respective standard deviation.
pHECAsh PTP RecoveryOlsen-PCaMgFeAl
mS cm−1mg g−1g kg−1(%)mg kg−1g kg−1g kg−1g kg−1g kg−1
A_SS 7.415.054012.3100510 ± 1173.38.615.836.5
A_HTC_200_0.56.515.061113.997.9183 ± 280.79.018.542.0
A_ HTC_200_36.512.862514.590.4139 ± 1084.49.319.444.0
A_ HTC_260_0.56.43.065615.487.8181 ± 387.410.019.745.7
A_ HTC_260_36.68.565714.979.1145 ± 1686.59.619.144.2
T_SS7.514.550716.7100651 ± 1962.29.219.132.2
T_ HTC_200_0.56.725.557020.099.7278 ± 1872.810.123.139.6
T_ HTC_200_36.224.861220.882.3234 ± 476.110.924.041.0
T_ HTC_260_0.56.318.364521.678.5200 ± 178.511.624.442.2
T_ HTC_260_36.421.366121.673.370 ± 178.711.726.142.3
A_Py9.36.376117.081.21017 ± 12100.010.921.750.1
T_Py10.09.372625.275.9668 ± 1992.513.628.248.5
W_Py9.31.11 n.d.0.7n.d.51 ± 1n.d.n.d.n.d.n.d.
Soil8.5 ± 0.1 0.13 ± 0.03n.d.0.4n.d.11.961.92.29.39.5
1 n.d.: not determined.
Table 2. Soil pH and electrical conductivity (EC) in the control (soil without amendment) and hydrochar- and pyrochar-amended pots at 5 and 25 t ha−1 at the end of the greenhouse experiment. The hydrochars were produced from primary (A) and secondary sludge (T) at 200 °C and 260 °C for 0.5 h and 3 h (A_HTC 200_0.5/3, A_HTC 260_0.5/3; S_HTC 200_0.5/3, T_HTC 260_0.5/3). The pyrochars A_Py and T_Py were obtained from primary and secondary sludge and W_Py from green waste. The values are the means ± standard deviations from four replicates. For all pH and EC values, the numbers followed by the same letter indicate no significant differences at the p < 0.05 level.
pHEC
µS cm−1
Control8.4±0.02 a100.6±2.0 a
Amended Soils5 t ha−125 t ha−15 t ha−125 t ha−1
A_HTC_200_0.58.0±0.03 de7.4±0.07 gh116.4±7.7 a280.0±18.3 c
A_ HTC_200_38.2±0.03 b7.0±0.02 i112.6±7.5 a380.3±39.6 d
A_ HTC_260_0.58.2±0.05 bc7.5±0.09 fg111.0±14.4 a231.8±10.7 b
A_ HTC_260_38.0±0.12 cd7.3±0.09 h103.5±1.9 a256.5±37.6 bc
T_ HTC_200_0.58.0±0.11 cd7.3±0.06 h111.9±2.2 a644.3±22.4 f
T_ HTC_200_38.2±0.05 bc7.0±0.04 i109.0±1.2 a524.8±10.8 e
T_ HTC_260_0.58.2±0.03 bc7.5±0.04 fg117.0±2.4 a554.0±27.4 e
T_ HTC_260_38.1±0.07 bcd7.6±0.05 f117.3±5.4 a378.5±8.1 d
A_Py8.2±0.04 b7.3±0.09 h115.4±2.1 a236.0±15.1 b
T_Py8.2±0.04 bc7.8±0.03 e129.5±3.9 a223.3±9.0 b
W_Py8.4±0.04 a8.5±0.07 a92.4±0.1 a108.5±5.2 a
Table 3. Amount of total P (PT) and in the soils amended with 5 and 25 t ha−1 hydro- or pyrochar before starting the experiment and the amount of Olsen-P added with the hydrochars and pyrochars. The hydrochars were produced from primary (A) and secondary sludge (T) at 200 °C and 260 °C for 0.5 h and 3 h (A_HTC 200_0.5/3, A_HTC 260_0.5/3; S_HTC 200_0.5/3, T_HTC 260_0.5/3). The pyrochars A_Py and T_Py were obtained from primary and secondary sludge and W_Py from green waste.
Total P aOlsen-P b
5 t ha−125 t ha−15 t ha−125 t ha−1
g kg−1 Soilmg kg−1 Soil
A_HTC_200_0.50.510.941.57.3
A_HTC_200_30.520.971.25.6
A_HTC_260_0.50.521.001.57.3
A_HTC_260_30.520.981.25.8
T_HTC_200_0.50.561.192.311.2
T_HTC_200_30.571.221.99.4
T_HTC_260_0.50.581.251.78.0
T_HTC_260_30.581.250.62.8
A_Py0.541.078.440.8
T_Py0.611.405.526.8
W_Py0.400.410.42.1
a soil + char; b added with the char.
Publisher’s Note: MDPI stays neutral with regard to jurisdictional claims in published maps and institutional affiliations.

