1. Introduction
The current demand for quality horticultural products considering the international standards of safety, good agricultural practices (GAP), and sustainable development has led to the development of practices such as organic fertilization, the rational use of water and nutrients, and the biological control of pests and diseases, among others. With respect to the rational use of water and nutrients, different technologies have been studied such as sub-irrigated planter systems [
1], recirculation in hydroponic systems [
2], and the implementation of cascade cropping systems [
3,
4]. Nevertheless, the reuse of the leachate increases the risk of pathogens such as
Verticillium dahliae and
Phytophthora capsici [
5], which are disseminated by water [
6].
Disinfection strategies for soils, substrates, and irrigation water include the use of different chemical compounds such as methyl bromide, chloropicrin, dazomet, and metam sodium, which are currently banned in the European Union [
7]. Nowadays, the agricultural implementation of sustainable alternatives for cleaning urban wastewater through oxidative degradation of organic matter are based on the application of other chemical compounds with lower toxicity, such as hydrogen peroxide (H
2O
2) [
8], chlorine (Cl
2), peroxyacetic acid (C
2H
4O
3) [
9,
10], and ozone (O
3) [
11], the most recently implemented.
Ozone has a higher oxidizing power than H
2O
2, Cl
2, or C
2H
4O
3. The molecule of O
3 is unstable; it decomposes into hydroxyl radicals (OH
−), hydroperoxide (HO
2−), and superoxide (O
2−), which are responsible for microbial inactivation through a process of the cytoplasmic membrane and cell-wall destruction [
12]. These properties confer to this compound a high bactericidal, virucidal, and fungicidal effect. Therefore, O
3 is considered the fastest method for inactivation or elimination compared to other disinfecting agents that require penetration of the cell membrane to be effective. Consequently, O
3 is also used in other fields such as industrial and medical processes, for instance, disinfection of COVID-19 material [
13]. Nevertheless, it is necessary to highlight its toxicity. The European Commission established that the human exposure hazard to O
3 is 120 µg m
−3 with a maximum daily exposure of 8 h (Directive 2008/50/CE) [
14].
Regarding the effects of high concentrations of tropospheric O
3 on different crops, there are several references in the literature. For instance, Macdowall et al. [
15] reported the presence of necrosis in tobacco leaves (weather fleck) in environments with up to 40 ppb of O
3 gas during 14 continuous hours at night. Likewise, Kumari et al. [
16] reported a growth reduction in
Beta vulgaris under a concentration of 70 ppb of O
3. Nevertheless, the experiments carried out with dissolved O
3 in irrigation water are scarce. For instance, Graham et al. [
17], Graham et al. [
18], and Martínez-Sánchez and Aguayo [
19] reported the positive effect of the application of dissolved O
3 in irrigation water in five nursery crops, in tomato, and in pepper, respectively. Therefore, we aimed to check whether this positive effect occurs with dissolved O
3 in pepper crops in two different scenarios: under irrigation with water or fertigation with a standard nutrient solution, and also to determine the optimal concentration of O
3 supply by focusing on the changes caused at the physiological and nutritional level in pepper plants.
4. Discussion
Coll et al. [
29] defined as “unfavorable conditions” those in which the environmental conditions deviate from those considered optimal, and plants modify their development to adapt to them, producing enzymes or accelerating their development. These unfavorable conditions are known as biotic or abiotic stress.
Under stress conditions such as high temperature [
30], waterlogging [
31], salinity [
32], and hydric and nutrient deficiencies [
25], plants must change their physiology and increase their efficiency so as to use few nutrients available to fulfill their development cycles as occurs under O
0.
The supply of O
3 dissolved in irrigation water led to an autolysis process in the matrix substrate, generating active oxygen species (H
2O
2, OH
−, O
2−) [
33] and an increase in pH [
34]. The chemical autolysis is potentiated because O
3 reacts with molecules containing nitrogen, hydrogen, chlorine, or bromine. Moreover, there should not be transference to the environment because O
3 solubility in water is in the range of 780 mg L
−1 at 10 °C to 270 mg L
−1 at 40 °C, higher that our tested concentrations. For these reasons, we suggest that under the conditions assessed in our experiment, pepper plants should have higher O
2 availability. Sloan and Engelke [
35] reported similar conditions in
Agrostis stolonifera using aerated nutrient solution and O
3.
Considering O
2 concentration in the nutritive solution, studies carried out applying low concentrations of O
2 in the nutrient solution in corn plants showed a decrease in biomass [
36], especially in root biomass [
37]. These results could be considered similar to O
0 compared to O
0.54 in the first experiment. Although in O
0 there were no anoxic conditions that may cause a shortage of O
2, its concentration was lower than in O
0.54.
Suyantohadi et al. [
38] reported beneficial effects applying high levels of dissolved O
2 (from 20 to 30 mg L
−1) in hydroponically grown lettuce. Experiments with cucumbers and peppers had relatively little success in improving the yield of fruits exposed to an increase in dissolved O
2 in the nutrient solution [
39]. In addition, O
2 concentrations higher than 30 mg L
− 1 generated detrimental production in tomato under a hydroponic system [
40].
Considering O
3 supplies, Kobayashi et al. [
41], using O
3 microbubbles at 0.2 ppm in the nutrient solution, reported no adverse effects on lettuce growth. Similar results were reported by Zheng et al. [
42] (2–4 mg L
−1) in lettuce and by Ohashi-Kaneko et al. [
43] (0–10 mg L
−1) in tomato plants. Nevertheless, Najarian et al. [
44] reported a higher growth of cucumber plants with an O
3 dosage of 0.5 mg L
−1. Similarly, irrigation with ozonated water at 0.5 mg L
−1 increased the fresh weight of bok choy and Chinese spinach [
45]. This increase in biomass can be related to the enhancement of root respiration by the presence of ozonated water [
46].
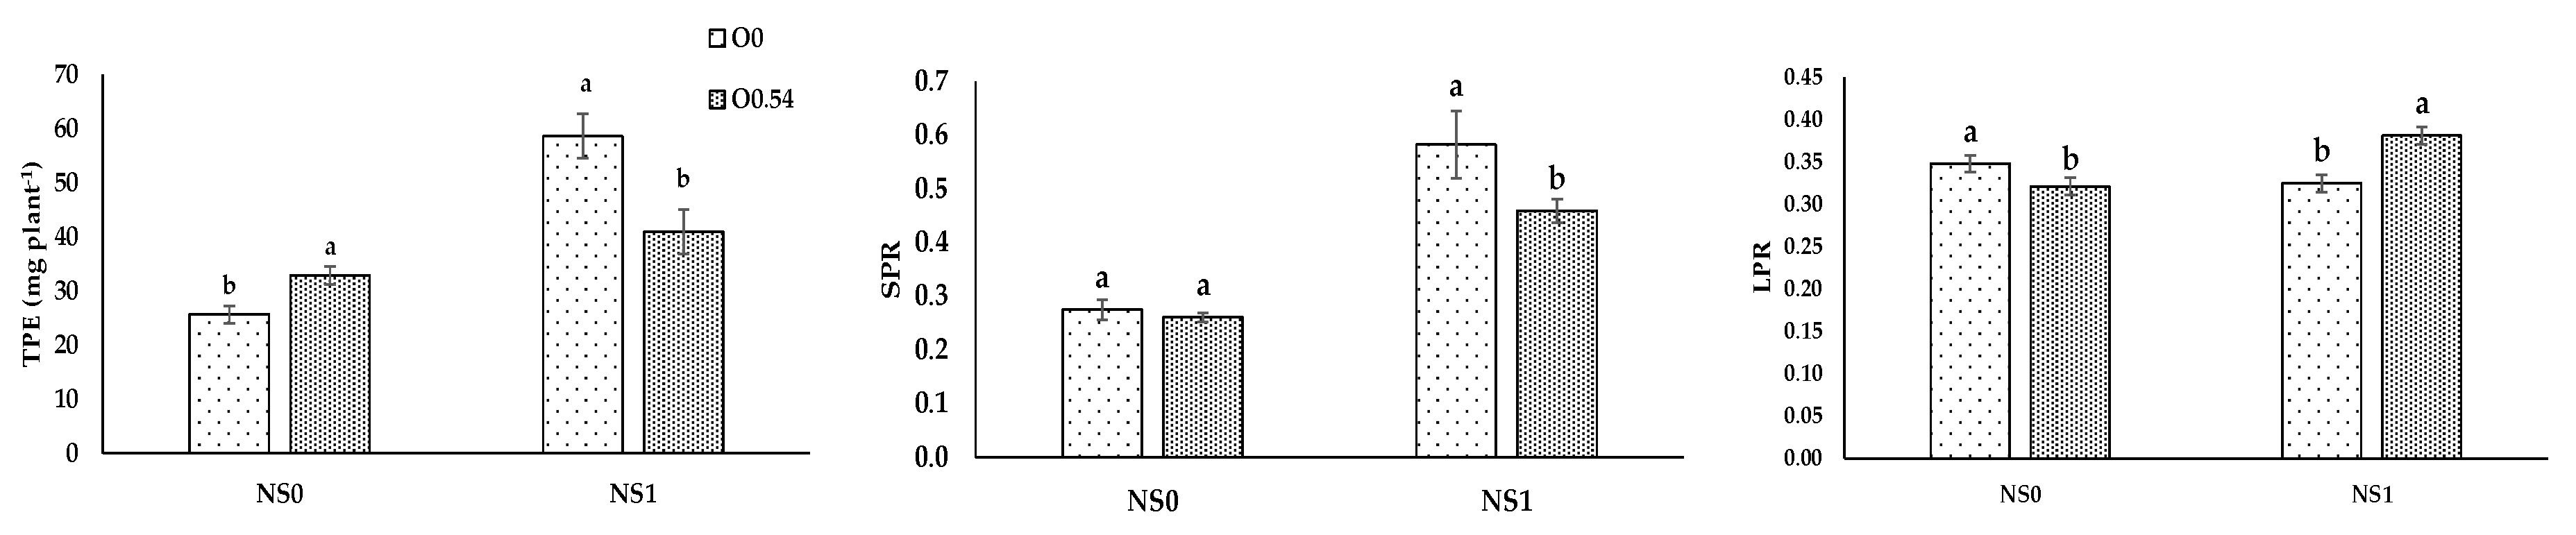
The data obtained in our experiment show an increase in biomass especially accumulated in the stem fraction of pepper plants through the application of O
3 in the nutritive solution treatments, in agreement with the results reported by Graham et al. [
18] in tomato. Nevertheless, the highest total dry weight in the second experiment was associated with the O
0.18 and O
0.36 treatments but not at the highest concentration, which can be associated with the higher sensitivity to elevated O
3 reported by Wittig et al. [
47].
In our experiment, pepper plants irrigated only with water showed the highest relative water content. These results agree with those proposed by Morales et al. [
48], who compared water and nutrient solution treatments and reported an osmotic effect caused by an increase in salts due to the presence of fertilizers, which can restrict the root water uptake and affect the plant water status. On the same hand, Parra-Terraza et al. [
49] reported that if there is an increase in nutrient concentration in the nutrient solution, the osmotic potential increases in absolute value, decreasing the free energy, and consequently the uptake processes of water and some nutrients are affected.
With respect to O
3 supply, there were no significant differences in relative water content in pepper plants, but when O
3 concentration increased in the nutrient solution, there was also an increase in RWC in pepper plants. After reviewing previous literature, we found no references about the modifications of the water status of one species after the application of ozonated water. Wilkinson and Davies [
50] reported that under a combined O
3 stress caused by atmospheric concentrations of 60–80 ppb and drought conditions, there was an ethylene-dependent reduction in the sensitivity of stomata to abscisic acid (ABA) and repressed stomatal closure, which would mean a loss of water and therefore lower values of RWC. Nevertheless, under well-watered conditions, O
3 often reduces stomatal aperture [
47,
51]. Therefore, considering that our experiment was conducted under well-watered conditions, the results reported in O
0.54 treatment may be due to higher sensitivity to elevated O
3.
Pepper plants did not show significant differences in leaf area under water irrigation or fertigation with a standard nutrient solution with or without the application of O
3. Nevertheless, the increase in O
3 supplies increased leaf area but at O
0.54, leaf area in pepper plants showed a decline. These results were in line with Chan et al. [
45], who reported that the irrigation by ozonated water for one month increased the leaf area of bok choy and Chinese spinach (doses from 0.5 mg L
−1 to 1.5 mg L
−1). In addition, Peykanpour et al. [
46] reported that the increase in leaf area in cucumber plants was associated with the increase in O
3 concentration from 0 to 1 mg L
−1. Nevertheless, Najarian et al. [
44] reported an increase in leaf area in cucumber plants up to 0.5 mg L
−1 O
3 concentration.
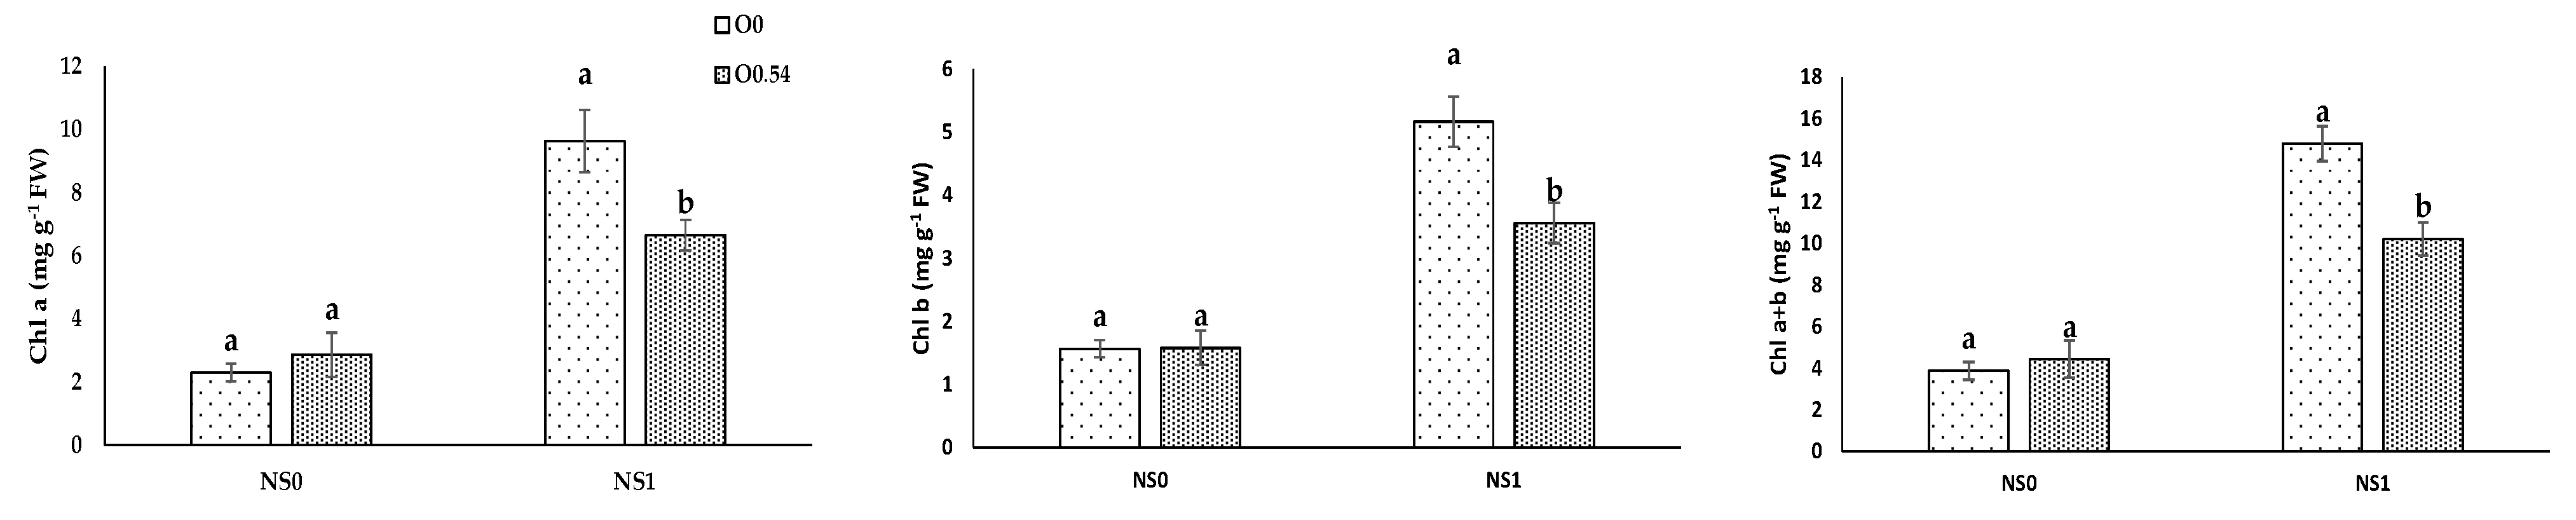
As far as physiological parameters were concerned, in our experiment, the application of O
3 resulted in an increase in Chl b and Chl a+b under O
0.18, in line with the results proposed by Sloan and Engelke [
35], who reported a significant increase in chlorophyll concentration in
Agrostis stolonifera under the application of O
3. Moreover, our results for pigment concentrations in pepper plants under O
0.36 were in line with the results proposed by Chan et al. [
45], who noted not significant differences in chlorophyll concentration under the application of ozonated water (doses from 0.5 mg L
−1 to 1.5 mg L
−1) in vegetable species (choy sum, bok choy, green mustard, and Chinese spinach) in the vegetative stage. Similarly, Martínez-Sánchez and Aguayo [
19] reported that the application of ozonated water affected neither the photosynthesis rate nor the development of grafted watermelon seedlings. In addition, Paniagua [
52] reported no effects in Chl a and Chl a+b associated with the action of this oxidizing compound in
Cordyline fruticosa plants var. “Red Edge” fertigated with different mixtures of H
2O
2. In our experiment, we reported a reduction in Chl a, Chl b, and Chl a+b concentration under O
0.54, which can be related to the possible O
3 transference to the environment associated with a significant decrease in chlorophyll concentration, as has been reported for wheat [
53] and lettuce [
54] under environmental pollution.
The concentration of total soluble sugars in leaves can be considered the balance of bioassimilated generation processes and respiration losses. Sugars in turn are important substrates in the respiration process, which ensure plants have sufficient energy necessary to increase the intensity of some metabolic processes activated under stress factors [
55]. In previous literature, Nicoletto et al. [
56] reported no effect of O
3 supply on leaf total soluble sugars in a forcing closed system process of
Cichorium intybus. Similarly, the application of O
3 in gaseous form to the soil did not result in changes in leaf total soluble sugars in
Fagus sylvatica. These results agree with the data obtained from our experiment, except for the case of O
0.18, which presented a significantly lower leaf total soluble sugars concentration. This fact can be associated with a differential carbon partitioning and also due to the dilution effect since O
0.18 showed the highest TDW [
57].
Proline is a biochemical indicator related to stress tolerance in biotic and abiotic stress [
58]. For instance, the intervention of this osmolyte has been reported in plants grown under a water deficit [
59,
60], saline conditions [
4], changing light conditions [
61], heavy metal concentrations [
62], and with pests and diseases [
63].
Although it has been reported that under nutrient imbalances, including mineral toxicities and deficiencies of nitrogen, phosphorus, or potassium, there is an increase in proline concentration [
64], our experiment showed a decline in proline concentration in pepper plants irrigated only with water.
A significant decrease in leaf proline concentration was evident at higher O
3 concentrations. In the literature, there are no references about the effects of the supply of O
3 in fertigation on leaf proline concentration. Nevertheless, under O
3 tropospheric pollution, El-Khatib [
65] reported an increase in leaf proline concentration in several species such as
Senecio vulgaris, Malva parviflora,
Sonchus oleraceus,
Medicago sativa, and
Melilotus indicus under increasing O
3 concentrations (from 50 ppb to 100 ppb). The decrease in leaf proline concentration in this study may suggest that the application of O
3 in the standard nutrient solution did not result in oxidative stress in pepper plants, which is associated with the increase in different osmolytes such as proline.
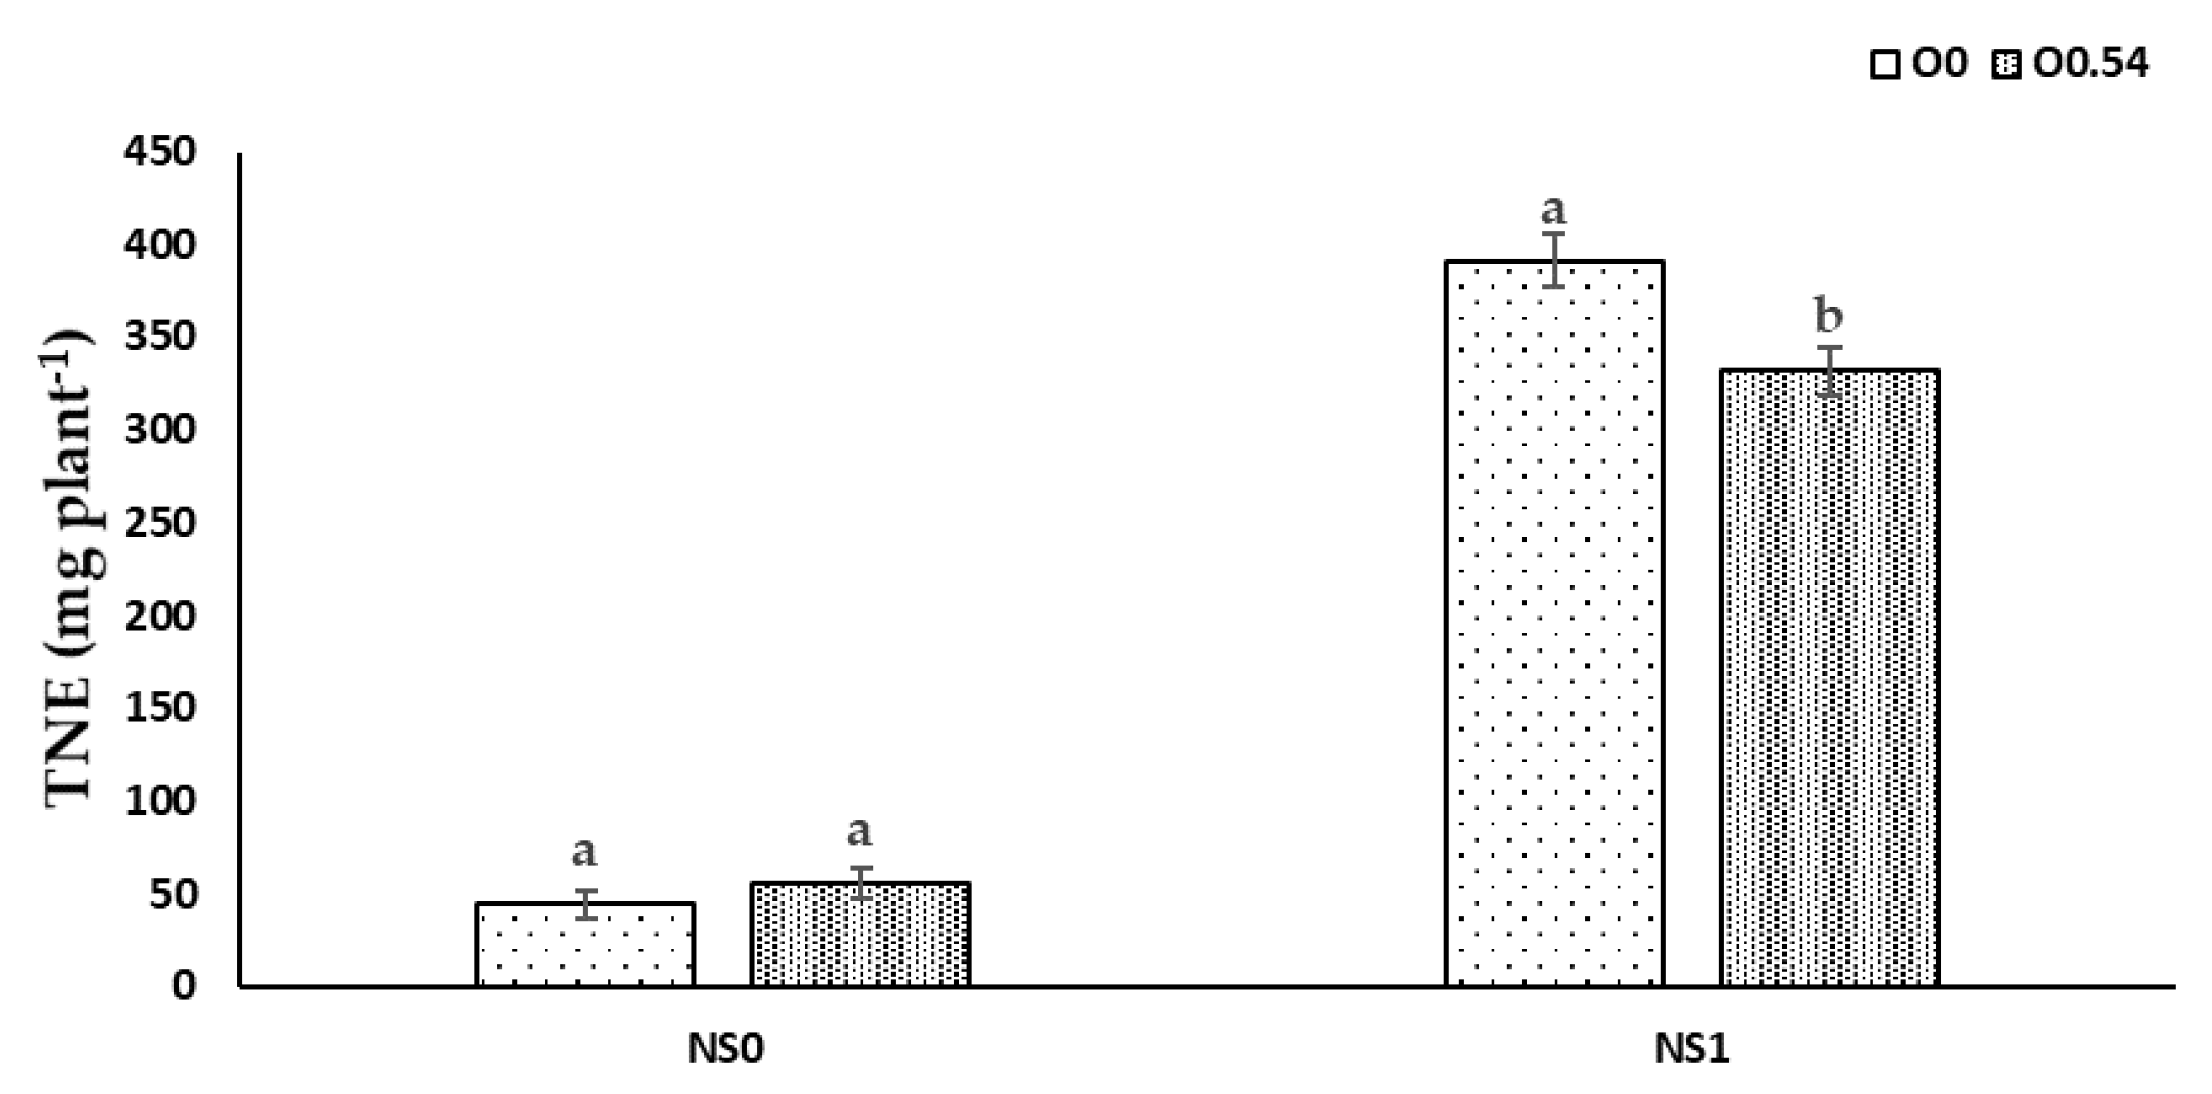
It is well known that N, P, and K are essential for the adequate development of a crop, the latter especially in the stages of flowering and fruit setting. Therefore, these macronutrients are consumed in high amounts and if there is any deficiency of one of them, there is a reduction in crop yield [
66], as happened in our treatment with only water irrigation. The lower N, P, and K extraction in plants grown under water irrigation against fertigation with the standard nutrient solution was in line with the findings of Marschner [
67], mainly based on the availability or not for nutrient uptake. In addition, sterilization with ozonated water could increase the water and mineral uptake by the root system of the plant [
43]. Nevertheless, Martínez-Sánchez and Aguayo [
19] used ozonated fertigation (750 mV) in
Capsicum seedlings and reported no differences in leaf N concentration, but significantly lower concentrations of P and K compared to the control treatment without O
3. The results of our experiment showed lower plant N uptake but a similar leaf nitrogen ratio under increasing O
3 concentrations. Plant total P extraction showed a significant decrease compared to the control treatment, in line with the results reported by Martínez-Sánchez and Aguayo [
19], who noted the same trend. Nevertheless, the increase in plant total K extraction showed an opposite trend compared with the results obtained by Martínez-Sánchez and Aguayo [
19].
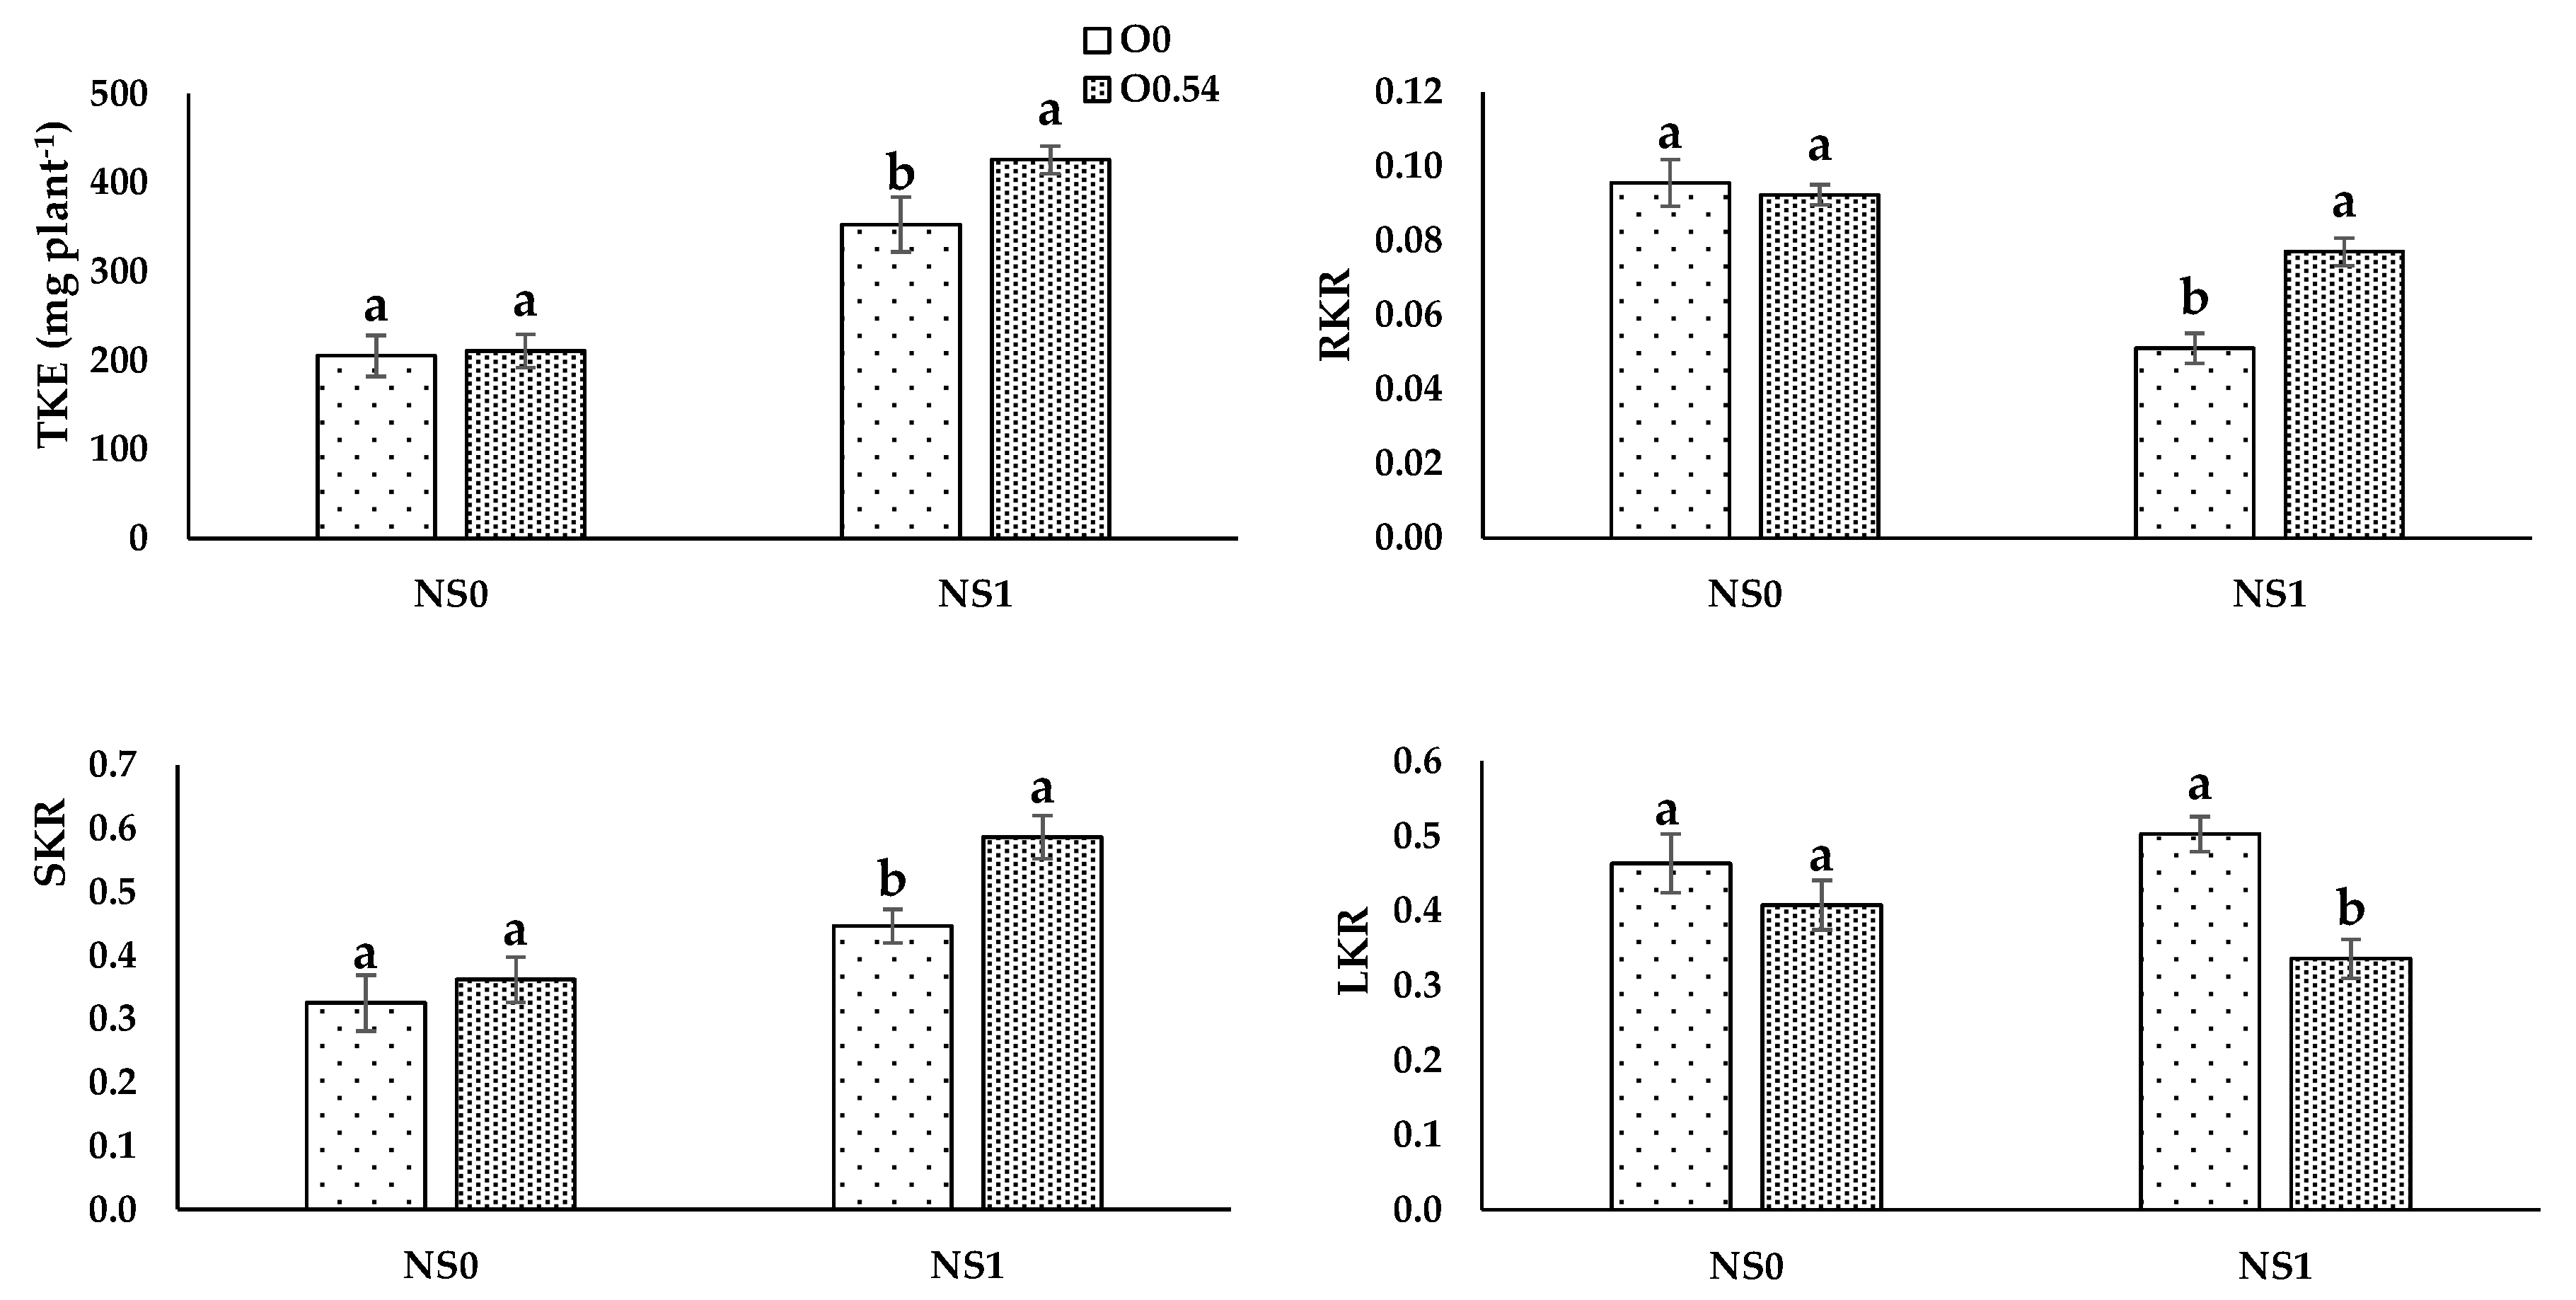
For O
3 concentration, the highest N, P, and K extractions were evident in pepper plants grown under O
0.18 treatment. Potassium extraction increased from O
0 to O
0.36, but at the highest concentration (0.54 mg L
−1) showed a decrease compared to O
0.18, which can be associated with the fact that K is the most sensitive nutrient to the lack of O
2 due to its efflux to the medium [
68].
Nutrient uptake processes are linked to H
+-pumps via cotransport, antiport, and uniport mechanisms, which are related to the O
2 availability in the nutrient solution, as reported by Clarkson and Lüttge [
69]. Therefore, this fact can be the reason for the increase in TNE, TPE, and TKE under O
0.18 treatment compared to O
0 treatment. Nevertheless, at higher O
3 concentrations, an antagonistic effect may occur as a consequence of a reduction in transpiration and an impairment of the active transport of N, P, and K, which can be responsible for disruptions in the nutrient transport from roots to shoots [
70], as occurs when comparing O
0.36 to O
0.54, since we noted an increase in RNR, RPR, and RKR and a decrease in stem and leaf ratios.


