Article

Utilization of Quasi-Zenith Satellite System for Navigation of a Robot Combine Harvester

1
Graduate School of Agriculture, Hokkaido University, Kita-9, Nishi-9, Kita-Ku, Sapporo, Hokkaido 060-8589, Japan
2
Research Faculty Agriculture, Hokkaido University, Kita-9, Nishi-9, Kita-Ku, Sapporo, Hokkaido 060-8589, Japan
3
Department of Biosystems Machinery Engineering, College of Agriculture and Life Science, Chungman National University, 200 Gung-Dong, Yusung-Gu, Daejeon 305-764, Korea
*
Author to whom correspondence should be addressed.
Agronomy 2021, 11(3), 483; https://doi.org/10.3390/agronomy11030483
Submission received: 15 January 2021 / Revised: 24 February 2021 / Accepted: 2 March 2021 / Published: 5 March 2021
(This article belongs to the Special Issue Automation for Digital Farming)

Abstract

:
The purpose of this study is to evaluate the performance of a robot combine harvester by comparing the Centimeter Level Augmentation Service (CLAS) and the Multi-Global Navigation Satellite System (GNSS) Advanced Demonstration tool for Orbit and Clock Analysis (MADOCA) from the Quasi-Zenith Satellite System (QZSS) by using the Real Time Kinematic (RTK) positioning technique as a reference. The first section of this study evaluates the availability and the precision under static conditions by measuring the activation time, the reconnection time, and obtaining a Twice Distance Root Mean Square (2DRMS) of 0.04 m and 0.10 m, a Circular Error Probability (CEP) of 0.03 m and 0.08 m, and a Root Mean Square Error (RMSE) of 0.57 m and 0.54 m for the CLAS and MADOCA, respectively. The second section evaluates the accuracy under dynamic conditions by using a GNSS navigation-based combine harvester running in an experimental field. The results show that the RMSE of the lateral deviation is between 0.04 m and 0.69 m for MADOCA and between 0.03 m and 0.31 m for CLAS; which suggest that the CLAS positioning augmentation system can be utilized for the robot combine harvester if the user considers these accuracy and dynamic characteristics.

1. Introduction

Agriculture in Japan is facing various problems, the most serious being the shortage and aging of the agricultural labor. To solve this problem, the Ministry of Agriculture, Forestry, and Fisheries has started a plan to encourage the development of robots for agricultural use [1]. In Japan, many different types of agricultural robots have been developed. For example, [2] developed the cut-edge and stubble detection for auto-steering of a combine harvester by using a monochrome charge-couple device (CCD) camera. Results show a good precision for the stubble detection with an angular error of 7.6 degrees and an offset of 0.11 m. Another research [3] developed an uncut crop detection system based on a laser rangefinder for a combine harvester. Results show a good precision with a lateral error of 0.25 m and a root mean square error (RMSE) of 0.10 m while detecting the crop under dynamic conditions. Another application [1] developed a robot combine harvester using real time kinematic (RTK)-GPS and an inertial measurement unit (IMU) for the automatic navigation. Results show a high precision with a lateral error of 0.03 m. However, some of the drawbacks of the RTK-GPS are its high cost and the fact that it cannot work properly if there are a lot of trees and building close to the farm. Therefore, it is important to explore alternative options that can have practical applications for farmers in Japan.
One important aspect of the agricultural robot’s development is precision [1]. Precision farming, especially harvesting, requires a high-performance Global Navigation Satellite System (GNSS) receiver with a positioning augmentation system. The performance of GNSSs are related to the number of visible satellites, the oscillation of satellite orbits, the satellite clock accuracy, and ionospheric activities [4]. The positioning accuracy could be increased in real time by using the GNSS receiver near a reference or within a reference station’s network, which can broadcast the augmentation signal to the receiver. Several researches [5] have addressed the importance of the performance of GNSSs. For example, [6,7] studied the RTK GNSS technique, the multiple reference stations (MRS), and the virtual reference station (VRS) to increase the positioning accuracy in real time. However, these solutions require a high density of reference stations; therefore, the user of the GNSS receiver needs to be close to a reference station or within the area of a reference station’s network. Other related works [8,9] have studied a technique called the precise point positioning (PPP) which uses the precise orbit and clock of the GNSS for accurate calculation of the user’s position. Therefore, this technique does not require a high density of reference stations; but one of the drawbacks of this technique is the limitation of the convergence time and an ambiguous resolution. A similar approach [10] studied a PPP-RTK technique which improves the performance of PPP in terms of the accuracy and the convergence time. Although several researches have addressed the importance of the performance and accessibility of GNSSs, there is too few information reporting the performance of GNSSs, particularly applied to an agricultural robot.
The performance evaluation of different GNSSs based on factors like the oscillation of satellite orbits and the satellite clock accuracy might be complex and require specialized tools, but it is possible to evaluate their practical application for the positioning of an agricultural robot, such as robot combine harvesters which require both high accuracy and accessibility for the harvesting work.
Therefore, the purpose of this study is to evaluate the performance of a robot combine harvester using two recently released positioning augmentation systems: the Centimeter Level Augmentation Service (CLAS) and the Multi-GNSS Advanced Demonstration tool for Orbit and Clock Analysis (MADOCA), both from the Quasi-Zenith Satellite System (QZSS). The QZSS is a Japanese satellite positioning system composed mainly of satellites in quasi-zenith orbits (QZO). Both CLAS and MADOCA use satellite signals from QZSS to obtain position information. Unlike the American Global Positioning System (GPS) whose orbit covers around the earth, the QZO coverage area around Japan and Oceania focuses on its usage in Japan. Therefore, the QZSS is sometimes called the “Japanese-GPS”
The evaluation in this research was divided in two sections; evaluation under static conditions and performance evaluation of a robot combine harvester.

2. Materials and Methods

2.1. Research Platform

The platform used in this study was a combine harvester (AG1100, Yanmar Co., Ltd., Osaka, Japan) equipped with navigation sensors as shown in Figure 1. The combine harvester is equipped with a real-time kinematic global navigation satellite system (RTK-GNSS) receiver (SPS855, Trimble, Sunnyvale, CA, USA) to obtain the reference measurements. An IMU (VN100, VectorNav, Dallas, USA) provides the attitude measurement of the robot combine harvester. The CLAS and MADOCA positioning augmentations are provided by a QZS receiver (MJ-3008-GM4-QZS, Magellan Systems, Amagasaki, Hyogo, Japan). A GPS splitter (ALDCBS1 × 2, GPS NETWORKING, Pueblo, CO, USA) was used to divide the GNSS signal during the dynamic experiments. Specifications of the combine harvester are shown in Table 1. During harvesting, it usually works in the medium gear with at a speed of 2.0 m/s. It has and engine output of 80.9 kW. This is the largest combine harvester produced in Japan, because the size of the fields is no longer than 100 m by 30 m in the main island of Japan.
The combine harvester is controlled by a PC sending commands via a CAN (Controller Area Network) bus. A PC is connected to the CAN bus via a communication card, and there is an Electronic Control Unit (ECU) inside the combine harvester that conducts the communication work and can shield the combine harvester from incorrect CAN messages. Furthermore, the RTK-GNSS receiver, the QZS receiver and the IMU are connected to the PC through the serial port using the RS-232 protocol. Moreover, the combine harvester can work in both “manual mode” and “automatic mode”. In automatic mode, it can only be controlled by a computer. The safety of the system is also improved, since when there is no command sent every 200 ms, the combine harvester will automatically stop [1].
The combine harvester used in this research uses the fulltime drive system (FDS). In 1998, Yanmar Co., Ltd., Japan established the FDS with steering wheel by combining the forced differential transmission with the conical steering link [11]. By using the FDS with steering wheel, the combine harvester has an advantage in its movement for straight forward-backward movements. During these movements, each crawler of the combine harvester runs at the same speed. Additionally, the FDS is utilized for turning in 3 different ways as shown in Figure 2. During a gentle turning, the speed of the outside crawler remains the same but the speed of the inside crawler decreases as shown in Figure 2a. During a normal turn; similar to a gentle turn, the outside crawler speed remains but the inner crawler stops in order to decrease the turning radius as shown in Figure 2b. For a sharp turn, the steering angle reaches its maximum value, then the inner crawler runs in the opposite direction of the outside crawler as shown in Figure 2c [1].

2.2. Positioning Augmentation Systems

The RTK positioning technique can be used to enhance the precision of the position data from the GNSS to a centimeter-level in real-time. Nowadays, the RTK correction signal can be obtained using a virtual reference station (VRS) via an internet service provider (ISP). The VRS idea is imitative of the multiple reference station (MRS) because it uses the surrounding area of interest’s MRS network, but it does not require an actual physical reference station close to the user. The VRS can achieve single-point coordinate accuracies of 2 cm with reference stations separated by 50–70 km under ideal conditions [5].
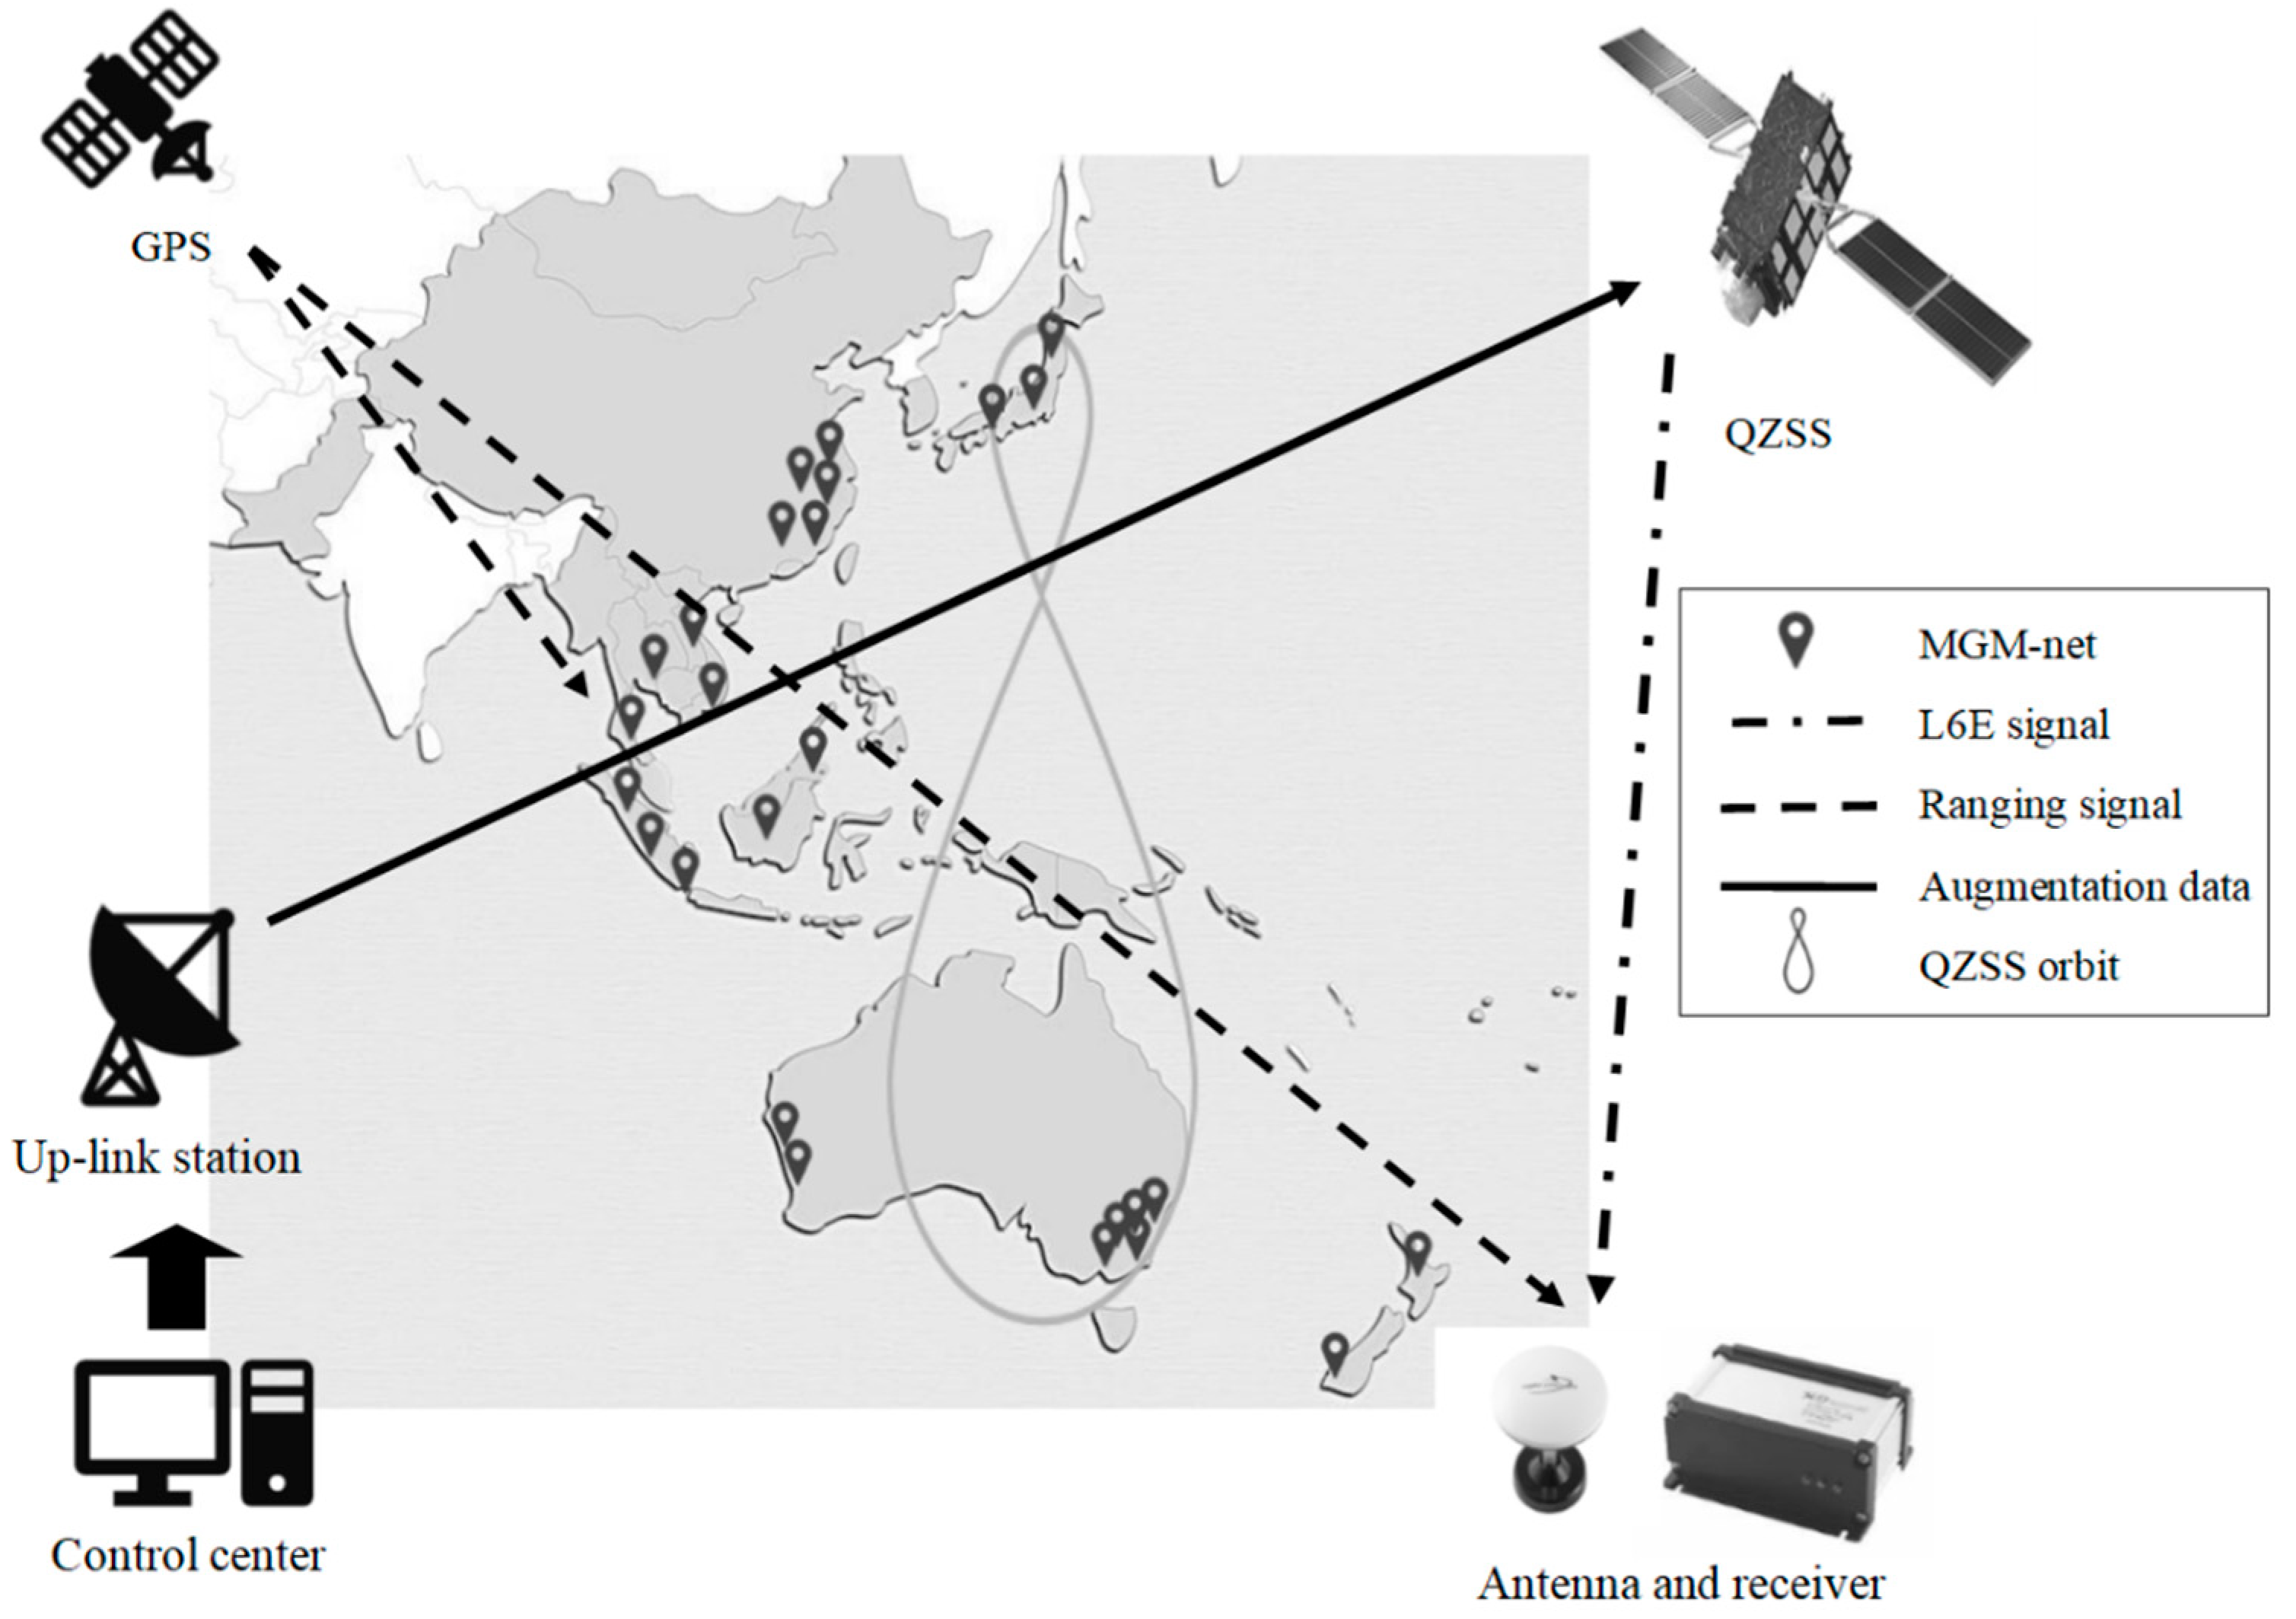
The QZSS is a satellite navigation system developed by Japan. Users around Japan and Oceania, even in urban canyons and mountainous terrain can receive the positioning, navigation, and timing (PNT) broadcast messages. Further, it is possible to receive augmentation signals by an inclined, elliptical geosynchronous orbit of the Quasi Zenith Navigation Satellites (QZSs); which is the space segment of the QZSS. The shape of QZO coverage area around Japan and Oceania is shown in Figure 3. Another segment of the QZSS is a ground segment consisting of a master control station (MCS), a monitoring station (MS), tracking control stations (TCS), and the system of other national research institutes placed around Japan and overseas to estimate and predict the QZS orbit and clock more precisely. The QZS transmits four GPS interoperable signals and three GPS augmentation signals. The GPS interoperable signals are L1C and L1C/A on L1-band (1575.42 MHz), L2C on the L2-band (1227.60 MHz), and L5 on the L5-band (1176.45 MHz). The GPS augmentation signals are L1-Sub-meter class Augmentation with Integrity Function (SAIF) on the L1-band, L6D, and L6E on the L6-band [12]. The L6D and L6E signals from the QZS are used for the precise point positioning (PPP) service by the CLAS and MADOCA positioning augmentation systems, respectively [13]. Compared to the RTK, both CLAS and MADOCA do not need neither an ISP nor an NTRIP service provider to obtain the correction signal from the reference station.
The MADOCA augmentation system was developed by the Japan Aerospace Exploration Agency (JAXA). The measurement principle of MADOCA is shown in Figure 3. MADOCA is based on JAXA’s technology for estimating the satellite orbit and clock correction. This technology supports all usable GNSS constellations; GPS, GLONASS, and Galileo, by receiving the L6E signal represented by the dash-dotted line in Figure 3. This signal broadcasts the correction of the positioning error including satellite orbit corrections and satellite clock from the QZSS. Unlike the CLAS, the MADOCA cannot correct the ionosphere and troposphere delays because the global monitoring station of the MADOCA (MGM-net) represented by the pinpoints in Figure 3 is not dense compared to the CORS of the CLAS represented by the flags in Figure 4. However, these delays could be estimated by the receiver [14]. The MADOCA requires a long time to recover to a convergent PPP positioning method [13]. Similar to the CLAS, to make a comparison or to use the positioning results of VRS-RTK and PPP-RTK together requires the coordinate transformations for compensation because the MADOCA also neglects the earth’s crustal movement.
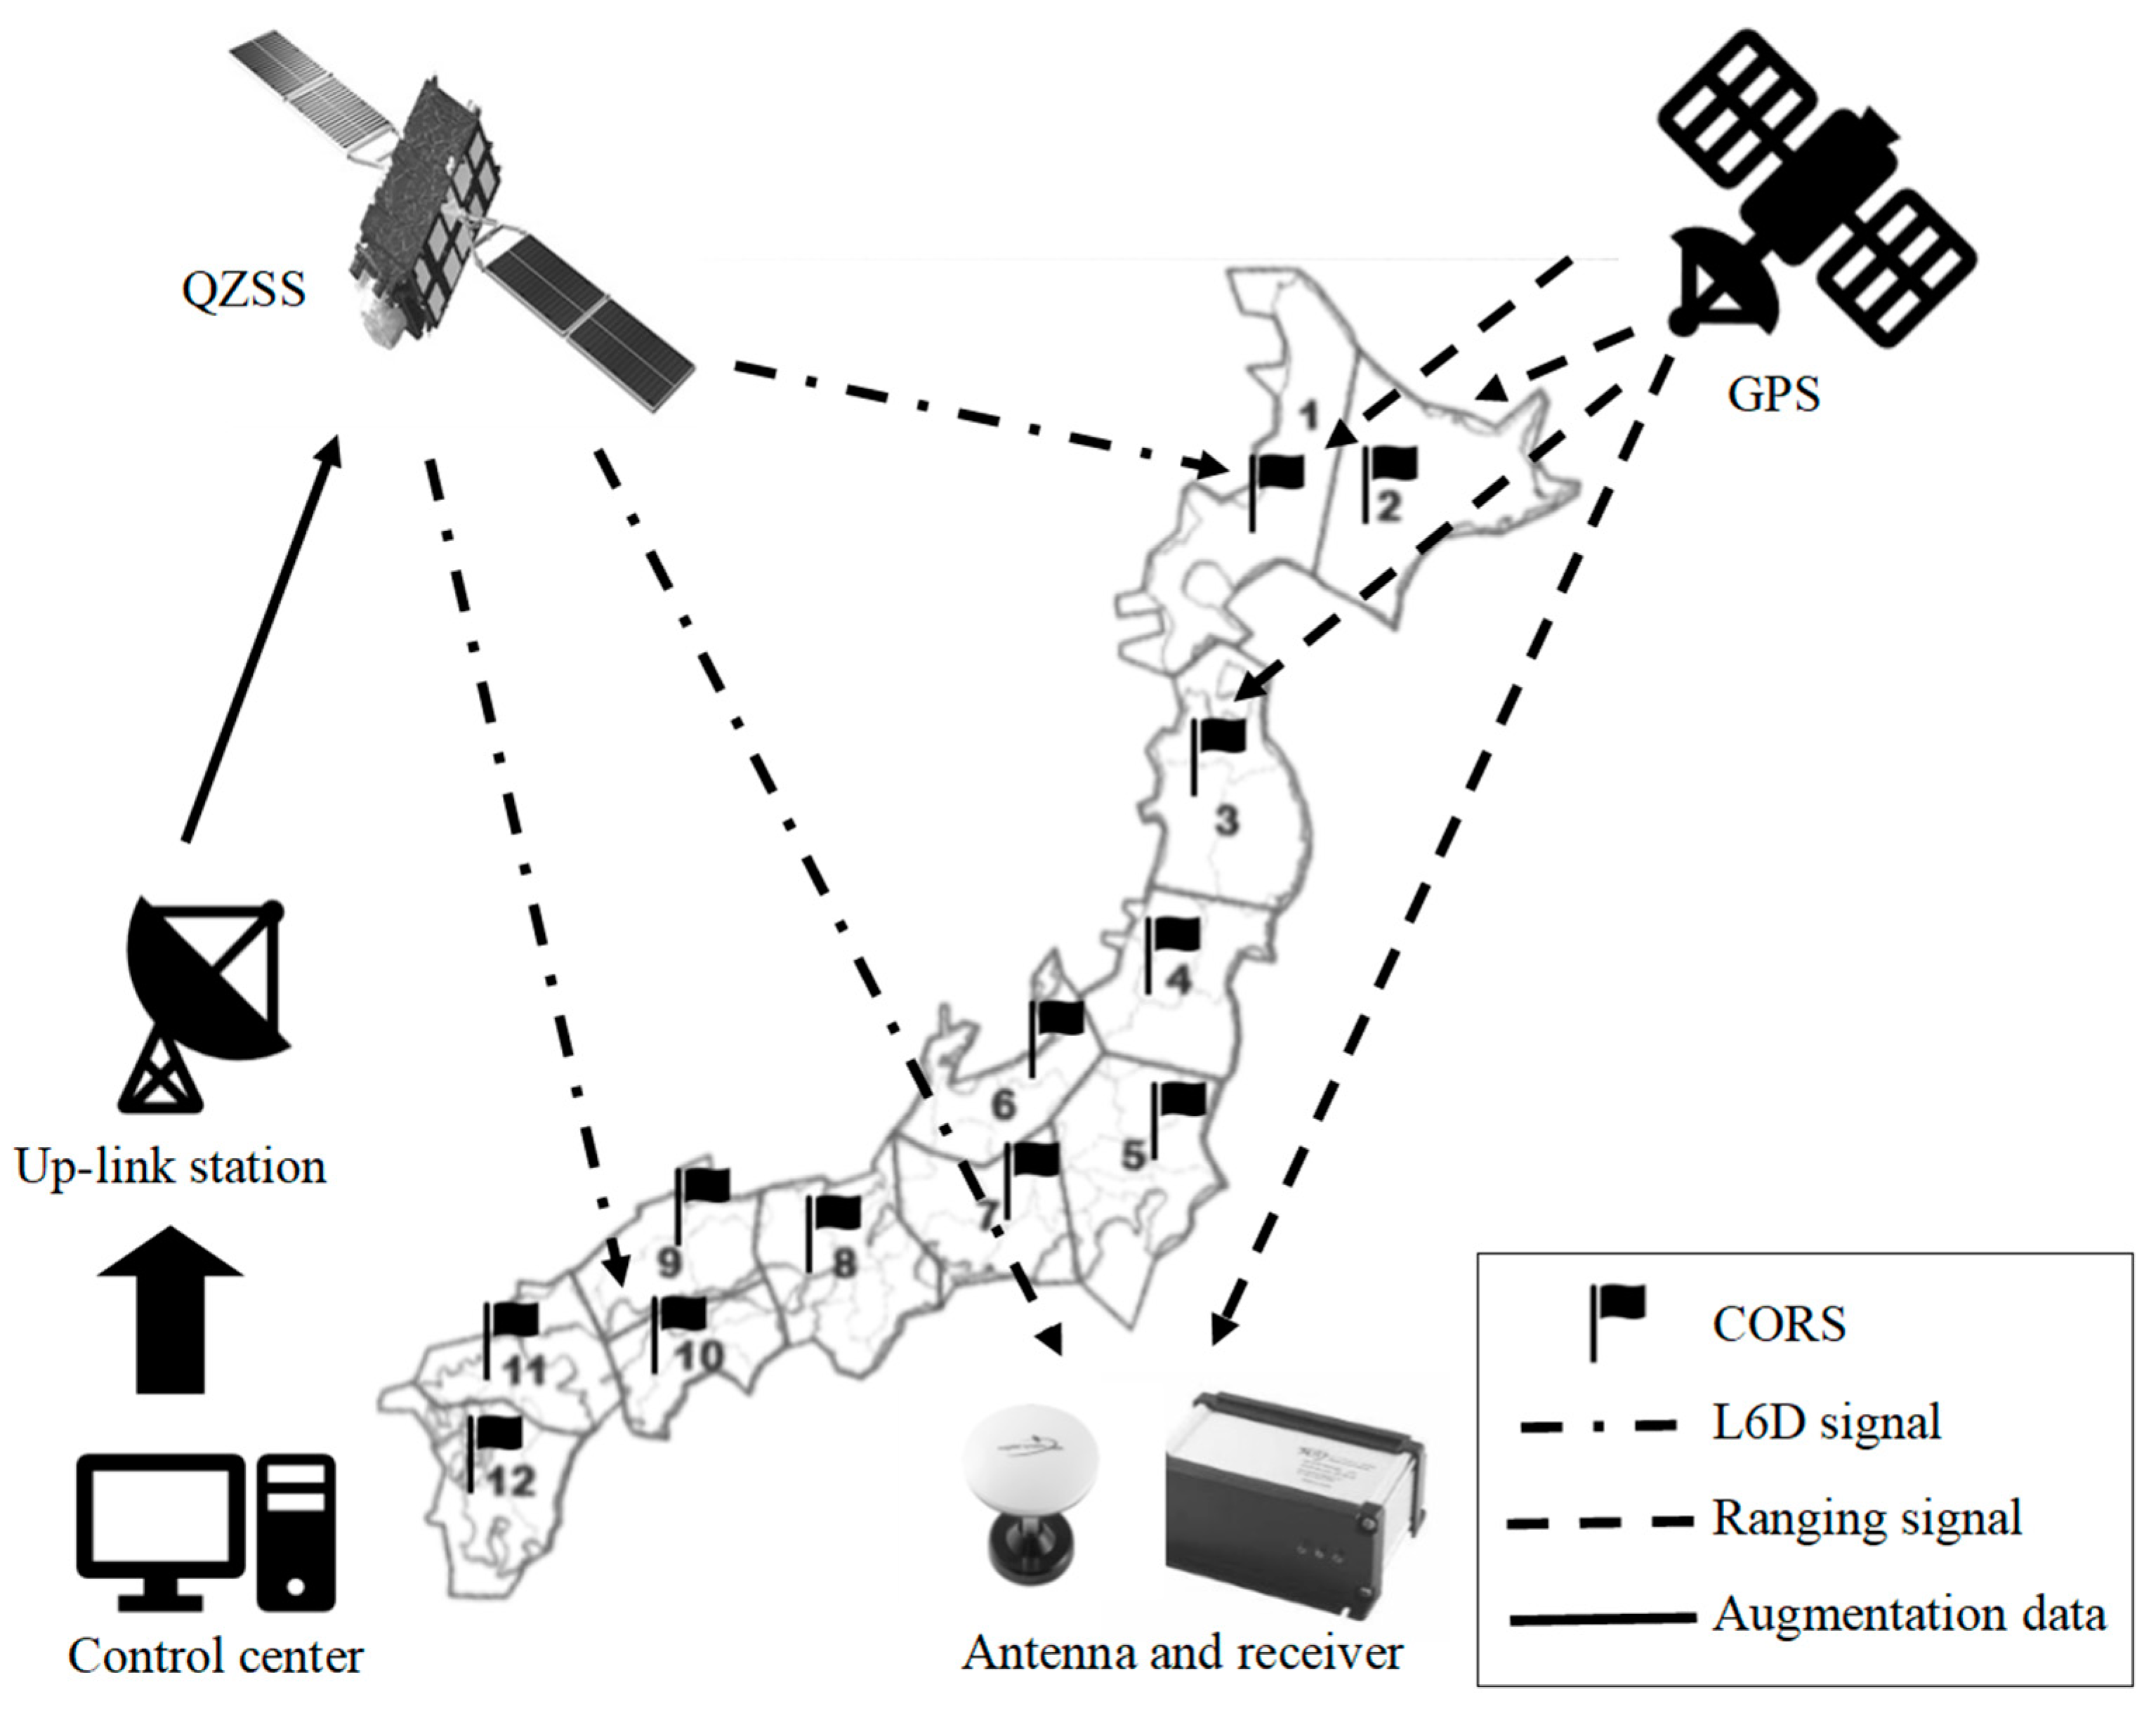
The CLAS was developed from its prototype, the Centimeter-class Augmentation System (CMAS), which does not have a complementary function for GPS. Figure 4 shows the diagram of the CLAS system. The QZS broadcasts the augmentation information via the L-band Experiment (LEX) signal [15]. The LEX signal was renamed L6 in the latest QZSS revision; it is represented by the dash-dotted line in Figure 4. The CMAS uses the State Space Modeling and the wide-area dynamic error model form the GPS and the QZS data monitored by the GEONET to estimate distance-dependent GNSS errors [16]. Via the LEX signal, the correction information in the state space representation (SSR) form which can be applied to precise point positioning (PPP-RTK) was also generated by the CMAS [15,17]. The correction of the positioning error includes satellite orbit corrections, satellite clock corrections, satellite phase biases, and ionosphere and troposphere delays. However, the CMAS generates the correction of the ionosphere and troposphere delays for an area of the QZSS’s coverage similar to the VRS-RTK system. Therefore, there is a limitation for using the CMAS all over the country simultaneously [4]. According to the CMAS success, the CLAS divides the service arena of GEONET into twelve parts covering the territory of Japan and nearby ocean areas with an addition of artificial grid points covering each area with an interval of 60 km. Those twelve parts of GEONET are also called the continuously operation reference stations (CORS), represented by the flags in Figure 4. The artificial grid points are used for the ionospheric and tropospheric delay correction. The user corrects its own observations and gives centimeter-accuracy solutions within 1 min using the PPP-RTK positioning method [18]. The CLAS receiver obtains the L6D signal which contains the satellite orbit and the satellite clock corrections, ionospheric and troposphere delays from the QZS to the user. Please note that the LEX band was changed to L6-band which has 2 channels; L6D for the CLAS and L6E for the MADOCA. To make a comparison or to use the positioning results of VRS-RTK and PPP-RTK together requires the coordinate transformations for compensation because the CLAS neglects the crustal movement of the earth [4].

2.3. Static Experiment

In this study, the Trimble SPS855 receiver used the RTK positioning technique. Both the CLAS and MADOCA positioning augmentation systems were provided with the Magellan MJ-30008-GM4-QZS receiver. Each receiver was connected to the PC through serial port in order to log the positioning data obtained from the NMEA messages. The position data of each one of the GNSS receivers were logged at the same exact location and were stored in the PC at a rate of 10 Hz. A simple activation test was performed on each of the receivers at the experimental location before the experiments under static conditions. The test consisted of powering on each receiver and recording the convergency time; this means, the time each receiver takes to achieve its RTK fixed status. Please note that the Magellan MJ-3008-GM4-QZS receiver can only achieve RTK float status when using the MADOCA positioning augmentation system. An additional reactivation time test was also performed. This test consisted of disconnecting the receiver antenna, waiting for the positioning signal to drop and then reconnecting the antenna. The time it took each receiver to achieve its enhanced positioning status after this antenna disconnection and reconnection was also recorded. This test is relevant because sometimes in field conditions the GNSS signal might drop due to external factors, so it is necessary to know an estimation of how much time does the receiver needs to recover from a sudden signal loss. The time of the activation tests and the reconnection tests was recorded using the timestamp from the PC and it was estimated from the average of ten different measurements. The standard deviation, and the minimum and maximum values were calculated and helped to verify that measuring more times would not evidence any different behavior. Please note that the receiver using the CLAS positioning augmentation system cannot achieve RTK fixed status automatically after disconnecting the antenna or after powering on the receiver, it needs to be set up manually again. Therefore, the reactivation time is omitted because it would be the same as the activation time.
The experiments under static conditions were conducted at the experimental farm of Hokkaido University, Hokkaido, Japan, between June of 2019 and January of 2020. The experimental location was an open sky environment, meaning there were no sight-blocking buildings or trees. Each one of the receivers was tested individually using their own antenna, these receiver antennas were mounted on a tripod stand at a height of 1.2 m above the ground surface. One post hole of the experimental location was selected as a ground landmark. For each experiment, a brass plumb bob was used to set the tripod in the exact same central position of the landmark. This simple procedure guarantees that the two different receivers are measuring the very same spot. The experiment took six hours, starting at 10:00 and finishing at 16:00 (UTC+9 Time).
There are different methods for determining the accuracy the accuracy of a GNSS under static conditions [19]. The most used are the twice distance root mean square (2DRMS) and the circular error probability (CEP). The 2DRMS accuracy indicates that the measured position will be within the stated distance from the true position 95% of the time. It is given by Equation (1):
2 D R M S = ( σ E 2 + σ N 2 )
where σ E is the Standard deviation of the easting values and σ E is the standard deviation of the northing values. The C E P is the radius of a circle containing 50% of the horizontal position measurements reported by the GNSS receiver. It is given by Equation (2):
C E P = 0.59 ( σ E + σ N )
However, the 2 D R M S and the C E P are good accuracy estimators under some conditions; namely if the measured position points have a normal distribution towards a central point [20]. Therefore, to incorporate accuracy into the 2 D R M S and C E P concept, it is necessary to include an additional accuracy estimator. To achieve this, the root mean square error (RMSE) was used to describe the accuracy by measuring the errors between the GNSS data and the actual position [21]. The actual position was chosen as the mean position recorded by the Trimble SPS855 GNSS modular receiver, which, as stated before, performs using the RTK positioning augmentation. The R M S E is given by Equation (3):
R M S E = 1 n i = 1 n ( E i E ¯ ) 2
where E i is the location of the ith measurement along the easting and northing directions, E ¯ is the Mean of the measurements and n is the total number of measurements.

2.4. Performance Evaluation of Robot Combine Harvester

In order to verify the performance of a robot combine harvester utilizing the CLAS and MADOCA for navigation, tests were conducted at the experimental farm of Hokkaido University by using the robot combine harvester equipped with the Magellan MJ-3008-GM4-QZS receiver. The robot combine harvester ran in automatic mode following four paths of the predesigned navigation map. This navigation map consisted of a set position points in latitude and longitude coordinates. The robot combine harvester traveled in the experimental farm by using the CLAS and MADOCA for navigation in each run. This experiment was performed to verify the possibility of utilization of both positioning augmentation systems for a robot combine harvester navigation.
The next experiment was performed by using the robot combine harvester equipped with both GNSS receivers. For this experiment, both receivers were tested together using one antenna connected via a splitter. The robot combine harvester traveled in the experimental farm one straight path with a constant velocity of 0.8 m/s by using the RTK positioning augmentation system for navigation in automatic mode, while the outputs of both receivers were logged in a PC at the rate of 10 Hz. The RMSE of the lateral deviation respect to the predesigned navigation map points was evaluated for the three different positioning augmentation systems. A predicted position based on the begin and end points of the predesigned navigation map was used to estimate the RMSE; this means that the straight path contained in the navigation map works as the target position, and the position points logged by each different positioning augmentation system will have some lateral deviation from this target position. The RMSE of this lateral deviation is calculated using Equation (3).
The next test is used to evaluate the performance of the CLAS and MADOCA augmentation systems for the robot combine harvester during the harvesting path. Similar to the procedure followed during the static conditions, the performance evaluation of a robot combine harvester experiment took 6 h by activation the CLAS and MADOCA from 10:00 to 16:00 (UTC+9 Time) on different dates to evaluate the time dependency of each system. Then, the robot combine harvester ran in automatic mode using the CLAS and MADOCA as inputs of the navigation controller at different days. The robot combine harvester ran along the same two paths of the predesigned navigation map with two-hours intervals of time between each experimental run. The first run was performed immediately after the CLAS and MADOCA were activated. The predesigned navigation map was created by using the RTK positioning augmentation system. The output from the RTK was also logged during the running for evaluation of the CLAS and MADOCA.

3. Results

3.1. Static Experiment

Table 2 shows the results of the ten measurements of the activation time and the reactivation time as well as the different test dates for each one of the receivers. The minimum and maximum time values are also included in the Table 2, as well as the standard deviation. It can be observed that for each one of the receivers the ten different time measurements were almost the same, the minimum and maximum values show a difference of around one second. A low standard deviation close to 0.5 indicates that the values tend to be close to the mean (also called the expected value) of the set. Therefore, it is safe to consider the average time for comparison purposes.
Concerning the activation time, the RTK positioning augmentation system achieved RTK fixed status on average in 14.2 s.
The MADOCA positioning augmentation system can achieve RTK float status in 30 s on average. From the activation point of view, this is also a short time considering that by using the MADOCA mode this receiver does not require an NTRIP service provider. In contrast, the CLAS positioning augmentation system performs a little slower; it can achieve RTK fixed status in 128 s on average.
Concerning the reactivation time in Table 2, the RTK and MADOCA show similar times compared to the activation time. The CLAS cannot achieve RTK fixed status automatically after disconnecting the antenna, it needs to be set up manually again. Therefore, the reactivation time is omitted because it would be the same as the activation time.
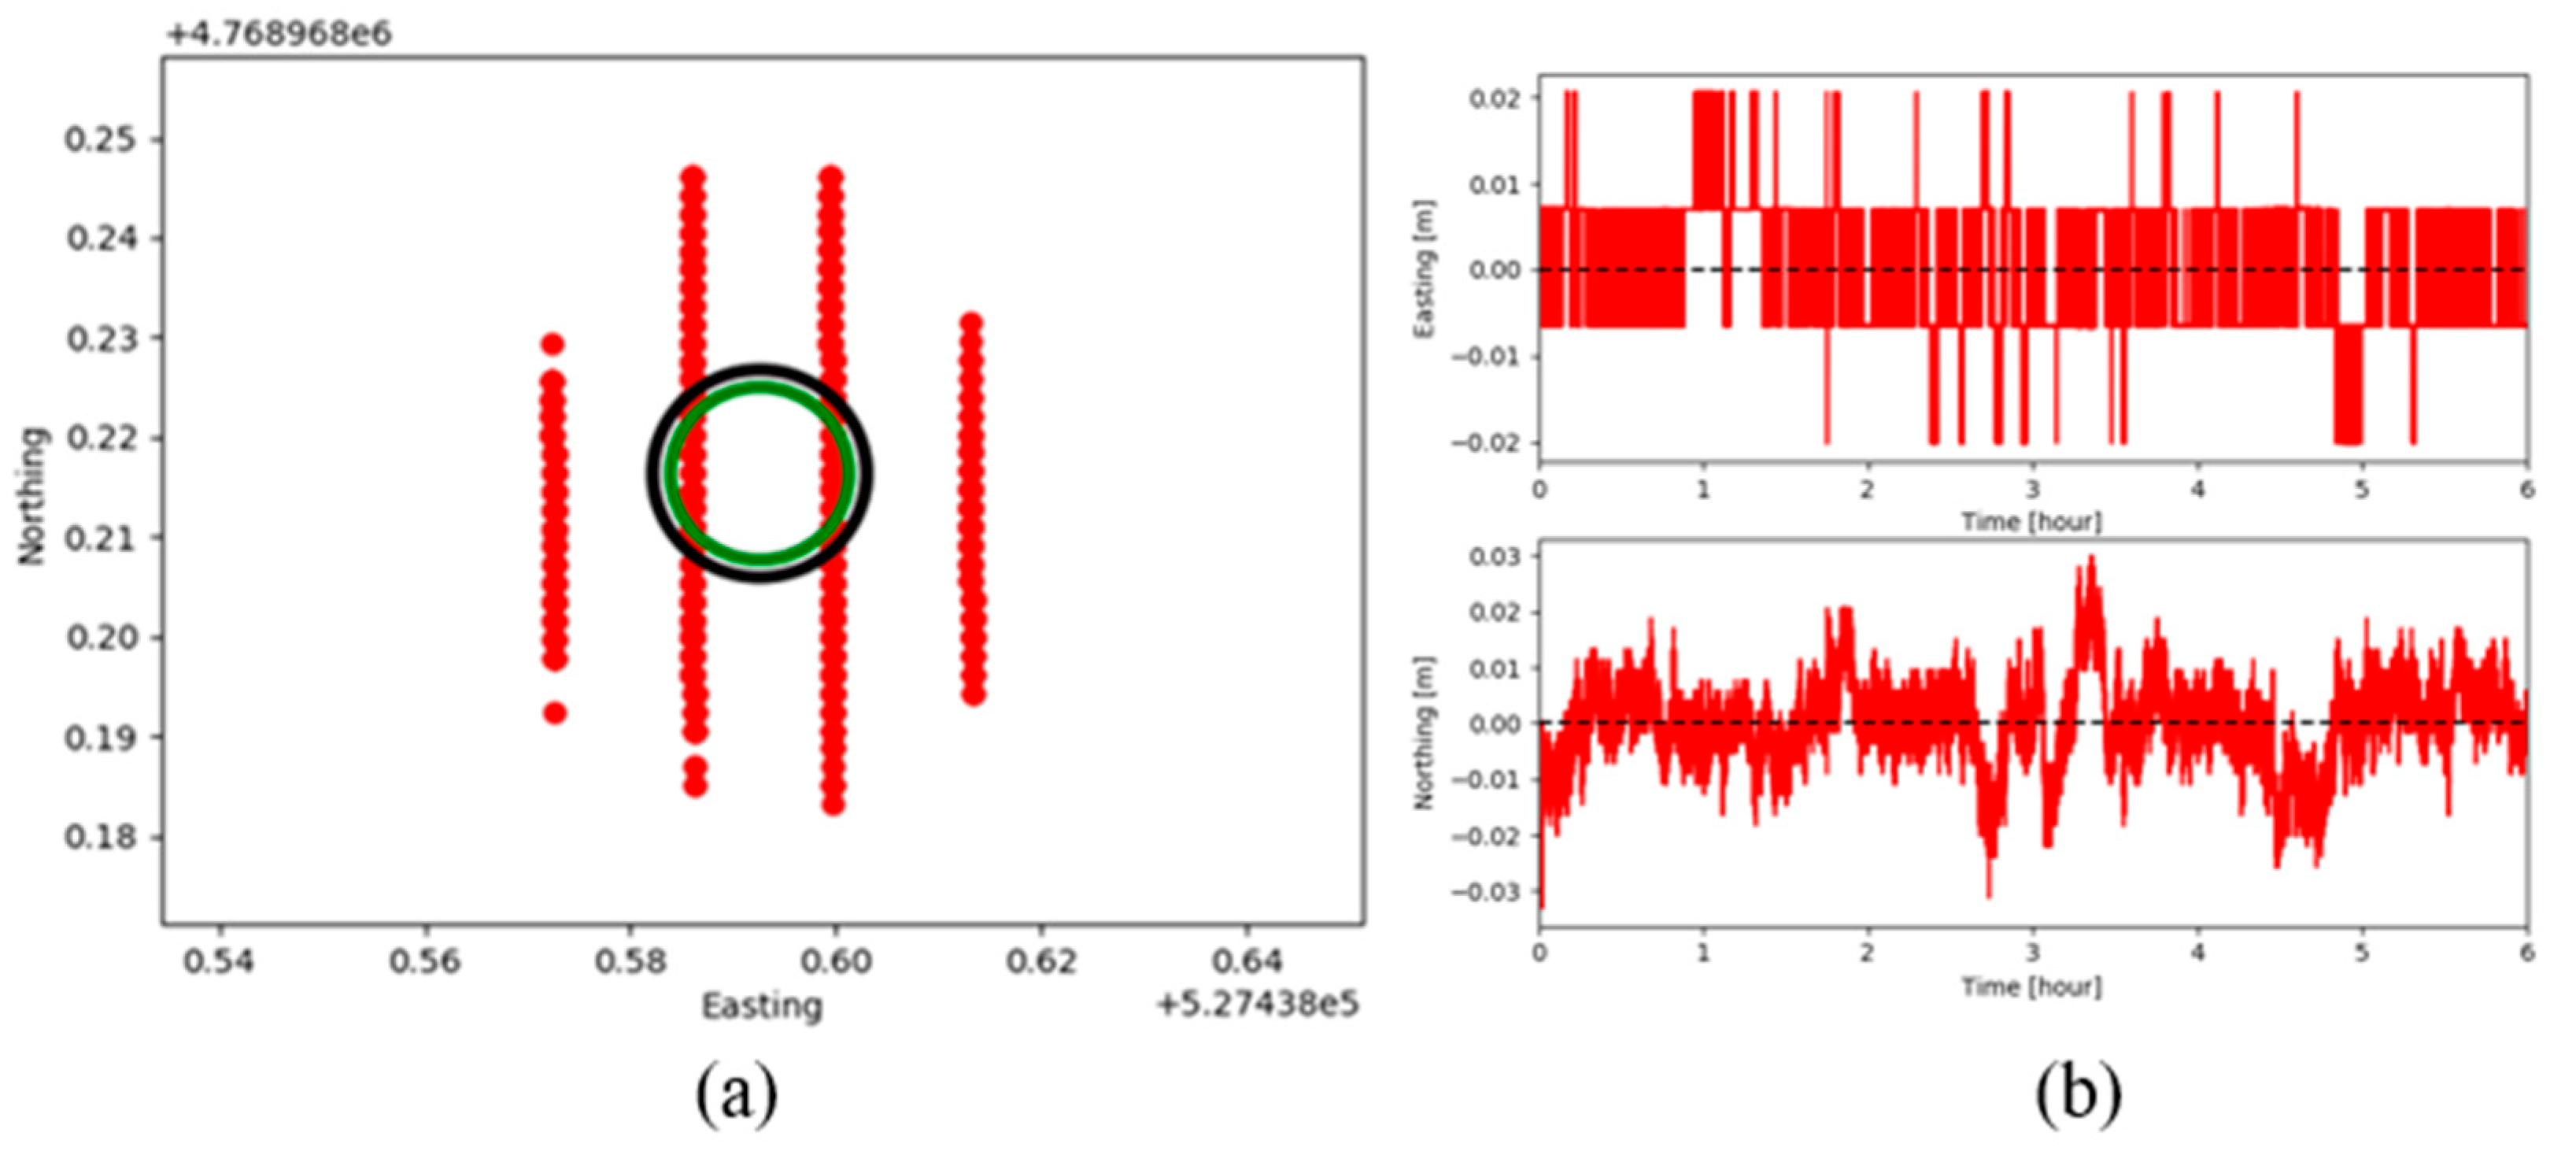
Please remember that the RTK positioning system is used as the reference for comparison. However, even the RTK positioning system might show small variations in position over time [21]. Therefore, it is necessary to analyze the RTK variations to clarify whether variations during the comparison are caused by variations in the RTK reference or due to variations in the MADOCA or CLAS. Figure 5 shows the result from the static position experiment of the RTK positioning augmentation system. The plots are shown in UTM coordinates instead of latitude and longitude coordinates because it is easier to visualize the distance in meters than in degrees. Figure 5a shows that the position points logged by the RTK are scattered over a small area about 0.05 m by 0.06 m. Figure 5b confirms the shows that the RTK position data has small variations over time. Moreover, since the time series plots display an overall stability, it is possible to use the RTK mean position as an origin point for reference for comparison with either MADOCA or CLAS. In other words, the purpose of the mean position is to neglect small variations in position over time. The 2DRMS calculated using Equation (1), and the CEP calculated using Equation (2) can be plotted as shown in Figure 5 and Figure 6; the 2DRMS is measured withing the circle in black while the CEP is the radius of the circle in green.
Figure 6 provides an overview of the static positioning experiment. The plots are shown in UTM coordinates. The origin point (0,0) of both plots in Figure 6 is the mean point of the position data logged by the RTK. The purpose of using only the mean position data logged by the RTK is to neglect small variations in position over time. The red points represent the position points measured by the CLAS and MADOCA. The blue points represent the mean of the position points.
The CLAS position points are scattered over an area about 0.25 m by 0.50 m and they are uniformly grouped inside this area shown in Figure 6a. The sudden oscillations or instabilities are not too big as shown by the mean position which is centered in the cloud of position points. From Figure 6b, the MADOCA position points are scattered over an area of about 0.70 m by 0.70 m and display a loop inside this area, which accounts for the instability of this positioning augmentation system. However, the mean position is inside the area where the position points are dense, although it is not as good as the CLAS mean position.
The 2DRMS and the CEP circles in Figure 6 are smaller for the CLAS in comparison with the MADOCA, which is an expected result caused by the size of the area of the position points measured.
Table 3 list the 2DRMS, the CEP and the average number of satellites Tracked during the test for each one of the receivers. It can be observed that the CLAS positioning augmentation system has a reasonably small 2DRMS and CEP; although they are around four times bigger than the RTK results, they are still less than 0.05 m. In the other hand, the MADOCA positioning augmentation system displays 2DRMS and CEP about 10 times bigger than the RTK.
Although Figure 6 provides an overview of the static positioning experiment, it is not possible to see how the measurements behave over time. The data summarized in Table 3 gives a good accuracy analysis for the total length of the static positioning experiments but provides no information for a specific time. Therefore, Figure 7 shows the position data logged by the CLAS and MADOCA from the static positioning experiments plotted against time in easting and northing coordinates. For the CLAS, there is a small oscillation of around 0.20 m in the northing coordinate during the first hour, the position data becomes stable since the second hour until the end of the experiment. However, the position data in the easting coordinate converges to an approximately constant value within a 0.10 m range and it is stable from the beginning to the end of the experiment. In contrast, the MADOCA has a big oscillation of almost 0.70 m in both the easting and northing coordinates during the first hour. The bias with respect to the reference measured by the RTK is around 0.40 m and it is not as constant as the CLAS bias during the six hours of the static positioning experiment. However, the oscillation gets smaller in the second hour, then the position data become stable since the third hour and it starts to converge to a range of 0.20 m for both the easting and northing coordinates.

3.2. Performance Evaluation of Robot Combine Harvester

By utilizing the CLAS and MADOCA for navigation of the robot combine harvester, it was verified that the robot combine could perform automatic operation along four paths of the predesigned navigation map, as shown in Figure 8. In Figure 8, the predesigned navigation map is represented by the dashed line. The solid dark line in Figure 8a represents the CLAS traveled path, and in Figure 8b the solid dark line represents the MADOCA traveled path. Each run took about 20 min. However, it might be difficult to specify the accuracy of each positioning augmentation system for the robot combine harvester navigation. Therefore, further performance evaluation of the experiment is necessary; as described below.
Table 4 summarizes the results from the performance evaluation of a robot combine harvester experiments. The lateral deviation was calculated by the comparison between the predesigned navigation map and the logged position data from the RTK, the CLAS and the MADOCA. Please remember that the straight path contained in the navigation map serves as the target position, and the position points logged by each different positioning augmentation system will have some lateral deviation from this target position. The RMSE of this lateral deviation is calculated using Equation (3). In this experiment, four runs were performed at two-hour intervals. Each experimental run took about 10 min. The comparison between the RMSE of lateral deviation from the four runs shows that the RTK and the CLAS are stable, it is possible to state that for the dynamic experiment CLAS might be as good as RTK because it displays a RMSE less than 0.06 m.
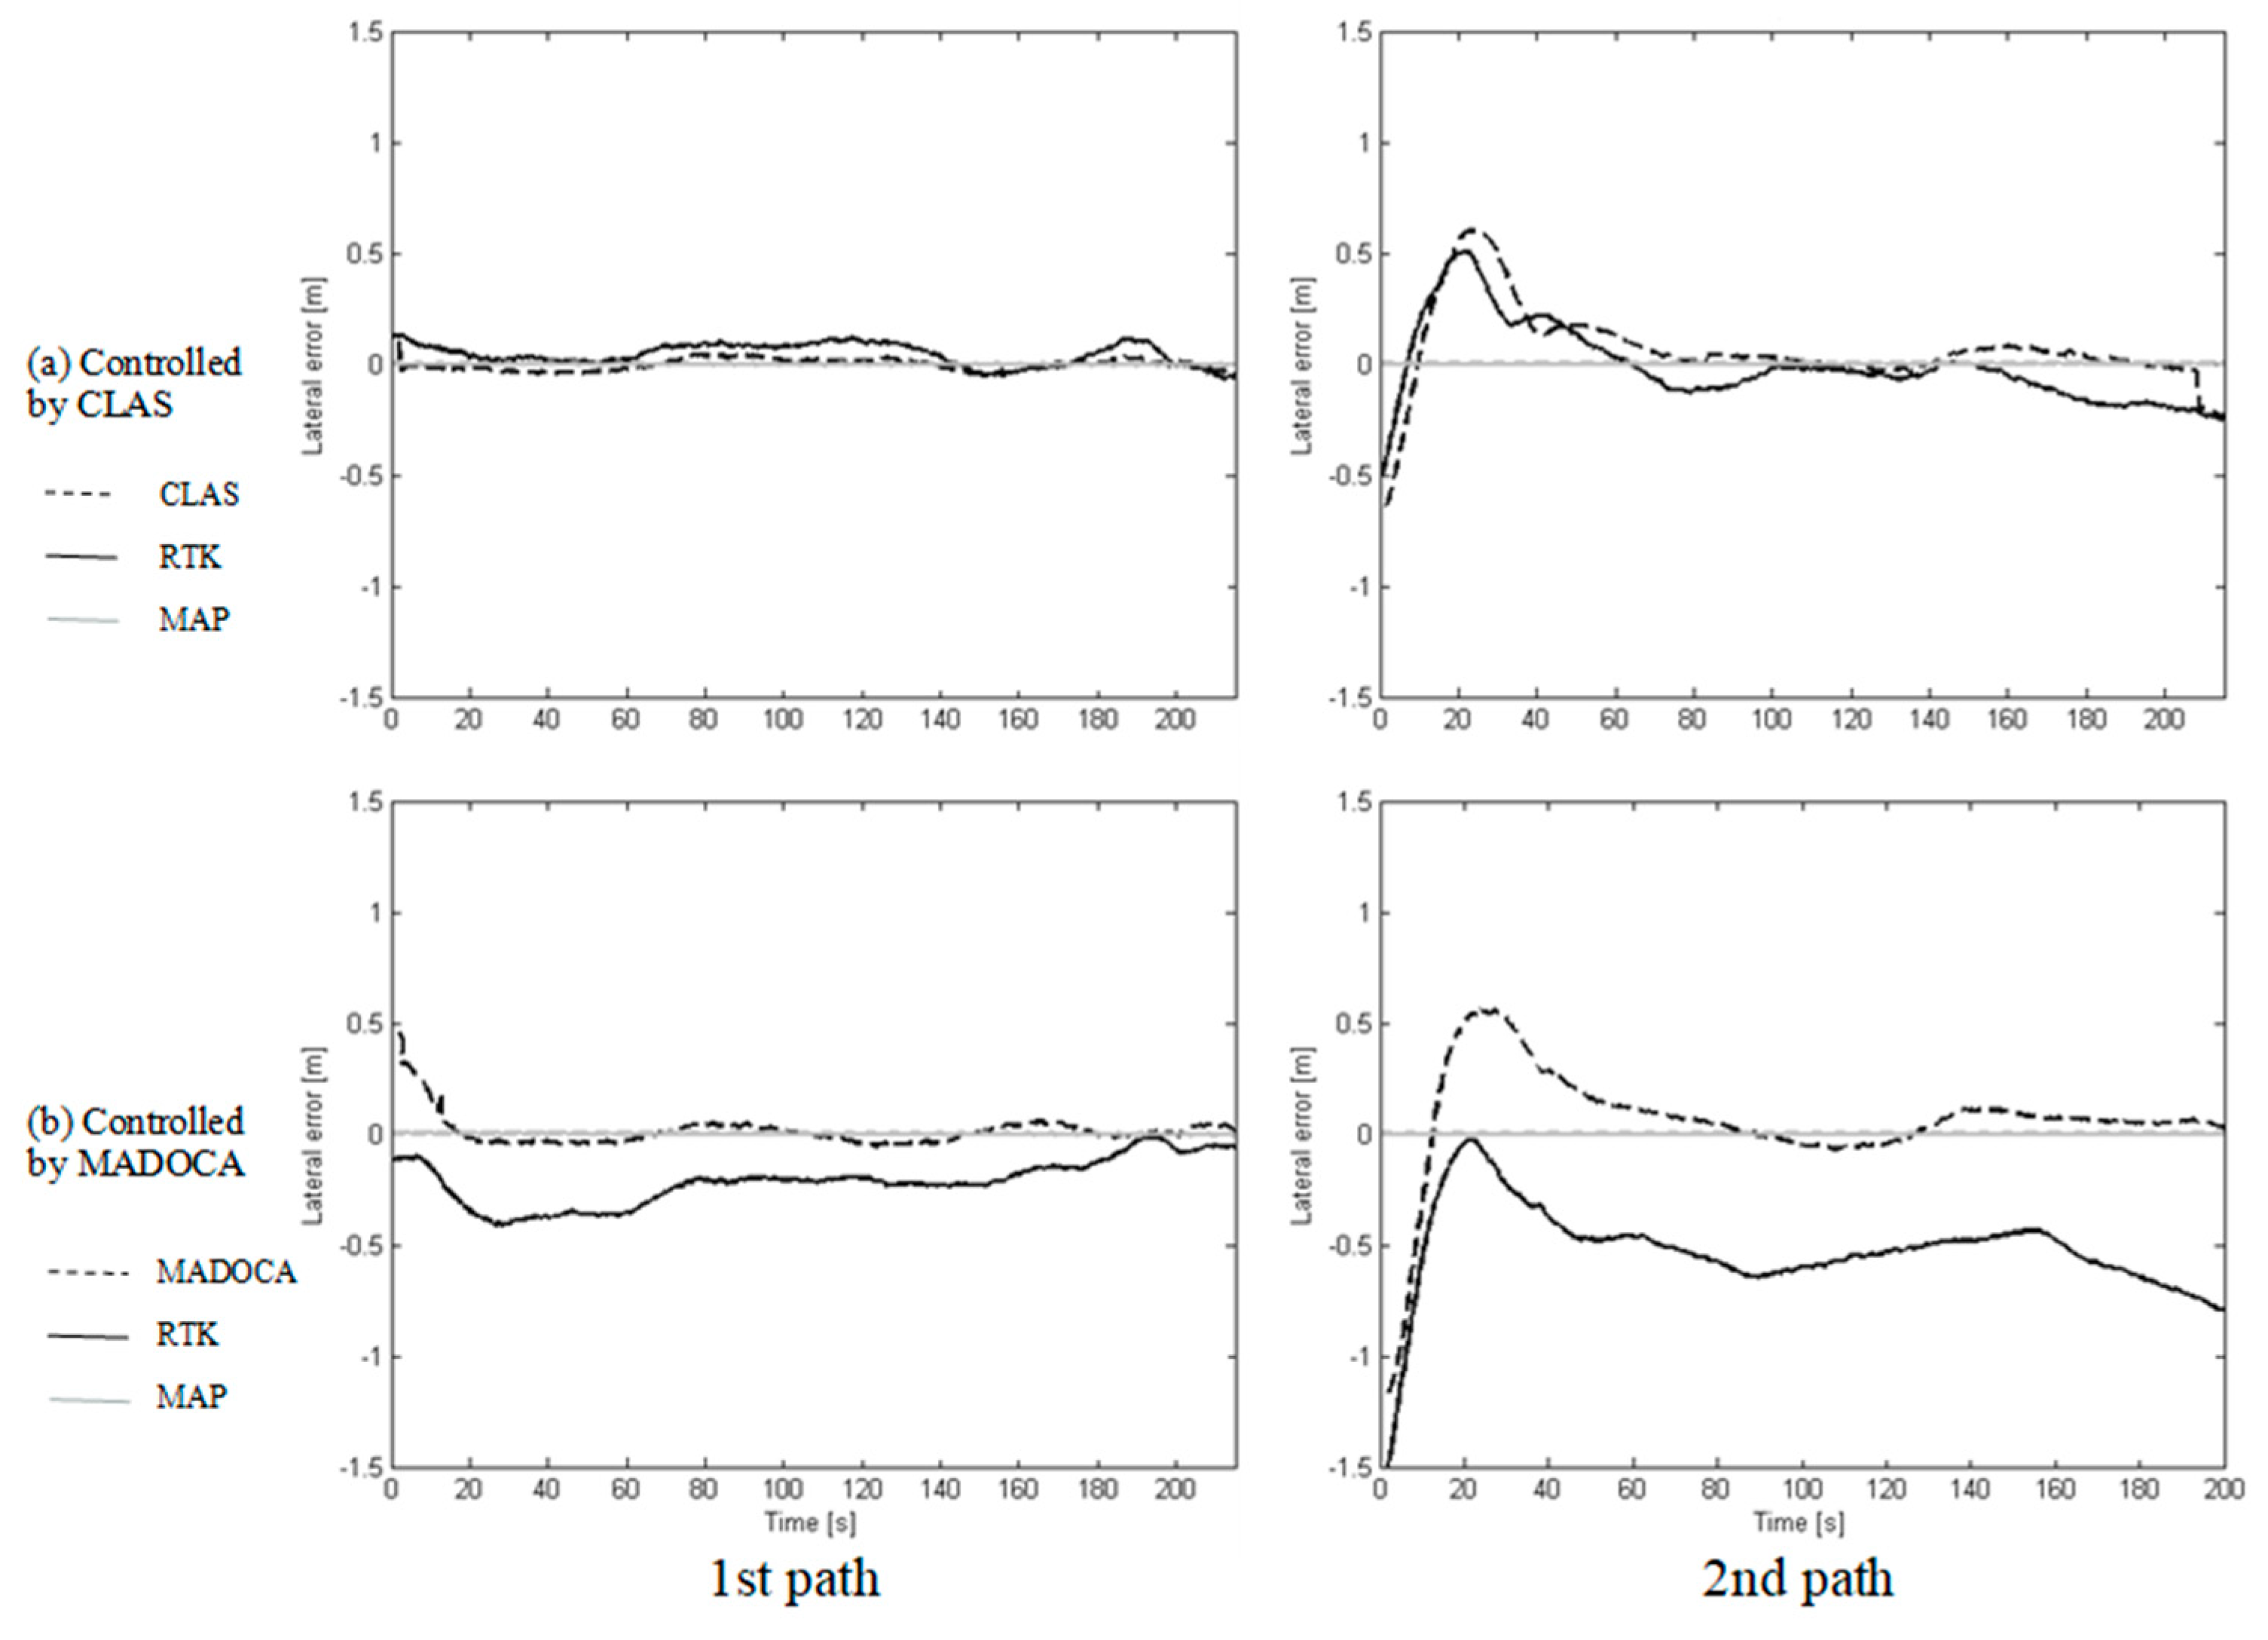
Figure 9 shows the logged position data from the first runs by using the CLAS and MADOCA to control the robot combine harvester. The dashed line represents the positioning augmentation system used at each experimental run. The solid clear line at the zero of the vertical axis represents the map points followed by the automatic controller of the robot combine harvester. The solid dark line represents the RTK data used as a reference.
Table 5 summarizes the results from the robot combine harvest controlled by CLAS under the dynamic conditions. The difference of the RMSE of the lateral deviation between the CLAS and the RTK is almost constant since the time the experiment started; which means the position data provided by the CLAS always converge to the position data provided by the RTK during the six hours of the experiment. Therefore, the CLAS does not has the time dependency phenomenon. The average RMSE of the lateral deviation of the RTK or actual path is 0.09 m and 0.23 m for the first path and second path, respectively. It is necessary to consider that when the robot combine harvester performs a round trip, the width of the header used for harvesting requires a minimum distance between the going and the returning path. If this distance is too big, it might result in a gap of unharvested plants between the going and the returning path. This distance is defined as the overlap of the robot combine harvester. Due to these RMSE values, the overlap between each path of the predesigned navigation map should be set to 0.09 m while using the CLAS to control the robot combine harvester.
Table 6 summarizes the results from the robot combine harvester controlled by MADOCA under dynamic conditions. The difference of the RMSE of the lateral deviation between the results from the robot combine harvester controlled by MADOCA under dynamic conditions. The difference of the RMSE of the lateral deviation between the MADOCA and the RTK decreases drastically in the second run. It keeps decreasing in the third run and it is almost constant until the fourth run. Unlike the CLAS, the MADOCA has time dependency phenomenon, according to the results from the static positioning experiments and the dynamic experiments while using the RTK as a controller. Although results from the static positioning experiments of the MADOCA positioning augmentation system suggest that it is necessary to wait 1 h after activation before using it, the results from the dynamic experiment suggest that it is necessary to wait 2 h. Therefore, the MADOCA should be activated 2 h before using it to control the robot combine harvester for a safe and efficient work. The average RMSE of the lateral deviation of the RTK or actual path, after the MADOCA converges to the RTK, is 0.086 m and 0.63 m for the first path and second path, respectively. Due to these RMSE values, the overlap between each path of the predesigned navigation map should be set to less than 0.09 while using the MADOCA to control the robot combine harvester.
Please note that the RMSE values for the RTK in Table 5 and Table 6 are different because the robot combine harvester navigated using either CLAS or MADOCA positioning augmentation systems. The RTK is only measuring the real position of the machine and it takes no part in the automatic navigation control. From Table 5 and Table 6, it is not possible for the RMSE values of the RTK to be too similar for both experiments because that would mean that CLAS and MADOCA have almost the same accuracy.

4. Discussion

4.1. Static Experiment

The results from Table 2 imply that concerning the activation times there is not too much difference between three positioning augmentation systems. Although there might be some special cases in which factors like geography or weather conditions might affect these activation times, for implementation in a robot combine harvester it is safe to conclude that under normal operation conditions it should take less than 3 min to have any of these positioning systems ready.
Figure 5a verifies that the scattered area of the points logged by the RTK positioning augmentation system has a small size. Figure 5b shows small variations in position over time, which indicates that it is possible to use the mean position logged by the RTK to neglect these small variations while using the RTK position data as a reference.
The result shown in Figure 6a gives the initial idea that this positioning augmentation system is more accurate than MADOCA. The result shown in Figure 6b suggests that the loop shown in the MADOCA plot might be caused by an oscillation in the coordinates received until they converge to a smaller area of around 0.50 m by 0.50 m and the measurement stabilizes.
For both the 2DRMS and the CEP, a big value means that most of the position points are scattered over a wide area and a smaller value means that the position points are concentrated within a small area.
The calculations from Table 3 verify the initial idea from Figure 6; the CLAS positioning augmentation system is more accurate than MADOCA. The average number of satellites tracked gives an indication of the quality of the signal reception of positioning. A minimum of four satellites are required to estimate the receiver’s location and time [22]. The more satellites used, the greater the solution quality and integrity. This is an important estimator for these experiments because it helps to understand if the accuracy of a positioning augmentation system is getting affected by weather conditions or the satellites line of view, or the accuracy is just inferior. For these experiments, although the MADOCA positioning augmentation system registered on average more satellites than the CLAS, it performed worse. Therefore, the MADOCA inferior accuracy was not caused by the lack of satellites, it was caused by its inherent measurement principle.
In addition, the RMSE was used to describe the accuracy by measuring the errors between each receiver position data and the actual position. As stated previously, the actual position was chosen as the mean position recorded by the receiver using RTK. The difference between each positioning augmentation system points result and the RTK position points result is termed the bias of each receiver. The mean of the bias values within a period is termed the offset of each receiver [4]. This offset is calculated from the easting and northing coordinates separately. Table 3 summarizes the accuracy analysis in terms of the offset and the RMSE calculated using Equation (3). Unlike the result from 2DRMS and CEP, these results show that both CLAS and MADOCA have a similar offset of around 0.33 m in the easting coordinate and 0.43 m in the northing coordinate with an RMSE of around 0.55 m. These results imply the notion that the MADOCA positioning augmentation system is as accurate as the CLAS in terms of a constant offset bias.
The results from Figure 7 suggest that CLAS might be appropriate for the robot combine harvester running in automatic mode, the bias respect to the reference measured by the RTK is around 0.40 m but it seems to be almost constant during the six hours of the static positioning experiment. Note that CLAS shows a deviation in the northing coordinate of 0.20 m during the first hour; this might be an inherent characteristic of the CLAS positioning augmentation system. In contrast, the oscillation of MADOCA shows the time dependency of this system; although, for the first hour it is not suitable to be used in a robot combine harvester, it might be used after waiting some time. Therefore, the notion that the MADOCA positioning augmentation system is as accurate as the CLAS in terms of a constant offset bias is not correct. This time restriction was considered for the dynamic positioning experiments.

4.2. Performance Evaluation of Robot Combine Harvester

The logged position data of the robot combine harvester in Figure 8 shows that there are oscillations after the combine harvester finishes the turning maneuver and enters the straight path. These oscillations are caused by utilization of the FDS with steering wheel for turning. However, the robot combine harvester autonomous navigation using both CLAS and MADOCA could return to the straight travel path along the predesigned navigation map. From Figure 8, it can be concluded that it is possible to use either of these positioning augmentation systems for the robot combine harvester autonomous navigation.
However, Table 4 results shows that the MADOCA performance is poor for the first experimental run. An RMSE of 0.32 m suggests that is not possible to use this positioning augmentation technique for the robot combine harvester. The MADOCA performance improves in the second run and it gets better in the third run because the MADOCA positioning augmentation system requires at least two hours for stabilization, as evidenced in the data shown in Figure 7b. Therefore, this positioning augmentation system is not suitable for the practical function of the robot combine harvester. It is not practical to have an agricultural robot waiting in the field for two hours to complete a harvest task that might take one hour for a small field. The results summarized in Table 4 are consistent to the results summarized in Table 3 and the data displayed in Figure 7.
Results summarized in Table 5 and Table 6 suggest that when using either CLAS or MADOCA it is necessary to consider the bias compensation for each augmentation system. The overlap between each path of the predesigned navigation map should be set to 0.09 m when using either CLAS or MADOCA. However, this overlap should be updated periodically due to the earth’s crustal movement for compensation of biases between the RTK and either CLAS or MADOCA.
The logged position data of the RTK shown in Figure 9 by the solid dark line displays a bigger bias respect to the map points represented by the solid clear line in comparison to both CLAS and MADOCA used as inputs in the automatic controller. This is because the RTK logged position data are more accurate for both the static and dynamic positioning experiments. The automatic controller tries to follow the map points according to the position provided by either CLAS or MADOCA, but it cannot tell the difference between one or another respect to the real path. Therefore, the logged position data of the RTK represent the actual path that the robot combine harvester ran. The position data from the second path were logged after finishing the turning maneuver of the first path.
It can be observed in Figure 9 that by using the CLAS to control the robot combine harvester, the position data provided by the CLAS converges to almost the same position data provided by the RTK positioning augmentation system. In contrast, the positioning data provided by the MADOCA diverges considerably respect to the position data provided by the RTK while using the MADOCA to control the robot combine harvester. This situation occurs because the MADOCA position augmentation system is a time dependent system; which means it requires several hours to achieve an acceptable control performance. The lateral deviation was calculated by the comparison between the map points and the logged position data from each positioning augmentation system and the RTK. Therefore, the CLAS and the RTK have a smaller RMSE of the lateral deviation in comparison to the MADOCA and the RTK.
Considering the bias observed in Figure 9 and the data summarized in Table 5, it is possible to conclude that the RMSE of the lateral deviation of the CLAS is stable. However, it is necessary to consider the bias. This bias is caused by the earth’s crustal movement consideration, which the CLAS neglects. The results verify that the bias error between the CLAS and the RTK is less than 0.10 m. The bias error between the MADOCA and the RTK is less than 0.40 m. This bias error is larger than the bias error between the CLAS and the RTK because of the big oscillation of the MADOCA caused by the time dependency of this system, as concluded from the analysis of the data shown in Figure 9 and summarized in Table 6. These biases are also caused by the simultaneous change of position in the easting and northing coordinates while the robot combine harvester is running. The bias from the change of the position will always be visible even when the machine is controlled by using the RTK positioning augmentation system. This bias should be less notorious if the direction of the predesigned navigation map is parallel to one of the UTM coordinate system axis. This means the bias should be smaller if the robot combine harvest travels only in the northing or easting direction. However, this condition is unrealistic and cannot be implemented in practical applications. This raises the question of whether it would be possible to adjust the values obtained from the CLAS positioning augmentation system by estimating an almost constant bias in both easting and northing directions. However, this is a work still in progress and is out of the scope of this research.

5. Conclusions

In this study the performance evaluation of a robot combine harvester has been shown by analyzing the accuracies under static and dynamic conditions of the CLAS and MADOCA positioning augmentation systems. The evaluations under static conditions lead to conclude that both CLAS and MADOCA have relatively short activation times, but also lead to conclude that CLAS displays a better static accuracy than MADOCA.
The evaluation under dynamic conditions while using the RTK for navigation drew the conclusion that the overall accuracy of both CLAS and stabilized MADOCA is inferior to the RTK. Even though, the evaluation under dynamic conditions allowed to conclude that the performance of a robot combine harvester using the CLAS positioning augmentation systems is good enough for practical applications. In the other hand, the dynamic results allowed to conclude that utilization of the MADOCA is not suitable for the practical function of the robot combine harvester.

Author Contributions

Conceptualization, N.N.; methodology, N.N.; software, K.U.; validation, R.O. and N.N.; formal analysis, K.U.; investigation, K.U.; resources, N.N.; data curation, K.U.; writing—original draft preparation, K.U.; writing—review and editing, K.U., R.O., and N.N.; visualization, K.U.; supervision, Y.-J.K. and N.N.; project administration Y.-J.K. and N.N.; funding acquisition, N.N. All authors have read and agreed to the published version of the manuscript.

Funding

This research was supported by the Korea Institute of Planning and Evaluation for Technology in Food, Agriculture, Forestry (IPET) through the Advanced Production Technology Development Program, funded by the Ministry of Agriculture, Food and Rural Affairs (MAFRA) (318072-03).

Institutional Review Board Statement

Not applicable.

Informed Consent Statement

Not applicable.

Data Availability Statement

Not applicable.

Conflicts of Interest

The authors declare no conflict of interest.

References

  1. Zhang, Z. Development of a Robot Combine Harvester Based on GNSS. Ph.D. Thesis, Hokkaido University, Hokkaido, Japan, 25 March 2014. [Google Scholar]
  2. Iida, M.; Ikemura, Y.; Suguri, M.; Masuda, R. Cut-edge and stubble detection for auto-steering system of combine harvester using machine vision. IFAC 2010, 43, 145–150. [Google Scholar] [CrossRef]
  3. Teng, Z.; Noguchi, N.; Liangliang, Y.; Ishii, K.; Jun, C. Development of uncut crop edge detection system based on laser rangefinder for combine harvester. Int. J. Agric. Biol. Eng. 2016, 9, 21–28. [Google Scholar]
  4. Wang, H.; Noguchi, N. Navigation of a robot tractor using the centimeter level augmentation information via Quasi-Zenith Satellite System. EAEF 2019, 12, 414–419. [Google Scholar] [CrossRef]
  5. Castleden, N.; Hu, G.R.; Abbey, D.A.; Weihing, D.; Øvstedal, O.; Earls, C.J.; Featherstone, W.E. First results from virtual reference station (VRS) and precise point positioning (PPP) GPS research at the western Austranlian Center for Geodesy. J. Glob. Position. Syst. 2004, 3, 79–84. [Google Scholar] [CrossRef] [Green Version]
  6. Fotopoulos, G.; Cannon, M.E. An overview of multi-reference station method for cm-level positioning. GPS Solut. 2001, 4, 1–10. [Google Scholar] [CrossRef]
  7. Lachapelle, G.; Alves, P.; Fortes, L.P.; Cannon, M.E.; Townsen, B. DGPS RTK positioning using a reference network. In Proceedings of the 13th International Technical Meeting of the Satellite Division of the Institute of Navigation (ION GPS 2000), Salt Lake City, UT, USA, 19–22 September 2000; pp. 1165–1171. [Google Scholar]
  8. Choy, S.; Harima, K.; Li, Y.; Choudhury, M.; Rizos, C.; Wakabayashi, Y.; Kogure, S. GPS precise point positioning with the Japanese Quasi-Zenith Satellite System LEX augmentation corrections. J. Navig. 2015, 68, 769–783. [Google Scholar] [CrossRef] [Green Version]
  9. Zumberge, J.F.; Helfin, M.B.; Jefferson, D.C.; Watkins, M.M.; Webb, F.H. Precise point positioning for the efficient and robust analysis of GPS data from large netswork. J. Geophys. Res. Solid Earth 1997, 102, 5005–5017. [Google Scholar] [CrossRef] [Green Version]
  10. Choy, S.; Bisnath, S.; Rizos, C. Uncovering common misconceptions in GNSS Precise Point Positioning and its future prospect. Gps Solut. 2017, 21, 13–22. [Google Scholar] [CrossRef]
  11. Yanmar Combine Harvester Steering System Full Time Drive System. Available online: https://www.yanmar.com/global/about/technology/technical_review/2015/0401_2.html (accessed on 25 March 2020).
  12. Inaba, N.; Matsumoto, A.; Hase, H.; Kogure, S.; Sawabe, M.; Terada, K. Design concept of quasi zenith satellite system. Acta Astrnautica 2009, 65, 1068–1075. [Google Scholar] [CrossRef]
  13. Kobayashi, K. QZSS PPP Service. Available online: https://home.csis.u-tokyo.ac.jp/~dinesh/GNSS_Train_files/202001/LectureNotes/Kobayashi/2020AIT_MADOCACLAS.pdf (accessed on 27 March 2020).
  14. Zhang, S.; Du, S.; Li, W.; Wang, G. Evaluation of the GPS Precise Orbit and Clock Corrections from MADOCA Real-Time Products. Sensors 2019, 19, 2580. [Google Scholar] [CrossRef] [PubMed] [Green Version]
  15. Saito, M.; Sato, Y.; Miya, M.; Shima, M.; Omura, Y.; Takiguchi, J.; Asari, K. Centimeter-class augmentation system utilizing quasi-zenith satellite. In Proceedings of the 24th International Technical Meeting of The Satellite Division of the Institute of Navigation (ION GNSS 2011), Portland, Oregon, 20–23 September 2011; pp. 1243–1253. [Google Scholar]
  16. Wübbena, G.; Schmitz, M.; Bagge, A. PPP-RTK: Precise point positioning using state-space representation in RTK networks. In Proceedings of the ION GNSS, Long Beach, CA, USA, 13–16 September 2005; pp. 13–16. [Google Scholar]
  17. Seigo, F.; Masakazu, M.; Junichi, T. Establish of Centimeter-class Augmentation System utilizing Quasi-Zenith Satellite System utilizating Quasi-Zenith Satellite System. Syst. Contr. Inf. 2015, 59, 126–131. [Google Scholar]
  18. Miya, M.; Fujita, S.; Sato, Y.; Ota, K.; Hirokawa, R.; Takiguchi, J. Centimeter level augmentation service (CLAS) in Japanese quasi-zenith satellite system, its user interface, detailed design, and plan. In Proceedings of the 29th International Technical Meeting of the Satellite Division of the Institute of Navigation (ION GNSS + 2016), Portland, Oregon, 12–16 September 2016; pp. 2864–2869. [Google Scholar]
  19. Petrovski, I.G.; Tsuiji, T. Digital Satellite Navigation and Geophysics: A Practical Guide with GNSS Signal Simulator and Receiver Laboratory. Camb. Univ. Press 2012. [Google Scholar] [CrossRef]
  20. Drosos, V.K.; Malesios, C.; Soutsas, K.P. Planimetry reliability with GPS. In Proceedings of the 44th International Symposium on Forestly Mechanisation, Graz, Austria, 9–13 October 2011. [Google Scholar]
  21. Rodriduez-Pérez, J.R.; Alvarez, M.F.; Sanz, E.; Gavela, A. Comparison of GPS Receiver Accuracy and Precision in Forest Environment. Practical recommendation regarding methods and receiver selection. In Proceedings of the 23rd FIG Conference, Munich, Germany, 8–13 October 2006. [Google Scholar]
  22. Fan, P.; Li, W.; Cui, X.; Lu, M. Precise and Robust RTK-GNSS Positioning in Urban Environments with Dual-Antenna Configuration. Sensors 2019, 19, 3586. [Google Scholar] [CrossRef] [PubMed] [Green Version]
Figure 1. Platform of the study—AG1100 equipped with navigation sensor.
Agronomy 11 00483 g001
Figure 2. Combine harvester’s Fulltime Drive System (FDS) with steering wheel for 3 turning modes (a) Gentle turn, (b) Normal turn, (c) Sharp turn.
Agronomy 11 00483 g002
Figure 3. Diagram of the Multi-Global Navigation Satellite System (GNSS) Advanced Demonstration tool for Orbit and Clock Analysis (MADOCA) positioning augmentation system.
Agronomy 11 00483 g003
Figure 4. Diagram of the Centimeter Level Augmentation Service (CLAS) positioning augmentation system.
Agronomy 11 00483 g004
Figure 5. Static positioning experiment results of the Real Time Kinematic (RTK) positioning augmentation system. (a) Easting vs. Northing, (b) Time series; the red points are the position points, the measurement within the circle in black is the twice distance root mean square (2DRMS), the radius of the circle in green is the circular error probability (CEP).
Agronomy 11 00483 g005
Figure 6. Static positioning experiment results: (a) CLAS, (b) MADOCA; the red points are the position points, the blue points are the mean of the position points, the measurements within the circles in black are the 2DRMS, the radius of the circles in green are the CEP.
Agronomy 11 00483 g006
Figure 7. Logged positioning data for six hours from the static positioning experiment (a) CLAS, (b) MADOCA.
Agronomy 11 00483 g007
Figure 8. Logged positioning data of the robot combine harvester (a) CLAS, (b) MADOCA.
Agronomy 11 00483 g008
Figure 9. Logged positioning data against time from the first run controlled by (a) CLAS (b) MADOCA.
Agronomy 11 00483 g009
Table 1. Specifications of the AG1100 combine harvester.
Length (mm)6150
Width (mm)2350
Height (mm)2760
Engine output (kW)80.9
Crawler size (mm)500 × 1780
Speed (m/s)Low: 0–1.0
Medium: 0–2.0
High: 0–2.81
Table 2. Activation results.
Test NumberRTK (Real-Time Kinematic)
(2019/06/25)
MADOCA
(2019/07/08)
CLAS
(2020/01/16)
Act. Time (s)React. Time (s)Act. Time (s)React. Time (s)Act. Time (s)React. Time (s)
113.913.431.543.7127.1-
215.112.530.242.8128.4-
313.712.329.543.7128.5-
414.313.229.243.3129.1-
514.212.730.843.9128.3-
614.712.831.142.4127.6-
714.113.130.743.1128.3-
814.012.430.544.2128.6-
913.812.930.142.7127.3-
1014.613.529.743.5128.1-
Min.13.712.329.242.4127.1-
Max.15.113.531.544.2129.1-
Average14.212.930.343.3128.1-
S.D.0.440.420.730.580.62-
Table 3. Accuracy analysis.
Positioning
Augmentation System
2DRMS
(m)
CEP
(m)
No. of
Satellites
N-S Offset
(m)
E-W Offset
(m)
RMS Error
(m)
RTK0.0100.00814.6Ref.Ref.Ref.
MADOCA0.1070.08912.7-0.4270.3260.54
CLAS0.0410.03411.0-0.4470.3520.57
Table 4. Results from dynamic positioning experiments controlled by RTK.
Positioning Augmentation SystemRMSE of Lateral Deviation (m)
1st Run at 10:002nd Run at 12:003rd Run at 14:004th Run at 16:00
RTK0.040.030.040.03
MADOCA0.320.180.060.07
CLAS0.060.050.040.05
Table 5. Results from robot combine harvester controlled by CLAS.
Positioning
Augmentation System
RMSE of Lateral Deviation from 1st Path (m)RMSE of Lateral Deviation from 2nd Path (m)
10:0012:0014:0016:0010:0012:0014:0016:00
CLAS0.030.030.030.030.260.210.310.27
RTK0.070.110.110.090.220.190.280.23
Table 6. Results from robot combine harvester controlled by MADOCA.
Positioning
Augmentation System
RMSE of Lateral Deviation from 1st Path (m)RMSE of Lateral Deviation from 2nd Path (m)
10:0012:0014:0016:0010:0012:0014:0016:00
MADOCA0.110.040.070.080.360.690.630.67
RTK0.230.090.080.090.580.660.580.66
Publisher’s Note: MDPI stays neutral with regard to jurisdictional claims in published maps and institutional affiliations.