
Stability of Aggregates Made by Earthworms in Soils with Organic Additives

 ,
, 
 and
and
Abstract
1. Introduction
- H1: aggregate stability is related to soil texture and organic additives applied to the soil
- H2: aggregate stability is connected with carbon stabilization and microbial activity
- H3: two methods of measuring aggregate stability, namely (i) the wet-sieve method and (ii) the laser diffraction method are comparable.
2. Materials and Methods
2.1. Experiment Design
2.2. Laboratory Measurements
2.3. Statistical Analysis
3. Results
4. Discussion
5. Conclusions
Supplementary Materials
Author Contributions
Funding
Data Availability Statement
Acknowledgments
Conflicts of Interest
References
- Trivedi, P.; Anderson, I.C.; Singh, B.K. Microbial modulators of soil carbon storage: Integrating genomic and metabolic knowledge for global prediction. Trends Microbiol. 2013, 21, 641–651. [Google Scholar] [CrossRef] [PubMed]
- Parent, L.E.; De Almeida, C.X.; Hernandes, A.; Egozcue, J.J.; Gülser, C.; Bolinder, M.A.; Kätterer, T.; Andrén, O.; Parent, S.E.; Anctil, F.; et al. Compositional analysis for an unbiased measure of soil aggregation. Geoderma 2012, 179, 123–131. [Google Scholar] [CrossRef]
- Jozefaciuk, G.; Czachor, H.; Lamorski, K.; Hajnos, M.; Swieboda, R.; Franus, W. Effect of humic acids, sesquioxides and silica on the pore system of silt aggregates measured by water vapour desorption, mercury intrusion and microtomography. Eur. J. Soil Sci. 2015. [Google Scholar] [CrossRef]
- Fernández-Ugalde, O.; Barré, P.; Hubert, F.; Virto, I.; Girardin, C.; Ferrage, E.; Caner, L.; Chenu, C. Clay mineralogy differs qualitatively in aggregate-size classes: Clay-mineral-based evidence for aggregate hierarchy in temperate soils. Eur. J. Soil Sci. 2013, 64. [Google Scholar] [CrossRef]
- Chenu, C.; Plante, A.F. Clay-sized organo-mineral complexes in a cultivation chronosequence: Revisiting the concept of the “primary organo-mineral complex”. Eur. J. Soil Sci. 2006, 57, 596–607. [Google Scholar] [CrossRef]
- Idowu, O.J. Relationships between aggregate stability and selected soil properties in humid tropical environment. Commun. Soil Sci. Plant Anal. 2003. [Google Scholar] [CrossRef]
- CHANEY, K.; SWIFT, R.S. The influence of organic matter on aggregate stability in some British soils. J. Soil Sci. 1984. [Google Scholar] [CrossRef]
- Kemper, W.D.; Koch, E.J. Aggregate Stability of Soils from Western USA and Canada; USDA Technical Bulletin No. 1355; US Government Printing Office: Washingt, DC, USA, 1966; 1355, pp. 1–52.
- Bazzoffi, P.; Mbagwu, J.S.C.; Chukwu, W.I.E. Statistical models for predicting aggregate stability from intrinsic soil components. Int. Agrophysics 1995, 9, 1–9. [Google Scholar]
- Chenu, C.; Guérif, J. Mechanical Strength of Clay Minerals as Influenced by an Adsorbed Polysaccharide. Soil Sci. Soc. Am. J. 1991. [Google Scholar] [CrossRef]
- Wakindiki, I.I.C.; Ben-Hur, M. Soil Mineralogy and Texture Effects on Crust Micromorphology, Infiltration, and Erosion. Soil Sci. Soc. Am. J. 2002. [Google Scholar] [CrossRef]
- Lado, M.; Ben-Hur, M. Soil mineralogy effects on seal formation, runoff and soil loss. Appl. Clay Sci. 2004. [Google Scholar] [CrossRef]
- Six, J.; Bossuyt, H.; Degryze, S.; Denef, K. A history of research on the link between (micro)aggregates, soil biota, and soil organic matter dynamics. Soil Tillage Res. 2004, 79, 7–31. [Google Scholar] [CrossRef]
- Ayoubi, S.; Mirbagheri, Z.; Mosaddeghi, M.R. Soil organic carbon physical fractions and aggregate stability influenced by land use in humid region of northern Iran. Int. Agrophysics 2020. [Google Scholar] [CrossRef]
- Abiven, S.; Menasseri, S.; Chenu, C. The effects of organic inputs over time on soil aggregate stability—A literature analysis. Soil Biol. Biochem. 2009, 41, 1–12. [Google Scholar] [CrossRef]
- Cheshire, M.V.; Hayes, M.H.B. Composition, Origins, Structures, and Reactivities of Soil Polysaccharides. In Soil Colloids and Their Associations in Aggregates; Springer: Boston, MA, USA, 1990; pp. 307–336. [Google Scholar]
- Spaccini, R.; Piccolo, A.; Conte, P.; Haberhauer, G.; Gerzabek, M.H. Increased soil organic carbon sequestration through hydrophobic protection by humic substances. Soil Biol. Biochem. 2002. [Google Scholar] [CrossRef]
- Helfrich, M.; Ludwig, B.; Potthoff, M.; Flessa, H. Effect of litter quality and soil fungi on macroaggregate dynamics and associated partitioning of litter carbon and nitrogen. Soil Biol. Biochem. 2008. [Google Scholar] [CrossRef]
- Bartlová, J.; Badalíková, B.; Pospíšilová, L.; Pokorný, E.; Šarapatka, B. Water stability of soil aggregates in different systems of Tillage. Soil Water Res. 2015. [Google Scholar] [CrossRef]
- Tan, K.H. Humic Matter in Soil and the Environment, Principles and Controversies; CRC press, Taylor & Francis Group: Boca Raton, FL, USA, 2014; ISBN 978-1-4822-3446-6. [Google Scholar]
- Burke, I.C.; Yonker, C.M.; Parton, W.J.; Cole, C.V.; Flach, K.; Schimel, D.S. Texture, Climate, and Cultivation Effects on Soil Organic Matter Content in U.S. Grassland Soils. Soil Sci. Soc. Am. J. 1989. [Google Scholar] [CrossRef]
- Bronson, K.F.; Zobeck, T.M.; Chua, T.T.; Acosta-Martinez, V.; van Pelt, R.S.; Booker, J.D. Carbon and Nitrogen Pools of Southern High Plains Cropland and Grassland Soils. Soil Sci. Soc. Am. J. 2004. [Google Scholar] [CrossRef]
- Cai, A.; Feng, W.; Zhang, W.; Xu, M. Climate, soil texture, and soil types affect the contributions of fine-fraction-stabilized carbon to total soil organic carbon in different land uses across China. J. Environ. Manag. 2016. [Google Scholar] [CrossRef] [PubMed]
- Lubbers, I.M.; Pulleman, M.M.; Van Groenigen, J.W. Can earthworms simultaneously enhance decomposition and stabilization of plant residue carbon? Soil Biol. Biochem. 2017, 105, 12–24. [Google Scholar] [CrossRef]
- Pulleman, M.; Six, J.; Uyl, A.; Marinissen, J.C.Y.; Jongmans, A.G. Earthworms and management affect organic matter incorporation and microaggregate formation in agricultural soils. Appl. Soil Ecol. 2005, 29, 1–15. [Google Scholar] [CrossRef]
- Curry, J.P.; Schmidt, O. The feeding ecology of earthworms—A review. Pedobiologia 2007, 50, 463–477. [Google Scholar] [CrossRef]
- Huang, R.; Tian, D.; Liu, J.; Lv, S.; He, X.; Gao, M. Agriculture, Ecosystems and Environment Responses of soil carbon pool and soil aggregates associated organic carbon to straw and straw-derived biochar addition in a dryland cropping mesocosm system. Agric. Ecosyst. Environ. 2018, 265, 576–586. [Google Scholar] [CrossRef]
- Weldmichael, T.G.; Szegi, T.; Denish, L.; Gangwar, R.K.; Michéli, E.; Simon, B. The patterns of soil microbial respiration and earthworm communities as influenced by soil and land-use type in selected soils of Hungary. Soil Sci. Annu. 2020, 71, 139–148. [Google Scholar] [CrossRef]
- Hallam, J.; Berdeni, D.; Grayson, R.; Guest, E.; Holden, J.; Lappage, M.; Prendergast-Miller, M.; Robinson, D.; Turner, A.; Leake, J.; et al. Effect of earthworms on soil physico-hydraulic and chemical properties, herbage production, and wheat growth on arable land converted to ley. Sci. Total Environ. 2020, 713. [Google Scholar] [CrossRef]
- Mustafa, A.; Minggang, X.; Ali Shah, S.A.; Abrar, M.M.; Nan, S.; Baoren, W.; Zejiang, C.; Saeed, Q.; Naveed, M.; Mehmood, K.; et al. Soil aggregation and soil aggregate stability regulate organic carbon and nitrogen storage in a red soil of southern China. J. Environ. Manage. 2020, 270. [Google Scholar] [CrossRef]
- Almajmaie, A.; Hardie, M.; Acuna, T.; Birch, C. Evaluation of methods for determining soil aggregate stability. Soil Tillage Res. 2017, 167, 39–45. [Google Scholar] [CrossRef]
- Jozefaciuk, G.; Adamczuk, A.; Skic, K.; Boguta, P. New method for quantifying water stability of soil aggregates from air bubbling after immersion. Meas. J. Int. Meas. Confed. 2020. [Google Scholar] [CrossRef]
- Bieganowski, A.; Zaleski, T.; Kajdas, B.; Sochan, A.; Józefowska, A.; Beczek, M.; Lipiec, J.; Turski, M.; Ryżak, M. An improved method for determination of aggregate stability using laser diffraction. L. Degrad. Dev. 2018, 29, 1376–1384. [Google Scholar] [CrossRef]
- Bieganowski, A.; Ryżak, M.; Witkowska-Walczak, B. Determination of soil aggregate disintegration dynamics using laser diffraction. Clay Miner. 2010, 45, 23–34. [Google Scholar] [CrossRef]
- Schneider, C.A.; Rasband, W.S.; Eliceiri, K.W. NIH Image to ImageJ: 25 years of image analysis. Nat. Methods 2012, 9, 671–675. [Google Scholar] [CrossRef]
- Casida Jr., L.E.; Klein, D.A.; Santoro, T. Soil dehydrogenase activity. Soil Sci. 1964, 98, 371–376. [Google Scholar] [CrossRef]
- Voroney, R.P.; Brookes, P.C.; Beyaert, R.P. Soil microbial biomass C, N, P and S. In Soil Sampling and Methods of Analysis; Carter, M.R., Ed.; Canadian Society of Soil Science, CRC press, Taylor & Francis Group: Boca Raton, FL, USA, 2008; pp. 637–651. [Google Scholar]
- Zsolnay, Á. Dissolved organic matter: Artefacts, definitions, and functions. In Proceedings of the Geoderma; Elsevier: Amsterdam, The Netherlands, 2003; Volume 113, pp. 187–209. [Google Scholar]
- Kemper, W.D.; Rosenau, R.C. Aggregate Stability and Size Distribution; John Wiley & Sons, Ltd.: Hoboken, NJ, USA, 2018; pp. 425–442. [Google Scholar]
- TIBCO Software Inc. Statistica (Data Analysis Software System), Version 13. 2017. Available online: http://statistica.io (accessed on 20 December 2020).
- Ter Braak, C.J.F.; Smilauer, P. CANOCO (Version 5): Software for Multivariate Data Exploration, Testing and Summarization; Microcomput. Power: Ithaca, NY, USA, 2012; 536p. [Google Scholar]
- VandenBygaart, A.J.; Fox, C.A.; Fallow, D.J.; Protz, R. Estimating Earthworm-Influenced Soil Structure by Morphometric Image Analysis. Soil Sci. Soc. Am. J. 2000, 64, 982–988. [Google Scholar] [CrossRef]
- Lamandé, M.; Hallaire, V.; Curmi, P.; Pérès, G.; Cluzeau, D. Changes of pore morphology, infiltration and earthworm community in a loamy soil under different agricultural managements. Catena 2003, 54, 637–649. [Google Scholar] [CrossRef]
- Sainju, U.M. Carbon and nitrogen pools in soil aggregates separated by dry and wet sieving methods. Soil Sci. 2006, 171, 937–949. [Google Scholar] [CrossRef]
- Curry, J.P. Factors affecting the abundance of earthworms in soils. In Earthworm Ecology, 2nd ed.; CRC press, Taylor & Francis Group: Boca Raton, FL, USA, 2004; Volume 9, pp. 91–113. ISBN 9781420039719. [Google Scholar]
- Lapied, E.; Nahmani, J.; Rousseau, G.X. Influence of texture and amendments on soil properties and earthworm communities. Appl. Soil Ecol. 2009, 43, 241–249. [Google Scholar] [CrossRef]
- Moody, S.A.; Piearce, T.G.; Dighton, J. Selective Consumption of Decomposing. Soil Biol. Biochem. 1995, 27, 1209–1213. [Google Scholar] [CrossRef]
- Wu, Y.; Shaaban, M.; Peng, Q.; Zhou, A.; Hu, R. Impacts of earthworm activity on the fate of straw carbon in soil: A microcosm experiment. Environ. Sci. Pollut. Res. 2018, 25, 11054–11062. [Google Scholar] [CrossRef]
- Józefowska, A.; Woś, B.; Pietrzykowski, M. Tree species and soil substrate effects on soil biota during early soil forming stages at afforested mine sites. Appl. Soil Ecol. 2016, 102, 70–79. [Google Scholar] [CrossRef]
- Ceccanti, B.; Masciandaro, G.; Garcia, C.; MacCi, C.; Doni, S. Soil bioremediation: Combination of earthworms and compost for the ecological remediation of a hydrocarbon polluted soil. Water. Air. Soil Pollut. 2006, 177, 383–397. [Google Scholar] [CrossRef]
- Zhang, P.; Wei, T.; Jia, Z.; Han, Q.; Ren, X.; Li, Y. Effects of straw incorporation on soil organic matter and soil water-stable aggregates content in semiarid regions of Northwest China. PLoS ONE 2014, 9, 92839. [Google Scholar] [CrossRef] [PubMed]
- Józefowska, A.; Pietrzykowski, M.; Woś, B.; Cajthaml, T.; Frouz, J. The effects of tree species and substrate on carbon sequestration and chemical and biological properties in reforested post-mining soils. Geoderma 2017, 292, 9–16. [Google Scholar] [CrossRef]
- Ponge, J.F. Humus forms in terrestrial ecosystems: A framework to biodiversity. Soil Biol. Biochem. 2003, 35, 935–945. [Google Scholar] [CrossRef]
- Bossuyt, H.; Six, J.; Hendrix, P.F. Interactive effects of functionally different earthworm species on aggregation and incorporation and decomposition of newly added residue carbon. Geoderma 2006, 130, 14–25. [Google Scholar] [CrossRef]
- Steffan, S.A.; Dharampal, P.S. Undead food-webs: Integrating microbes into the food-chain. Food Webs 2019, 18, e00111. [Google Scholar] [CrossRef]
- Beare, M.H.; Russell Bruce, R. A comparison of methods for measuring water-stable aggregates: Implications for determining environmental effects on soil structure. Geoderma 1993, 56, 87–104. [Google Scholar] [CrossRef]
- Sarker, T.C.; Incerti, G.; Spaccini, R.; Piccolo, A.; Mazzoleni, S.; Bonanomi, G. Linking organic matter chemistry with soil aggregate stability: Insight from 13C NMR spectroscopy. Soil Biol. Biochem. 2018, 117, 175–184. [Google Scholar] [CrossRef]
- Tisdall, J.M.; Oades, J.M. Organic matter and water-stable aggregates in soils. J. Soil Sci. 1982, 33, 141–163. [Google Scholar] [CrossRef]
- Duchicela, J.; Vogelsang, K.M.; Schultz, P.A.; Kaonongbua, W.; Middleton, E.L.; Bever, J.D. Non-native plants and soil microbes: Potential contributors to the consistent reduction in soil aggregate stability caused by the disturbance of North American grasslands. New Phytol. 2012, 196, 212–222. [Google Scholar] [CrossRef] [PubMed]
- Portella, C.M.R.; Fatima, M.; Feller, C.; Fonseca, I.; Filho, J.T. Soil aggregation under different management systems. Rev. Bras. Ciência do Solo 2012, 36, 1868–1877. [Google Scholar] [CrossRef]
- Chenu, C.; Le Bissonnais, Y.; Arrouays, D. Organic Matter Influence on Clay Wettability and Soil Aggregate Stability. Soil Sci. Soc. Am. J. 2000, 64, 1479–1486. [Google Scholar] [CrossRef]
- Franzluebbersl, A.J.; Arshad, M.A. Water-stable aggregation and organic matter in four soils under conventional and zero tillage. Can. J. Soil Sci. 1996, 76, 387–393. [Google Scholar] [CrossRef]
- Jan Hassink The capacity of soils to preserve organic C and N by their association withclay and silt particles. Plant Soil 1997, 191, 77–87. [CrossRef]
- Zhang, S.; Li, Q.; Zhang, X.; Wei, K.; Chen, L.; Liang, W. Effects of conservation tillage on soil aggregation and aggregate binding agents in black soil of Northeast China. Soil Tillage Res. 2012, 124, 196–202. [Google Scholar] [CrossRef]
- Adugna, G. A review on impact of compost on soil properties, water use and crop productivity. Acad. Res. J. Agric. Sci. Res. 2016, 93–104. [Google Scholar] [CrossRef]
- Seybold, C.A.; Herrick, J.E. Aggregate stability kit for soil quality assessments. Catena 2001, 44, 37–45. [Google Scholar] [CrossRef]


| Properties | Sand | Loam | ||||||||
|---|---|---|---|---|---|---|---|---|---|---|
| Control | Straw | Peat | Compost | Compostmicro | Control | Straw | Peat | Compost | Compostmicro | |
| Cintr | 0 | 0.09 ± 0.02 Aab | 1.23 ± 0.51 Bab | 0.59 ± 0.13 Bab | 0.75 ± 0.48 Bab | 0 | 0.21 ± 0.09 Ab | 1.05 ± 0.27 Bb | 1.04 ± 0.13 Bb | 0.95 ± 0.25 Bb |
| N intr. | 0 | 0.01 ± 0.17 Aa | 43.78 ± 18.45 Ba | 57.83 ± 14.13 Ca | 73.94 ± 49.92 Ca | 0 | 2.46 ± 1.47 Aa | 38.78 ± 8.42 Ba | 97.48 ± 10.64 Ca | 62.80 ± 3.19 Ca |
| MBC | 3.7 ± 0.0 Aab | 33.3 ± 29.7 Aab | 66.6 ± 38.6 ABab | 179.7 ± 145.1 Cab | 200.9 ± 106.0 BCab | 56.5 ± 50.3 Aa | 37.2 ± 9.2 Aa | 36.8 ± 9.2 ABa | 73.2 ± 41.5 Ca | 81.1 ± 22.6 BCa |
| MBN | 0.0 ± 0.0 Aba | 0.0 ± 0.0 Aab | 7.1 ± 6.4 Aab | 18.3 ± 18.3 Bab | 31.5 ± 35.2 Aab | 3.1 ± 3.6 Aa | 3.3 ± 1.1 Aa | 3.8 ± 1.9 Aa | 4.7 ± 4.8 Ba | 16.7 ± 8.0 Aa |
| DOC | 44.5 ± 4.1 Ab | 97.1 ± 14.1 Bb | 100.6 ± 23.3 Bb | 116.9 ± 19.3 Bb | 117.9 ± 5.1 Bb | 59.2 ± 11.8 Aa | 71.7 ± 14.1 Ba | 77.5 ± 9.1 Ba | 89.1 ± 20.1 Ba | 94.2 ± 15.5 Ba |
| DON | 33.7 ± 3.6 ABa | 21.7 ± 3.1 Aa | 53.7 ± 35.4 ABa | 57.3 ± 35.4 Ca | 69.7 ± 31.0 BCa | 42.9 ± 9.5 ABab | 37.3 ± 0.6 Aab | 50.4 ± 6.4 ABab | 82.7 ± 22.6 Cab | 72.3 ± 18.0 BCab |
| DHA | 0.11 ± 0.08 Ab | 0.31 ± 0.20 Ab | 0.97 ± 0.58 Ab | 1.17 ± 0.94 Ab | 1.36 ± 0.86 Ab | 0.14 ± 0.08 Ab | 2.02 ± 2.26 Ab | 0.56 ± 0.49 Ab | 0.76 ± 0.32 Ab | 1.21 ± 1.18 Ab |
| Properties | Silty Loam | Clay | ||||||||
|---|---|---|---|---|---|---|---|---|---|---|
| Control | Straw | Peat | Compost | Compostmicro | Control | Straw | Peat | Compost | Compostmicro | |
| Cintr | 0 | 0.04 ± 0.05 Aa | 0.57 ± 0.16 Ba | 0.78 ± 0.25 Ba | 0.66 ± 0.29 Ba | 0 | 0.33 ± 0.08 Aab | 1.01 ± 0.18 Bab | 0.95 ± 0.06 Bab | 0.49 ± 0.39 Bab |
| N intr. | 0 | 0.01 ± 0.15 Aa | 19.88 ± 6.99 Ba | 78.44 ± 22.68 Ca | 84.08 ± 13.44 Ca | 0 | 0.51 ± 1.20 Aa | 39.54 ± 8.17 Ba | 93.60 ± 7.43 Ca | 69.55 ± 19.65 Ca |
| MBC | 86.1 ± 67.5 Abc | 92.3 ± 3.8 Abc | 142.8 ± 49.2ABbc | 174.6 ± 12.2 Cbc | 129.3 ± 102.2 BCbc | 62.7 ± 13.7 Ac | 108.4 ± 57.1 Ac | 130.0 ± 76.7 aABc | 384.9 ± 9.7 Cc | 139.0 ± 34.9 BCc |
| MBN | 3.6 ± 5.5 Aa | 8.2 ± 0.9 Aa | 5.6 ± 2.8 Aa | 5.2 ± 4.9 Ba | 5.2 ± 9.8 Aa | 0.0 ± 0.1 Ab | 8.5 ± 1.9 Ab | 0.0 ± 0.0 Ab | 85.3 ± 20.2 Bb | 0.0 ± 0.0 Ab |
| DOC | 75.8 ± 9.5 Ac | 109.8 ± 31.4 Bc | 127.4 ± 15.1 Bc | 119.9 ± 6.5d Bc | 120.2 ± 12.1 Bc | 95.7 ± 3.7 Abc | 110.1 ± 9.8 Bbc | 89.4 ± 9.0 Bbc | 126.7 ± 17.2 Bbc | 109.7 ± 5.2 Bbc |
| DON | 65.2 ± 26.8 ABb | 54.4 ± 28.0 Ab | 64.1 ± 6.5 ABb | 67.1 ± 6.1 Cb | 73.6 ± 6.8 BCb | 59.4 ± 13.6 ABab | 38.0 ± 1.0 Aab | 38.0 ± 4.1 ABab | 84.8 ± 21.9 Cab | 62.5 ± 2.2 BCab |
| DHA | 0.67 ± 0.12 Aab | 0.57 ± 0.21 Aab | 0.94 ± 0.26Aab | 0.15 ± 0.08 Aab | 0.48 ± 0.08 Aab | 0.12 ± 0.12 Aa | 0.17 ± 0.05 Aa | 0.94 ± 0.24 Aa | 0.11 ± 0.01 Aa | 0.08 ± 0.09 Aa |
| Properties | Interaction Additives | Interaction Texture | Interaction Texture × Additives | |||
|---|---|---|---|---|---|---|
| F | P | F | p | F | p | |
| Cintr. | 23.10 | 0.000 | 2.90 | 0.053 | 1.70 | 0.119 |
| N intr | 59.60 | 0.000 | 0.50 | 0.657 | 1.70 | 0.138 |
| MBC | 13.06 | 0.000 | 9.17 | 0.000 | 3.17 | 0.003 |
| MBN | 12.55 | 0.000 | 4.88 | 0.006 | 10.03 | 0.000 |
| DOC | 17.58 | 0.000 | 14.68 | 0.000 | 2.28 | 0.026 |
| DON | 9.02 | 0.000 | 2.77 | 0.054 | 1.17 | 0.339 |
| DHA | 1.21 | 0.323 | 4.16 | 0.01 | 1.57 | 0.140 |
| ET | 24.23 | 0.000 | 12.12 | 0.000 | 11.34 | 0.000 |
| WRI* | 7.00 | 0.000 | 940.10 | 0.000 | 1.80 | 0.126 |
| ASILD* | 1.00 | 0.441 | 2264.4 | 0.000 | 1.40 | 0.218 |
| Texture Additive | WRI | ASILD | ||||||
|---|---|---|---|---|---|---|---|---|
| Sand | Loam | Silty Loam | Clay | Sand | Loam | Silty Loam | Clay | |
| Control | * | 0.20 ± 0.14 ABCa | 0.11 ± 0.03 ABCa | 0.86 ± 0.06 ABCb | * | −1516.6 ± 1.4 Aa | −1543.1 ± 0.4 Aa | –990.8 ± 26.7 Ab |
| Straw | * | 0.10 ± 0.01 ABa | 0.16 ± 0.03 ABa | 0.86 ± 0.01 ABb | * | −1509.8 ± 1.1Aa | −1538.0 ± 3.0 Aa | –989.0 ± 12.5 Ab |
| Peat | * | 0.11 ± 0.02 Aa | 0.05 ± 0.02 Aa | 0.85 ± 0.01 Ab | * | −1518.4 ± 1.8 Aa | −1541.3 ± 1.2 Aa | –936.6 ± 66.2 Ab |
| Compost | * | 0.23 ± 0.04 BCa | 0.18 ± 0.01 BCa | 0.88 ± 0.01 BCa | * | −1528.1 ± 4.0 Aa | −1541.9 ± 0.9 Aa | –939.5 ± 45.6 Ab |
| Compostmicro | * | 0.27 ± 0.10 Ca | 0.20 ± 0.01 Ca | 0.89 ± 0.01 Cb | * | −1525.9 ± 3.0 Aa | −1537.7 ± 5.9 Aa | –992.2 ± 54.8 Ab |
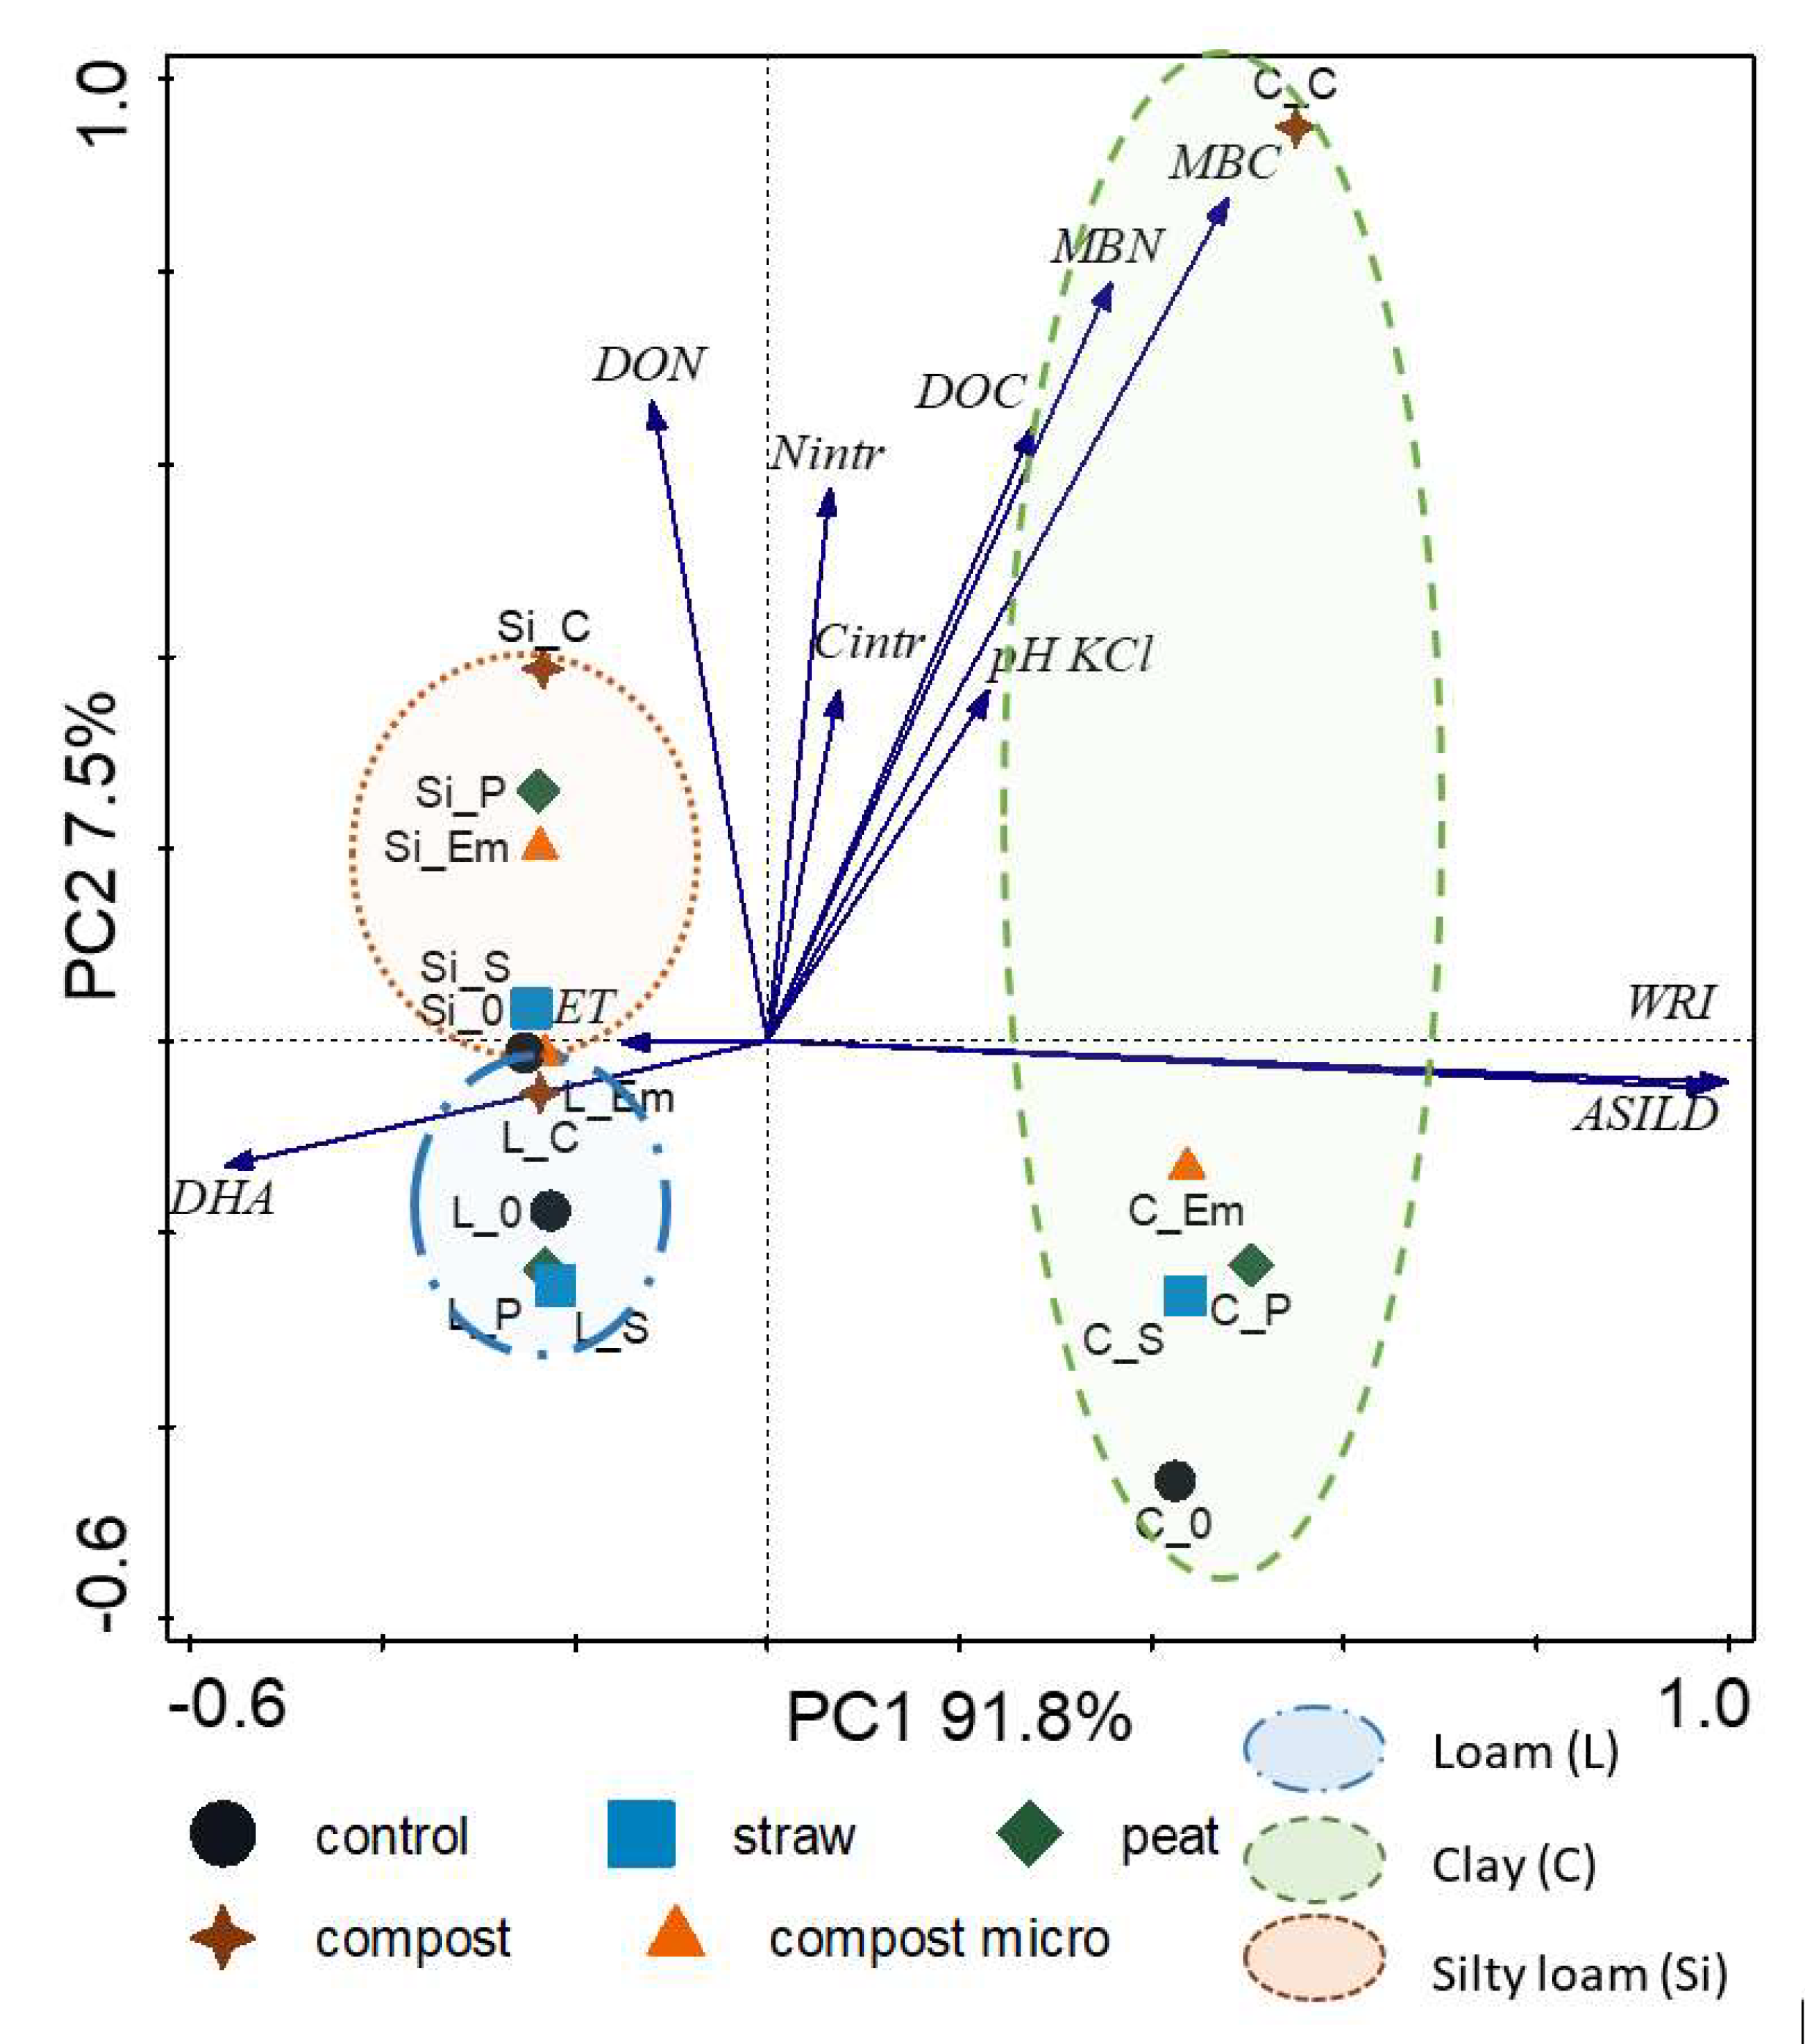
| Properties | Principal Components | |
|---|---|---|
| 1 | 2 | |
| Nintr | 0.066 | 0.574 |
| Cintr | 0.743 | 0.364 |
| pH KCl | 0.231 | 0.364 |
| DOC | 0.277 | 0.638 |
| DON | –0.120 | 0.664 |
| DHA | –0.562 | –0.130 |
| ET | –0.150 | –0.001 |
| MBC | 0.479 | 0.877 |
| MBN | 0.358 | 0.789 |
| ASILD | 0.999 | –0.043 |
| WRI | 0.984 | –0.048 |
Publisher’s Note: MDPI stays neutral with regard to jurisdictional claims in published maps and institutional affiliations. |
© 2021 by the authors. Licensee MDPI, Basel, Switzerland. This article is an open access article distributed under the terms and conditions of the Creative Commons Attribution (CC BY) license (http://creativecommons.org/licenses/by/4.0/).
Share and Cite
Józefowska, A.; Woźnica, K.; Sokołowska, J.; Sochan, A.; Zaleski, T.; Ryżak, M.; Bieganowski, A. Stability of Aggregates Made by Earthworms in Soils with Organic Additives. Agronomy 2021, 11, 421. https://doi.org/10.3390/agronomy11030421
Józefowska A, Woźnica K, Sokołowska J, Sochan A, Zaleski T, Ryżak M, Bieganowski A. Stability of Aggregates Made by Earthworms in Soils with Organic Additives. Agronomy. 2021; 11(3):421. https://doi.org/10.3390/agronomy11030421
Chicago/Turabian StyleJózefowska, Agnieszka, Karolina Woźnica, Justyna Sokołowska, Agata Sochan, Tomasz Zaleski, Magdalena Ryżak, and Andrzej Bieganowski. 2021. "Stability of Aggregates Made by Earthworms in Soils with Organic Additives" Agronomy 11, no. 3: 421. https://doi.org/10.3390/agronomy11030421
APA StyleJózefowska, A., Woźnica, K., Sokołowska, J., Sochan, A., Zaleski, T., Ryżak, M., & Bieganowski, A. (2021). Stability of Aggregates Made by Earthworms in Soils with Organic Additives. Agronomy, 11(3), 421. https://doi.org/10.3390/agronomy11030421