Article

Conversion and Validation of Uniplex SNP Markers for Selection of Resistance to Cassava Mosaic Disease in Cassava Breeding Programs

by
Adenike D. Ige
1,2,
Bunmi Olasanmi
3,
Edwige Gaby Nkouaya Mbanjo
1,
Ismail S. Kayondo
1,
Elizabeth Y. Parkes
1,
Peter Kulakow
1,
Chiedozie Egesi
1,
Guillaume J. Bauchet
4,
Enghwa Ng
5,
Luis Augusto Becerra Lopez-Lavalle
6,
Hernan Ceballos
6 and
Ismail Y. Rabbi
1,*
1
International Institute of Tropical Agriculture (IITA), Ibadan 200001, Nigeria
2
Pan African University Life and Earth Sciences Institute (Including Health and Agriculture), University of Ibadan, Ibadan 200284, Nigeria
3
Department of Agronomy, University of Ibadan, Ibadan 200001, Nigeria
4
Boyce Thompson Institute, Cornell University, Ithaca, NY 14850, USA
5
Excellence in Breeding Platform, International Maize and Wheat Improvement Center (CIMMYT), 56237 El Batan, Mexico
6
Recta Cali-Palmira Cali, The Alliance of Bioversity International and the International Center for Tropical Agriculture (CIAT), 763537 Cali, Colombia
*
Author to whom correspondence should be addressed.
Agronomy 2021, 11(3), 420; https://doi.org/10.3390/agronomy11030420
Submission received: 6 January 2021 / Revised: 17 February 2021 / Accepted: 19 February 2021 / Published: 25 February 2021
(This article belongs to the Special Issue Translational Research in Plant Breeding)

Abstract

:
Cassava mosaic disease (CMD) is a major viral disease adversely affecting cassava production in Africa and Asia. Genomic regions conferring resistance to the disease have been mapped in African cassava germplasm through biparental quantitative trait loci (QTL) mapping and genome-wide association studies. To facilitate the utilization of these markers in breeding pipelines to support selections, proof-of-concept technical and biological validation research was carried out using independent pre-breeding and breeding populations. Kompetitive Allele-Specific Polymerase Chain Reaction (KASP) assays were designed from three single nucleotide polymorphism (SNP) markers linked to a major resistance locus on chromosome 12 (S12_7926132, S12_7926163) and a minor locus on chromosome 14 (S14_4626854). The designed assays were robust and easy to score with >99% genotype call rate. The overall predictive accuracy (proportion of true positives and true negatives) of the markers (S12_7926132 and S14_4626854) was 0.80 and 0.78 in the pre-breeding and breeding population, respectively. On average, genotypes that carried at least one copy of the resistant allele at the major CMD2 locus had a significantly higher yield advantage. Nevertheless, variation was observed in prediction accuracies for the major locus (S12_7926132) among sub-families from the two populations, suggesting the need for context-specific utilization, for example, by screening for co-segregation of favorable SNP alleles with resistance in the parents being used for crosses. Availability of these validated SNP markers on the uniplex KASP genotyping platform represents an important step in translational genetics toward marker-assisted selection to accelerate introgression of favorable resistant alleles in breeding populations.

1. Introduction

Cassava (Manihot esculenta Crantz) is a vegetatively propagated staple crop of great economic importance. More than 800 million people derive the bulk of their dietary energy requirements from cassava every day, and over 500 million of them live in sub-Saharan Africa [1]. Total cassava production in Africa accounts for more than half of the world’s production [2]. Due to its inherent tolerance to drought and inadequate soil nutrients, cassava produces some storage roots where other food crops would fail; hence, it is considered a food security crop [3,4]. It is cultivated mainly by resource-limited farmers for its starchy roots which are used as human food, either fresh when low in cyanide or processed into products such as flour, dehydrated chips, starch, and animal feed [5].
Cassava production is affected by several biotic constraints, including cassava mosaic disease (CMD) and cassava brown streak disease (CBSD), two of the most devastating viral diseases affecting production in Africa [6,7]. Cassava mosaic disease occurs throughout Africa, India, Sri-Lanka, and Indian Ocean islands [8,9]. The disease has recently spread to major cassava-producing countries in southeast Asia, including Vietnam and Cambodia [10,11], and China [12]. In Africa, the disease causes yield losses ranging from 12 to 82% depending on infection type and cassava variety [13]. These translate into an annual reduction of more than 30 million tons of fresh root yield [14].
Typical symptoms of CMD are leaf mosaic patterns, chlorosis, distortion, reduction in leaflet size, and general stunting [7,15]. The disease is caused by 11 species of cassava mosaic geminiviruses [16], which are transmitted either through infected cuttings or the vector, common whitefly (Bemisia tabaci G.). Of all the integrated management strategies for the control of CMD or its vector, host plant resistance has proven to be the most efficient and environment-friendly approach [17]. Resistance to CMD falls into two broad categories: quantitative resistance derived from historical hybridization between cultivated cassava and Manihot glaziovii and qualitative resistance conferred by major resistance gene(s) [18]. Genetic studies revealed that the polygenic resistance from M. glaziovii is recessive with a heritability of about 60% [19,20]. Qualitative resistance, which is conditioned by a major locus with a dominant effect, was discovered in the 1980s in landraces from Nigeria and other West African countries [17,21].
Several genetic mapping efforts have been conducted to discover quantitative trait loci (QTL) linked to CMD resistance in the African cassava germplasm in the last decades. The first study found two markers: a microsatellite (SSRY28) and a Restriction Fragment Length Polymorphism RFLP (GY1) that flank a single locus named CMD2 at distances of 9 and 8 cM, respectively [17]. Subsequently, several additional QTLs were discovered in landraces and improved varieties from Nigeria [22,23]. However, many of these markers were shown to be co-located with the CMD2 locus from the use of a high-density genetic linkage map developed from genome-wide SNP markers [18]. Recent Genome-Wide Association Studies (GWAS) in large and diverse germplasm panels confirmed previous findings. Wolfe et al. [24] carried out marker-trait association analysis in a set of 6000 accessions genotyped across 42,113 SNP markers and found a single chromosomal region that coincided with the CMD2 locus. The locus accounted for up to 66% of genetic resistance in the phenotypic variation in African cassava germplasm. More recently, Rabbi et al. [25] confirmed the same locus on chromosome 12 and reported two additional minor loci on chromosome 14.
Despite their availability, markers linked to CMD resistance have been under-used in the breeding pipeline [26]. The slow uptake is caused by a failure to translate genomic knowledge into tools that are directly useful for breeding to support selection decisions [27]. Marker-assisted selection (MAS) is expected to increase breeding efficiency, particularly for traits that are controlled by a few QTLs with large effects [28], such as qualitative resistance to CMD. Indeed, many traits of importance in cassava breeding are either monogenic or oligogenic [25]. However, the discovery of major QTLs is just the first step toward their use in MAS.
Before deployment for routine use, trait-linked markers’ predictive ability requires technical and biological validation in independent populations [29]. Technical validation assesses the robustness of the marker assay with respect to genotyping call rate and clarity of genotype classes; biological validation assesses the marker’s accuracy in predicting the phenotype. The latter depends on the degree of linkage disequilibrium between the marker and the functional allele at the underlying trait locus [27] and a consistent allelic effect in different genetic backgrounds.
Cassava breeding is a slow and costly process due to its annual growth cycle and low multiplication rate, thereby hindering field phenotyping [30]. MAS has been proposed to overcome some of these challenges through the following: (i) quick elimination of genotypes with unfavorable alleles at the early stage of the selection scheme, thus reducing the number of genotypes requiring field-testing for more complex traits; (ii) selection of genotypes carrying resistant alleles in the absence of the pathogens or vectors; (iii) rapid introgression of resistant genes into existing cassava clones, in places where the disease has recently spread to, for example in Southeast Asian countries [31]; (iv) early selection of traits that are measured at the later developmental stage of the crop; and (v) identification of genotypes that are homozygous or heterozygous for the favorable alleles. Despite the promise from MAS, its use in breeding has been limited, partly due to the delay in marker conversion and validation [32]. The objective of the present study was first, to convert the CMD-resistance-linked SNPs to uniplex allele-specific PCR assays and secondly, to validate trait predictions using newly generated seedlings derived from breeding and prebreeding populations.

2. Materials and Methods

2.1. Background to Marker Discovery

The markers validated in the present study were derived from Rabbi et al. [25]. In brief, a genome-wide association study (GWAS) was carried out using a population of 5160 cassava clones from the International Institute of Tropical Agriculture (IITA) breeding program. The population was genotyped using genotyping-by-sequencing (GBS) at 100,000 SNPs and phenotyped for several traits, including CMD resistance from 2013 to 2016. The GWAS analysis uncovered a major locus for CMD resistance on chromosome 12 and two minor peaks on chromosome 14. The major peak on chromosome 12, which co-locates with the CMD2 locus is tagged by markers S12_7926132 and S12_7926163. The two SNPs on chromosome 12 are completely linked (linkage disequilibrium, r2 > 0.98) due to their close physical proximity (31 bp apart). Marker S14_4626854 tags one of the minor peaks on chromosome 14. The significant trait-marker associations from the mixed linear model and genomic region combinations extracted from Rabbi et al. [25] are provided in Table 1.

2.2. Development of Allele-Specific PCR Markers Linked to CMD Resistance

To facilitate MAS for CMD resistance, the markers from GWAS were converted to uniplex allele-specific PCR assays. These are more suitable for a MAS that requires a large number of accessions to be genotyped using one or few markers. One hundred base-pairs sequences flanking the top SNP markers were extracted from the cassava reference genome (v6.1) (Table 2). To ensure locus specificity of the PCR assays, a nucleotide–nucleotide BLAST (basic local alignment search tool) search against the genome was done [33]. The sequences uniquely matched their target regions except for SNP S12_7926163, which had an additional but shorter hit on the same chromosome (E-Value 4.00 × 10⁻⁶, bit score = 54.7) (Supplementary Table S1). The Kompetitive allele-specific PCR (KASP) primers were designed using a proprietary Kraken™ software system from LGC Biosearch Technologies (Hoddesdon, UK) with the default parameters. The technical performance of the designed SNP assays, including call rate, genotype scoring clarity, and performance under varying DNA concentrations, was assessed using a panel of 188 diverse cassava genotypes.

2.3. Predictive Performance of Markers

2.3.1. Study Populations

The performance of the KASP assays was assessed using breeding and prebreeding populations evaluated in the early stages of selections, seedling nursery (SN), and first clonal evaluation trials (CET) [30]. These populations are independent of the population used for the GWAS discovery of the markers used in this study.
The breeding population was part of IITA’s regular recurrent selection breeding pipeline and had been derived from controlled crosses among elite genotypes in 2018. The SN trial consisting of 3531 progenies from 74 families (mean family size of 48, ranging from 5 to 243) was established in January 2019 in Ibadan, Nigeria. A CMD-susceptible clone (TMEB117) was planted as a spreader row around and among the seedlings to ensure sufficient exposure to cassava mosaic virus (CMV). The SN trial was planted at a spacing of 1 m × 0.25 m and harvested 10 months after planting (MAP); a selection of 350 genotypes (around 10% of the total) was advanced to CET at the same location. The selection was based on plant vigor and root yield. Susceptibility to CMD in the SN was not used as a selection criterion to retain variation for the trait at the CET stage. The CET, carried out between November 2019 and September 2020, was established using an incomplete block design with a spacing of 1 m between rows and 0.5 m within rows. Seven checks (TMEB419, TMEB693, IITA-TMS-30572, IITA-TMS-1KN130010, IITA-TMS-IBA000070, TMS14F1285P0006, and TMS13F2207P0001) were planted in each of the 10 sub-blocks, making a total of 420 plots.
The prebreeding population was derived from open-pollinated crosses between exotic and African cassava germplasm. The exotic progenitors were from International Center for Tropical Agriculture (CIAT), and the African germplasm was from IITA. The objective of these crosses was to develop germplasm incorporating resistance to CMD, high content of provitamin A and starch, and tolerance to acid soils and drought. An SN trial of 5608 genotypes from 353 full and half-sib families was established in February 2018 in Ibadan, Nigeria at a spacing of 1 m × 0.25 m. The mean family size was 16, ranging from 1 clone to 165 clones. Variety TMEB117 was also planted as CMD spreader rows in the trial. After harvest at 10 MAP, a subset of the seedlings consisting of 790 accessions based only on vigor was selected to ensure variation for CMD severity. The selected genotypes were advanced to a CET and established in Ikenne, Nigeria using an incomplete block design (18 sub-blocks with 50 plots each) along with four checks (TMEB419, IITA-TMS-IBA30572, IITA-TMS-IBA070593, and IITA-TMS-IBA000070). The trial was planted in 2018 and harvested in 2019. The two locations—Ibadan (7°24′ N, 3°54′ E; 200 m above sea level) and Ikenne (6°52′ N 3°42′ E; 61 m above sea level)—were selected for the trials because of the high pressure from CMV. All field management practices were performed according to technical recommendations and standard agricultural practices for cassava [34,35].

2.3.2. Phenotyping

The SN is the first stage of phenotyping progenies newly generated from crosses. Seeds are usually pregerminated in pre-nurseries before being transplanted to the field. This is the early stage where plants are exposed to prevailing pests and diseases for the first time in their 10 to 12 months of growth. The peaks of incidence and severity of the disease usually occur at around 3 to 6 MAP during the rainy season. Due to the stochasticity of CMV vector (white-fly) in foraging and the related transfer of CMV, plants can escape infection at the seedling stage. In addition, plants that have been infected late in the season would fail to show symptoms. Most of the susceptible plants that may have escaped CMD infection or failed to express symptoms at the SN stage generally show disease symptoms at CET.
Severity scores for CMD were recorded from 1 to 6 MAP at a month’s intervals at the SN of the prebreeding population and at 3 MAP for the breeding population. In addition, at the CETs of the two populations, the genotypes were scored for CMD severity on a plot-basis at 1, 3, and 6 MAP on a scale from 1 (no symptoms) to 5 (severe symptoms). The score was based on the maximum severity observed for the plot. At harvest, the genotypes were evaluated on a plot-basis for yield and yield component traits that included the number of marketable storage roots, fresh root weight, and shoot weight in kilogram.

2.3.3. Genotyping

Leaf samples were collected from vigorously growing plants at the seedling stage in both breeding and prebreeding seedling trials. From each plant, three-leaf discs of 6 mm diameter were freeze-dried for at least 72 h and genotyped with three markers (S12_7926163, S12_7926163, and S14_4626854) linked to CMD resistance (Table 2) using KASP assay at Intertek Laboratory, Australia. Two nontemplate controls (NTC) were included in each plate. The protocols for the preparation and running of KASP reactions are provided in the KASP manual [36]. In brief, genotyping was carried out using the high-throughput PCR SNPline workflow using 1 μL reaction volume in 1536-well PCR plates. The KASP genotyping reaction mix comprises three components: (i) sample DNA (10 ng); (ii) marker assay mix consisting of target-specific primers; and (iii) KASP-TFTM Master Mix containing two universal FRET (fluorescence resonant energy transfer) cassettes (FAM and HEX), passive reference dye (ROX™), Taq polymerase, free nucleotides, and MgCl2 in an optimized buffer solution. The SNP assay mix is specific to each marker and consists of two Kompetitive allele-specific forward primers and one common reverse primer. After PCR, the plates are fluorescently read, and allele calls are made using KRAKENTM software.

2.4. Data Analysis

2.4.1. Phenotypic Data Analysis

A linear mixed model was used to obtain the best linear unbiased predictions (BLUPs) for each genotype in the CETs of prebreeding and breeding populations. The model was fitted using the lme4 package [37] in R software version 4.0.3 [38]. Checks were considered as fixed effects while accessions, and blocks were considered as random effects. The mathematical model for the incomplete block design by Kling [39] is as follows:
Y ij = μ + β + c j + τ k ( i ) + ε ij
where Yij is the vector of phenotype data, μ is the grand mean, β is the block effect, cj is the check effect, τk(i) is the accession effect, and εij is the residual term.
Broad-sense heritability for CMD severity score at 3 months, root number, and root weight for the two populations was calculated using the formula below:
H 2 =   σ g 2 / ( σ g 2 + σ e 2 )
where H2 is the broad-sense heritability, σ2g is the variance component for the genotype effect and σ2e is the variance component for the residual error.
Pairwise correlation analysis of the traits was determined using the corr.test function in the psych R package [38] to assess the relationship between CMD severity scores at various time intervals in the SN and CET as well as between CMD severity scores and yield-related traits. BLUP estimates were used for the CMD severity score and yield-related traits in the CETs.

2.4.2. Marker Prediction Analysis Using Logistic Regression

The major CMD resistance locus on chromosome 12 is known to confer a dominant type of resistance [17,18]. Clones carrying at least one copy of the favorable allele (“T”) at SNP S12_7926132 are expected to be resistant (score 1 on the disease severity rating scale). To assess the marker’s performance marker in predicting resistance or susceptibility, the phenotype was converted into a binary variable (either affected or unaffected). Individuals with a categorical CMD severity score greater than 1 were classified as affected; all others were classified as unaffected. Prediction analysis was carried out using binary logistic regression as implemented in the R package tidymodels [40]. The data were divided into a training set and a testing set at a ratio of 3:1 based on the binary variable. For the training set, bootstrapping was carried out to create resamples for model validation. The markers and families were considered as independent variables. The mathematical model is as follows:
log   [ p i 1 p i ] = α + f i + β 1 x 1 , i +   β 2 x 2 , i + +   β n x n , i  
where pi is the probability that a genotype is resistant or susceptible, n is the number of CMD-resistant markers integrated into the model, α is the intercept constant, fi is the family effect, β1, β2 … βn are the coefficients for the markers 1, 2, … n, and x1,i, x2,i … xn,i is the value for the markers 1, 2, … n for genotypes i.
Area under the curve (AUC) values of the receiver operator characteristic (ROC) curve were used as a single measure that summarizes the discriminative ability of the markers. The ROC plots sensitivity (true positive rate) against 1–specificity (false positive rate) and was constructed using the predictive probability as a covariate.

2.4.3. Within-Family Prediction Analysis

To understand the performance of the CMD2-linked SNP (S12_7926132) in different genetic backgrounds, a within-family prediction analysis was conducted using linear regression for the SN stage data that considered only families with more than 20 genotypes. The linear regression was then performed using the lm function in R. Marker alleles (TT, TG, and GG) of S12_7926132, and the observed CMD severity scores were respectively considered as independent and response variables.

2.4.4. Estimation of Biological Metrics

Using a confusion matrix, several performance statistics were estimated to determine the ability of the markers to predict the response of genotypes to CMD (resistance or susceptibility). These included accuracy (ACC, the proportion of correctly predicted genotypes, as either resistant or susceptible); false-positive rate (FPR, the proportion of genotypes diseased although predicted to be resistant); and false-negative rate (FNR, the proportion of genotypes resistant although predicted to be susceptible); and these statistics were calculated using the formula below:
Accuracy ,   ACC = TP + TN TP + FN + FP + TN
False   positive   rate ,   FPR = FP FP + TN
False   negative   rate ,   FNR = FN FN + TP
where FP = false positive, TN = true negative, FN = false negative, TP = true positive.

3. Results

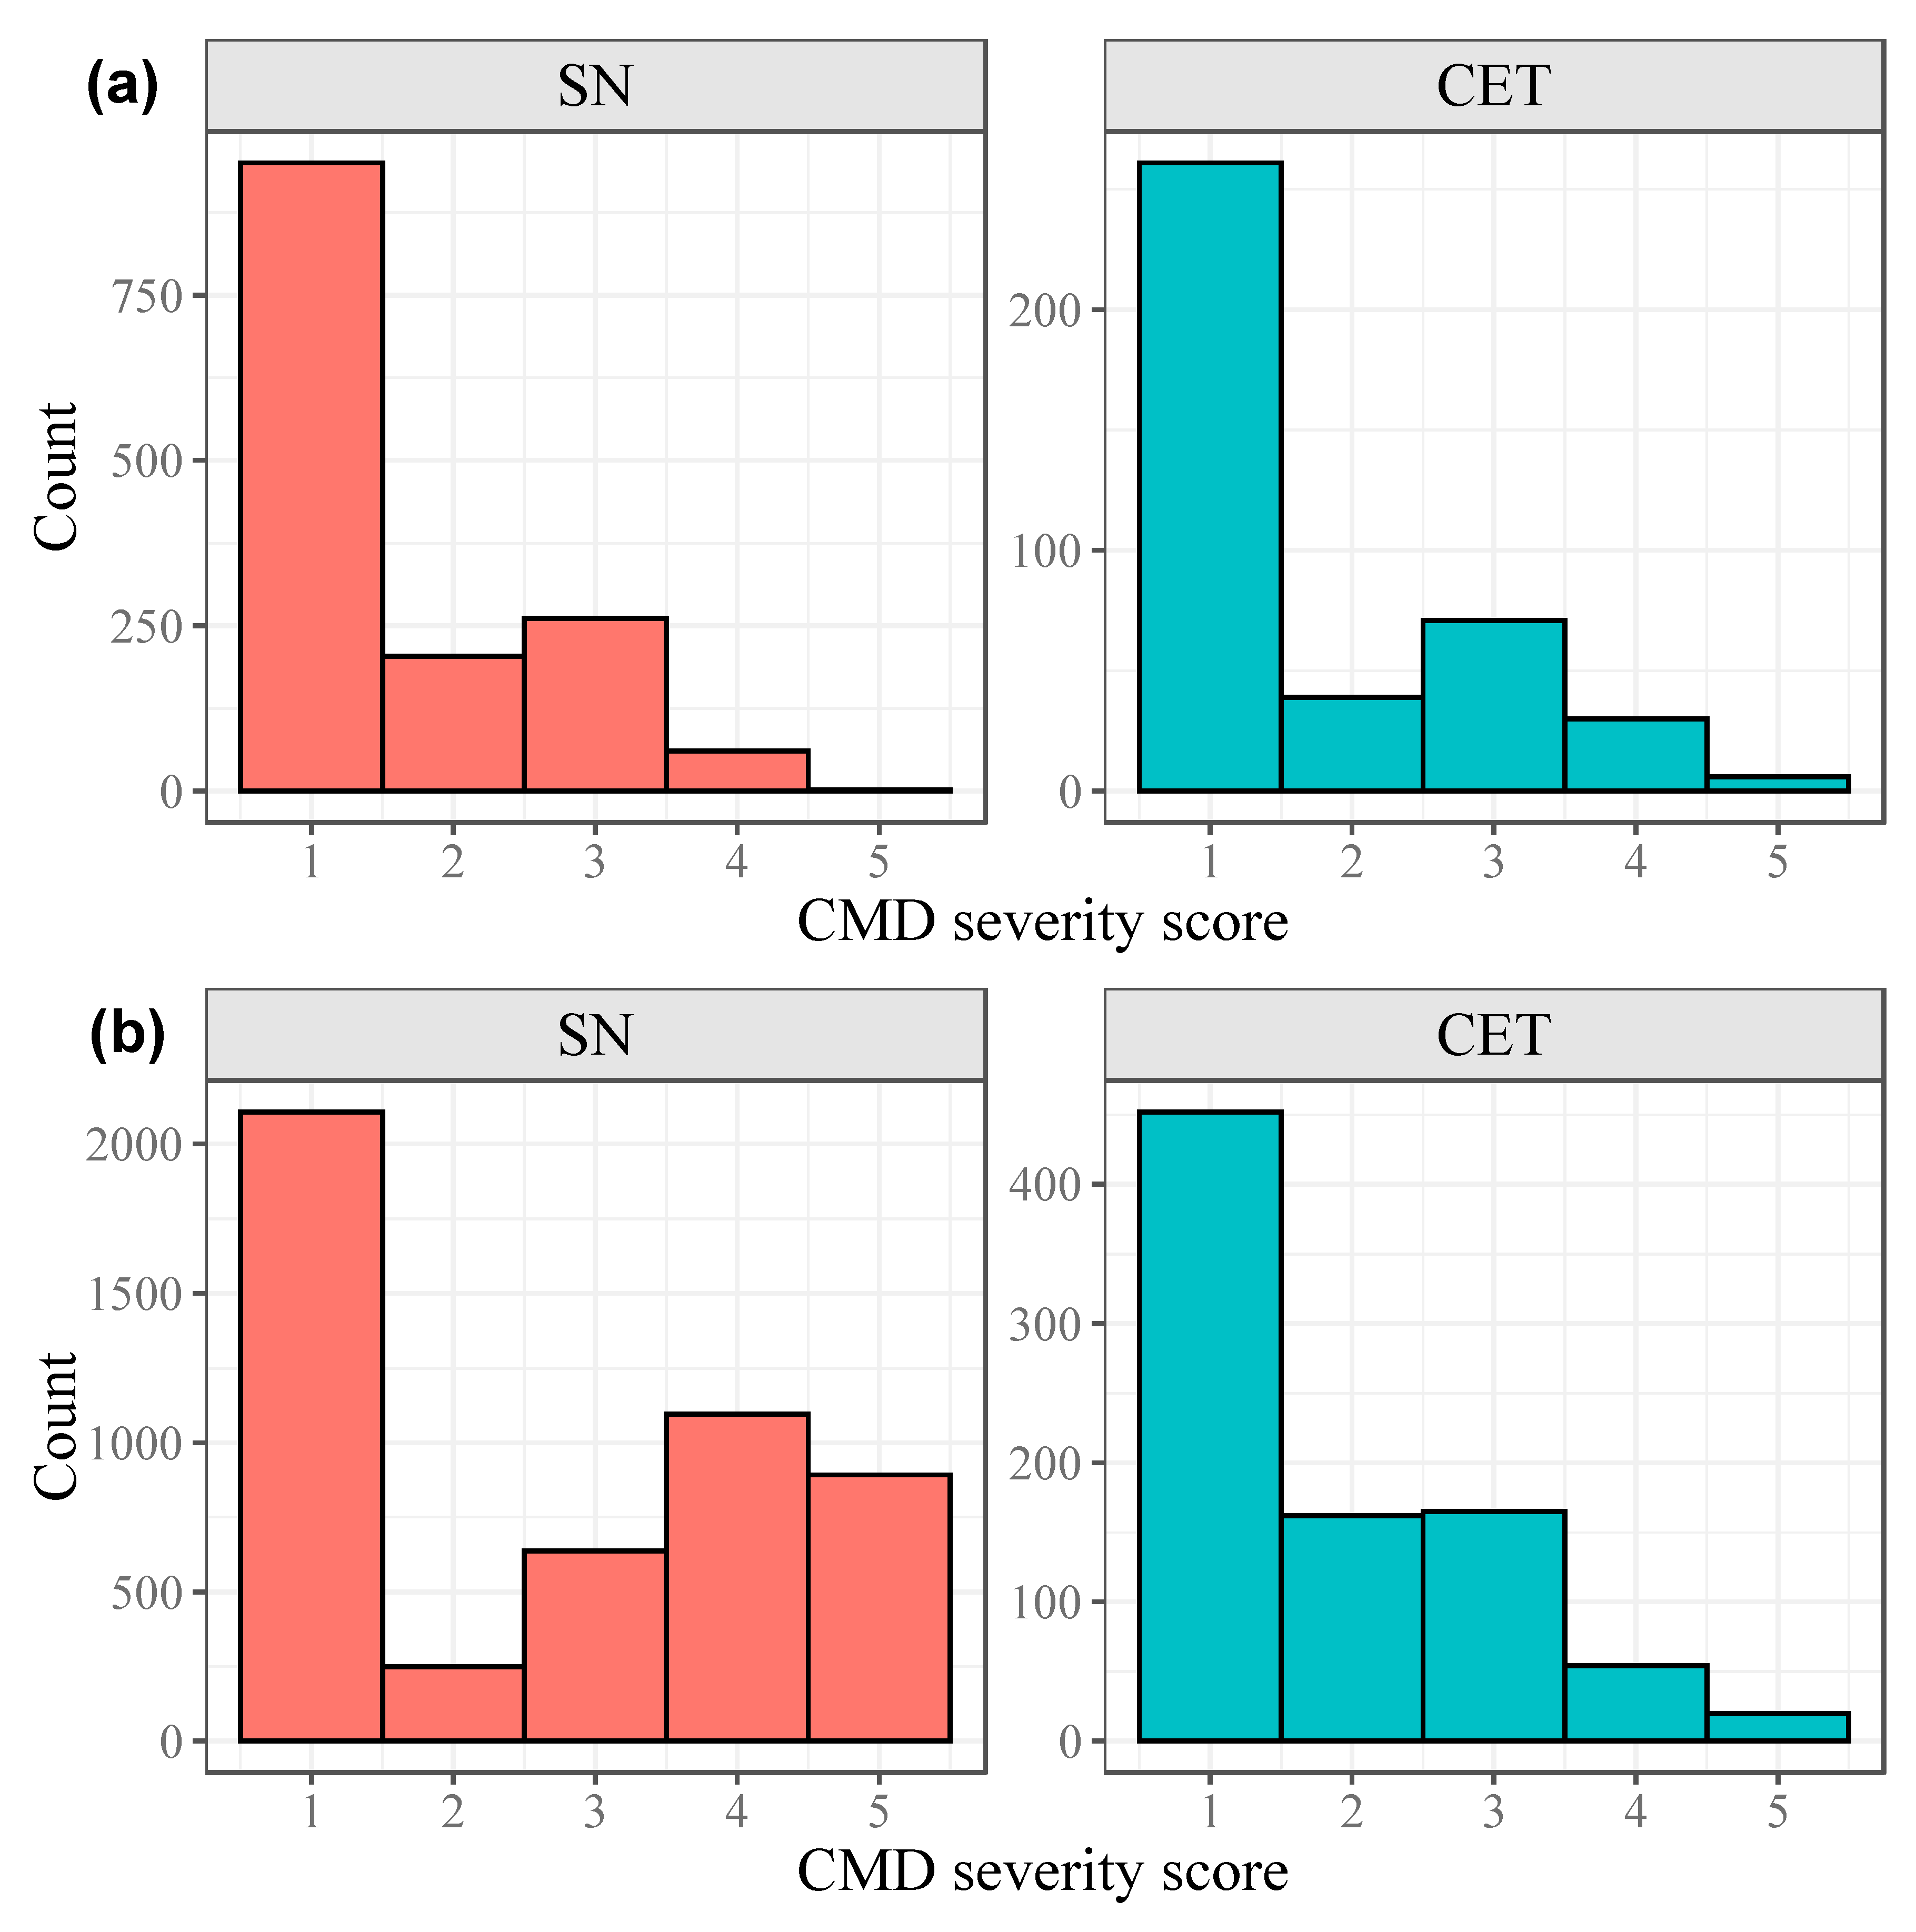
3.1. Phenotypic Variation for Resistance to CMD

The frequency distribution of CMD severity scores in the two populations revealed, as expected, a bimodal pattern with two peaks consisting of no symptoms and varying degrees of symptoms (Figure 1). In the breeding population, more than 65% of the genotypes evaluated at SN and CET showed resistance to CMD (Supplementary Figure S1); this expression may be linked to their progenitors. In the CET of the same population, the number of genotypes (77%) that showed resistance at 6 MAP increased, compared to the number observed at 1 MAP (65%) and 3 MAP (72%), indicating that some genotypes recovered from CMV infection (Supplementary Figure S1). In the prebreeding population, most of the genotypes evaluated at the SN stage started with no symptoms of CMD (severity score 1), but as their exposure to CMV increased over time through whitefly vectors, other classes of CMD severity scores (2–5) also increased (Supplementary Figure S2). Most of the susceptible plants showed symptoms at 6 MAP. The disease progression between the seedlings derived from Africa and those with Latin American progenitors was compared (Supplementary Figure S3). The impact terms of incidence and severity on the half-sibs from Latin-American progenitors were much higher than on those from African progenitors.
Broad-sense heritability of root number, root weight, and CMD severity score in the CET trials were 0.21, 0.33, and 0.90, respectively, in the breeding population, and 0.44. 0.46, and 0.84, respectively, in the prebreeding population (Table 3).
The CMD severity scores recorded at SN and CET were positively correlated in both breeding and prebreeding populations (Pearson’s r > 0.5, Table 4). A significant positive correlation was also observed between CMD severity at 1 and 3 MAP for the CETs of the two populations. A significant negative relationship was observed between disease severity and root number as well as with root weight in the CETs. However, the magnitude of the correlation coefficient was higher in the prebreeding population.

3.2. Performance of Markers Linked to CMD Resistance

3.2.1. Favorable Allele and Genotype Frequencies

The resistance-linked SNP markers in Table 2 were successfully converted to allele-specific PCR assays. These markers were shown to have a high call rate and scoring clarity at both the technical validation stage (data not shown) and in the genotyping of samples from the present study (Supplementary Figure S4). For each marker, we observed three distinct clusters: favorable homozygous genotypes, unfavorable homozygous genotypes, and heterozygotes. Due to the close physical proximity between the two SNPs on chromosome 12, and the resulting strong linkage disequilibrium (r2 > 0.98), only the marker S12_7926132 was used for the downstream analysis. This SNP marker is close to a peroxidase gene (PEX22), the hypothesized resistant gene at the CMD2 locus [25].
The frequencies of the favorable alleles S12_7926132 (T) and S14_4626854 (A) were higher in the breeding population than the pre-breeding population at the SN stage (Figure 2). For marker S12_7926132, 9.9% and 5.8% had genotype TT, 56.7% and 40.4% had genotype TG, and 32.6% and 53.4% had genotype GG. For marker S14_4626854, 14.8% and 1.1% had genotype AA, 31.1% and 23.7% had genotype AG, 53.6% and 74.9% had genotype GG in the SN of the breeding and prebreeding population, respectively (Supplementary Table S2). We also observed an increase in frequency from SN to CET for both populations (Figure 2).

3.2.2. Marker Effects on CMD Resistance

Marked differences were observed in the allele substitution effects of the resistance-linked markers on the degree of resistance and susceptibility, particularly at the CMD2 locus on chromosome 12 (Figure 3). Accessions with genotypes TT and TG had low CMD severity scores in the breeding and prebreeding populations at SN and CET stages. The median value of the accessions with at least one copy of resistance allele (TT or TG) in the SN trials suggests the dominant mode of action of the CMD2 locus. Nevertheless, between 19 and 34% of genotypes carrying the resistant allele in the SN of the breeding and pre-breeding populations showed CMD symptoms, indicating that the favorable SNP allele may not be linked to the functional resistance allele. In the prebreeding population, the effect of the marker on chromosome 14 revealed that genotype GG was associated with susceptibility while genotypes AG and AA accounted for resistance. However, there was no difference between genotypes carrying the resistant and susceptible alleles in the CET of the breeding population.

3.2.3. Effect of Resistance-Linked Alleles on Yield Traits

The negative relationship observed between CMD severity and yield-related traits (root weight and root number) led to the use of a pairwise t-test to compare the different genotypic classes at the chromosome 12 marker. The average root yield of clones with genotype TT (1.46 ± 0.85) and TG (1.46 ± 0.82) was significantly higher than in those with two copies of the susceptible allele GG (1.00 ± 0.67) for marker S12_7926132 in the CET of the breeding population (Figure 4). Similarly, clones carrying one or two copies of the resistance allele had an average higher root yield in the prebreeding population than those homozygous for the non-resistance allele (TT, 2.39 ± 1.68; TG, 2.90 ± 2.10; and GG, 1.88 ± 1.70). On the other hand, clones with one copy of the resistant allele linked to S14_4626854 had an average higher root yield than the homozygotes in the pre-breeding population. There were no marked differences between genotypic classes of the same marker for root weight per plant in the breeding population (Figure 4).

3.2.4. Population-Level Marker Performance

To assess the performance of markers at the population level, we carried out binary logistic regression. Mean prediction accuracy from the training set bootstraps was 76% in the prebreeding population and 80% in the breeding population (Table 5). The model’s AUC values were 0.80 for the training set of the breeding population and 0.82 for the prebreeding population. The mean prediction accuracy and AUC values were approximately similar in the testing set for both populations. Sensitivities and false-positive rates (1 minus specificities) of the marker predictions and observed CMD scores in the two populations are shown in ROC curves (Supplementary Figure S5).
Overall, the markers in the breeding population performed better in predicting resistance (84% accuracy) than susceptibility (67% accuracy) (Table 6). In the prebreeding population, 71% resistance and 85% susceptibility were predicted.

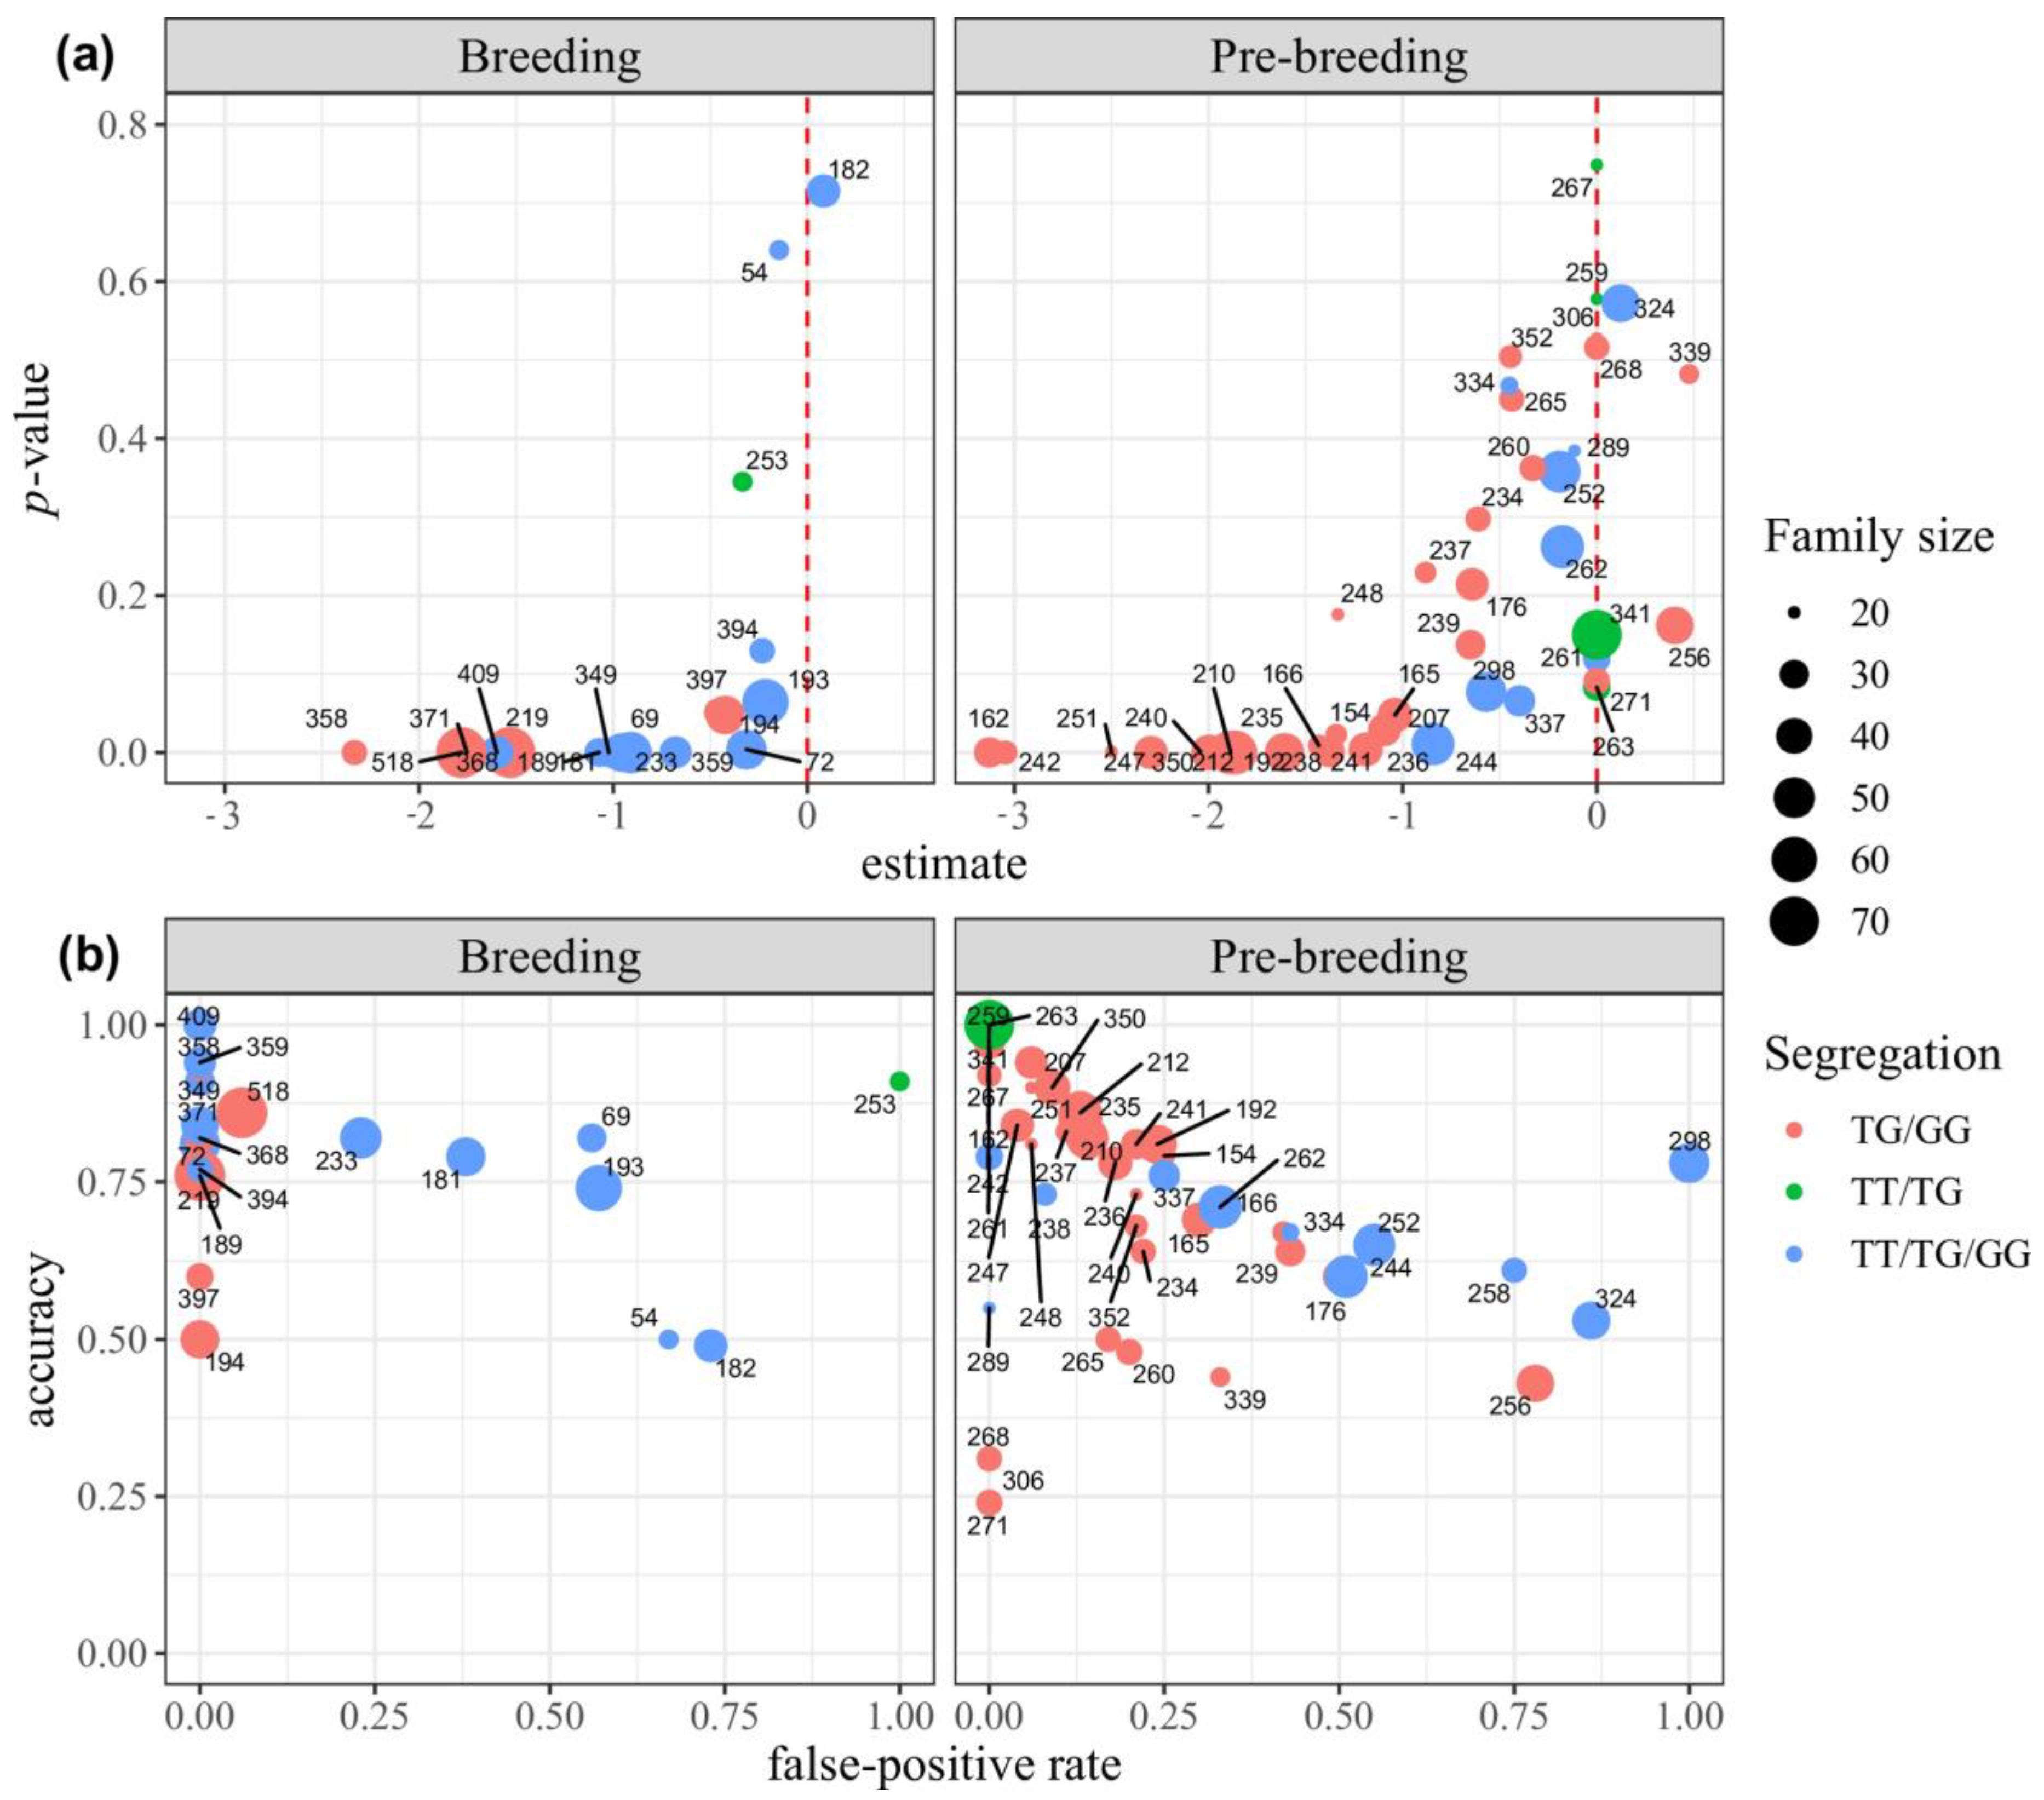
3.2.5. Performance Metrics of Marker S12_7926132 within the Families

In addition to the population-wide metrics, we also assessed marker performance at the family level. For this analysis, we considered only the major locus on chromosome 12 and the SN data. Within-family marker-trait regression was significant in the majority of families from the breeding population (70%) relative to the prebreeding population (40%) (Figure 5a). The effect size of the resistant allele varied among families. Similarly, within-family prediction accuracy, as well as false-positive statistics were relatively superior for the breeding population (accuracy greater than 0.75 and false-positive rate below 0.20) than in the prebreeding population (Figure 5b). The families with the lowest accuracies and high false-positive rates in the breeding population share common male parents. For the prebreeding population, not all families with low accuracies reveal common underlying relationships. Although the progenitors of these families carried a copy of the favorable SNP allele, this allele did not co-segregate with the resistant phenotype, particularly for families derived from Latin-American progenitors. This suggests that the SNP marker may pre-date the emergence of the causal resistant gene found in the Africa cassava germplasm. The lower accuracy in the prebreeding population could also be explained by the half-sib family structure resulting from random pollination. Each half-sib family is derived from different male parents, each of which may or may not be carrying the functional resistance gene at the linked SNP marker.

4. Discussion

Next-generation sequencing (NGS) has emerged as a powerful tool to detect DNA-sequence polymorphism-based markers and is becoming an important tool for next-generation plant breeding [41]. The availability of NGS technologies and high-throughput genotyping platforms has enabled the construction of high-density genetic linkage maps [42] and the identification of SNPs associated with CMD resistance [24], quality traits such as provitamin and dry matter contents [43,44], several agronomic traits [45], stress-related, quality, and agro-morphological traits [25] in cassava. Despite the discovery of numerous QTLs linked to key traits, the evidence for the usefulness of the markers tagging these loci in cassava breeding evaluation program is scarce.
The use of trait-linked SNP markers in MAS allows breeders to preselect genotypes that combine desired traits for subsequent field evaluation and to screen segregating populations rapidly, thereby reducing the size of phenotyping trials with associated cost reductions. Markers linked to CMD resistance can be useful for preemptive breeding or the rapid transfer of resistant alleles into elite and adapted genetic backgrounds where new disease outbreaks have been reported. In this study, uniplex SNP markers associated with CMD resistance were developed and validated in two independent cassava populations. In comparison to a fixed SNP array, the uniplex PCR assay offers greater cost-effectiveness and flexibility in terms of genotyping different combinations of sample numbers and markers [46,47,48,49,50]. The overall performance of the KASP assay was outstanding from the robustness and ease of scoring of the marker genotype classes.
Technical and biological validation is essential to assess the reliability and accuracy of markers linked to the trait of interest as well as to establish their utility for practical applications in plant breeding [51,52,53]. To ensure a reliable and unbiased estimate of marker performance, validation was carried out using two independent populations. The first was a breeding population from IITA’s regular recurrent selection pipeline; the second was a prebreeding population consisting of progenies from the intercross between exotic progenitors from American and African varieties.
Area under the curve (AUC) is a useful statistic in measuring the accuracy of the markers fitted using a logistic regression model in predicting resistance or susceptibility to CMD. The AUC values range from 0 to 1, where a value of 0.5 indicates model accuracy no better than random and a value of 1.0 indicates a perfect model fit [54]. The value of AUC in the training and testing sets of the two populations was greater than 0.7, indicating that the markers had a good discriminatory ability. Similar prediction accuracies and AUC values of the testing and training sets across the populations indicated stability in the model to predict independent data and lack of overfitting. The performance of marker S12_7926132 in diverse families and different genetic backgrounds observed in the present study indicated that this marker can be deployed for marker-assisted selection in breeding programs targeting CMD resistance. However, it should be noted that the marker did not perform equally well in all families that segregated for the favorable SNP allele. For example, in the breeding population, families 54, 182, 193, 253, 394, and 397 had nonsignificant marker effects and low accuracy or high false-positive rates which could result from related parental clones. The ineffectiveness of the marker in these families could be due to recombination events between the favorable marker allele and the QTL; the presence of a functional resistant allele that arose in a haplotype that is already common in cultivated cassava germplasm; the presence of an inhibitor gene hindering the expression of CMD2 gene; or clones in the populations that might have a different source of favorable allele available for exploitation by breeding programs [51,55]. The moderate significance of marker S14_462684 in the two populations could be attributed to the moderate SNP effect, low frequency of the favorable allele, as well as the epistatic effect of the major locus [23,25].
Due to the dominant nature of resistance at CMD2 locus, the presence of one or two copies of these alleles in any genotype should confer resistance to CMD. In the study populations, a bimodal distribution was observed consisting of the resistant group (disease score 1) and the susceptible group (score 2 to 5). There was a normal distribution within the susceptible group with a few individuals showing scores of 2 or 5 and more showing scores of 3 and 4. The variation in the degree of susceptibility could be due to differences in viral loads within the plots, time since initial infection, presence of mixed infections from different CMV strains, or other genetic factors related to fitness and background immunity [56,57,58].
While CMD2-linked markers can be used to increase the frequency of the favorable allele in cassava breeding germplasm, breeders should be cautious of the possibility of driving the chromosome 12 region to fixation. This can reduce diversity around the CMD2 locus genomic region which may affect the genotype’s fitness particularly if the resistant haplotype is linked to unfavorable alleles at nearby genes [59,60]. Furthermore, planting varieties of cassava with exclusive dependency on a single dominant gene might lead to a breakdown in resistance [18,61]. This threat necessitates the pyramiding of additional sources of resistance including polygenic resistance that are known to be more durable [17,18,61]. Increasing the frequencies of favorable alleles at quantitative resistance can be achieved through genomic selection, which is better at handling highly polygenic traits [24].

5. Conclusions

The technical and biological performances of two KASP markers were assessed on major and minor loci linked to CMD resistance in two independent cassava populations. KASP marker (S12_7926132) linked to the CMD2 predicted the resistance or susceptibility of new seedlings with reasonable accuracy either at the population or family level. In addition, selection for the resistant allele linked to this locus would increase yield by an average of at least 27% over genotypes with the susceptible allele, thereby mitigating the economic impact of CMD. Following successful conversion and validation, the CMD resistance-linked marker (S12_7926132) can be integrated into the breeders’ MAS toolbox and can be used to increase screening capacity at the early stages of selection.

Supplementary Materials

The following are available online at https://www.mdpi.com/2073-4395/11/3/420/s1, Figure S1: Frequency distribution of cassava genotypes for CMD severity score in the SN and CET of the breeding population, Figure S2: Frequency distribution of cassava genotypes for CMD severity score in the SN and CET of the prebreeding population, Figure S3: Frequency distribution of cassava genotypes for CMD severity score in the SN of the prebreeding population, Figure S4: Allele discrimination plots from KASP genotyping for SNP markers linked to resistance to CMD (S12_7926132, S12_7926163, and S14_4626854) in the SN of the breeding and the pre-breeding population, Figure S5: Receiver operating characteristic (ROC) curve of the true-positive rate against the false-positive rate for the training and testing sets in the (a) breeding population and (b) prebreeding population, Table S1: BLAST results of the flanking sequences of the three SNP markers on the cassava reference genome, Table S2: Number of predicted genotypes for markers linked to resistance (S12_7926132 and S14_4626854) in the seedling nursery of breeding and prebreeding populations.

Author Contributions

Conceptualization, A.D.I. and I.Y.R.; Formal analysis, A.D.I., G.J.B. and I.Y.R.; Resources, E.N., L.A.B.L.-L. and H.C.; Supervision, B.O., E.Y.P. and P.K.; Writing—original draft, A.D.I.; Writing—review and editing, B.O., E.G.N.M., I.S.K., E.Y.P., P.K., C.E., G.J.B., E.N., L.A.B.L.-L., H.C. and I.Y.R. All authors have read and agreed to the published version of the manuscript.

Funding

The authors thank the UK’s Foreign, Commonwealth and Development Office (FCDO) and the Bill & Melinda Gates Foundation (Grant INV—007637 http://www.gatesfoundation.org (accessed on 21 February 2021)) for their financial support as well as the Roots, Tubers, and Bananas Program of the CGIAR. First Author was supported by the African Union to pursue a Ph.D. in Plant Breeding at PAULESI, Ibadan, Nigeria.

Data Availability Statement

The phenotypic and SNP data that supports this research is openly accessible on the cassava breeding database (www.cassavabase.org (accessed on 21 February 2021)) and can be downloaded from ftp://ftp.cassavabase.org/manuscripts/Ige_et_al_2021/ (accessed on 21 February 2021).

Acknowledgments

The authors gratefully acknowledge the technical support provided by the staff of the Cassava Breeding Program at the International Institute of Tropical Agriculture, Ibadan, Nigeria during the study. We also thank Excellence-in-Breeding Platform of the CGIAR for supporting the conversion of the trait-linked markers to allele-specific PCR assays. We thank the two anonymous Reviewers and the Editor for constructive comments which helped to improve the manuscript.

Conflicts of Interest

The authors declare that we have no conflict of interest.

References

  1. Montagnac, J.A.; Davis, C.R.; Tanumihardjo, S.A. Nutritional Value of Cassava for Use as a Staple Food and Recent Advances for Improvement. Compr. Rev. Food Sci. Food Saf. 2009, 8, 181–194. [Google Scholar] [CrossRef] [PubMed]
  2. FAOSTAT. Food and Agriculture Organization of the United Nations Statistics. Available online: https://www.fao.org/faostat/en/#data/QC (accessed on 1 December 2020).
  3. Tan, S.L. Cassava-silently, the tuber fills: The lowly cassava, regarded as a poor man’s crop, may help save the world from the curse of plastic pollution. Utar Agric. Sci. J. 2015, 1, 12–24. [Google Scholar]
  4. Burns, A.; Gleadow, R.; Cliff, J.; Zacarias, A.; Cavagnaro, T. Cassava: The Drought, War and Famine Crop in a Changing World. Sustainability 2010, 2, 3572–3607. [Google Scholar] [CrossRef] [Green Version]
  5. Balagopalan, C. Cassava utilization in food, feed and industry. In Cassava: Biology, Production and Utilization; CABI Publishing: Kerala, India, 2009; pp. 301–318. [Google Scholar]
  6. Patil, B.L.; Kanju, E.; Legg, J.P.; Fauquet, C.M. Cassava brown streak disease: A threat to food security in Africa. J. Gen. Virol. 2015, 96, 956–968. [Google Scholar] [CrossRef] [Green Version]
  7. Masinde, E.A.; Kimata, B.; Ogendo, J.O.; Mulwa, R.M.; Mkamillo, G.; Maruthi, M.N. Developing dual resistant cassava to the two major viral diseases. Crop. Sci. 2020. [Google Scholar] [CrossRef]
  8. Thottappilly, G.; Thresh, J.M.; Calvert, L.A.; Winter, S. Cassava. In Virus and Virus-like Diseases of Major Crops in Developing Countries; Loebenstein, G., Thottappilly, G., Eds.; Springer Science & Business Media: Dordrecht, The Netherlands, 2003; pp. 107–165. [Google Scholar]
  9. Alabi, O.J.; Mulenga, R.M.; Legg, J.P. Cassava mosaic. In Virus diseases of tropical and subtropical crops; Tennant, P., Fermin, G., Eds.; CAB International: Wallingford, UK, 2015; pp. 56–72. [Google Scholar]
  10. Wang, H.L.; Cui, X.Y.; Wang, X.W.; Liu, S.S.; Zhang, Z.H.; Zhou, X.P. First Report of Sri Lankan cassava mosaic virus Infecting Cassava in Cambodia. Plant Dis. 2016, 100, 1029. [Google Scholar] [CrossRef]
  11. Minato, N.; Sok, S.; Chen, S.; Delaquis, E.; Phirun, I.; Le, V.X.; Burra, D.D.; Newby, J.C.; Wyckhuys, K.A.G.; De Haan, S. Surveillance for Sri Lankan cassava mosaic virus (SLCMV) in Cambodia and Vietnam one year after its initial detection in a single plantation in 2015. PLoS ONE 2019, 14, e0212780. [Google Scholar] [CrossRef] [Green Version]
  12. Wang, D.; Yao, X.M.; Huang, G.X.; Shi, T.; Wang, G.F.; Ye, J. First Report of Sri Lankan Cassava Mosaic Virus Infected Cassava in China. Plant Dis. 2019, 103, 1437. [Google Scholar] [CrossRef]
  13. Owor, B.; Legg, J.P.; Okao-Okuja, G.; Obonyo, R.; Ogenga-Latigo, M.W. The effect of cassava mosaic geminiviruses on symptom severity, growth and root yield of a cassava mosaic virus disease-susceptible cultivar in Uganda. Ann. Appl. Biol. 2004, 145, 331–337. [Google Scholar] [CrossRef]
  14. Legg, J.; Owor, B.; Sseruwagi, P.; Ndunguru, J. Cassava Mosaic Virus Disease in East and Central Africa: Epidemiology and Management of a Regional Pandemic. Adv. Virus Res. 2006, 67, 355–418. [Google Scholar] [CrossRef]
  15. Storey, H.H.; Nichols, R.F.W. Studies of the Mosaic Diseases of Cassava. Ann. Appl. Biol. 1938, 25, 790–806. [Google Scholar] [CrossRef]
  16. CABI Invasive Species Compendium: UK. Available online: https://www.cabi.org/isc/datasheet/2747 (accessed on 11 December 2020).
  17. Akano, A.; Dixon, A.; Mba, C.; Barrera, E.; Fregene, M. Genetic mapping of a dominant gene conferring resistance to cassava mosaic disease. Theor. Appl. Genet. 2002, 105, 521–525. [Google Scholar] [CrossRef] [PubMed]
  18. Rabbi, I.Y.; Hamblin, M.T.; Kumar, P.L.; Gedil, M.A.; Ikpan, A.S.; Jannink, J.-L.; Kulakow, P.A. High-resolution mapping of resistance to cassava mosaic geminiviruses in cassava using genotyping-by-sequencing and its implications for breeding. Virus Res. 2014, 186, 87–96. [Google Scholar] [CrossRef] [PubMed] [Green Version]
  19. Jennings, D.L. Breeding for resistance to African cassava mosaic disease: Progress and prospects. In African Cassava Mosaic; Barry, L.N., Ed.; International Development Research Centre: Ottawa, ON, Canada, 1976; p. 42. [Google Scholar]
  20. Wolfe, M.D.; Bauchet, G.J.; Chan, A.W.; Lozano, R.; Ramu, P.; Egesi, C.; Kawuki, R.; Kulakow, P.; Rabbi, I.; Jannink, J.-L. Historical Introgressions from a Wild Relative of Modern Cassava Improved Important Traits and May Be Under Balancing Selection. Genetics 2019, 213, 1237–1253. [Google Scholar] [CrossRef] [PubMed] [Green Version]
  21. Fregene, M.; Okogbenin, E.; Mba, C.; Angel, F.; Suarez, M.C.; Janneth, G.; Chavarriaga, P.; Roca, W.; Bonierbale, M.; Tohme, J. Genome mapping in cassava improvement: Challenges, achievements and opportunities. Euphytica 2001, 120, 159–165. [Google Scholar] [CrossRef]
  22. Lokko, Y.; Danquah, E.Y.; Offei, S.K.; Dixon, A.G.O.; Gedil, M.A. Molecular markers associated with a new source of resistance to the cassava mosaic disease. Afr. J. Biotechnol. 2005, 4. [Google Scholar] [CrossRef]
  23. Okogbenin, E.; Egesi, C.N.; Olasanmi, B.; Ogundapo, O.; Kahya, S.S.; Hurtado, P.; Marin, J.; Akinbo, O.; Mba, C.; Gomez, H.; et al. Molecular Marker Analysis and Validation of Resistance to Cassava Mosaic Disease in Elite Cassava Genotypes in Nigeria. Crop. Sci. 2012, 52, 2576–2586. [Google Scholar] [CrossRef] [Green Version]
  24. Wolfe, M.D.; Rabbi, I.Y.; Egesi, C.; Hamblin, M.; Kawuki, R.; Kulakow, P.; Lozano, R.; Del Carpio, D.P.; Ramu, P.; Jannink, J. Genome-Wide Association and Prediction Reveals Genetic Architecture of Cassava Mosaic Disease Resistance and Prospects for Rapid Genetic Improvement. Plant Genome 2016, 9, 1–13. [Google Scholar] [CrossRef] [PubMed] [Green Version]
  25. Rabbi, I.Y.; Kayondo, S.I.; Bauchet, G.; Yusuf, M.; Aghogho, C.I.; Ogunpaimo, K.; Uwugiaren, R.; Smith, I.A.; Peteti, P.; Agbona, A.; et al. Genome-wide association analysis reveals new insights into the genetic architecture of defensive, agro-morphological and quality-related traits in cassava. Plant Mol. Biol. 2020, 1–19. [Google Scholar] [CrossRef]
  26. Ceballos, H.; Kawuki, R.S.; Gracen, V.E.; Yencho, G.C.; Hershey, C.H. Conventional breeding, marker-assisted selection, genomic selection and inbreeding in clonally propagated crops: A case study for cassava. Theor. Appl. Genet. 2015, 128, 1647–1667. [Google Scholar] [CrossRef] [PubMed] [Green Version]
  27. Chagné, D.; Vanderzande, S.; Kirk, C.; Profitt, N.; Weskett, R.; Gardiner, S.E.; Peace, C.P.; Volz, R.K.; Bassil, N.V. Validation of SNP markers for fruit quality and disease resistance loci in apple (Malus × domestica Borkh.) using the OpenArray® platform. Hortic. Res. 2019, 6, 1–16. [Google Scholar] [CrossRef] [PubMed] [Green Version]
  28. Collard, B.C.; Mackill, D.J. Marker-assisted selection: An approach for precision plant breeding in the twenty-first century. Philos. Trans. R. Soc. B Biol. Sci. 2007, 363, 557–572. [Google Scholar] [CrossRef] [PubMed] [Green Version]
  29. Platten, J.D.; Cobb, J.N.; Zantua, R.E. Criteria for evaluating molecular markers: Comprehensive quality metrics to improve marker-assisted selection. PLoS ONE 2019, 14, e0210529. [Google Scholar] [CrossRef] [PubMed] [Green Version]
  30. Ceballos, H.; Kulakow, P.; Hershey, C. Cassava Breeding: Current Status, Bottlenecks and the Potential of Biotechnology Tools. Trop. Plant Biol. 2012, 5, 73–87. [Google Scholar] [CrossRef]
  31. Ceballos, H.; Rojanaridpiched, C.; Phumichai, C.; Becerra, L.A.; Kittipadakul, P.; Iglesias, C.; Gracen, V.E. Excellence in Cas-sava Breeding: Perspectives for the Future. CBGG 2020, 2. Available online: https://cbgg.hapres.com/UpLoad/PdfFile/CBGG_1209.pdf (accessed on 28 December 2020).
  32. Ferguson, M.; Rabbi, I.; Kim, D.-J.; Gedil, M.; López-Lavalle, L.A.B.; Okogbenin, E. Molecular Markers and Their Application to Cassava Breeding: Past, Present and Future. Trop. Plant Biol. 2011, 5, 95–109. [Google Scholar] [CrossRef]
  33. Altschul, S.F.; Gish, W.; Miller, W.; Myers, E.W.; Lipman, D.J. Basic local alignment search tool. J. Mol. Biol. 1990, 215, 403–410. [Google Scholar] [CrossRef]
  34. Abass, A.B.; Towo, E.; Mukuka, I.; Okechukwu, R.U.; Ranaivoson, R.; Tarawali, G.; Kanju, E. Growing Cassava: A Training Manual from Production to Postharvest; International Institute of Tropical Agriculture: Ibadan, Nigeria, 2014; pp. 1–29. [Google Scholar]
  35. Atser, G.; Dixon, A.; Ekeleme, F.; Chikoye, D.; Dashiell, K.E.; Ayankanmi, T.G.; Hauser, S.; Agada, M.; Okwusi, M.; Sokoya, G. The ABC of Weed Management in Cassava Production in Nigeria: A Training Manual; International Institute of Tropical Agriculture: Ibadan, Nigeria, 2017; pp. 1–30. [Google Scholar]
  36. Genomics LGC. KASP Genotyping Chemistry User Guide and Manual; LGC Limited: Teddington, UK, 2013; Available online: https://www.biosearchtech.com/ (accessed on 17 July 2018).
  37. Bates, D.; Mächler, M.; Bolker, B.; Walker, S. Fitting Linear Mixed-Effects Models Usinglme4. J. Stat. Softw. 2015, 67, 1–48. [Google Scholar] [CrossRef]
  38. R Development Core Team. R: A Language and Environment for Statistical Computing; R Foundation for Statistical Computing: Vienna, Austria, 2015; Available online: http://www.R-project.org/ (accessed on 21 February 2021).
  39. Kling, J. Introduction to Augmented Designs. Oregon State University. National Association of Plant Breeders. 2011. Available online: https://pbgworks.org/sites/pbgworks.org/files/AugmentedDesignsFINAL.pdf (accessed on 24 December 2020).
  40. Kuhn, M.; Wickham, H. Tidymodels: Easily Install and Load the’Tidymodels’ Packages, R package version 0.1.0; 2020; Available online: https://tidymodels.tidymodels.org/ (accessed on 21 February 2021).
  41. Ray, S.; Satya, P. Next generation sequencing technologies for next generation plant breeding. Front. Plant Sci. 2014, 5, 367. [Google Scholar] [CrossRef] [Green Version]
  42. Win, K.T.; Vegas, J.; Zhang, C.; Song, K.; Lee, S. QTL mapping for downy mildew resistance in cucumber via bulked segregant analysis using next-generation sequencing and conventional methods. Theor. Appl. Genet. 2017, 130, 199–211. [Google Scholar] [CrossRef]
  43. Esuma, W.; Herselman, L.; Labuschagne, M.T.; Ramu, P.; Lu, F.; Baguma, Y.; Buckler, E.S.; Kawuki, R.S. Genome-wide association mapping of provitamin A carotenoid content in cassava. Euphytica 2016, 212, 97–110. [Google Scholar] [CrossRef]
  44. Rabbi, I.Y.; Udoh, L.I.; Wolfe, M.; Parkes, E.Y.; Gedil, M.A.; Dixon, A.; Ramu, P.; Jannink, J.; Kulakow, P. Genome-Wide Association Mapping of Correlated Traits in Cassava: Dry Matter and Total Carotenoid Content. Plant Genome 2017, 10. [Google Scholar] [CrossRef] [PubMed]
  45. Zhang, S.; Chen, X.; Lu, C.; Ye, J.; Zou, M.; Lu, K.; Feng, S.; Pei, J.; Liu, C.; Zhou, X.; et al. Genome-Wide Association Studies of 11 Agronomic Traits in Cassava (Manihot esculenta Crantz). Front. Plant Sci. 2018, 9, 503. [Google Scholar] [CrossRef] [PubMed] [Green Version]
  46. Neelam, K.; Brown-Guedira, G.; Huang, L. Development and validation of a breeder-friendly KASPar marker for wheat leaf rust resistance locus Lr21. Mol. Breed. 2012, 31, 233–237. [Google Scholar] [CrossRef]
  47. Li, L.; Tacke, E.; Hofferbert, H.-R.; Lübeck, J.; Strahwald, J.; Draffehn, A.M.; Walkemeier, B.; Gebhardt, C. Validation of candidate gene markers for marker-assisted selection of potato cultivars with improved tuber quality. Theor. Appl. Genet. 2013, 126, 1039–1052. [Google Scholar] [CrossRef] [Green Version]
  48. Rasheed, A.; Wen, W.; Gao, F.; Zhai, S.; Jin, H.; Liu, J.; Guo, Q.; Zhang, Y.; Dreisigacker, S.; Xia, X.; et al. Development and validation of KASP assays for genes underpinning key economic traits in bread wheat. Theor. Appl. Genet. 2016, 129, 1843–1860. [Google Scholar] [CrossRef] [PubMed]
  49. Chandra, S.; Singh, D.; Pathak, J.; Kumari, S.; Kumar, M.; Poddar, R.; Balyan, H.S.; Prabhu, K.V.; Gupta, P.K.; Mukhopadhyay, K. SNP discovery from next-generation transcriptome sequencing data and their validation using KASP assay in wheat (Triticum aestivum L.). Mol. Breed. 2017, 37, 92. [Google Scholar] [CrossRef]
  50. Udoh, L.I.; Parkes, E.Y.; Kulakow, P.; Adesoye, A.; Nwuba, C.; Rabbi, I.Y.; Gedil, M. Candidate gene sequencing and validation of SNP markers linked to carotenoid content in cassava (Manihot esculenta Crantz). Mol. Breed. 2017, 37, 123. [Google Scholar] [CrossRef]
  51. Javid, M.; Rosewarne, G.M.; Sudheesh, S.; Kant, P.; Leonforte, A.; Lombardi, M.; Kennedy, P.R.; Cogan, N.O.I.; Slater, A.T.; Kaur, S. Validation of molecular markers associated with boron tolerance, powdery mildew resistance and salinity tolerance in field peas. Front. Plant Sci. 2015, 6, 917. [Google Scholar] [CrossRef] [PubMed] [Green Version]
  52. Tan, C.-T.; Assanga, S.; Zhang, G.; Rudd, J.C.; Haley, S.D.; Xue, Q.; Ibrahim, A.; Bai, G.; Zhang, X.; Byrne, P.; et al. Development and Validation of KASP Markers for Wheat Streak Mosaic Virus Resistance Gene Wsm2. Crop. Sci. 2016, 57, 340–349. [Google Scholar] [CrossRef] [Green Version]
  53. Trebbi, D.; Ravi, S.; Broccanello, C.; Chiodi, C.; Francis, G.; Oliver, J.; Mulpuri, S.; Srinivasan, S.; Stevanato, P. Identification and validation of SNP markers linked to seed toxicity in Jatropha curcas L. Sci. Rep. 2019, 9, 1–7. [Google Scholar] [CrossRef] [PubMed] [Green Version]
  54. Yang, Q.; Zhang, P.; Wu, R.; Lu, K.; Zhou, H. Identifying the Best Marker Combination in CEA, CA125, CY211, NSE, and SCC for Lung Cancer Screening by Combining ROC Curve and Logistic Regression Analyses: Is It Feasible? Dis. Markers 2018, 1–12. [Google Scholar] [CrossRef] [PubMed] [Green Version]
  55. Ceballos, H.; Gracen, V.E. A Dominant Inhibitor Gene Inhibits the Expression of Ht2 against Exserohilum turcicum Race 2 in Corn Inbred Lines Related to B14. Plant Breed. 1989, 102, 35–44. [Google Scholar] [CrossRef]
  56. Pita, J.S.; Fondong, V.N.; Sangaré, A.; Otim-Nape, G.W.; Ogwal, S.; Fauquet, C.M. Recombination, pseudorecombination and synergism of geminiviruses are determinant keys to the epidemic of severe cassava mosaic disease in Uganda. J. Gen. Virol. 2001, 82, 655–665. [Google Scholar] [CrossRef]
  57. Zinga, I.; Chiroleu, F.; Legg, J.; Lefeuvre, P.; Komba, E.K.; Semballa, S.; Yandia, S.P.; Mandakombo, N.B.; Reynaud, B.; Lett, J.-M. Epidemiological assessment of cassava mosaic disease in Central African Republic reveals the importance of mixed viral infection and poor health of plant cuttings. Crop. Prot. 2013, 44, 6–12. [Google Scholar] [CrossRef]
  58. Mukiibi, D.R.; Alicai, T.; Kawuki, R.; Okao-Okuja, G.; Tairo, F.; Sseruwagi, P.; Ndunguru, J.; Ateka, E.M. Resistance of advanced cassava breeding clones to infection by major viruses in Uganda. Crop. Prot. 2019, 115, 104–112. [Google Scholar] [CrossRef]
  59. Mulamba, N.N.; Hallauer, A.R.; Smith, O.S. Recurrent Selection for Grain Yield in a Maize Population 1. Crop. Sci. 1983, 23, 536–540. [Google Scholar] [CrossRef]
  60. Iglesias, C.A.; Hallauer, A.R. S2 recurrent selection in maize populations with exotic germplasm. Maydica 1989, 34, 133–140. [Google Scholar]
  61. Acquaah, G. Principles of Plant. Genetics and Breeding; Blackwell Publishing Limited: Malden, MA, USA, 2007; pp. 371, 374. [Google Scholar]
Figure 1. Frequency distribution of cassava genotypes for cassava mosaic disease (CMD) severity score at 3 months after planting (MAP) MAP in (a) breeding and (b) prebreeding populations of the two evaluation stages.
Agronomy 11 00420 g001
Figure 2. Frequency of favorable alleles linked to CMD resistance in the two populations.
Agronomy 11 00420 g002
Figure 3. Boxplots showing the effect of the markers associated with CMD resistance in (a) breeding and (b) prebreeding populations of the two evaluation stages (SN = seedling nursery, CET = clonal evaluation trial). **** indicates p < 0.0001, *** indicates p < 0.001, ** indicates p < 0.01, * indicates p < 0.05, ns = not significant.
Agronomy 11 00420 g003
Figure 4. Effects of marker alleles linked to CMD resistance on root weight per plant in the CET stage of the (a) breeding and (b) prebreeding populations. **** indicates p < 0.0001, ** indicates p < 0.01, * indicates p < 0.05, ns = not significant.
Agronomy 11 00420 g004
Figure 5. Within-family performance metrics of marker S12_7926132 assessed using the SN data: (a) allelic substitution effects and p-values; (b) accuracy versus false-positive rate. Only families with 20 or more individuals were considered.
Agronomy 11 00420 g005
Table 1. Summary statistics of selected resistance-linked single nucleotide polymorphism (SNP) markers from genome-wide association study (GWAS) analysis.
MarkersChr.Location (bp)Allele 1Allele 2βSEp-Value
S12_7926132127926132GT *0.890.02p ≈ 0
S12_7926163127926163AG *0.890.02p ≈ 0
S14_4626854144626854A *G−0.230.031.00 × 10–14
Chr. = Chromosome location, bp = base pair, β = SNP effect from GWAS, SE = standard error, p-value = marker-trait association probability value, * Favorable allele.
Table 2. Flanking sequences of SNP markers linked to cassava mosaic disease (CMD) resistance and their Kompetitive allele-specific PCR (KASP) primers.
MarkersSNP and 100 bp Flanking SequencesForward Primer
Allele 1 and Allele 2
Primer CommonReference
S12_7926132CTGCACACTCAAAGCTGCATCCTATTTTCCATGTTTCCACCCTCAAATG(G/T)TATCACAAAGGACAAGATTCTTGTACTCCAATGCTGCCACCAACTCCACCAllele 1: TTCCATGTTTCCACCCTCAAATGG;
Allele 2: TTCCATGTTTCCACCCTCAAATGT
GGAGTACAAGAATCTTGTCCTTTGTGATA[25]
S12_7926163TGTTTCCACCCTCAAATGGTATCACAAAGGACAAGATTCTTGTACTCCA(A/G)TGCTGCCACCAACTCCACCTGATGTTCCTCTTCAACCTCTGGCTGTTTTAAllele 1: ACAAAGGACAAGATTCTTGTACTCCAA;
Allele 2: CAAAGGACAAGATTCTTGTACTCCAG
GTTGAAGAGGAACATCAGGTGGAGTT[25]
S14_4626854ACCACTGCATCTTGTGCTCATGAGCCATTGCACGCTGCACCTCTTCATT(G/A)ATCGCTCATTTGCATCCCACCTTTGGATAGCGCGACTATGAGCTGCATCAAllele 1: GCACGCTGCACCTCTTCATTA;
Allele 2: GCACGCTGCACCTCTTCATTG
CAAAGGTGGGATGCAAATGAGCGAT[25]
Table 3. Broad-sense heritability calculated on a mean plot basis for cassava mosaic disease (CMD) severity score, root number, and root weight in the clonal evaluation trial (CET).
Breeding PopulationPre-Breeding Population
Traitsσ2gσ2eH2σ2gσ2eH2
CMD severity score1.150.130.900.980.180.84
Root number13.0250.020.2176.9697.660.44
Root weight5.5111.040.3341.5449.520.46
σ2g is the clonal genotypic variance, σ2e is the residual variance, and H2 is the broad-sense heritability.
Table 4. Pairwise trait correlations for CMD severity score, root number, and root weight in the breeding and prebreeding populations.
BreedingPre-Breeding
cmd1s_CETcmd3s_CETrtno_CETrtwt_CETcmd1s_CETcmd3s_CETrtno_CETrtwt_CET
cmd3s_SN0.750.76−0.19−0.280.550.50−0.25−0.25
cmd1s_CET 0.84−0.21−0.31 0.68−0.31−0.35
cmd3s_CET −0.18−0.26 −0.29−0.33
rtno_CET 0.75 0.73
cmd1s = CMD severity score at 1 MAP, cmd3s = CMD severity score at 3 MAP, rtno = number of marketable storage roots, rtwt = root weight, SN = seedling nursery, CET = clonal evaluation trial.
Table 5. Accuracy and area under curve values for training and testing sets in the breeding and prebreeding populations.
Population NAccuracyStandard ErrorAUCStandard Error
BreedingTraining set13510.800.0030.800.005
Testing set4500.80 0.80
Pre-breedingTraining set25740.760.0030.820.005
Testing set8570.78 0.86
N = number of observations, AUC = area under the curve.
Table 6. Confusion matrix from the logistic regression model for the testing set in breeding and pre-breeding populations.
Truth
PopulationPredictionResistantSusceptibleFPR (%)FNR (%)Misclassification (%)
BreedingResistant24254331622.0
Susceptible45108
Pre-breedingResistant26972152921.2
Susceptible109405
FPR = false-positive rate, FNR = false-negative rate.
Publisher’s Note: MDPI stays neutral with regard to jurisdictional claims in published maps and institutional affiliations.

