Article

Optimized Supply Chain Management of Rice in South Korea: Location–Allocation Model of Rice Production

1
Crop Research Division, Jeollanamdo Agricultural Research and Extension Services, Naju-si 58123, Jeollanam-do, Korea
2
Department of Environmental Horticulture & Landscape Architecture, College of Life Science & Biotechnology, Dankook University, Cheonan-si 31116, Chungnam, Korea
3
Department of Industrial and Systems Engineering, Dongguk University-Seoul, Seoul 04620, Korea
*
Author to whom correspondence should be addressed.
Both authors contributed equally to this work.
Agronomy 2021, 11(2), 270; https://doi.org/10.3390/agronomy11020270
Submission received: 13 January 2021 / Revised: 28 January 2021 / Accepted: 28 January 2021 / Published: 31 January 2021
(This article belongs to the Special Issue Intelligent Decision Support for Agri-Food Green Supply Chain)

Abstract

:
Planning for optimized farming with the aim of providing ideal site and cultivar selection is critical for a stable and sustainable supply of rice with sufficient quantity and quality to customers. In this study, a range of morphological characteristics and yield of eight rice cultivars that are commonly cultivated in Korea were investigated from 2005 to 2020. All morphological characteristics were significantly different among the eight rice cultivars. The dataset of morphological characteristics and yield was used to isolate groups of similar rice cultivars. The k-means clustering method was used to group the rice cultivars. Three groups (Group 1, Group 2, and Group 3) were created. Most cultivars were in Group 1. High-yielding rice cultivars were in Group 2, while the rice cultivars in Group 3 had the lowest rice grain yield. After grouping these rice cultivars, ideal farming locations for all three rice cultivar groups were identified to reduce transportation cost using an optimized location–allocation model. Simulation results suggested the following: (1) Group 1 should be produced in Jellanam-do (south west region), (2) Group 2 should be produced in Chungcheongnam-do (central west region), and (3) Group 3 should be mainly produced in the central west region of South Korea. Simulation results showed the potential to reduce transportation cost by around 0.014%. This can also reduce 21.04 tons of CO2 emission from a freight truck. Because these eight cultivars only make up 19.76% of the total rice production in South Korea, the cost reduction proportion was only 0.014% of total revenue. In future studies, more rice cultivars should be investigated to increase the efficiency of the model performance.

1. Introduction

In most Asian countries, including South Korea, rice has been the most important crop for thousands of years. In South Korea, rice is the stable crop of farms, accounting for about 85% of total grain production and over 49% of total agricultural income [1]. For the last few decades, rice yield has been increased through selection of high-yield varieties that are better suited for the Korean climate and taste [1]. Rice yield sharply increased between 1960 and 1977 and then gradually increased after 1981 [2]. However, since 1990, total rice production has been continuously decreasing due to decreasing rice harvesting areas [2]. Due to growing urbanization and climate change, arable areas for crops in South Korea have been continuously decreasing. This might lead to an increase in food shortage and food prices in the future. Moreover, due to limited available arable land in South Korea, most of the agricultural land is currently situated in the southern regions, thus requiring long distance transportation to deliver agricultural products to urban areas, which are concentrated in the northern regions. In fact, the transportation cost is a significant part of operational cost in the supply chain involving farms, distributors, and retailers. With increase in fuel price, the proportion of cost allocated to transportation can be as high as 50% [3], which can result in increased price of products. Therefore, production and transportation management should be investigated to improve sustainability of the rice production system and enhance performance of the rice supply chain in South Korea.
The location–allocation model is an effective way to support farmers in their decision making about allocating rice cultivars to a piece of land. Using this decision supporting tool, farmers can select appropriate rice cultivars to be planted and the areas of land to be assigned for cultivation that will help them make maximum economic profits by reducing supply chain cost. The model should be designed based on the market price; known yield of crop cultivars; cost incurred during planting, transportation, etc.; availability of resources for crop growth, e.g., water, soil, and climate; and total amount of arable land available. According to Weintraub and Romero [4], managing agricultural activity is critical because the income of farmers can vary with weather condition, market price changes, etc. The optimization model will solve planning problems in rice cultivation by taking into account such risks and uncertainties. A number of allocation models have been developed by many researchers in recent decades. Daghighi et al. [5] developed an optimization model that simulates water allocation (irrigation) in the Arjan Plain in Fars Province. They used linear programming (LP) to optimize irrigation efficiency through maximizing allowable limit to harvest groundwater and surface water resources in the target years. Wankhade and Lunge [6] also used LP to allocate resources for the maximization of crop production in India. However, most real world problems have a complex and nonlinear solution space, so it is difficult to find the optimum solution via LP [7]. Nonlinear constraints in a real world problem needs to be highly aggregated or simplified with unrealistic assumptions in LP. Thus, it is challenging to use LP to identify the optimum farming location under the nonlinear solution space [8].
Cultivar selection is one of the most important management decisions for farmers to maintain yield and quality of rice for a relatively long time. This decision can be made by comparing the performance data. Many researchers have compared the quality of rice grain or grain nutrients of various rice cultivars grown in a short period [9,10,11]. However, not many studies have evaluated the agricultural characteristics of different rice varieties and their economic value in a relatively long period. While grain nutrient improvement is not directly related to economic value, morphological properties, such as the yield of edible polished grain, are among the most important factors determining rice market values [12]. Therefore, it is necessary to evaluate agricultural characteristics of various rice varieties and determine their economic value before wide production and use.
The aim of this study was to evaluate the morphological characteristics of selected rice cultivars that are commonly grown in South Korea. These selected cultivars were grouped based on similarities of morphological characteristics using k-means clustering analysis. These results will provide useful information for Korean farmers who are trying to select high-yielding cultivars as well as breeders who are trying to develop new rice cultivars from crossing different types of cultivars. In addition to the evaluation of morphological characteristics, in this study, actual yield data were used to develop an optimized rice production location–allocation model. The main function of this model is that it can determine appropriate sites for rice production to improve the efficiency of transportation planning and minimize supply chain cost by reducing transportation cost. In addition, the simulation results to identify ideal site selection for the farming process will provide useful data for optimizing supply chain management of selected rice cultivars in South Korea.
The rest of the paper is organized as follows. First, the morphological characteristics of eight rice cultivars are addressed. Then, the dataset of the measured morphological characteristics is organized to isolate groups of similar rice cultivars through k-means clustering analysis. Finally, a location–allocation model is developed for selecting the ideal farming site and rice cultivar group to minimize transportation cost.

2. Materials and Methods

2.1. Modeling Framework Design

This study was conducted in three steps: (1) field experiment, (2) identification of cultivar groups via k-means clustering, and (3) location–allocation of cultivar groups to ideal farming sites. Figure 1 shows an overview of the proposed research framework. Data for morphological characteristics and yield of the subject crop cultivars were collected from a field study (see Section 2.2 for more detail). The subject cultivars were classified into different cultivar groups via k-means clustering based on their morphological similarity. Initially, the clustering algorithm assigned the subject cultivars to k cultivar groups. After evaluating the initial classification, the algorithm updated centroids of each cultivar group and assigned cultivars to new cultivar groups according to the morphological similarity between a cultivar and a centroid of each cultivar group. This new classification was evaluated and compared with the evaluation result of the previous classification. This process continued until there was no enhancement in the evaluation. Section 2.3 shows in detail the equations used in the clustering process. The finalized cultivar groups were sent to the location–allocation process. In this process, multiple alternatives were considered until the optimization algorithm found the ideal farming location in terms of the total transportation cost of a supply chain. The generalized reduced gradient (GRG) nonlinear algorithm written in JAVA was used for the optimization. Detailed explanation of the optimization is given in Section 2.4.

2.2. Field Experiment

A field experiment was conducted at Jeollanamdo Agricultural Research and Extension Center in Jeollanam-do, South Korea, during the growing seasons of 2005–2020 (35°1′19.35° N, 126°38′29.65° E). A total of eight different medium to late maturing rice (Oryza sativa subsp. Japonica) cultivars, namely Ilmi, Donjin-1, Dongan, Nampyoung, Saegehwa, Hopyoung, Mipum, and Hyunpum, were used in this experiment. These cultivars were selected because they are commonly grown by farmers in the southern regions of South Korea. The characteristics of each rice cultivar are summarized in Table 1. The cultivars were arranged in a completely randomized design. Due to the limited size of the field, each cultivar was planted in different years; only Ilmi was planted during 2005–2020.
According to the National Institute of Agricultural Science, Rural Development Administration (RDA) (available online at http://soil.rda.go.kr/soil/soilmap/characteristic.jsp), the soil type is Deogpyeong (silt loam). During the rice growing season (June–August) of 2005–2020, the average temperature and total rainfall were 25.04 °C and 1165 mm, respectively. The average temperature and total rainfall during the rice growing season (June–August) of each year are shown in Figure 2.
Seeds were sown in a seedling nursery box, and the seedlings were transplanted to a paddy field. Then, 25-day-old seedlings were transplanted with one pot seedling per hill using a planting density of 30 cm × 14 cm (23.8 hills m−2) on June 5. During the growing season, fertilizer was applied twice (mid-June and mid-July). The total rate of fertilizer applied to the plot was 90/45/57 kg of N/P/K ha−1.
All morphological measurements were done in three replicates. The size of each replicate differed according to the type of measurement. Total plant height and number of stems per m2 were measured at 10 (mid-June), 35 (early July), 50 (mid-July), 65 (early August), and 80 (mid-August) days after transplanting. Plant height was measured as the length from ground level to the bottom of the plant’s panicle. The length of the panicle was measured as the length from the bottom to the top of the plant’s panicle. Total plant height was measured as the sum of the plant height and length of the panicle. Heading date, plant height, and length of panicle were measured between mid-August and mid-September. Heading date was determined as the date of observing 40% of flowering panicles. The number of days from transplanting to the flowering date was recorded for further analysis. The fertility rate was measured 20 days after the flowering date. The fertility rate was calculated using the number of filled spikelets and total number of spikelets (panicles of one plant per replicate). Spikelets were squeezed using the index finger and thumb together to determine if they were filled or not. Both completely and partially filled spikelets were considered as fertile grains. Matured rice plants in m2 were harvested from three random places within each plot between early and mid-October. At harvest, the yield components, including the number of spikelets, weight of 1000 spikelets, rate of ripened grain, and rice yield, were measured. Harvested grain were hand threshed and oven dried at 45 °C until the final moisture content was 14–15%. After drying the samples, rough grains were subjected to a series of milling process. Two different rice milling machines were used in each step. In the first step of the milling process, a SY88-TH (Ssang Yong, South Korea) was used. A MC-90A (Toyorice Co. Ltd., Japan) was used in the second step. The first step of the milling process removed husk from the whole grain or paddy to obtain the whole brown rice grain (BR). Brown rice contains an outer bran layer that is brown in color. The second step of the milling process was to remove the brown layer and to obtain polished or white rice (WR). The number of spikelets was counted for each harvested panicle. The rate of ripened grain was measured to test grain filling. It was determined by counting the number of rice grains that sank in water after the water settled. Regression analysis was conducted to test the effect of cultivars on measured morphological characteristics and yield. Correlation between morphological characteristics and yield of eight rice cultivars were tested using Pearson’s correlation analysis.

2.3. k-Means Clustering Analysis

The clustering method was used to organize multivariate dataset collected from field research into isolated groups of similar rice cultivars. Morphological characteristics, including days from transplanting date to flowering date, number of panicles per m2, number of spikelets per panicle, number of spikelets per m2, plant height, length of panicle, fertility rate, rate of ripened grain, unhulled rice yield, BR yield, and WR yield, were used to identify groups of similar rice cultivars. Note that the production cost (or price) of each cultivar was not considered in this study because it is not useful to identify groups with similar morphological characteristics. In other words, the morphological characteristics of cultivar groups can vary even if their prices are the same. The economic aspect will be considered in Section 2.4. Equation (1) represents the k-means clustering algorithm used to identify k groups based on the morphological characteristics [13,14]
argmin C i = 1 k z C i z μ i 2
where C = { C 1 , C 2 , , C k   } ; z = [ z 1 , z 2 , , z n   ] T ; and μ i is a centroid (or mean value) of cluster i. Note that C represents a cluster set, and z is a vector with normalized scores of n cultivars. The normalized score z j was computed with Equation (2).
z j = l = 1 L ( x j l μ l ) / σ l
where x j l is the value of morphological characteristic l for cultivar j; μ l is the mean of morphological characteristic l over cultivars; and σ l is the standard deviation of morphological characteristic l over cultivars. The clustering was conducted over multiple iterations, and it was stopped if the current iteration did not have any significant improvement in Equation (1) compared to the previous iteration. In other words, the clustering was stopped if the improvement of the value of Equation (1) was smaller than threshold θ.

2.4. Optimized Location–Allocation Model for Ideal Farming Site

The k clusters identified in Section 2.3 were allocated based on a location–allocation model for minimizing transportation cost. Table 2 and Equation (3) show the definition of symbols and the devised optimization model, respectively.
M i n   f ( V 1 , , V k ) = i C j M c i j f i j ( 1 w i j ) d ( V i , Y j )
subject to
V i P i   for   i C
Equation (3) was used to compute total transportation cost between k clusters (or groups) and markets. Because the equation tends to identify locations of cultivar clusters (i.e., V 1 , , V k ) with the minimum total transportation cost to markets, we can find cost-effective locations. However, unlike the location–allocation problem for general commodities, finding a field close to market may result in inappropriate allocation of rice fields. A farmer may want to cultivate a certain type of rice due to its environmental adaption or specific needs (e.g., weather condition, soil quality, land lease fee, etc.). Considering the preference of farmers, this study devised an attractiveness weight wij from cluster i to market j. Note that wij is between 0 and 1. Attractiveness can be achieved by conducting a survey of farmer preferences. Alternatively, it can also be computed based on the proportion of existing harvested area of each group in the entire harvested area in each field. In this case, we assumed that farmers preferred to determine existing locations of rice paddy fields. In fact, farmers consider multiple factors, such as climate, harvesting skill (or familiarity), soil type, and production and logistic costs, to determine harvesting fields. Because the objective function tended to minimize transportation cost, the attractiveness weight was subtracted from 1 (i.e., penalty on the transportation cost). By doing this, the objective function increased as the attractiveness weight decreased. Equation (4) is a constraint to only consider available fields for cluster i. Note that potential sites in P i were determined by environmental factors, such as weather, temperature, soil type, geography, etc.

3. Results and Discussion

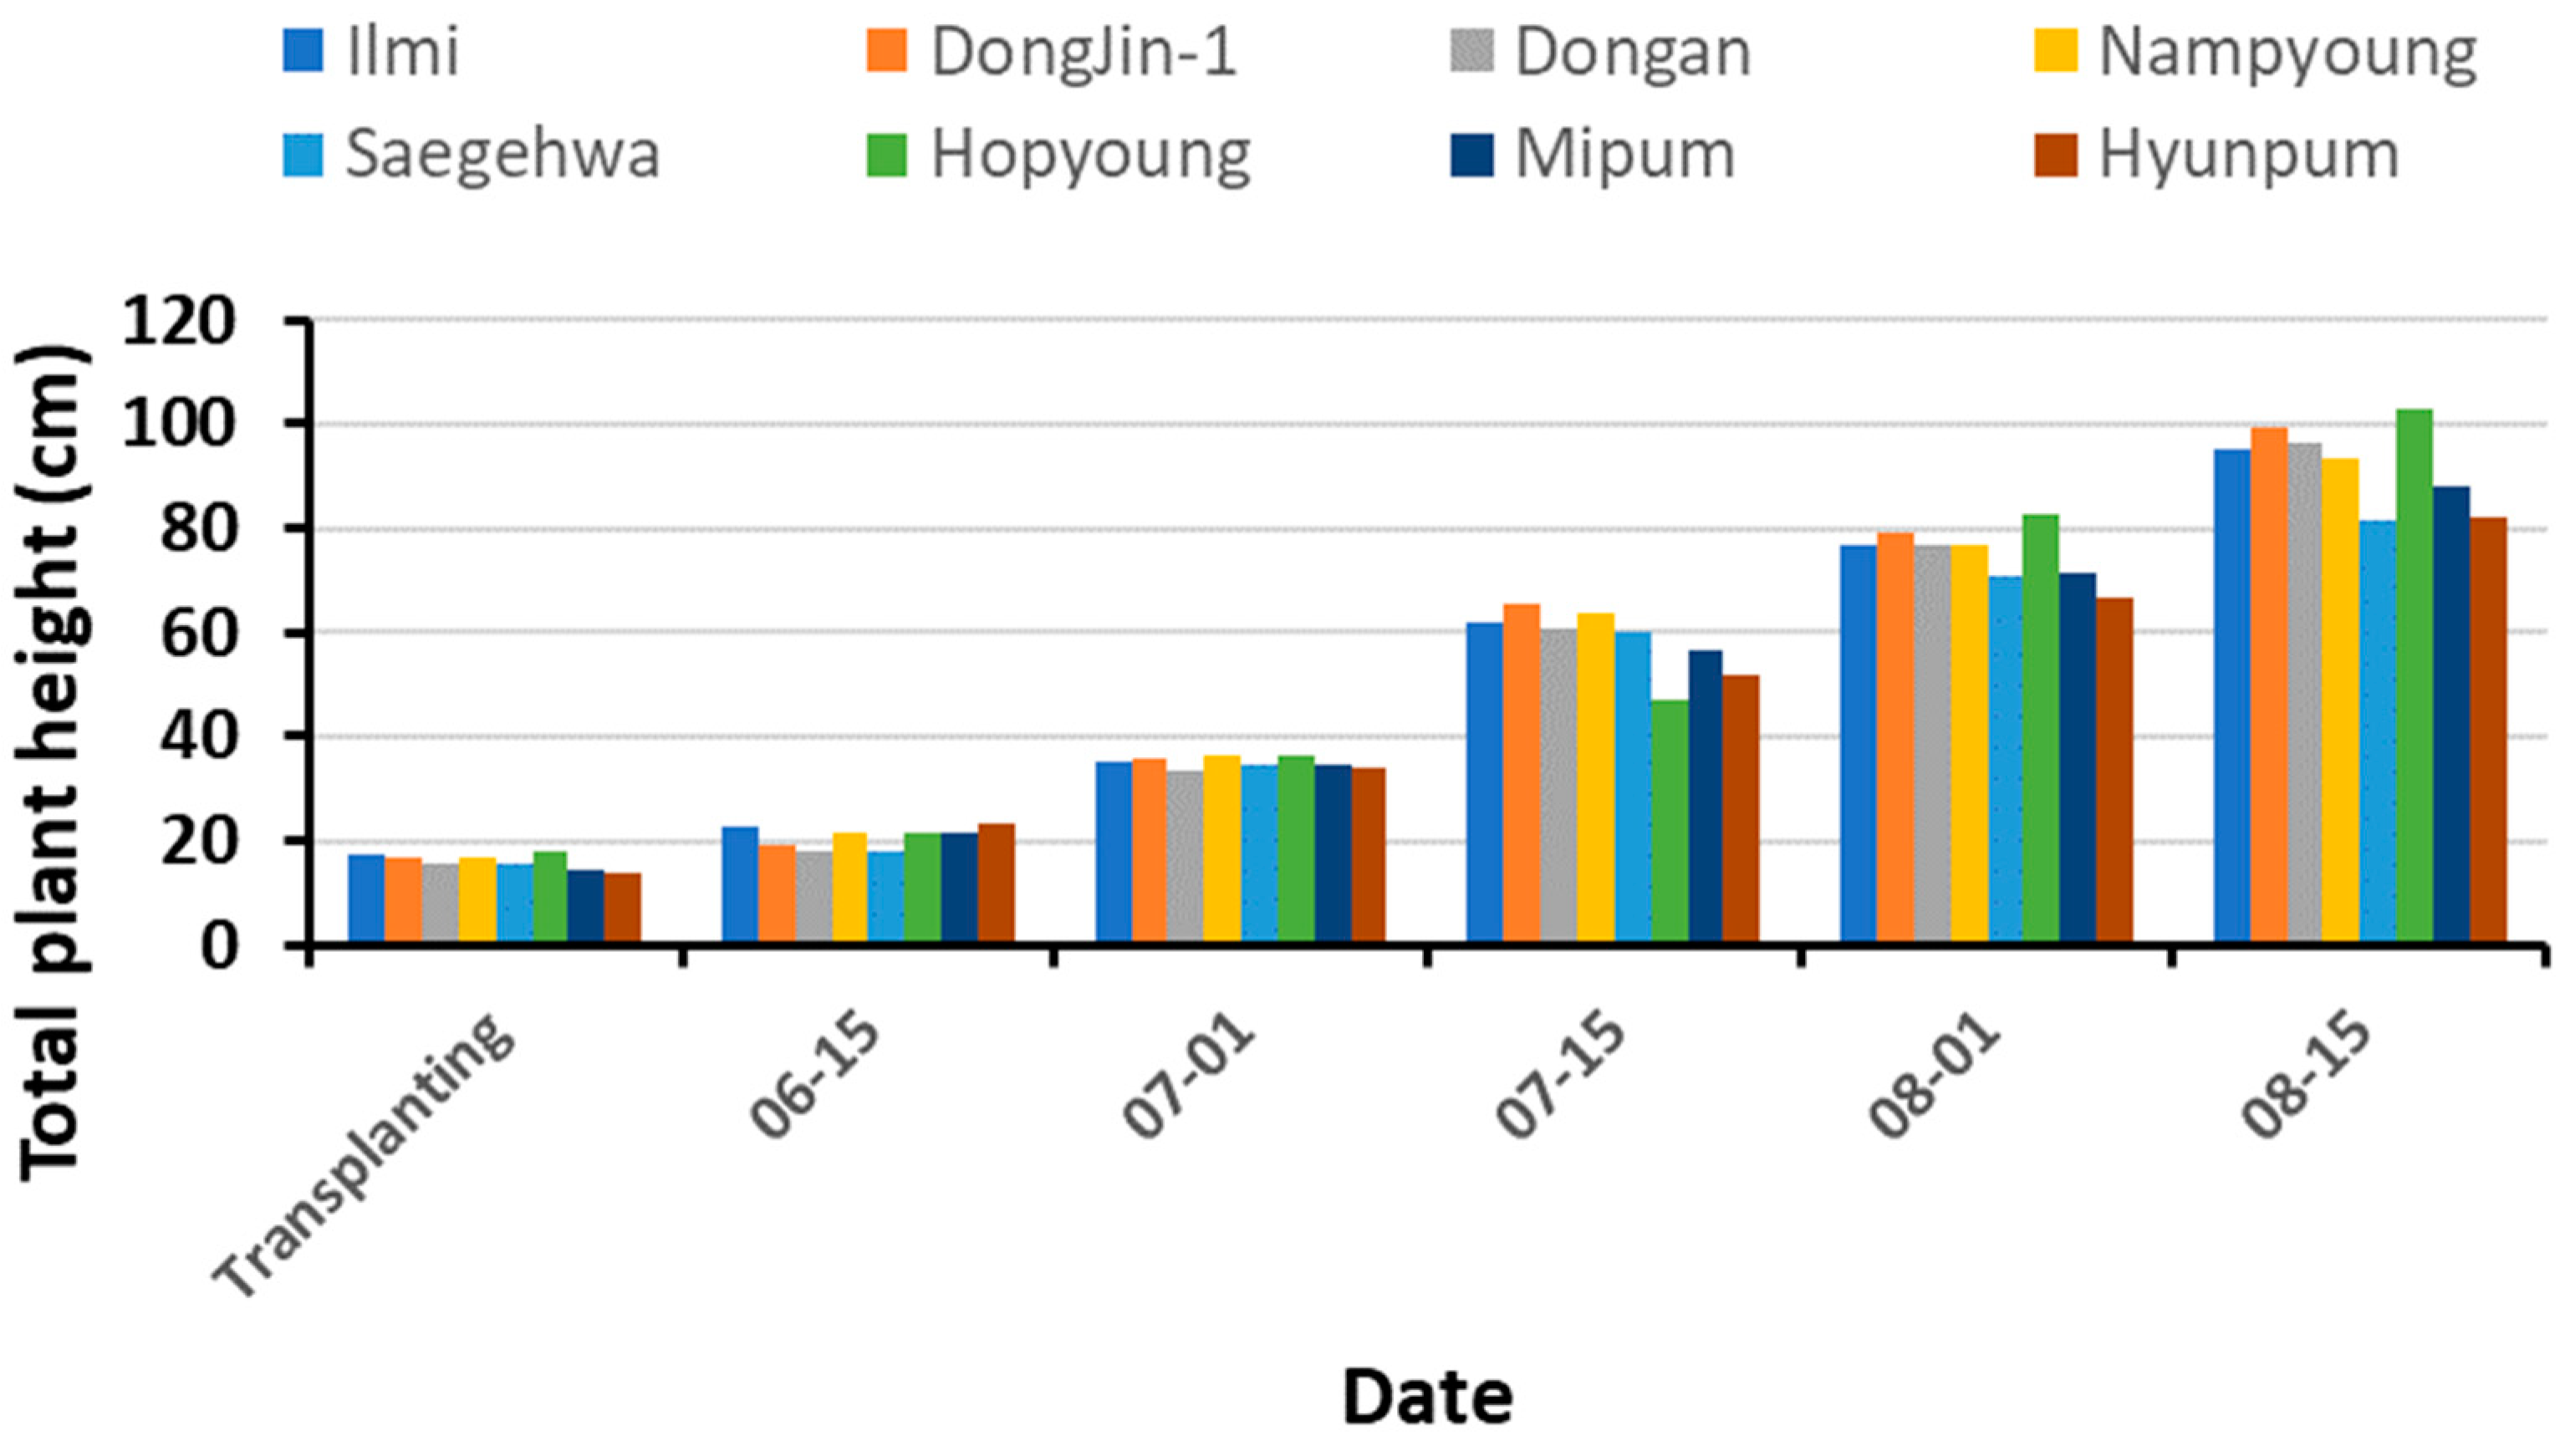
3.1. Morphological Characteristic Evaluation

Total plant heights (sum of plant height and length of panicle) of all eight rice cultivars were measured at transplantation date, mid-June, early July, mid-July, early August, and flowering date (mid-August) (Figure 3). Most cultivars showed similar growth patterns. Plant growth rates at 10, 25, 40, and 55 days after transplantation were 16–18, 19–28, 35–42, 63–74, and 81–87% of total plant heights of full-growth plants, respectively (data not shown). Unlike other cultivars, Hopyoung showed a big increase in total plant height between mid-July (45% of total plant height) and early August (81% of total plant height).
The morphological characteristics and yield of eight rice cultivars are summarized in Table 3 and Table 4, respectively. All morphological characteristics were significantly different by cultivar. The number of days from transplanting date to flowering date varied from 73 to 80 days (Table 3). Among the cultivars, Mipum took the longest time to flower, while DongJin-1 took the shortest time to flower. Saegehwa had the largest number of panicles per m2 (388 panicles per m2). DongJin-1 had the fewest number of panicles per m2 among the cultivars, but the largest number of spikelets per panicle. Because Saegehwa had the largest number of panicles per m2, it had the largest the number of spikelets per m2. Saegehwa also had the largest number of filled spikelets among the cultivars. Donjin-1 had the second largest values for the number of spikelets per m2 and the number of filled spikelets per m2 after Saegehwa. Hyunpum had the lowest values for the number of spikelets per panicles, number of spikelets per m2, and number of filled spikelets per m2 among the cultivars. Donjin-1 and Hopyoung were the tallest plants, while Saegehwa was the shortest plant among the cultivars.
Among the cultivars, Ilmi had the highest percentage of fertility rate (92.71%) and ripened grains (90.53%) (Table 4), while Dongan had the lowest fertility rate. Donjin-1ho and Saegehwa had lower percentage of ripened grains. Hopyoung had the lowest unhulled rice grain yield (6.84 Mg ha−1), while Dongan had the highest unhulled rice grain yield (7.38 Mg ha−1). Saegehwa had the second highest unhulled rice yield (7.35 Mg ha−1) after Dongan. However, it had the highest yield of brown rice (6.18 Mg ha−1) and white rice (5.68 Mg ha−1). Dongan had the second highest yield of white rice (5.60 Mg ha−1) after Saegehwa.
Correlation between morphological variables and yield were tested, and the results are shown in Table 5. The number of spikelets per m2 was positively and moderately correlated with yield of brown rice and white rice. The number of spikelets and the length of panicle were positively correlated with each other, and the length of panicle was also positively and moderately correlated with grain yield. The number of filled spikelets per m2 was positively and moderately correlated with white rice yield. It was observed that Saegehwa had the largest number of filled spikelets. Its white rice grain yield was highest among the cultivars. Similar results were reported by Li et al. [15] who found a strong positive relationship between filled grain number and grain yield. Plant height was negatively correlated with the number of panicles per m2. Similar results were reported by Li et al. [15] who found that the yield of japonica hybrid was negatively correlated with its plant height. However, plant height was positively correlated with the yield for indicas and japonica inbred. Based on these results, breeders focusing on the eight cultivars (japonica) used in this study might need to consider decreasing the plant height to improve yield potential. The rate of ripened grain was negatively correlated with yield. This might be because the number of spikelets was negatively correlated with the rate of ripened grain.

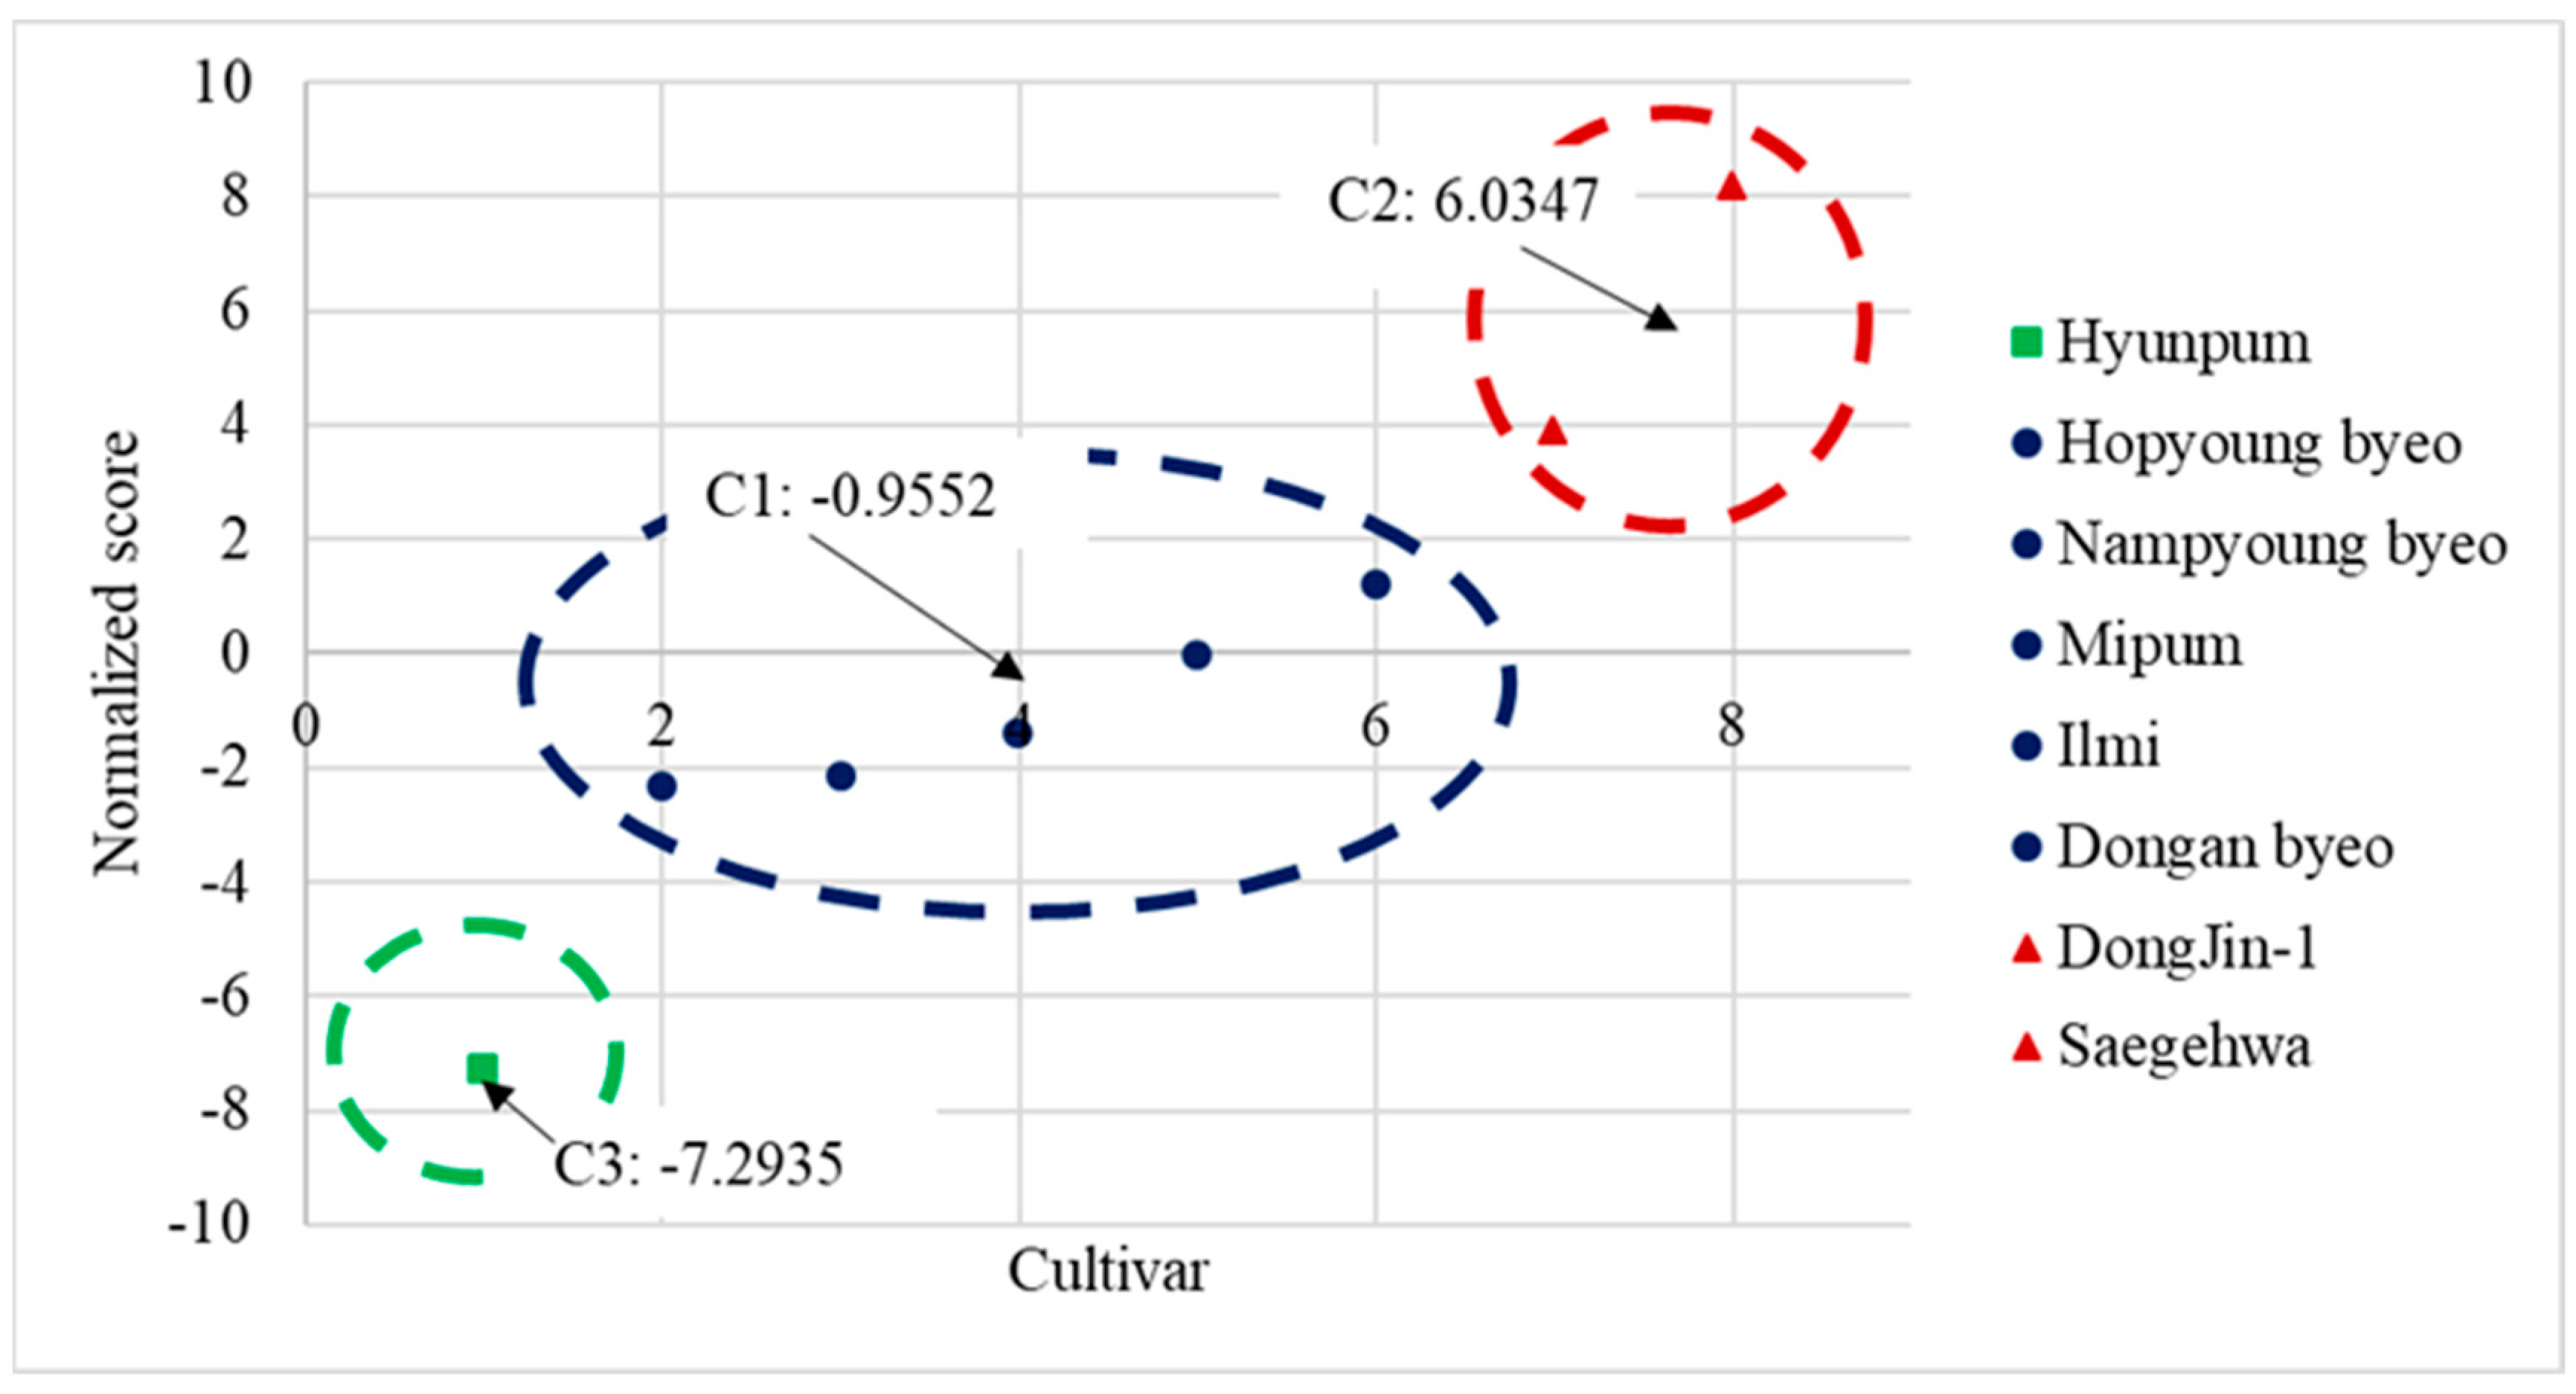
3.2. k-Means Clustering Analysis

Grouping the data of morphological characteristics and yield of rice collected from the field experiment of 2005–2020 with the k-means clustering algorithm resulted in three clusters, as shown in Figure 4. The result was achieved by conducting four iterations with the object value of 10.3633 (see Equation (1)). The threshold (θ) of the clustering was 12.00. Initial values of μ_1, μ_2, and μ_3 were 0.4364 (median between normalized max and normalized min), 8.1662 (normalized max), and −7.2935 (normalized min), respectively. Based on the results of data processing with k-means clustering, five rice cultivars were included in Group 1: Ilmi, Dongan, Nampyoung, Hopyoung, and Mipum. DongJin-1 and Saegehwa were in Group 2, while Hyunpum was in Group 3. Each group was significantly different at α = 0.10. The p-values of significance between Groups 1 and 2, between Groups 2 and 3, and between Groups 1 and 3 were 0.083, 0.083, and 0.085, respectively. Note that the numbers in Figure 4 show centroids of the three clusters.
Morphological characteristics and yield for all three clusters are summarized in Table 6 and Table 7, respectively. Group 1 took the longest time to flower among the clusters. Group 2 had the largest number of spikelets per panicle (110.26), spikelets per m2 (39.26 × 10³), and filled spikelets per m2 (35.83 × 10³). Group 3 had the tallest plant (77.54 cm) among the groups but the shortest length of inflorescence (19.82 cm).
Group 3 had the highest fertility rate (91.94%), while Group 2 had the lowest fertility rate (90.19%). Group 1 had the highest percentage of ripened grain (88.64%). Group 2 had the largest grain yield of unhulled rice (7.37 Mg ha−1), brown rice (6.17 Mg ha−1), and white rice (5.66 Mg ha−1), while Group 3 had the lowest grain yield.

3.3. Location–Allocation of Cultivar Groups

Based on the results from Section 3.2, ideal locations for cultivating the three cultivar groups where transportation cost could be reduced were identified via the optimization model addressed in Section 2.4. Note that Jeju-do in South Korea was ignored in this study because it only has 43 ha to produce all types of rice. As of 2020, the total harvested area of rice was 726,732 ha with production quantity of 3,631,000 tons in South Korea [16]. Selected cultivars accounted for 23.84% of total production. As mentioned in the Introduction, most harvested areas are located in Jeollanam-do, which is far from the metropolitan area (i.e., Gyeonggi-do) with 50.24% of total consumption (see Table 8). As shown in Table 8, Jeollanam-do is the furthest province from the metropolitan area, with an average distance of 238.38 km. Jeollanam-do produces 356,122 Mg year−1 of white rice (see Table 9). Its estimated transportation cost is $123,089,666, which accounts for 14.14% of the total revenue of $870,439,707. On the other hand, Chungcheongbuk-do with the minimum average travel distance of 145.25 km produces 11,507.86 Mg year−1 of white rice (see Table 9), and its transportation cost is $2,423,670, which only accounts for 8.62% of the total revenue of $28,127,784. These values imply that the transportation cost in existing locations of rice fields might be too high. Distance, unit transportation cost, and harvested area data (shown in Table 8) were used to determine optimal locations of the three cultivar groups.
Table 9 shows the attractiveness weight and demand for rice paddy fields in South Korea. The attractiveness was computed based on the proportion of existing harvested area of each group in the entire harvested area in each field. This study assumed that existing locations of rice paddy fields were determined by farmers who considered multiple factors, such as climate, soil type, and production and logistic costs, to maximize their profit (see Section 2.4). Group 1 (C1) is the most popular cultivar group in Gyeonggi-do (F1), Chungcheong-nam-do (F4), Jeollabuk-do (F5), Jeollanam-do (F6), and Gyeongsangnam-do (F8). On the other hand, Group 2 (C2) is a popular cultivar group in Gangwon-do (F2), Chung-cheongbuk-do (F3), and Gyeongsangbuk-do (F7). Group 3 is not a popular cultivar group in any province. In addition, according to Hong and Kwon [16], each Korean individual consumes about 59.2 kg of rice per year. Thus, the demand can be estimated by multiplying the population by an individual’s rice consumption. The population in each province is shown in Figure 5.
Figure 5a shows the distribution of rice paddy and other fields in South Korea. An area with yellow color represents rice paddy field, and an area with pink color represents other farming field. The estimated objective value of existing fields is approximately $13,648,336. The location–allocation result is shown in Figure 5b with an objective value of $13,406,015. Because the proposed approach tends to find locations of rice paddy fields depending on transportation cost to markets, it can reduce $242,321.34 from the existing objective value.
The results revealed that each group was fully allocated to a certain area with major markets to minimize the transportation cost of rice. For example, in the solution, Jellanam-do was calculated as producing 353,782.56 Mg year−1 of rice, and its transportation cost was $122,281,405, which is a reduction of $808,260 from $123,089,666 (Table 10). Rice paddy fields in Chungcheongnam-do and Jeollabuk-do were popular due to their accessibility to markets (i.e., Gyeonggi-do and Gangwon-do). In fact, these provinces are located in the middle of South Korea, so they have low average transportation costs. In addition, they have large rice paddy fields (i.e., 16,255.2 ha in Chungcheongnam-do and 18,745.1 ha in Jeollabuk-do). As shown in Table 10, Group 1 (C1) was mainly located in Jeollanam-do (63.87%) and Gyeongsangnam-do (34.99%) because of their attractiveness, travel distance to markets, and size of harvested area (see Table 8 and Table 9). Due to similar reasons, Group 2 (C2) was mainly located in Chungcheongnam-do (27.03%) and Jeollabuk-do (29.57%), while Group 3 (C3) was mainly located in Chungcheongnam-do (33.75%), Jeollabuk-do (33.06%), and Jeollanam-do (33.03%). Although Gyeonggi-do (i.e., metropolitan area in South Korea) was popular in Group 2 (98.22%), its size of rice paddy fields was way too small. Similarly, Gangwon-do is a mountainous area without enough rice paddy fields.
The total transportation cost of the proposed solution was $250,564,489, which is lower than the total transportation cost of $250,867,873 for the existing fields. In addition, the proposed solution can save annual travel distance of 209,203.4 km, which can potentially reduce 21.04 tons of CO2 emission from a freight truck [17]. Because certain fields are only able to cultivate a specific rice group (or cluster) due to weather or soil characteristics, the difference was only $303,384.03. This is 0.014% of the total revenue of $2,024,187,746. However, this study only considered eight cultivars that account for only 19.76% of the entire rice fields in South Korea. Thus, the impact of the proposed approach can be significant if we consider more cultivars. In addition, by having rice paddy fields close to their major markets, consumers are able to cook fresh rice with better taste.

4. Conclusions

A range of morphological characteristics and yield of eight rice cultivars that are commonly grown in South Korea were investigated at Jeollanamdo Agricultural Research and Extension Center in Jeollanam-do, South Korea, during the growing seasons of 2005–2020. Based on morphological analysis, the number of spikelets and the length of panicle were positively and moderately correlated with rice yield. Among the eight cultivars, Saegehwa and DongJin-1 produced high grain yield attributed to the higher number of spikelets per m2. Based on the dataset of measured morphological characteristics and yield, groups of similar cultivars were isolated using the k-means clustering method. Three groups (Group 1, Group 2, and Group 3) were created. High-yielding cultivars Saegehwa and DongJin-1ho were in Group 2. Hyunpum was the only cultivar in Group 3. Hyunpum was the cultivar with the lowest number of spikelets per panicle and the lowest number of spikelets per m2. Thus, Group 3 had lower yield than the other groups. Through field measurements and k-mean clustering, some useful characteristics of rice cultivars were identified. These might play a critical role in rice breeding. An optimized location–allocation model was developed to determine ideal location for cultivating the three cultivar groups so that transportation cost could be reduced. Based on simulation results, the southern region (i.e., Jeollanam-do and Gyeongsangnam-do) was appropriate for Group 1 and the central region (i.e., Chungcheongnam-do and Jeollabuk-do) was appropriate for Group 2. Group 3 was evenly distributed over the west central and southern regions (i.e., Chungcheongnam-do, Jeollabuk-do, and Jeollanam-do) in South Korea. These results could reduce $303,384.03 from the existing transportation cost of $250,867,873. In particular, Jeollabuk-do is the most popular province not only because it is close to the metropolitan area (i.e., Gyeonggi-do) with 50.14% of the total demand in South Korea but also because it is close to large cities in the southern regions. Moreover, unlike metropolitan areas, agriculture is a major industry in this province, so it should have enough rice paddy fields in the future.
The proposed location–allocation approach can contribute to enhancing farming profits and implementation of precision agriculture in practice. In addition, this approach can be applied to other countries. In most developed and developing countries, urban areas cannot meet their own demands for food crops and must rely on crop production in rural areas and transportation of food crops to the cities. Thus, this approach can be easily modified using information such as known cultivar characteristics, crop cost, cost incurred during transportation, and available agricultural land from interested countries and used for their supply chain management planning.
The aims of this study were to (1) identify some useful morphological characteristics that could increase rice yield potential, (2) identify rice cultivars using k-mean clustering, and (3) reduce transportation cost by selecting ideal farming locations for all rice clusters using an optimized location–allocation model. Results from this study can increase economic benefit for all beneficiaries of the rice supply chain. However, the simulation model developed in this study has some limitations. The production of the eight cultivars used in this study only accounts for 19.76% of the total rice production in South Korea. In addition, the yield data used in the model development was only estimated for Jeollanam-do. In future studies, the number of cultivars should be increased to improve efficiency of the model performance. Their yield characteristics should also be investigated in multiple locations in South Korea.

Author Contributions

Conceptualization, S.K. (Sumin Kim) and S.K. (Sojung Kim); methodology, K.A., S.K. (Sumin Kim), and S.K. (Sojung Kim); software, S.K. (Sumin Kim) and S.K. (Sojung Kim); validation, K.A., S.K. (Sumin Kim), and S.K. (Sojung Kim); formal analysis, S.K. (Sumin Kim) and S.K. (Sojung Kim); investigation, S.K. (Sumin Kim), K.A., S.S., H.M., and S.K. (Sojung Kim); resources, K.A, S.S., and H.M.; writing—original draft preparation, K.A., S.K. (Sumin Kim), and S.K. (Sojung Kim); writing—review and editing, K.A., S.K. (Sumin Kim), and S.K. (Sojung Kim); visualization, S.K. (Sumin Kim) and S.K. (Sojung Kim); supervision, K.A., S.K. (Sumin Kim), and S.K. (Sojung Kim); project administration, K.A., S.S., and H.M.; funding acquisition, K.A., S.S., and H.M. All authors have read and agreed to the published version of the manuscript.

Funding

This work was supported by the KEPCO Research Institute. It was also supported by the Dongguk University Research Fund of 2021.

Conflicts of Interest

The authors declare no conflict of interest.

References

  1. NARI, Northern Agriculture Research Institute, INC. The Green Revolution in Korea: Development and Dissemination of Tongil-Type Rice Varieties. Rural Development Administration. Available online: https://www.kdevelopedia.org/resource/view/04201210100122113.do#.YBaceugzbcc (accessed on 30 November 2020).
  2. USDA-FAS, United States Department of Agriculture—Foreign Agriculture Service. South Korea Rice Production. Available online: https://www.fas.usda.gov/data/south-korea-2020-rice-production-update (accessed on 30 November 2020).
  3. Rodrigue, J.-P. The Geography of Transport Systems; Routledge: New York, NY, USA, 2017. [Google Scholar]
  4. Weintraub, A.; Romero, C. Operations research models and the management of agricultural and forestry resources: A review and comparison. Interfaces 2006, 36, 446–457. [Google Scholar] [CrossRef]
  5. Daghighi, A.; Nahvi, A.; Kim, U. Optimal cultivation pattern to increase revenue and reduce water use: Application of linear programming to Arjan plain in Fars province. Agriculture 2017, 7, 73. [Google Scholar] [CrossRef] [Green Version]
  6. Wankhade, M.O.; Lunge, H.S. Allocation of agricultural land to the major crops of saline track by linear programming approach: A case study. Int. J. Sci. Technol. Res. 2012, 1, 21–25. [Google Scholar]
  7. Taha, H.A. Operations Research: An Introduction, 10th ed.; Pearson Education: Upper Saddle River, NJ, USA, 2017. [Google Scholar]
  8. Cooper, L. Heuristic methods for location-allocation problems. Siam Rev. 1964, 6, 37–53. [Google Scholar] [CrossRef]
  9. Kim, J.K.; Lee, S.Y.; Chu, S.M.; Lim, S.H.; Suh, S.C.; Lee, Y.T.; Cho, H.S.; Ha, S.H. Variation and Correlation Analysis of Flavonoids and Carotenoids in Korean Pigmented Rice (Oryza sativa L.) Cultivars. J. Agric. Food Chem. 2010, 58, 12804–12809. [Google Scholar] [CrossRef] [PubMed]
  10. Lee, J.H. Identification and quantification of anthocyanins from the grains of black rice (Oryza sativa L.) varieties. Food Sci. Biotechnol. 2010, 19, 391–397. [Google Scholar] [CrossRef]
  11. Kim, H.W.; Kim, J.B.; Cho, S.M.; Cho, I.K.; Li, Q.X.; Jang, H.H.; Lee, S.H.; Lee, Y.M.; Hwang, K.A. Characterization and quantification of γ-oryzanol in grains of 16 Korean rice varieties. Int. J. Food Sci. Nutr. 2015, 66, 166–174. [Google Scholar] [CrossRef] [PubMed]
  12. Sharma, N.; Khanna, R. Rice Grain Quality: Current Developments and Future Prospects. In Recent Advances in Grain Crops Research; Shah, F., Khan, Z., Iqbal, A., Turan, M., Olgun, M., Eds.; IntechOpen: Rijeka, Croatia, 2019. [Google Scholar] [CrossRef] [Green Version]
  13. Lloyd, S. Least squares quantization in PCM. IEEE Trans. Inf. Theory 1982, 28, 129–137. [Google Scholar] [CrossRef]
  14. Kim, S.; Son, Y.J.; Tian, Y.; Chiu, Y.C.; Yang, C.D. Cognition-based hierarchical en route planning for multi-agent traffic simulation. Expert Syst. Appl. 2017, 85, 335–347. [Google Scholar] [CrossRef]
  15. Li, R.; Li, M.; Ashraf, U.; Liu, S.; Zhang, J. Exploring the Relationships Between Yield and Yield-Related Traits for Rice Varieties Released in China From 1978 to 2017. Front. Plant Sci. 2019, 10, 543. [Google Scholar] [CrossRef] [PubMed] [Green Version]
  16. Hong, Y.K.; Kwon, J.Y. Estimation of Rice Production in 2020; Statistics Korea: Seoul, Korea, 2020. [Google Scholar]
  17. EDF. Green Freight Math: How to Calculate Emissions for a Truck Move. Available online: https://business.edf.org/insights/green-freight-math-how-to-calculate-emissions-for-a-truck-move/ (accessed on 13 January 2021).
Figure 1. An overview of the proposed research framework for location–allocation of rice farming sites.
Agronomy 11 00270 g001
Figure 2. Average temperature and total rainfall during the rice growing season (June–August) of 2005–2020 at Jeollanamdo Agricultural Research and Extension Center in Jeollanam-do, South Korea.
Agronomy 11 00270 g002
Figure 3. Plant height at transplantation date, mid-June, early July, mid-July, early August, and mid-August for all eight rice cultivars used in this study.
Agronomy 11 00270 g003
Figure 4. Visualization of k-means clustering based on normalization scores (C1: cultivar group 1, C2: cultivar group 2, and C3: cultivar group 3).
Agronomy 11 00270 g004
Figure 5. Location–allocation of rice paddy fields (Pop: population, C1 area: harvested area of group 1 in ha, C2 area: harvested area of group 1 in ha, and C3 area: harvested area of group 1 in ha).
Agronomy 11 00270 g005
Table 1. The main characteristics of all eight medium to late maturing rice cultivars used in this study.
VarietyMain CharacteristicsStudy Period
IlmiIlmi was developed from a cross between Milyang 95 ho and SumJin in 1989. Ilmi is resistant to rice blast disease and bacterial leaf blight. 2005–2020
DongJin-1DongJin-1 was developed from a cross between Hwayoung byeo and HR12800-AC21 in 2001. This variety is resistant to bacterial leaf blight. 2005–2013
DonganDongan was developed from a cross between Milyang 95 and the HR5119-12-1-5 line. This variety has strong resistance to rice stripe virus (RSV).2005–2011
NampyoungNampyoung was developed from a cross between Mageum and Milyang 95 in 1997. This variety has strong resistance to RSV and rice blast fungus. This variety is mainly planted in DaeJun in South Korea.2005–2017
SaegehwaSaegehwa was developed by the International Rice Research Institute (IRRI) in 2001. This variety is resistant to salt stress and bacterial leaf blight. 2005–2010
HopyoungHopyoung was developed by the National Institute of Food Science and Technology for the purpose of cultivating high-quality variety in 2003. This variety is resistant to rice white leaf blight and stripped leaf blight diseases.2009–2018
MipumMipum is mainly cultivated in inland plains south of Chungnam, South Korea. This variety has high rice quality and is resistant to stripped leaf blight disease. 2012–2020
HyunpumHyunpum is mainly cultivated in the southwest coastal area and plains south of Pyeongtak in South Korea. This rice cultivar has high eating quality and resistance to white leaf blight and stripped leaf blight diseases.2015–2020
Table 2. Nomenclature.
SymbolDefinition
C A set of cultivar clusters (or cultivar groups), C = { C 1 , C 2 , , C k   } .
M A set of markets, M = { M 1 , M 2 , , M m } .
P i A set of available locations for cluster i,   P i = { P i 1 , P i 2 , , P i n } , i C .
c i j Unit transportation cost from cluster i to market j, i C and j M .
q i j Attractiveness from cluster i to market j, i C and j M , 0 q i j 1 .
f i j Transportation quantity (or material flow) from cluster i to market j, i C and j M .
V i = ( a i , b i ) Coordinate of cluster i, i C .
Y j = ( a j , b j ) Coordinate of market j, j M .
d ( V i , Y j ) Euclidean distance between cluster i and market j, i C and j M .
Table 3. Number of days from transplanting to flowering date, number of panicles per m2, number of spikelets per panicle, number of spikelets per m2, number of filled spikelets per m2, height, and length of panicle for all eight rice cultivars used in this study. All cultivars were statistically compared at α = 0.005 for each trait.
Transplanting to FloweringPaniclesSpikeletsSpikeletsFilled SpikeletsHeightLength of Panicle
CultivarDays(No. m−2)(No. Panicle−1)×103 m−2×10³ m−2cmcm
Ilmi7533710535.5533.1576.2920.50
DongJin-17332911738.3034.8080.3720.62
Dongan7736010136.1432.6568.1620.47
Nampyoung7734210836.6032.7178.8319.79
Saegehwa7638810440.2236.8567.1720.68
Hopyoung7637110137.2833.9280.6619.84
Mipum8036810036.7733.0472.5120.30
Hyunpum743609634.1331.3777.5419.82
p-Value<0.0001<0.0001<0.00010.020.049<0.0001<0.0001
Table 4. Fertility rate, ripened grain, and grain yield of unhulled rice, brown rice (BR), and white rice (WR) of all eight cultivars used in this study. All cultivars were statistically compared at α = 0.005 for each trait.
Grain Yield
Fertility RateRipened GrainUnhulled RiceBRWR
Cultivar%%Mg ha−1Mg ha−1Mg ha−1
Ilmi92.7190.537.045.905.42
DongJin-190.8085.827.236.095.60
Dongan88.7688.047.386.175.65
Nampyoung89.3386.437.135.985.50
Saegehwa91.6384.837.356.185.68
Hopyoung91.0489.716.845.765.30
Mipum89.8188.517.035.855.37
Hyunpum91.9486.306.995.865.39
p-Value0.004<0.0001<0.00010.0001<0.0001
Table 5. Correlations of morphological variables with yield for all eight cultivars used in this study (numbers are shown in bold when correlation is significant. Correlation coefficients between 0.5 and 0.7 indicate moderate correlation between variables, while correlation coefficients between 0.3 and 0.5 indicated variables with weak correlation. Numbers are shown in bold when the absolute values are over 0.5).
No. Panicles Per m2No. Spikelets Per PanicleNo. Spikelets Per m2No. Filled Spiketes Per m2Plant HeightLength of PanicleFertility RateRipen Grain RateDays of Transplanting-FloweringUnhulled Rice Grain YieldBrown Rice Grain YieldWhite Rice Grain Yield
No. panicles per m21
No. spikelets per panicle−0.641
No. spikelets per m20.350.501.00
No. filled spiketes per m20.330.480.961.00
Plant height−0.600.34−0.30−0.311.00
Length of panicle−0.020.430.540.62−0.561.00
Fertility rate−0.01−0.01−0.050.200.220.121.00
Ripengrain rate−0.15−0.26−0.45−0.380.20−0.140.121.00
Days of Transplanting-Flowering0.43−0.44−0.01−0.18−0.46−0.14−0.660.201.00
Unhulled rice grain yield0.030.320.460.42−0.680.69−0.36−0.570.031.00
Brown rice grain yield0.020.390.510.49−0.620.68−0.30−0.60−0.080.991.00
White rice grain yield0.020.410.540.52−0.580.66−0.26−0.64−0.130.981.001.00
Table 6. Number of days from transplantation date to flowering date, number of panicles per m2, number of spikelets per panicle, number of spikelets per m2, number of filled spikelets per m2, height, and length of panicle for each cluster.
FloweringPaniclesSpikeletsSpikeletsFilled SpikeletsHeightLength of Inflorescence
ClassesDate(No. m−2)(No. Panicle−1)×103 m−2×10³ m−2cmcm
Group 177356102.7136.4733.0975.2920.18
Group 275358110.2639.2635.8373.7720.65
Group 37536095.3834.1831.3777.5419.82
Table 7. Fertility rate, ripened grain, and grain yield of unhulled rice, brown rice (BR), and white rice (WR) of each cluster.
Grain Yield
Fertility RateRipened GrainUnhulled Rice YieldBRWR
Classes%%Mg ha−1Mg ha−1Mg ha−1
Group 190.3388.647.095.935.45
Group 290.1986.437.376.175.66
Group 391.9486.306.995.865.39
Table 8. Distance matrix between rice paddy fields and markets.
Fields 1Markets 1TransportationHarvested Area (ha)
M1M2M3M4M5M6M7M8Avg. Distance (km)Cost ($ Mg−1)
F11112098133225328195280173.7525220.8
F21207174242326430224350234.133391.4
F3981746102158262153209145.252112041.7
F41332421028149245250251172.5025016,225.2
F52253261581499113242137169.8824618,745.1
F632843026224511315341173238.3834664,699.8
F719522415325024234116187201.002919809.1
F82803502092511371731878199.3828938,397.5
1 F1: Gyeonggi-do, F2: Gangwon-do, F3: Chungcheongbuk-do, F4: Chungcheongnam-do, F5: Jeollabuk-do, F6: Jeollanam-do, F7: Gyeongsangbuk-do, and F8: Gyeongsangnam-do.
Table 9. Attractiveness weight and demand for rice paddy fields.
Fields 1C1 2C2 2C3 2Yield of WR 3
(Mg)
Revenue
($)
Demand
(Mg)
F10.900.090.02113.78278,1041,580,299.72
F20.200.800.007.9719,491477,963.51
F30.010.980.0111,507.8628,127,784307,376.88
F40.610.390.0089,596.34218,993,57292,385.80
F50.700.300.00103,186.93252,212,02497,130.68
F60.690.300.01356,121.01870,439,706238,850.57
F70.150.850.0055,045.69134,544,033109,637.87
F80.540.460.00212,571.73519,573,030200,313.62
1 1: Gyeonggi-do, 2: Gangwon-do, 3: Chungcheongbuk-do, 4: Chungcheongnam-do, 5: Jeollabuk-do, 6: Jeollanam-do, 7: Gyeongsangbuk-do, and 8: Gyeongsangnam-do. 2 C1: cultivar group 1, C2: cultivar group 2, and C3: cultivar group 3. 3 WR: white rice.
Table 10. Analysis of the optimized locations of rice paddy fields.
Fields 1C1 2
(Mg)
C2 2
(Mg)
C3 2
(Mg)
Yield of WR 3
(Mg)
Revenue
($)
Transportation Cost ($)
F10.0020.450.37117.35286,83829,566
F20.001.420.008.0319,6262726
F30.002041.710.0011,51528,145,8362,425,225
F40.0015,930.68294.5591,437223,491,80822,871,060
F51025.4817,431.09288.51105,453257,751,39325,975,242
F657,563.446848.09288.26353,783864,724,019122,281,405
F70.009809.090.0055,323135,222,43916,123,961
F831,537.506859.030.97210,506514,524,98660,855,305
1 F1: Gyeonggi-do; F2: Gangwon-do; F3: Chungcheongbuk-do; F4: Chungcheongnam-do; F5: Jeollabuk-do; F6: Jeollanam-do; F7: Gyeongsangbuk-do; and F8: Gyeongsangnam-do; 2 C1: cultivar group 1; C2: cultivar group 2; and C3: cultivar group 3; 3 WR: white rice.
Publisher’s Note: MDPI stays neutral with regard to jurisdictional claims in published maps and institutional affiliations.

