Abstract
Potato (Solanum tuberosum) production generally requires added nitrogen (N), which is costly and potentially environmentally damaging. One path to limiting N application is breeding N efficient potatoes. Effective use of nitrogen, across crops, is typically characterized in terms of yield. However, tuber quality characteristics affect potato marketability, especially for red fresh market potatoes. While optimal N rates maximize yield, the genotype-specific effect of N on tuber quality traits is unclear. In order to highlight quality traits effected by N, identify germplasm with lower N requirements, and determine optimal N rates for red-skinned clones, we conducted a variable N rate experiment over two years in Minnesota. Eight red fresh market genotypes were grown in RCB factorial design with five nitrogen application rates ranging from 0 to 81.6 kg/ha. Best linear unbiased estimates were calculated for yield, skin color, skin set, and tuber shape. The models for yield and quality traits included significant genotype by N rate interaction effects, suggesting that there is variation in the way clones respond to N. Established varieties were more responsive to added N than breeding lines. Similarly, established varieties tended to produce more oblong tubers under higher N conditions, while the breeding lines remained round. Color traits also responded to N in a genotype-specific way, while the interaction effect for other traits depended on unmeasured environmental factors. No clone exhibited increased yield above the 54.4 kg/ha rate. Our results suggest that the 81.6 kg/ha rate produced less favorable phenotypes for all traits.
1. Introduction
Maximization of crop yields requires nitrogen (N) fertilization. However, N overfertilization is costly not only to the grower, but also to the environment. Overfertilization is a source of nitrous oxide (N2O), which is both a greenhouse gas and depletes stratospheric ozone [1]. Additionally, excessive N in groundwater causes the eutrophication of lakes, rivers, and streams, disrupting aquatic ecologies. Most notably, agricultural runoff has been implicated in the 8500 km2 “dead zone” found in the Gulf of Mexico, adjacent to the Mississippi Delta [2]. In addition to being an environmental disaster, the “dead zone” is negatively affecting commercial fisheries [3].
The release of nitrogen into the environment is a problem with standard cultivation practices for a variety of crops. The effects of variable timing, spacing, and rate of N fertilizer application has been studied in wheat (Triticum aestivum) [4,5], barley (Hordeum vulgare) [6], sugar beet (Beta vulgaris) [7], safflower (Carthamus tinctorius) [8], potato [5,9,10,11,12,13], and many other crops. However, changes in management can make limited progress without corresponding changes in the genetics of the crops themselves [14]. A complimentary approach to limiting N loss from cropping systems is breeding crops that produce comparable yield with lower added N.
The relationship between N and yield characteristic of a plant is often characterized as nitrogen use efficiency (NUE). The specifics of NUE calculations depend on the crop, but in general it is a measure of yield per unit of added or available nitrogen [15]. Many of the models for NUE were developed in maize (Zea mays). Maize is perhaps the crop where NUE research is most abundant beginning as early as the early 1960s before environmental impacts were a popular concern [16]. At that time, fertility recommendations specified a minimum N application rate to maximize yield. More recently, with the introduction of precision fertilizer applicators, NUE research in maize has shifted to making recommendations that also consider a maximum application rate. Some of this shift was driven by environmental and energy conservation concerns [17,18]. The ever-increasing size of maize grower operations is also driving this shift because production is dependent on an economy of scale to maximize grower profits, making the optimization of N fertilization important to the grower’s bottom line [19]. Models for NUE have since been expanded to a variety of other crops including canola (Brassica napus) [20], cotton (Gossypium hirsutum) [21], rice (Oryza sativa) [20,22], and wheat [23,24].
Potato is the third most cultivated food crop [25], and the most important vegetable in the world [26]. It produces more food, energy, and protein on a per hectare and per unit of water basis than all other major food crops [27]. Potatoes are crucial to the diet and economy of the US, where they are an intensely managed, high-value crop. They are often grown on irrigated sandy soils, requiring extensive inputs. Because of their shallow rooting system, potatoes only take up 30–60% of applied N [28]; the rest is lost to the environment. Recommendations for N fertilization are published by universities and extension authorities. In Minnesota, the recommended soil N level for potatoes at planting is 224 kg ha−1 [29], though much of this is lost to the environment.
The limits of reducing N loss to the environment through management practices alone are particularly clear in potato where much of the below-ground biomass is removed from the field at harvest and no-till management is not possible. This makes nitrogen efficiency a particularly compelling breeding goal [14]. The study of NUE in potato is ongoing for the same economic and environmental reasons as it is in maize. Potato-specific nitrogen use efficiency (NUE) is the ratio of yield of tubers per unit of N applied [30]. Zebarth et al. [31] reported that NUE declined in a curvilinear fashion as N supply increased in 20 commercial russet cultivars. However, Getahun et al. [32] reported significant genetic variances for NUE and its component parts, as well as strong GxE interactions. NUE is a complex trait with multiple physiological and phenotypic facets, which complicates breeding [33,34,35,36,37].
The tuber yield component of NUE is better understood as marketable yield. A variety of quality traits determine whether or not a potato is salable; these traits depend on market class. Potatoes are grown for myriad end uses ranging from industrial to human food. The resulting market classes are defined by traits most required for those uses. Red table stock potatoes are primarily consumed fresh and are an important market class for Minnesota growers. Essential quality characteristics for red table stock potatoes are deep red color, round shape, smooth skin finish, and size. While skin traits are important for all potato market classes, they are particularly crucial for reds because they are a primary factor in grading by brokers and commercial buyers. Appearance is also central to the acceptance of reds by consumers in grocery stores and farmer’s markets.
Availability of N is likely to effect quality traits. In processing potatoes, N influences specific gravity, sugar content, tuber size, hollow heart, and scab severity [38,39]. We suspect an effect of N on skin set because excess N delays vine maturity [40], and vine maturity is a key factor in determining skin set [41]. Furthermore, N effects tuber lightness [42].
It is useful to describe the yield to high-quality yield paradigm that is sometimes beyond the scope of N management studies. This paradigm in its simplest form can be stated as the grower wishes to produce the highest yield of high-quality tubers. In the case of red table stock potatoes that means dark red, moderately sized, low skinning, round tubers. N rate recommendations that do not consider these quality traits in conjunction with total yield are of little use. For the purposes of this study, in order to encompass the range of potential traits affected by added N, we primarily examine N response outside the yield-focused framework of NUE.
The objectives of this experiment were to evaluate the effects of varying N rates on red table stock potato yield and quality, identify tuber quality traits effected by N rate previously not evaluated in the context of NUE, and identify clones that may require less added N.
2. Materials and Methods
2.1. Plant Material
In 2018 the commercial varieties Chieftain [43], Dark Red Norland, Red LaSoda, and Red Norland [44] along with the advanced breeding lines MN12009PLWR-02R (MN1), MN12054PLWR-02R (MN2), MN12054PLWR-03R (MN3), and ND6002-1R (ND1) were evaluated (Table 1). All the genotypes were red skinned with white flesh, intended for fresh market consumption. The named varieties are four of the five red potato varieties most commonly grown in MN and within the top eleven most popular varieties of any type grown in Minnesota [45]. Both Red Norland and Dark Red Norland are line selections from Norland selected for superior skin color. Although both are commonly grown, more than twice as much Dark Red Norland seed was produced in Minnesota in 2020 [45]. The Norland selections are early maturing potatoes generally harvested 70–90 days after planting, while Red LaSoda and Chieftain are slightly later, typically harvested 80–100 days after planting. The numbered clones are soon to be considered for release and were selected based on availability of seed. Selected clones were developed at two time points approximately 50 years apart.

Table 1.
Names, year of release (or cross for advancing selections), and parentage of eight potato clones.
2.2. Cultivation Practices
Field plots were located at the University of Minnesota Sand Plains Research Farm at Becker, MN, in both 2018 and 2019. Generally speaking, plot management followed standard agronomic practices common to potato production in the sand plains region, with the exception of fertilizer application rate. Both sites were on flat, excessively drained, Hubbard–Mosford complex, loamy sand soil [46] with ~1.7% OM, ~5.0 pH, prior to planting in 2017 [42].
The plots were planted by hand in furrows opened by a Kverneland two-row planter in an 8 × 5 factorial arrangement in 2018 and a 7 × 5 in 2019. The first factor was the potato genotypes; the second factor was N application rate. Both trial years were planted in a randomized complete block design with four replicates. Potato clones were planted in 4.57 × 0.9 m 20-hill rows. Each plot consisted of four adjacent rows, of which the center two were harvested. Planting dates were 10 June 2018 and 13 June 2019. Hilling was 21 and 30 days after planting (DAP) in 2018 and 2019, respectively. Pesticides were applied to control the predominant regional insect pests, fungal, and bacterial diseases.
Phosphate and potash were broadcast applied and incorporated with a disk plow prior to planting at the following rates to establish base fertility: 224 kg ha−1 of 0-0-60 potash; 224 kg ha−1 of 0-0-22 K-Mag; 336 kg ha−1 0-46-0 phosphate. Plots were amended with side-dressed urea (46-0-0) at hilling (approximately 20–24 days after planting) to establish rates of total applied N: 20.4, 40.8, 54.4, and 81.6 kg/ha. No N fertilizer was applied at side-dress to the 0 N rate treatment. Irrigation was applied throughout the season to maintain the plots at 80% of field capacity.
Plots were harvested using a Grimmie model LK 650 one-row potato harvester after being chemically desiccated at 90 days after planting (DAP). Tubers were graded by a mechanical grader at the USDA Potato Research Laboratory in East Grand Forks, MN, into USDA small (<6.35 cm), medium (6.35 cm to 8.26 cm), and large (>8.26 cm) diameters [47]. We took yield measurements by size class for each plot, and we summed those measurements to determine total yield.
2.3. Tuber Quality Traits
Tuber quality data were collected from images captured in a lightbox of a grid of ten tubers as described by Caraza-Harter and Endelman [48]. From these images several measures were observed on individual tuber samples. Image analysis was performed using in-house R scripts with the EBImage package [49]. Images were read in, resized, and transformed from RGB to L*a*b color. Then, images were segmented dividing tubers from background. A minimum object size was enforced to eliminate soil and debris.
These traits and their component measures were intended to evaluate color, size, and shape of tubers. For red table stock potatoes, the industry prefers USDA size A spherical tubers. There is no simple generally accepted way to evaluate sphericalness of a 2D image, and so we used three proxy measures. The simplest measure is length-to-width ratio. We first drew a minimum bounding box following the methodology of Si et al. [50], and length and width were calculated based on that box. This is a measure of circularity, with numbers closer to one being more ideal.
Compactness and roundness are two different measures of how well the tubers fit the expectation of a circle. Both depend on perimeter and area. Although, for roundness the convex hull is used to calculate these values. In both cases a circle is the ideal shape and would take a value of one. The equations are as follows:
Skin set and color are also essential quality traits for red potatoes. Our in-house R script quantifies skinning of red potatoes by setting a range of potential cut off values to distinguish between skin and exposed flesh and calculating the resulting percent skinning for each tuber. A sigmoid curve is then fit to the set of ten resulting curves, and a cut off value is identified. A high skinning value indicates that much of the skin of a tuber sloughed off during harvest due to insufficient skin set. No special efforts were made to remove skin, so the skinning value represents skin loss during harvest, storage, and grading. A skinning value of zero indicates no skin was sloughed off during harvest, and the skin set was ideal for marketable tubers. We measured two components of skin color using CIE L*a*b color values, lightness, and redness. Lightness (L in the L*a*b color space) is a measure of lack of pigment, and in the context of this study, a high value indicates a paler red color. Redness (a in the L*a*b color space) is measured on a red to green scale with higher values being redder. In both cases the reported value is the median of pixels in non-skinned tuber area. Dark red color is ideal for red fresh market potatoes [51].
2.4. Statistical Analysis
All phenotypes were analyzed using a combination of linear models. For the quality phenotypes, measurements were taken on ten individual tubers and averaged. For yield phenotypes, plot-based measures were taken. For each trait we first constructed a linear model for each year separately in the following form:
where Y is the phenotypic value of an individual of j clone (C) at i nitrogen level (N) in block (B) k. μ is the intercept, and e is error. We analyzed these models using an ANOVA. Coefficients of variation were calculated for each year, and if both were under 20% they were combined into a single multiyear model of the following form:
where Y is year, and block is nested within year. An ANOVA was performed, and terms not significant in the ANOVA were eliminated before further analysis to prevent over fitting. The final model for each trait is listed in Table 2.
Table 2.
Linear models for calculating BLUEs.
Broad sense heritability was calculated as
where is error variance, is genetic variance, is genotype by environmental variance, r is the number of replications, and e is the number of environments.
All data were analyzed in Rv4.0.2 “Taking Off Again” [52]. Best linear unbiased estimates (BLUEs) were calculated using a mixed restricted maximum likelihood approach (REML) [53] in the package lme4 [54]. Block and year were treated as random effects, while N level and clone were fixed. Least squared means (LSMs) and contrasts were calculated using the package emmeans [55]. Tidyverse [56] and ggplot2 [57] were the primary packages used to manipulate and visualize data.
NUE was calculated based on characteristic yields for a variety within a year. For 2018 these yields were determined with BLUEs, while LSMs were used for 2019 when replication did not have a significant effect. Yield measurements were taken from 8.36 m2 plots, while added N is reported on a ha basis. BLUEs/LSMs were multiplied by 1196 before being divided by the weight of added N. NUE cannot be calculated for the 0 rate, as a number divided by 0 is divergent.
3. Results
3.1. Yield
Yield was measured within size classes on a per plot basis. Total yield is the sum of the three individual size classes. We calculated yield at each N rate by adding all clone plot yields together. Coefficients of variation (CV) for analysis of individual years were high (23.5%, 2018 and 40.0%, 2019) and prevented us from combining years (Table 3 and Table 4). The highest yields were observed above 40.8 kg/ha in 2018 (p < 0.001, Figure 1, Table 3.) and above 20.4 kg/ha in 2019 (p < 0.05, Figure 1, Table 4.). Only the lowest N rates produced significantly lower yields. The effect of N rate was significant in both 2018 (p < 0.001) and 2019 (p < 0.05; Table 2.).
Table 3.
ANOVA for plot yield and tuber traits for 2018 and 2019 separately.
Table 4.
ANOVA and broad sense heritabilties for tuber traits analyzed over 2018 and 2019 combined.
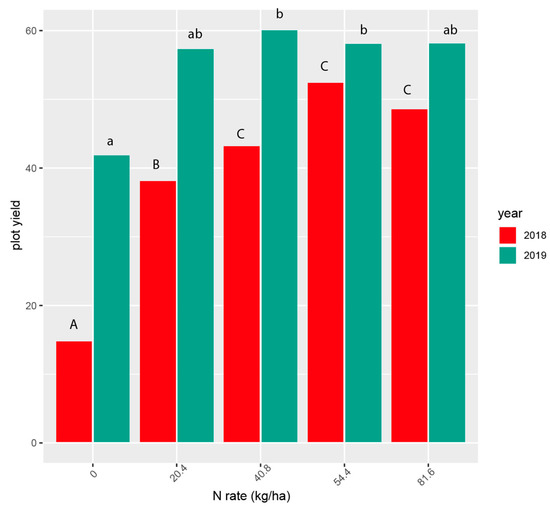
Figure 1.
Total yield of all tubers combined at five nitrogen rates in 2018 and 2019. Yields with the same letters are not statistically different (p < 0.05). Contrasts (Supplemental Contrasts S1a,b) were performed separately for each year; upper and lower case letters indicate different tests and are not comparable.
There was a significant clone effect (p < 0.001) on total yield in both years (Table 3). Additionally, in 2018 there was an interaction effect between clone and N rate (p < 0.001). That effect disappeared in 2019 (p = 0.0853). Figure 2 shows the plot yields of the 8 clones in each year individually (15 clone/year combinations). The highest yields were for Dark Red Norland (54.4 N rate) and Red Norland (40.8 N rate) in 2019 (Figure 2). The lowest yields were for Chieftain (0 N rate), and MN3 (0 N rate) in 2018.
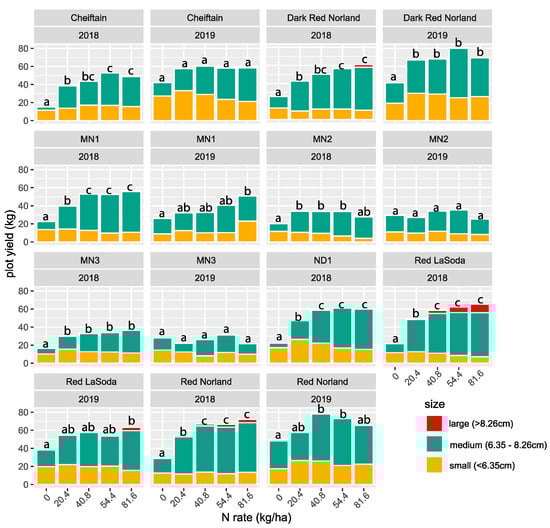
Figure 2.
Tuber yield for eight clones for 2018 and 2019 partitioned by size class. Total yields with the same letters within the same clone and year are not significantly different (p < 0.05, Supplemental Contrasts S2a,b).
For 11 of the 15 clone/year combinations the highest yield was at the 81.6 N rate (Figure 2). Red LaSoda and MN1 had their highest yield at 54.4 kg N, but it was not significantly different from the yield at 40.8 kg. The plots with no added N almost always had the lowest total yield. In 2018, when we observed a significant genotype by environment interaction, MN2 and MN3 exhibited an increase with the addition of N, but no significant difference was found between N levels. The other varieties followed the general pattern of a notable increase with any addition of N and then another significant increase in yield for higher values, resulting in two or three significant categories of yield (i.e., a vs. b or a vs. b vs. c)
Yield by size class followed a similar pattern to total yield with significant genotype effects in both years and significant interaction effects only in 2018. In 2019, when there was no genotype by N rate interaction, N rate was a significant determinant of yield of mediums and larges.
For most treatments the majority of tubers produced were medium. The EMM contrasts for medium tuber yield showed many significant differences within clones in 2018 and to a lesser degree in 2019 (Supplemental Contrasts S4a,b). In 2018 the medium tuber yield at the 0 N rate was always significantly (p < 0.05) lower than all the other rates (Supplemental Contrasts S4a). For six of the eight clones the 20.4 N rate yielded significantly (p < 0.05) fewer mediums than the 81.6 rate in 2018 (Supplemental Figure S1). Note also that in none of the clones was the medium tuber yield at the 81.6 N rate significantly different than at the 54.4 N rate, and for only one was it significantly different than the 40.8 N rate.
In 2019, none of the clones had their highest medium tuber yield at the 81.6 N rate (Supplemental Contrasts S4b). There were no statistical differences between the 40.8, 54.4, or 81.6 N rates for any of the clones in 2019 for medium tuber yield. In none of the clones, in either year, was there a significant yield advantage of medium tubers for the 81.6 rate over the 54.4 rate. At both the 54.4 and 81.6 rates, five of the nine clones that had significantly different medium tuber yields were cultivars.
In general, lower N rates produced smaller tubers. The yield of small tubers was never greatest for any clone in 2018 at the 81.6 rate. MN3 and ND1 had significantly higher yield of small tubers at the 20.4 rate than the 81.6 rate (Supplemental Contrasts S5a). There were no significant small tuber yield differences within clones in 2019 (Supplemental Contrasts S5b).
Few large tubers were produced at any of the N rates for any of the clones. The only clones that had significantly different yields for large tubers in either year were cultivars, and this was at the 81.6 N rate.
3.2. NUE
For all varieties in both years NUE decreased as N rate increased, with the most stark differences between the 20.4 kg/ha rate and higher rates (Figure 3). It was not possible to consider the 0 kg/ha N rate because NUE is calculated by dividing yield by added N, and 0 as a divisor produces a divergent result. The smallest differences were between intermediate N rates in low-yielding clones.
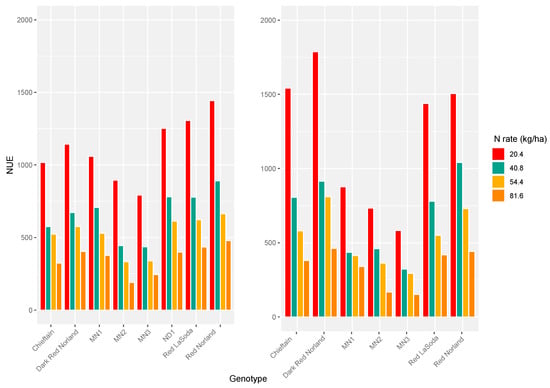
Figure 3.
Nitrogen use efficiency (NUE) for each clone at each level of added N over 0 in 2018 and 2019. The 2018 values are calculated using BLUEs for yield, while the 2019 values are calculated using LSMs.
3.3. Tuber Shape
We hypothesized that N would impact tuber shape in a similar way to size, as tuber shape can change during bulking. To that end we evaluated three measures of tuber shape: roundness, compactness, and length-to-width ratio. For all of these measures a perfect sphere would score 1. Low CVs allowed us to analyze both years of data together for each of the three traits (Table 3). For roundness and length-to-width ratio there were significant differences between clones, N rates, years, and replicates (Table 4). Further, all two-way interactions tested were significant for roundness. Length-to-width ratio had a significant clone by N rate (p < 0.001) and clone by year (p< 0.001) interaction. We also observed significant N rate (p < 0.001), clone (p < 0.001), and clone by N rate interaction (p < 0.01) effects for compactness. However, no other effects were significant. The results for all three traits suggest substantial genotype x environmental interaction in determining tuber shape.
BLUEs were calculated using the mean of the ten tuber sample for all three traits. For six of the eight clones, the lowest roundness and compactness scores were at the 81.6 kg N rate. These clones also had the highest length-to-width ratios at 81.6 kg N (Figure 4). For four of these clones the highest roundness scores were at the 0 kg N rate, and these were significantly different from the 81.6 kg rate (Figure 4, Supplemental Contrasts S6). Three of the eight clones had significant differences between BLUES for length-to-width ratio at the 0 and 81.6 kg rates (Supplemental Contrasts S7, Figure S4). Red Norland, Red LaSoda, and Dark Red Norland all produced tubers that were less spherical at higher N levels. The five breeding lines produced tubers that were equally spherical at higher N levels, with MN2 producing slightly rounder tubers at 81.6 kg N.
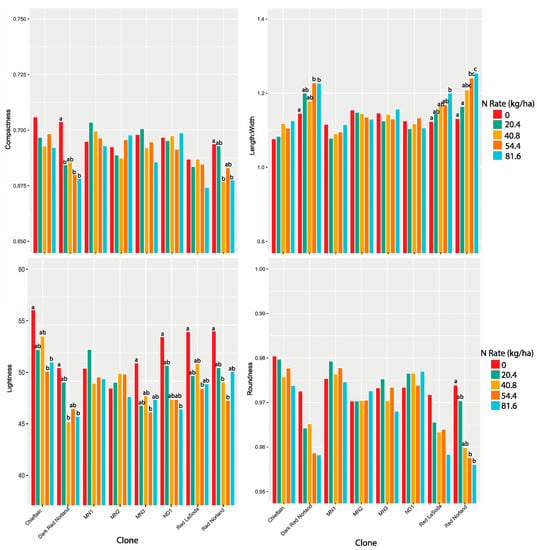
Figure 4.
Compactness, length-to-width ratio, lightness, and roundness BLUES for eight potato clones for 2018 and 2019 combined. The same letters for each clone are not statistically different.
3.4. Skin Color
We analyzed skin color in the L*a*b color space. Specifically, lightness (L) and redness (a) were measured. CVs suggested that lightness data could be pooled across years while redness could not (Table 3). The effects of clone and clone by N rate interaction were significant for lightness and redness in 2018 and 2019. N rate had a significant effect on lightness and on redness in 2018, but not 2019. These results suggest a GxE effect on skin color.
In 2018, seven of the eight clones had the highest redness scores at either the 40.8 or 54.4 kg rate. No clone had a significantly highest redness value at 81.6 kg (Figure S4, Supplemental Contrasts S9a). In 2019, five of the seven clones had their highest redness values at the 40.8 or 54.4 kg rates, and one, MN2, at 81.6 kg. However, only MN2 had significantly different redness values (Supplemental Contrasts S9b). Lightness followed a similar trend (Supplemental Contrasts S10) for Dark Red Norland and Red Norland, with the 0 rate being the lightest, and 54.4 and 81.6 kg rates being not statistically different (Figure 4). In addition to Dark Red Norland and Red Norland, four more of the eight clones had their lowest lightness values at the 81.6 kg N rate. However, none of these six was significantly lighter at the 81.6 rate than at the 20.4, 40.8, or 54.4 kg rates. Notable also is that for the two clones that were not lightest at the 0 rate, there was no significant difference between any of the rates.
3.5. Skinning
ANOVA was performed on skinning means for both 2018 and 2019 individually in order to test the appropriateness of combining the data for the two years. ANOVA showed high CVs of 43.2 and 62.1 (Table 3) for 2018 and 2019, respectively, suggesting that a combined analysis was not appropriate. The clone effect was highly significant (p < 0.001) in both years. No interaction terms were significant in 2018, although the clone x N rate interaction was significant (p < 0.01) in 2019.
The BLUEs for skinning in 2018 showed little variation and no obvious trend for N rate effect (Supplemental Contrasts S11a). In 2019 three clones had significant N rate differences (Supplemental Contrasts S11b). The most notable commonality between clones is that the highest N rate never resulted in the least skinning (Supplemental Figure S2).
4. Discussion
4.1. More N Is Not Necessarily Better
The primary justification for high N application rates, for nearly all crops, is the belief that this practice will increase overall yield. Our observations were consistent with that justification, but only up to the 54.4 kg/ha rate. This suggests that in our trial the 81.6 kg/ha N rate was excessive. We saw yield increases up to the 40.8 kg/ha N rate for all clones except Dark Red Norland (Figure 2.). For Dark Red Norland the highest yield was achieved at the 54.4 kg/ha N rate. These results clearly show that for these clones, in these environments, the 81.6 kg/ha N rate was not beneficial for increasing yield. Because N leaching precipitation events are features of daily weather, they are unpredictable. Therefore, many growers apply N in excess so that an unexpected or untimely rain event does not leave insufficient soil N for optimal crop growth. Our data show that the highest N rate actually decreased yield for all clones combined (Figure 1), and for all clones except Red LaSoda, when clones are separated (Figure 2). Differences in yield between genotypes in Figure 2 suggest that N response is variety specific. It is important to note that soil N at the research station can be as high as 70 kg/ha before fertilization. We discuss only applied N, although pre-existing soil N presumably affects yield as well.
Previous studies report similar findings where the presence of a relationship between N and yield depends on the level of N being compared. Boydston et al. [40] reported no N rate effect on tuber skinning, size distribution, and weight loss in table stock potatoes. Makani et al. [58] also reported a significant yield increase for table stock potatoes when N rate was increased from 0 to 224 kg/ha. Jones et al. [42] observed higher yield at 81.6 kg N than 40.8 kg N in red potatoes, but they did not observe variety-specific interactions and generally found more year-to-year stability in quality traits at low N. Similarly, Ospina et al. [59] found high-yielding clones were higher-yielding at both high and low N. More research using red potatoes corroborating our observations of yield, skin, and shape traits could allow agronomists to recommend against this insurance policy strategy, allowing growers to maintain high yields, improve crop returns by lowering input costs, and do less damage to the environment.
4.2. Quality Traits Should be Considered When Assessing How a Clone Responds to N
We observed an inverse relationship between applied N and NUE (Figure 3), which is consistent with previous studies [42,60]. The calculated NUE values reflect NUE in its simplest form, tuber yield per unit N input. This generalized formula was originally developed in grain crops, where yield is the primary, if not exclusive, concern. However, for vegetable and fruit crops, quality traits substantially contribute to marketable yield. In theory a numerical value like NUE could be calculated for quality traits representing the increase in quality per unit of applied N, and these could be combined to form a composite value. However, this calculation would necessarily involve weighting the relative importance of various traits and thus function more like a selection index than a descriptive value. Instead, we propose measuring response to N in a suite of traits including yield when describing the way in which a clone responds to N. Identifying traits effected by N as we have done here for red fresh market potato is a first step in that process.
We evaluated size distribution, skin color, skin set, and tuber shape in order to determine if these traits are affected by N availability in a genotype-specific way. Shape (roundness, compactness, and length-to-width ratio) and color (lightness and redness) traits all had a significant interaction effect across all years. However, the tuber size profile and skinning appear to be dependent on other environmental factors, with the significant N level effects or genotype by N level interactions occurring in one year but not the other.
In general, tubers grown at lower N rates were rounder, while those produced at the higher N rate were more oblong. In the U.S. consumers prefer round table stock tubers. Chieftain and all four breeding lines maintained their round shape regardless of added N. Red Norland, Dark Red Norland, and Red LaSoda all became more oblong with added N. This effect was significant for all three measurements of shape in Red Norland, for compactness and length-to-width ratio for Dark Red Norland, and for length-to-width ratio for Red Norland. We hypothesize that as tubers got larger, they also got more oblong. We observed only clones that produced tubers with high length-to-width ratios, and low roundness values, also produced large (>8.26 cm) tubers. This supports our hypothesis that as tubers got larger, they also got more oblong and less round. Furthermore, yield was low in the Minnesota breeding lines and higher in lines producing oblong tubers. However, yields for ND1 and Chieftain were comparable to the other commercial varieties, suggesting that there is the potential to select for high-yielding varieties without a strong tuber shape response to N. Tuber shape does appear to be genetic; we observed high heritabilities of 74.9 and 77.45 for length-to-width ratio and roundness, respectively, and there is at least one well-characterized genetic locus controlling tuber shape (Table 4) [61].
For a grower, size distribution has a major impact on the marketability of their crop. Therefore, recommendations on how to maximize the yield of a particular size class is of interest. Individual size markets vary considerably within a year, and between years, such that making consistent statements about which size classes are profitable is impossible [62]. However, one need only visit the produce aisle to see red potatoes packaged by varying size and intended use. It is possible to use row spacing to manipulate size distribution [63]. It is also the case that breeders include recommendations on N application based on their observations during the cultivar development process, that will optimize tuber quality [64,65,66]. Nitrogen affected size distribution in both years of our experiment, but there were only genotype-specific responses to N in 2018. In general, increasing N rate increases tuber size [42,60]. Because variety by N level interaction can be masked by environmental effects, care must be taken when including size distribution in evaluation of NUE.
In addition to size profile, skin traits greatly influence potato marketability. In the U.S. a dark red color is favored by consumers. The redness values we generated are on a scale from green (negative) to red (positive). Lightness measures are on a scale from black (0) to white (100). There was a significant genotype by N level effect for these traits. For redness, there was a much more dramatic effect in 2018 than 2019. In 2018 three varieties got redder as N increased, three peaked at 40.8 or 54.4 kg, with a lower value for 81.6 kg (Figure 5) rate, one maintained the same color regardless of N level, and one had a less clear pattern. All of these effects disappeared in 2019 with one variety exhibiting less redness at intermediate N rates. This suggests that other environmental factors mediate the genotype-specific response to N. This is consistent with Jones et al. [42], who found no significant N rate effect on redness.
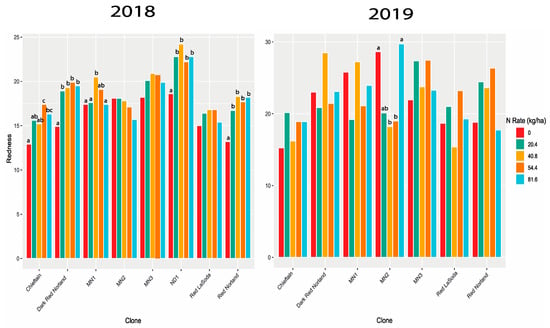
Figure 5.
Redness BLUEs for eight potato clones in 2018 and seven clones in 2019. The same letters for a clone are not statistically different at p < 0.05.
The genotype-specific effect of N on lightness was consistent across years. All but two varieties exhibited increasing lightness at higher values of N. Jones et al. [42] observed the same pattern across all red fresh market varieties they tested. However, we identified two lines that did not follow the expected pattern: MN1 and MN2. This highlights the possibility of selecting for varieties that do not get lighter with the addition of N.
Skinning is not only an important trait for consumer preference, it also influences the storability of a potato crop. Skinned tubers are more susceptible to storage diseases. Skinned tubers will suberize under optimal storage conditions, reducing disease incidence. However, for red potatoes this suberized tissue represents a blemish that will reduce marketability. Additionally, skinned tubers lose moisture faster and, therefore, are potentially less viable when used for seed [67]. In general, N appeared to have very little effect on skinning. The genotype by N level effect was only significant in 2019, and there was never a main effect of N level. Our results suggest that skinning is not a trait that should be considered as part of NUE. However, Jones et al. [42] demonstrated the skinning phenotypes were more stable under low N, so skinning may be worth measuring in low N environments even if it is unlikely to change with added N.
There are additional tuber quality traits beyond the scope of this research that are likely influenced by N application rate. For instance, tuber greening is a substantial cause of harvest loss and post-harvest wastage that has been shown to be affected by fertilization. Tuber greening can be described as a visual accumulation of chlorophyll on the tuber surface. In a report by Tanios et al. [68], one of the two clones tested resulted in the greatest greening, at the highest N rate. The other clones showed the highest greening at the lowest N rate, suggesting genetic interaction with N rate, and the need for further study. Additionally, there is evidence that nutritional content [69] and storage potential are affected by N [70].
4.3. Red Fresh Market Potatoes Exhibit GxE in Response to N
This experiment was conducted over two years that had different weather. In 2018 the weather was less favorable, and as a result we saw lower yield. Our results showed significant N rate by clone interaction in 2018. Further, in 2018 the N rate had more significant interaction with clone. This not surprising as there are many biotic and abiotic stresses that were no doubt present, and that these affected the clones differently. For example, disease pressure has been implicated in N response in terms of yield [71]. The fact that we observed variation in phenotypes with respect to skin and tuber shape traits implies that breeding progress with the aim of reducing nitrogen requirements is possible. For the skin and shape traits roundness, length-to-width ratio, redness in 2018, and lightness there were highly (p < 0.01) significant genotype by N rate interaction effects (Table 3). An NUE variety would be stable across N level and year for all relevant traits. We did not observe this for any genotypes. However, we did observe genotypes that were less reactive to nitrogen in some years, including Chieftain, MN2, and MN3, all of which had stable yield across nitrogen level in 2019. We also observed stability in Chieftain, MN1, MN2, MN3, and ND1 for shape traits across both years. Although no strong contenders for NUE varieties emerged from this study, it does point toward potential parents that could confer NUE for specific traits.
Selected clones were developed at two time points approximately 50 years apart making possible the exploration of the potential influence of shifting grower agronomic practices and the resulting evolution of breeding methodologies and objectives based on year of development. The clones could also be broadly divided into two classes: cultivars and breeding lines. The fact that selected clones fell into these two categories (new breeding lines, old cultivars) made it possible to observe potential differences between clones that were selected for release after many years of evaluations in high N environments, and those that were not. The same genotypes were planted in the 2019 trial with the exception of ND1 due to a lack of certified seed availability.
The BLUES in Figure 4 and Figure 5 indicate little N effect in the experimental clones, most likely because they have not been subjected to the rigors of 10 to 15 years of selection in high N environments. None of the clones had gone through extensive selection in moderate to low N environments, and our previous research suggests that selection under low N is required to identify N efficient varieties [42].
5. Conclusions
The crop community is a dynamic system. All the traits discussed above are influenced by both genetics and cultural practices. To complicate the system further, weather, biotic, and abiotic stresses interact with genetic and management effects.
Nitrogen management is of particular interest because, as our results suggest, over application can cause a lose, lose, lose, lose situation, where the grower spends more on inputs, harvests a lower yield of inferior (or at least equivalent) quality, and creates the potential for run off. Our results indicate that over fertilizing with N should not be regarded as an insurance policy, but simply a waste of time and money.
Three generalizations can be inferred from our results in the context of tuber size, shape, and skin characteristics. First, the cultivars generally responded with greater yield of large and medium tubers than the breeding lines at higher N rates. Second, the cultivars responded less favorably to higher N rates for length-to-width ratio, compactness, and roundness than the breeding lines. Finally, the cultivars responded (in general) more positively to higher N rates for redness and lightness. It could be hypothesized that the breeding lines have not progressed to the end stage of their breeding programs because they simply have not performed well enough for key traits in the high N testing environments that typical selection trials currently utilize. If this is the case, it is possible that breeding programs could possibly develop equally high performing cultivars by testing in lower N environments, by virtue of the strong genetic effect observed for all traits. This is an encouraging hypothesis because more sustainable potato production will require cultivars that perform well in lower N environments.
Supplementary Materials
The following are available online at https://www.mdpi.com/2073-4395/11/2/255/s1, Figure S1: Supplemental Figure S1. Medium tuber yield BLUES for eight potato clones grown in 2018. The same letters for each clone are not statistically different. Figure S2: Supplemental Figure S2. Skinning BLUES for eight potato clones for 2018 and 2019. The same letters for each clone are not statistically different. Table S1: Supplemental Contrasts S1.a Estimated marginal means for plot yields of 8 potato clones grown in 2018. Table S2: Supplemental Contrasts S1.b Estimated marginal means for plot yields of 8 potato clones grown in 2019. Table S3: Supplemental Contrasts S2.a Estimated marginal means for plot yields of 8 potato clones separately, grown in 2018. Table S4: Supplemental Contrasts S3.a Estimated marginal means for large tuber plot yields of 8 potato clones separately, grown in 2018. Table S5: Supplemental Contrasts S3.b Estimated marginal means for large tuber plot yields of 7 potato clones separately, grown in 2019. Table S6: Supplemental Contrasts S4.a Estimated marginal means for medium tuber plot yields of 8 potato clones separately, grown in 2018. Table S7: Supplemental Contrasts S4.b Estimated marginal means for medium tuber plot yields of 7 potato clones separately, grown in 2019. Table S8: Supplemental Contrasts S5.a Estimated marginal means for small tuber plot yields of 8 potato clones separately, grown in 2018. Table S9: Supplemental Contrasts S5.b Estimated marginal means for small tuber plot yields of 7 potato clones separately, grown in 2019. Table S10: Supplemental Contrasts S6. Estimated marginal means for roundness of 8 potato clones separately, grown in 2018 and 7 in 2019. Table S11: Supplemental Contrasts S7. Estimated marginal means for length to width ratio of 8 potato clones separately, grown in 2018 and 7 in 2019. Table S12: Supplemental Contrasts S8. Estimated marginal means for compactness of 8 potato clones separately, grown in 2018 and 7 in 2019. Table S13: Supplemental Contrasts S9.a Estimated marginal means for redness of 8 potato clones separately, grown in 2018. Table S14: Supplemental Contrasts S9.b Estimated marginal means for redness of 7 potato clones separately, grown in 2019. Table S15: Supplemental Contrasts S10. Estimated marginal means for lightness of 8 potato clones separately, grown in 2018 and 7 in 2019. Table S16: Supplemental Contrasts S11.a Estimated marginal means for skinning of 8 potato clones separately, grown in 2018. Table S17: Supplemental Contrasts S11.b. Estimated marginal means for skinning of 7 potato clones separately, grown in 2019.
Author Contributions
Conceptualization, L.M.S. and C.S.C.; software, C.S.C.; validation, formal analysis, T.R.S., S.F., and L.M.S.; investigation, S.F., R.F., C.S.C., and L.M.S.; resources, A.L.T.; writing—original draft preparation, T.R.S. and L.M.S.; writing—review and editing, T.R.S., S.F., R.F., A.L.T., C.S.C. and L.M.S.; visualization, L.M.S.; supervision, L.M.S. and C.S.C.; funding acquisition, L.M.S. All authors have read and agreed to the published version of the manuscript.
Funding
This project was funded by the USDA National Institute of Food and Agriculture award number 2016-34141-25707.
Institutional Review Board Statement
Not applicable.
Informed Consent Statement
Not applicable.
Data Availability Statement
Data are contained within the article or Supplementary Material. The data presented in this study are available in Supplementary Tables S1–S16.
Acknowledgments
We are grateful for the support of Minnesota’s potato growers. In particular, Sandi Aarestad at Valley Tissue Culture at Halstad MN provided us with the seed for the commercial varieties in this experiment. Additionally, Peter and Paul Imle of Pine Lake Wild Rice at Gonvik MN, provided the seed for the three Minnesota breeding lines which they had been preserving on their farm during times of uncertainty in the breeding program. At the University of Minnesota, we appreciate Ron Faber’s dedicated and exemplary management of our field sites. We would also like to thank the many people involved in maintaining and phenotyping the plants in the experiment: Husain Agha, Katelyn Filbrandt, Jessica Huege, Colin Jones, Thomas McGehee, Laura Schulz, and Heather Tuttle. Finally, we appreciate Paul McGuirk’s editing and formatting efforts and the recommendations of two anonymous reviewers.
Conflicts of Interest
Cari Schmitz Carley is a breeder for Aardevo. The funders had no role in the design of the study; in the collection, analyses, or interpretation of data; in the writing of the manuscript, or in the decision to publish the results.
References
- Del Grosso, S.J.; Parton, W.J. Quantifying nitrous oxide emissions from agricultural soils and management impacts. In Understanding Greenhouse Gas Emissions from Agricultural Management; Guo, L., Gunasekara, A.S., McConnell, L.L., Eds.; American Chemical Society: Washington, DC, USA, 2011; pp. 3–13. [Google Scholar] [CrossRef]
- Rabalais, N.N.; Turner, R.E.; Wiseman, W.J. Gulf of Mexico Hypoxia, A.K.A. “The Dead Zone”. Annu. Rev. Ecol. Syst. 2002, 33, 235–263. [Google Scholar] [CrossRef]
- Smith, M.D.; Oglend, A.; Kirkpatrick, A.J.; Asche, F.; Bennear, L.S.; Craig, J.K.; Nance, J.M. Seafood prices reveal impacts of a major ecological disturbance. Proc. Natl. Acad. Sci. USA 2017, 114, 1512–1517. [Google Scholar] [CrossRef] [PubMed]
- Lewis, A.H.; Procter, J.; Trevains, D. The effect of time and rate of application of nitrogen fertilizers on the yield of wheat. J. Agric. Sci. 1938, 28, 618. [Google Scholar] [CrossRef]
- Swain, E.Y.; Rempelos, L.; Orr, C.H.; Hall, G.; Chapman, R.; Almadni, M.; Stockdale, E.A.; Kidd, J.; Leifert, C.; Cooper, J.M. Optimizing nitrogen use efficiency in wheat and potatoes: Interactions between genotypes and agronomic practices. Euphytica 2014, 199, 119–136. [Google Scholar] [CrossRef]
- Foote, W.H.; Batchelder, F.C. Effect of Different Rates and Times of Application of Nitrogen Fertilizers on the Yield of Hannchen Barley. Agron. J. 1953, 45, 532–535. [Google Scholar] [CrossRef]
- Baldwin, C.S.; Davis, J.F. Effect of Time and Rate of Application of Nitrogen and Date of Harvest on the Yield and Sucrose Content of Sugar Beets. Agron. J. 1966, 58, 373–376. [Google Scholar] [CrossRef]
- Gilbert, N.W.; Tucker, T.C. Growth, Yields, and Yield Components of Safflower as Affected by Source, Rate, and Time of Application of Nitrogen. Agron. J. 1967, 59, 54–56. [Google Scholar] [CrossRef]
- Sagar, T.S.; Singh, R.P. Effect of time and rate of nitrogen application on yield and quality of early and main season potato varieties. Indian J. Agric. Sci. 1973, 43, 579–581. [Google Scholar]
- Li, W.; Xiong, B.; Wang, S.; Deng, X.; Yin, L.; Li, H. Regulation Effects of Water and Nitrogen on the Source-Sink Relationship in Potato during the Tuber Bulking Stage. PLoS ONE 2016, 11, e0146877. [Google Scholar] [CrossRef]
- Bohman, B.J.; Rosen, C.J.; Mulla, D.J. Evaluation of Variable Rate Nitrogen and Reduced Irrigation Management for Potato Production. Agron. J. 2019, 111, 2005–2017. [Google Scholar] [CrossRef]
- Bohman, B.J.; Rosen, C.J.; Mulla, D.J. Impact of variable rate nitrogen and reduced irrigation management on nitrate leaching for potato. J. Environ. Qual. 2020, 49, 281–291. [Google Scholar] [CrossRef] [PubMed]
- Eid, M.A.M.; Abdel-Salam, A.A.; Salem, H.M.; Mahrous, S.E.; Seleiman, M.F.; Alsadon, A.A.; Solieman, T.H.I.; Ibrahim, A. Interaction Effects of Nitrogen Source and Irrigation Regime on Tuber Quality, Yield, and Water Use Efficiency of Solanum tuberosum L. Plants 2020, 9, 110. [Google Scholar] [CrossRef] [PubMed]
- Zebarth, B.J.; Rosen, C.J. Research perspective on nitrogen bmp development for potato. Am. J. Potato Res. 2007, 84, 3–18. [Google Scholar] [CrossRef]
- Moll, R.H.; Kamprath, E.J.; Jackson, W.A. Analysis and Interpretation of Factors Which Contribute to Efficiency of Nitrogen Utilization. Agron. J. 1982, 74, 562–564. [Google Scholar] [CrossRef]
- Olson, R.A.; Dreier, A.F.; Thompson, C.; Frank, K.; Grabouski, P.H. Using nitrogen effectively on grain crops. Univ. Neb. Agric. Exp. Stn. Bull. 1964, SB479, 24–30. [Google Scholar]
- Kohl, D.H.; Shearer, G.B.; Commoner, B.; Becker, G.A.; Chalos, M.K.; Tuccelli, M.; Aster, R.H. Fertilizer Nitrogen: Contribution to Nitrate in Surface Water in a Corn Belt Watershed. Science 1971, 174, 1331–1334. [Google Scholar] [CrossRef]
- Olson, R. Fertilizers for food production vs energy needs and environmental quality. Ecotoxicol. Environ. Saf. 1977, 1, 311–326. [Google Scholar] [CrossRef]
- Cordero, E.; Longchamps, L.; Khosla, R.; Sacco, D. Spatial management strategies for nitrogen in maize production based on soil and crop data. Sci. Total. Environ. 2019, 697, 133854. [Google Scholar] [CrossRef]
- Liu, C.; Chen, F.; Li, Z.; Le Cocq, K.; Liu, Y.; Wu, L. Impacts of nitrogen practices on yield, grain quality, and nitrogen-use efficiency of crops and soil fertility in three paddy-upland cropping systems. J. Sci. Food Agric. 2020. [Google Scholar] [CrossRef]
- Huang, C.-B.; Zeng, F.-J.; Lei, J.-Q. Impact of Cultivation Practices in Oasis Agriculture on Soil Fertility Dynamics and the Relationship with Cotton Nitrogen-Use Efficiency in the Southern Rim of the Tarim Basin, Xinjiang, China. Commun. Soil Sci. Plant Anal. 2014, 45, 2621–2635. [Google Scholar] [CrossRef]
- Tuyishime, O.; Joel, A.; Messing, I.; Naramabuye, F.; Sankaranarayanan, M.; Wesström, I. Effects of drainage intensity on water and nitrogen use efficiency and rice grain yield in a semi-arid marshland in Rwanda. Acta Agric. Scand. Sect. B Plant Soil Sci. 2020, 70, 1–16. [Google Scholar] [CrossRef]
- Ernst, O.R.; Kemanian, A.R.; Mazzilli, S.; Siri-Prieto, G.; Dogliotti, S. The dos and don’ts of no-till continuous cropping: Evidence from wheat yield and nitrogen use efficiency. Field Crop. Res. 2020, 257, 107934. [Google Scholar] [CrossRef]
- Li, Z.; Zhang, Q.; Wei, W.; Cui, S.; Tang, W.; Li, Y. Determining effects of water and nitrogen inputs on wheat yield and water productivity and nitrogen use efficiency in China: A quantitative synthesis. Agric. Water Manag. 2020, 242, 106397. [Google Scholar] [CrossRef]
- FAO. World Food and Agriculture—Statistical Pocketbook; FAO: Rome, Italy, 2018. [Google Scholar]
- Defauw, S.L.; He, Z.; Larkin, R.; Mansour, S.A. Sustainable Potato Production and Global Food Security. In Sustainable Potato Production: Global Case Studies; He, Z.Q., Larkin, R.P., Honeycutt, W., Eds.; Springer: Dordrecht, The Netherlands, 2012; pp. 3–19. [Google Scholar] [CrossRef]
- Renault, D.; Wallender, W. Nutritional water productivity and diets. Agric. Water Manag. 2000, 45, 275–296. [Google Scholar] [CrossRef]
- Errebhi, M.; Rosen, C.J.; Gupta, S.C.; Birong, D.E. Potato Yield Response and Nitrate Leaching as Influenced by Nitrogen Management. Agron. J. 1998, 90, 10–15. [Google Scholar] [CrossRef]
- Rosen, C.J.; Eliason, R. Potatoes. In Nutrient Management for Commercial Fruit and Vegetable Crops in Minnesota; UMN Extension Service: Minneapolis, MN, USA, 2005; p. 18. [Google Scholar]
- Gao, X.; Li, C.; Zhang, M.; Wang, R.; Chen, B. Controlled release urea improved the nitrogen use efficiency, yield and quality of potato (Solanum tuberosum L.) on silt loamy soil. Field Crop. Res. 2015, 181, 60–68. [Google Scholar] [CrossRef]
- Zebarth, B.J.; Tai, G.; Tarn, R.; De Jong, H.; Milburn, P.H. Nitrogen use efficiency characteristics of commercial potato cultivars. Can. J. Plant Sci. 2004, 84, 589–598. [Google Scholar] [CrossRef]
- Getahun, B.B.; Kassie, M.M.; Visser, R.G.F.; Van Der Linden, C.G. Genetic Diversity of Potato Cultivars for Nitrogen Use Efficiency Under Contrasting Nitrogen Regimes. Potato Res. 2019, 63, 1–24. [Google Scholar] [CrossRef]
- Tiwari, J.K.; Plett, D.; Garnett, T.; Chakrabarti, S.K.; Singh, R.K. Integrated genomics, physiology and breeding approaches for improving nitrogen use efficiency in potato: Translating knowledge from other crops. Funct. Plant Biol. 2018, 45, 587–605. [Google Scholar] [CrossRef]
- Tiwari, J.K.; Buckseth, T.; Devi, S.; Varshney, S.; Sahu, S.; Patil, V.U.; Zinta, R.; Ali, N.; Moudgil, V.; Singh, R.K.; et al. Physiological and genome-wide RNA-sequencing analyses identify candidate genes in a nitrogen-use efficient potato cv. Kufri Gaurav. Plant Physiol. Biochem. 2020, 154, 171–183. [Google Scholar] [CrossRef]
- Zhang, J.; Wang, Y.; Zhao, Y.; Zhang, Y.; Zhang, J.; Ma, H.; Han, Y.-Z. Transcriptome analysis reveals Nitrogen deficiency induced alterations in leaf and root of three cultivars of potato (Solanum tuberosum L.). PLoS ONE 2020, 15, e0240662. [Google Scholar] [CrossRef] [PubMed]
- Gálvez, J.H.; Tai, H.H.; Lagüe, M.; Zebarth, B.J.; Strömvik, M.V. The nitrogen responsive transcriptome in potato (Solanum tuberosum L.) reveals significant gene regulatory motifs. Sci. Rep. 2016, 6, 26090. [Google Scholar] [CrossRef] [PubMed]
- Meise, P.; Jozefowicz, A.M.; Uptmoor, R.; Mock, H.-P.; Ordon, F.; Schum, A. Comparative shoot proteome analysis of two potato (Solanum tuberosum L.) genotypes contrasting in nitrogen deficiency responses in vitro. J. Proteom. 2017, 166, 68–82. [Google Scholar] [CrossRef] [PubMed]
- Rens, L.R.; Zotarelli, L.; Cantliffe, D.J.; Stoffella, P.J.; Gergela, D.; Burhans, D. Rate and timing of nitrogen fertilizer application on potato ‘FL1867’ part II: Marketable yield and tuber quality. Field Crop. Res. 2015, 183, 267–275. [Google Scholar] [CrossRef]
- Waddell, J.T.; Gupta, S.; Moncrief, J.F.; Rosen, C.J.; Steele, D.D. Irrigation and Nitrogen Management Effects on Potato Yield, Tuber Quality, and Nitrogen Uptake. Agron. J. 1999, 91, 991–997. [Google Scholar] [CrossRef]
- Boydston, R.A.; Navarre, D.A.; Collins, H.P.; Chaves-Cordoba, B. The Effect of Nitrogen Rate on Vine Kill, Tuber Skinning Injury, Tuber Yield and Size Distribution, and Tuber Nutrients and Phytonutrients in Two Potato Cultivars Grown for Early Potato Production. Am. J. Potato Res. 2017, 94, 425–436. [Google Scholar] [CrossRef]
- Wiltshire, J.; Milne, F.; Peters, J. Improving the Understanding and Management of Skin Set and Bloom in Potatoes. British Potato Council. Available online: https://potatoes.ahdb.org.uk/sites/default/files/publication_upload/20061%20skin%20set%20and%20bloom%20Final%20Report%20R222.pdf (accessed on 28 October 2019).
- Jones, C.R.; Michaels, T.E.; Carley, C.S.; Rosen, C.J.; Shannon, L.M. Nitrogen uptake and utilization in advanced fresh market red potato breeding lines. Crop. Sci. 2020. Epub ahead of printing. [Google Scholar] [CrossRef]
- Weigle, J.L.; Kehr, A.E.; Akeley, R.V.; Horton, J.C. Chieftain: A red-skinned potato with attractive appearance and broad adaptability. Am. J. Potato Res. 1968, 45, 293–296. [Google Scholar] [CrossRef]
- Johansen, R.H.; Sandar, N.; Hoyman, W.G.; Lana, E.P. Norland a new red-skinned potato variety with early maturity and moderate resistance to common scab. Am. J. Potato Res. 1959, 36, 12–15. [Google Scholar] [CrossRef]
- Minnesota Department of Agriculture. Minnesota Directory of Certified Seed Potatoes. 2020. Available online: https://www.leg.mn.gov/docs/2020/Other/201023.pdf (accessed on 12 January 2021).
- Web Soil Survey, Soil Survey Staff. Web Soil Survey: Soil Data Mart. USDA-NCRS. Available online: https://websoilsurvey.sc.egov.usda.gov/ (accessed on 20 October 2018).
- USDA. United States Standards for Grades of Potatoes. USDA Agricultural Marketing Service Fruit and Vegetable Programs Fresh Products Branch. 2011. Available online: https://www.ams.usda.gov/sites/default/files/media/Potato_Standard%5B1%5D.pdf (accessed on 28 October 2019).
- Caraza-Harter, M.V.; Endelman, J.B. Image-based phenotyping and genetic analysis of potato skin set and color. Crop. Sci. 2020, 60, 202–210. [Google Scholar] [CrossRef]
- Pau, G.; Fuchs, F.; Sklyar, O.; Boutros, M.; Huber, W. EBImage—An R package for image processing with applications to cellular phenotypes. Bioinformatics 2010, 26, 979–981. [Google Scholar] [CrossRef] [PubMed]
- Si, Y.; Sankaran, S.; Knowles, N.R.; Pavek, M.J. Potato Tuber Length-Width Ratio Assessment Using Image Analysis. Am. J. Potato Res. 2016, 94, 88–93. [Google Scholar] [CrossRef]
- Waterer, D.R.; Elsadr, H.; McArthur, M.-L. Skin Color, Scab Sensitivity and Field Performance of Lines Derived from Spontaneous Chimeras of Red Norland Potato. Am. J. Potato Res. 2011, 88, 199–206. [Google Scholar] [CrossRef]
- R Core Team. R: A Language and Environment for Statistical Computing; R Foundation for Statistical Computing: Vienna, Austria, 2018; Available online: https://www.R-project.org/ (accessed on 2 January 2021).
- Harville, D.A. Maximum Likelihood Approaches to Variance Component Estimation and to Related Problems. J. Am. Stat. Assoc. 1977, 72, 320–338. [Google Scholar] [CrossRef]
- Bates, D.; Mächler, M.; Bolker, B.; Walker, S. Fitting Linear Mixed-Effects Models Usinglme4. J. Stat. Softw. 2015, 67, 1–48. [Google Scholar] [CrossRef]
- Lenth, R.V.; Buerkner, P.; Herve, M.; Love, J.; Riebl, H.; Singmann, H. Package ‘Emmeans’. 2020. Available online: https://cran.r-project.org/web/packages/emmeans/emmeans.pdf (accessed on 2 January 2020).
- Wickham, H. Tidyverse: Easily Install and Load the ‘Tidyverse’. R Package Version 1.2.1. 2017. Available online: https://CRAN.R-project.org/package=tidyverse (accessed on 2 January 2021).
- Wickham, H. Ggplot2: Elegant Graphics for Data Analysis; Springer: New York, NY, USA, 2016; Available online: https://ggplot2.tidyverse.org (accessed on 28 January 2021).
- Makani, M.N.; Zotarelli, L.; Sargent, S.A.; Huber, D.J.; Sims, C.A. Nitrogen Fertilizer Rate Affects Yield and Tuber Quality of Drip-Irrigated Tablestock Potatoes (Solanum tuberosum L.) Grown under Subtropical Conditions. Am. J. Potato Res. 2020, 97, 605–614. [Google Scholar] [CrossRef]
- Ospina, C.A.; Van Bueren, E.T.L.; Allefs, J.J.H.M.; Engel, B.; Van Der Putten, P.E.L.; Van Der Linden, C.G.; Struik, P.C. Diversity of crop development traits and nitrogen use efficiency among potato cultivars grown under contrasting nitrogen regimes. Euphytica 2014, 199, 13–29. [Google Scholar] [CrossRef]
- Hewitt, E.J. The Essential Nutrient Elements, Requirements and Interaction in Plants. In Plant Physiology, a Treatise; Steward, F.C., Ed.; Academic Press: New York, NY, USA, 1963; Volume 3. [Google Scholar]
- Endelman, J.B.; Jansky, S.H. Genetic mapping with an inbred line-derived F2 population in potato. Theor. Appl. Genet. 2016, 129, 935–943. [Google Scholar] [CrossRef]
- Robinson, A. Personal Communication; North Dakota State University: Fargo, ND, USA, 2020. [Google Scholar]
- Vander Zaag, P.; Demagante, A.L.; Ewing, E.E. Influence of plant spacing on potato (Solanum tuberosum L.) morphology, growth and yield under two contrasting environments. Potato Res. 1990, 33, 313–323. [Google Scholar] [CrossRef]
- Thompson, A.L.; Secor, G.A.; Lorenzen, J.H.; Farnsworth, B.L.; Novy, R.G.; Gudmestad, N.C.; Holm, E.T.; Preston, D.A. Dakota rose: A bright red tablestock potato cultivar that retains its skin color in storage. Am. J. Potato Res. 2006, 83, 317–323. [Google Scholar] [CrossRef]
- Miller, J.C., Jr.; Scheuring, D.C.; Koym, J.W.; Holm, D.G.; Pavek, J.J.; Novy, R.G.; Whitworth, J.; Stark, J.C.; Charlton, B.A.; Yilma, S.; et al. Reveille Russet: An Early, Widely Adapted, High-Count-Carton Russet for the Fresh Market. Am. J. Potato Res. 2017, 95, 79–86. [Google Scholar] [CrossRef]
- Stark, J.C.; Novy, R.G.; Whitworth, J.; Knowles, N.R.; Pavek, M.J.; Thornton, M.; Brown, C.R.; Charlton, B.A.; Sathuvalli, V.; Brandt, T.L.; et al. Pomerelle Russet: An Early Maturing Potato Variety with High Yields of U.S. No. 1 Tubers Suitable for Fresh Market and mid-Storage Processing and Tolerance to Potato Mop-top Virus. Am. J. Potato Res. 2018, 95, 110–122. [Google Scholar] [CrossRef]
- Knowles, N.; Plissey, E. Maintaining tuber health during harvest, storage, and post-storage handeling. In Potato Health Management, 2nd ed.; Johnson, D., Ed.; American Phytopathological Society: St. Paul, MN, USA, 2007. [Google Scholar]
- Tanios, S.; Tegg, R.; Eyles, A.; Thangavel, T.; Wilson, C.R. Potato Tuber Greening Risk is Associated with Tuber Nitrogen Content. Am. J. Potato Res. 2020, 97, 360–366. [Google Scholar] [CrossRef]
- Van Dingenen, J.; Hanzalova, K.; Salem, M.A.; Abel, C.; Seibert, T.; Giavalisco, P.; Wahl, V. Limited nitrogen availability has cultivar-dependent effects on potato tuber yield and tuber quality traits. Food Chem. 2019, 288, 170–177. [Google Scholar] [CrossRef] [PubMed]
- Sun, N.; Wang, Y.; Gupta, S.K.; Rosen, C.J. Potato Tuber Chemical Properties in Storage as Affected by Cultivar and Nitrogen Rate: Implications for Acrylamide Formation. Foods 2020, 9, 352. [Google Scholar] [CrossRef]
- Tiemens-Hulscher, M.; Van Bueren, E.T.L.; Struik, P.C. Identifying nitrogen-efficient potato cultivars for organic farming. Euphytica 2014, 199, 137–154. [Google Scholar] [CrossRef]
Publisher’s Note: MDPI stays neutral with regard to jurisdictional claims in published maps and institutional affiliations. |
© 2021 by the authors. Licensee MDPI, Basel, Switzerland. This article is an open access article distributed under the terms and conditions of the Creative Commons Attribution (CC BY) license (http://creativecommons.org/licenses/by/4.0/).