Article

Phosphorus and Carbohydrate Metabolism in Green Bean Plants Subjected to Increasing Phosphorus Concentration in the Nutrient Solution

by
Pedro García-Caparrós
1,
María Teresa Lao
1,*,
Pablo Preciado-Rangel
2 and
Esteban Sanchez
3,4
1
Department of Superior School Engineering, University of Almeria, CIAIMBITAL, Agrifood Campus of International Excellence ceiA3. Ctra. Sacramento s/n, La Cañada de San Urbano, 04120 Almería, Spain
2
National Technological Institute of México—Technological Institute of Torreón (ITT), 22710 Torreón, Coahuila, Mexico
3
Center for Research in Food and Development A.C., 33086 Delicias, Chihuahua, Mexico
4
Faculty of Agrotechnological Sciences, University Autonomous of Chihuahua, 31000 Rosales, Chihuahua, Mexico
*
Author to whom correspondence should be addressed.
Agronomy 2021, 11(2), 245; https://doi.org/10.3390/agronomy11020245
Submission received: 13 December 2020 / Revised: 21 January 2021 / Accepted: 23 January 2021 / Published: 28 January 2021
(This article belongs to the Special Issue Management of Crops Fertigation)

Abstract

:
Phosphorus (P) is considered an elementary mineral nutrient for plants. Nevertheless, excessive or deficit supply to the crop may cause negative changes at the physiological level. Plants were cultivated in pots in a growth chamber under increasing P concentration (P1 (0.5 mmol/L (control treatment)), P2 (1 mmol/L); P3 (2 mmol/L); P4 (4 mmol/L); P5 (6 mmol/L), and P6 (8 mmol/L)) in the nutrient solution for 40 days. At the end of the experimental period, biomass, carbohydrates concentration, and enzymatic activities related to the synthesis and degradation of sucrose as well as the different fractions of P in different organs of the plant were assessed. The results obtained in this experiment reveal a decrease in biomass under increasing P supply. Fructose, glucose, sucrose, and starch concentrations were higher in the shoots compared to the roots. There were different trends in the roots and shoots in enzymatic activities related to sucrose. The increase in P dose increased the concentration of the different forms assessed for P in all the organs studied. Seed phytate concentration surpassed the threshold established by the Food and Agriculture Organization (FAO) for green bean plants grown under P4, P5, and P6 treatments. Considering the results obtained, we suggest fertigation with a concentration of 2 mmol/L to obtain a higher productivity without excess of phytate in seeds.

1. Introduction

Green beans (Phaseolus vulgaris L.) are a legume with high relevance in human nutrition due to their high amounts of calories and proteins [1,2]. According to the Food and Agriculture Organization (FAO) [3], at the worldwide level, the area harvested and the production quantity of green beans were 1,569,474 ha and 2,4765,555 t, respectively.
Phosphate reserves for agriculture are running out, and at the agronomic level there are various aspects related to the soil and fertilization [4,5].
Phosphorus is a relevant macronutrient in a plant’s growth, ranging from 0.05 to 0.30% of the crop’s dry weight [6]. Phosphorus (P) participates in many physiological processes associated with plant growth and development. For instance, P is crucial in energy metabolism and photosynthesis, biosynthesis of organic compounds, the structural element of nucleic acids and phospholipids, up and down regulation of genes and the activity of enzymes, and also in signal transduction [7,8].
In the soil, there are several chemical forms of P, such as inorganic P (Pi) and organic P (Po) [9,10]. The concentration of Pi in plant tissues ranges from 5 to 20 mM [11], being higher than the concentration in the soil, which is around 10 mM [12]. Plants uptake phosphorus from the soil as inorganic phosphate (Pi) in the forms of HPO42− or H2PO4 ions [13,14]. Moreover, an adequate rate of P uptake is of crucial interest for plant´s growth and development, since a reduced availability results in a decline in crop yield [15].
Plant growth requires the translocation of carbohydrates from the leaves to the rest of the plant, providing these organs with carbon and energy. Among these carbohydrates, sucrose is the most important in plants [16]. The synthesis of sucrose occurs in the cytoplasm from triose-P that is translocated from the chloroplast in a Pi-regenerating step. The triose-P ubicated in the cytosol is firstly transformed to hexose-P to be later converted into sucrose [17].
The key enzymes participating in the generation of sucrose are fructose-1,6-biphosphatase (F1,6BPase), uridine di-phosphate UDP-glucose pyrophosphorylase, and sucrose-phosphate synthase (SPS) [18]. The sucrose degradation rates depend on sucrose synthase (SS), as well as on acidic and alkaline sucrose invertase activities, yielding in both cases glucose and fructose [19,20]. Sucrose phosphate synthase is soluble in the cytoplasm and participates in the reversible formation of sucrose-P from UDP-glucose. Fru-6-P’ activity of this enzyme is led mainly by allosteric effectors (Glc-6-P and Pi) and by reversible seryl phosphorylation [21]. Soluble sucrose invertases participate in the hydrolytic reaction of sucrose, producing glucose and fructose, and according to the optimum pH and cell compartmentation studies, they are ubicated in the cytoplasm (neutral or alkaline forms) or in the vacuole (acid forms) [22].
The level of P in a crop can be assessed as different P pools depending on the extraction procedure. The different P forms are related to different chemical compounds such as ester, lipid, nucleotide, inorganic and storage P [12]. Inorganic P is ubicated either in the vacuole, where it is translocated to satisfy the requirements of growing sinks, or in the cytosol acting as a crucial regulator of the leaf CO2 assimilation rate [23]. By contrast, the organic fraction of phosphorus (Po) needs to be hydrolyzed to Pi before it can be re-translocated [24]. The fractions of Pi and Po must be converted to the soluble form of P to easily be used up as a P nutrient by plants, and thereafter be immobilized into organic cellular macromolecules such as DNA, RNA and ATP [25]. The activation of intracellular and secreted acid phosphatases (APase) is a well-known response against P deprivation in plants [8].
Reviewing the literature, there are several studies focused on the effects of phosphate limitation in common beans at the biochemical and physiological level [26,27,28,29]. Nevertheless, these studies were conducted under a phosphate-sufficient (+P) and phosphate deficient (−P) nutrient medium, with no comparison between the supply of different doses of P. Therefore, this experiment aimed to discern the effects of different doses of P on the biomass, metabolism, and distribution of carbohydrates and phosphorus in green bean plants.

2. Materials and Methods

2.1. Plant Material and Growth Conditions

Green bean seeds cv. Strike were germinated for 8 days under dark conditions and then transplanted to 8 L−1 pots (4 plants) filled with vermiculite. Plants were cultivated in a growth chamber with 350 μmol m−2 s−1 (photon flux density) (recorded at the canopy of the crop with a quantum sensor (LI-190SA, LI-COR Inc., Lincoln, NE, USA), a photoperiod of 16/8 h (day/night), an average day/night temperature of 28/22 °C, and air humidity ranging from 60 to 80%. These plants were irrigated for 20 days before the experimental treatments with a complete nutrient solution containing 6 mmol/L (NH4NO3), 2.4 mmol/L (K2SO4), 1.2 mmol/L (CaCl2·2H2O), 1.6 mmol/L (K2HPO4), 1.4 mmol/L (MgSO4·7H2O), 5 μmol/L (Fe-EDDHA), 1 μmol/L (ZnSO4·7H2O), 2 μmol/L (MnSO4·H2O), 0.3 μmol/L [(NH4)6Mo7O24·4H2O], 0.25 μmol/L (CuSO4·5H2O) and 5 μmol/L (H3BO3). The completed nutrient solution was renewed two times per week during the whole experimental period, with a pH of 6.0–6.1. Twenty days after the sowing, different P concentrations were added to the nutrient solution to establish the different P treatments. The desired concentrations of P were obtained using the following chemical fertilizers: monopotassium phosphate (KH2PO4) and phosphoric acid (H3PO4). The treatments of P were: P1 (0.5 mmol/L (control treatment)), P2 (1 mmol/L); P3 (2 mmol/L); P4 (4 mmol/L); P5 (6 mmol/L), and P6 (8 mmol/L), and these were applied for 40 days (until harvest). The experiment consisted of a randomized complete block design with six single-pot replications with a total of 24 plants per treatment. At the end of the experiment (60 days after sowing), plants at full maturity were sampled and sorted into roots, shoots, pods, and seeds for further analysis. The different samples were cleaned three times with distilled water and nonionic detergent (1%) [30] and then were blotted on filter paper.
Fresh root and shoot subsamples were used to determine the activities of fructose-1,6-bisphosphatase (F1,6BPase), sucrose phosphate synthase (SPS), sucrose synthase (SS), invertases (acid and alkaline), and the concentration of non-structural carbohydrates (sucrose, glucose, fructose and starch). Acid phosphatase activity was also assessed in subsamples of the fresh weight of roots, shoots, pods, and seeds. Oven-dried (70 °C until constant weight) subsamples of the different organs assessed were ground in a mill, and then used for the analysis of total P, inorganic P, organic soluble-P, lipidic-P, proteic-P, RNA-P, DNA-P, and phytates.

2.2. Analysis of Carbohydrates Metabolism

Fresh material of roots and shoots was crushed with ethanol (5 mL at 96%) and then washed with ethanol (5 mL at 70%). The alcoholic extract was centrifuged for 10 min (3500× g) and then the supernatant was stored at 4 °C for further analysis. The determination of the concentration of soluble sugars, such as sucrose, glucose, and fructose, was assessed with the protocol established by Irigoyen et al. [31]. The pellet obtained after centrifugation was dried and then incubated for 48 h at 37 °C in buffer acetate (4.5 mM) and α-glucoamylase (0.5%, w/v) and water for the determination of starch. The reagent of anthrone was used for the determination of the concentration of soluble sugars and starch measuring the absorbance at 650 nm and using standards of sucrose, glucose, and fructose at different concentrations. The concentration of soluble sugars (sucrose, glucose, fructose) and starch in roots and shoots was expressed as mg g−1 FW.
Sucrose phosphate synthase (SPS) activity was assessed with the methodology reported by Hubbard et al. [32]. The extraction medium containing: Hepes-NaOH buffer (1:5 (w/v), 0,05 M, pH 7.5) with 1 mM Na-EDTA, 5 mM MgCl2, 0.5 BSA g L−1, 2.5 mM DTT, and 0.05% (v/v) Triton X-100. The homogenate was centrifuged for 10 min (13,500× g) and the enzyme activity was assessed in the resulting extract. The protocol of Bradford [33] was conducted to determine protein concentration. SPS activity was determined in reaction mixtures containing 50 mM Hepes-NaOH (pH 7.5), 15 mM MgCl2, 25 mM glucose 6-phosphate, 25 mM fructose 6-phosphate, 25 mM UDP-glucose, and 100 µL of extract, using the protocol reported by Cheikh and Brenner [34]. The incubation of the mixtures (37 °C) was conducted for 30 min and was stopped with the addition of 70 μL of potassium hydroxide (30%, w/v). Enzyme blanks were finished with potassium hydroxide at 0 min. Sucrose was determined using Van Handel’s [35] modified anthrone method. The activity of SPS was expressed as µmol sucrose mg−1 prot. h−1. Sucrose synthase (SS) was determined using the same methodology proposed for SPS, but using fructose (25 mM) instead of fructose 6-phosphate, and without glucose 6-phosphate [34]. The activity of SS was expressed as µmol sucrose mg−1 prot. h−1.
Fructose 1,6-biphosphatase (F1,6BPase) was extracted following the protocol of Holaday et al. [36]. The activity of the enzyme was assessed in a reaction mixture composed of 50 mM Hepes-HCl (pH 7.6), 5 mM MgCl2, 10 mM β-mercaptoethanol, 0.25 mM fructose 1,6-biphosphate, 10 mM KF, and 100 µL of extract. Then, the reaction mixture was incubated in dark conditions for 10 min at 25 °C and stopped with the addition of trichloroacetic acid (30%). The protocol of Bradford [33] was conducted to determine protein concentration. The Pi released was measured with the protocol of Geladopoulus et al. [37]. Fructose 1,6-biphosphatase activity was expressed as µmol Pi−1 mg−1 prot. min−1.
Invertases (acid and alkaline) were extracted in potassium phosphate buffer (0.2 M, pH 7.0) and β-mercaptoethanol (0.02 M) using the protocol reported by Hubbard et al. [32]. The homogenate obtained was filtered and centrifuged for 15 min (35,000× g). The resulting extract was used to determine enzyme activities and soluble protein concentration. The enzymatic activity for acid invertase was assessed using 55 µL of extract, 150 µL sodium acetate buffer (0.1 M, pH 4.5), and 50 µL sucrose (0.75 M) in a test tube equilibrated in a 37 °C water bath. The reaction lasted 30 min and was stopped by adding a volume of 125 µL dinitrosalicylic acid reagent prepared according to Miller’s method [38]. The protocol of Bradford [33] was conducted to determine protein concentration. Reducing sugars released from sucrose were measured with the protocol of Hubbard et al. [32]. The activity of neutral invertase was assessed as described above but sodium-acetate buffer (0.1 M, pH 4.5) was replaced with K2HPO4 citrate buffer (0.1 M, pH 7.0) [32]. Invertase (acid and alkaline) activities were expressed as µmol glucose mg−1 prot. h−1.

2.3. Analysis of P Forms

Dry matter subsamples were ground and then digested with sulfuric acid (96%) and hydrogen peroxide (H2O2) [30]. Total P was analyzed by the vanadomolybdophosphate colorimetric method measuring the absorbance at 430 nm [39,40]. An aqueous extraction (0.2 g of dried material in a volume of 10 mL of distilled water) was filtrated, and the eluate was used for the direct determination of the inorganic P, as was described previously for total form [40]. The concentration of organic P resulted from the difference between total and inorganic P. Lipidic P was extracted using ethanol-ether-chloroform (2-2-1/v) from the first extraction residue at 50 °C for 60 min and then centrifuged at 3000× g for 5 min. An aliquot of this supernatant was desiccated and then digested with 96% H2SO4 for the colorimetric determination at 430 nm [39,40]. RNA-P was determined using an aliquot of the extraction residue of lipidic P determination, which was desiccated and then used for the extraction with KOH and centrifuged for 5 min (3000× g). An aliquot of the supernatant obtained was desiccated and then digested with 96% H2SO4 for the colorimetric determination at 430 nm [39,40]. DNA-P was determined using an aliquot of the extraction residue of RNA-P which was desiccated and then used for the extraction with 5% HClO4 and centrifuged for 5 min (3000× g). An aliquot of the supernatant obtained was desiccated and then digested with 96% H2SO4 for the colorimetric determination at 430 nm [39,40]. Proteic P was determined using an aliquot of the extraction residue of DNA-P which was desiccated and then digested with 96% H2SO4 for the colorimetric determination at 430 nm [39,40]. The different P forms calculated were expressed in mg 100 g−1 DW.
Acid phosphatase activity (APA) assay was measured following the protocol of Besford [41], Ruiz et al. [42], and López-Cantarero et al. [40]. The fresh weight of the different sections assessed was homogenized with a 0.1 M Na-acetate buffer, and then centrifuged at 30,000× g being always at 4 °C. The protocol of Bradford [33] was conducted to determine protein concentration. Enzyme extracts were incubated under dark conditions (30 min) at 30 °C. Hydrolysis of the p-nitrophenyl phosphate (p-NPP) was recorded as APA measuring the absorbance at 405 nm. The activity of APA was expressed as μmol of p-NPP hydrolyzed h−1 at 30 °C.
Phytate concentration was determined in dried and ground seeds which were treated with HCl. This determination was based on phytate extraction in a strongly acidic media, and the subsequent phytate-Fe complex arrangement by means of high Fe present in the reaction media as ammonium iron sulphate. From the supernatant fraction, the phytate concentration was determined by 2,2′-bipyridine following the procedure established by Graf and Dintzis [43]. Phytate concentration was expressed in mg 100 g−1 DW.

2.4. Statistical Analysis

Statistical analyses of the variables studied were conducted using the program Statgraphics Centurion XVI.II (Statpoint Technologies, Inc., Warrenton, VA, USA). The significance of the effects of the treatments was analyzed by ANOVA (one-way analysis of variance) and LSD (least significant difference) tests (p < 0.05).

3. Results

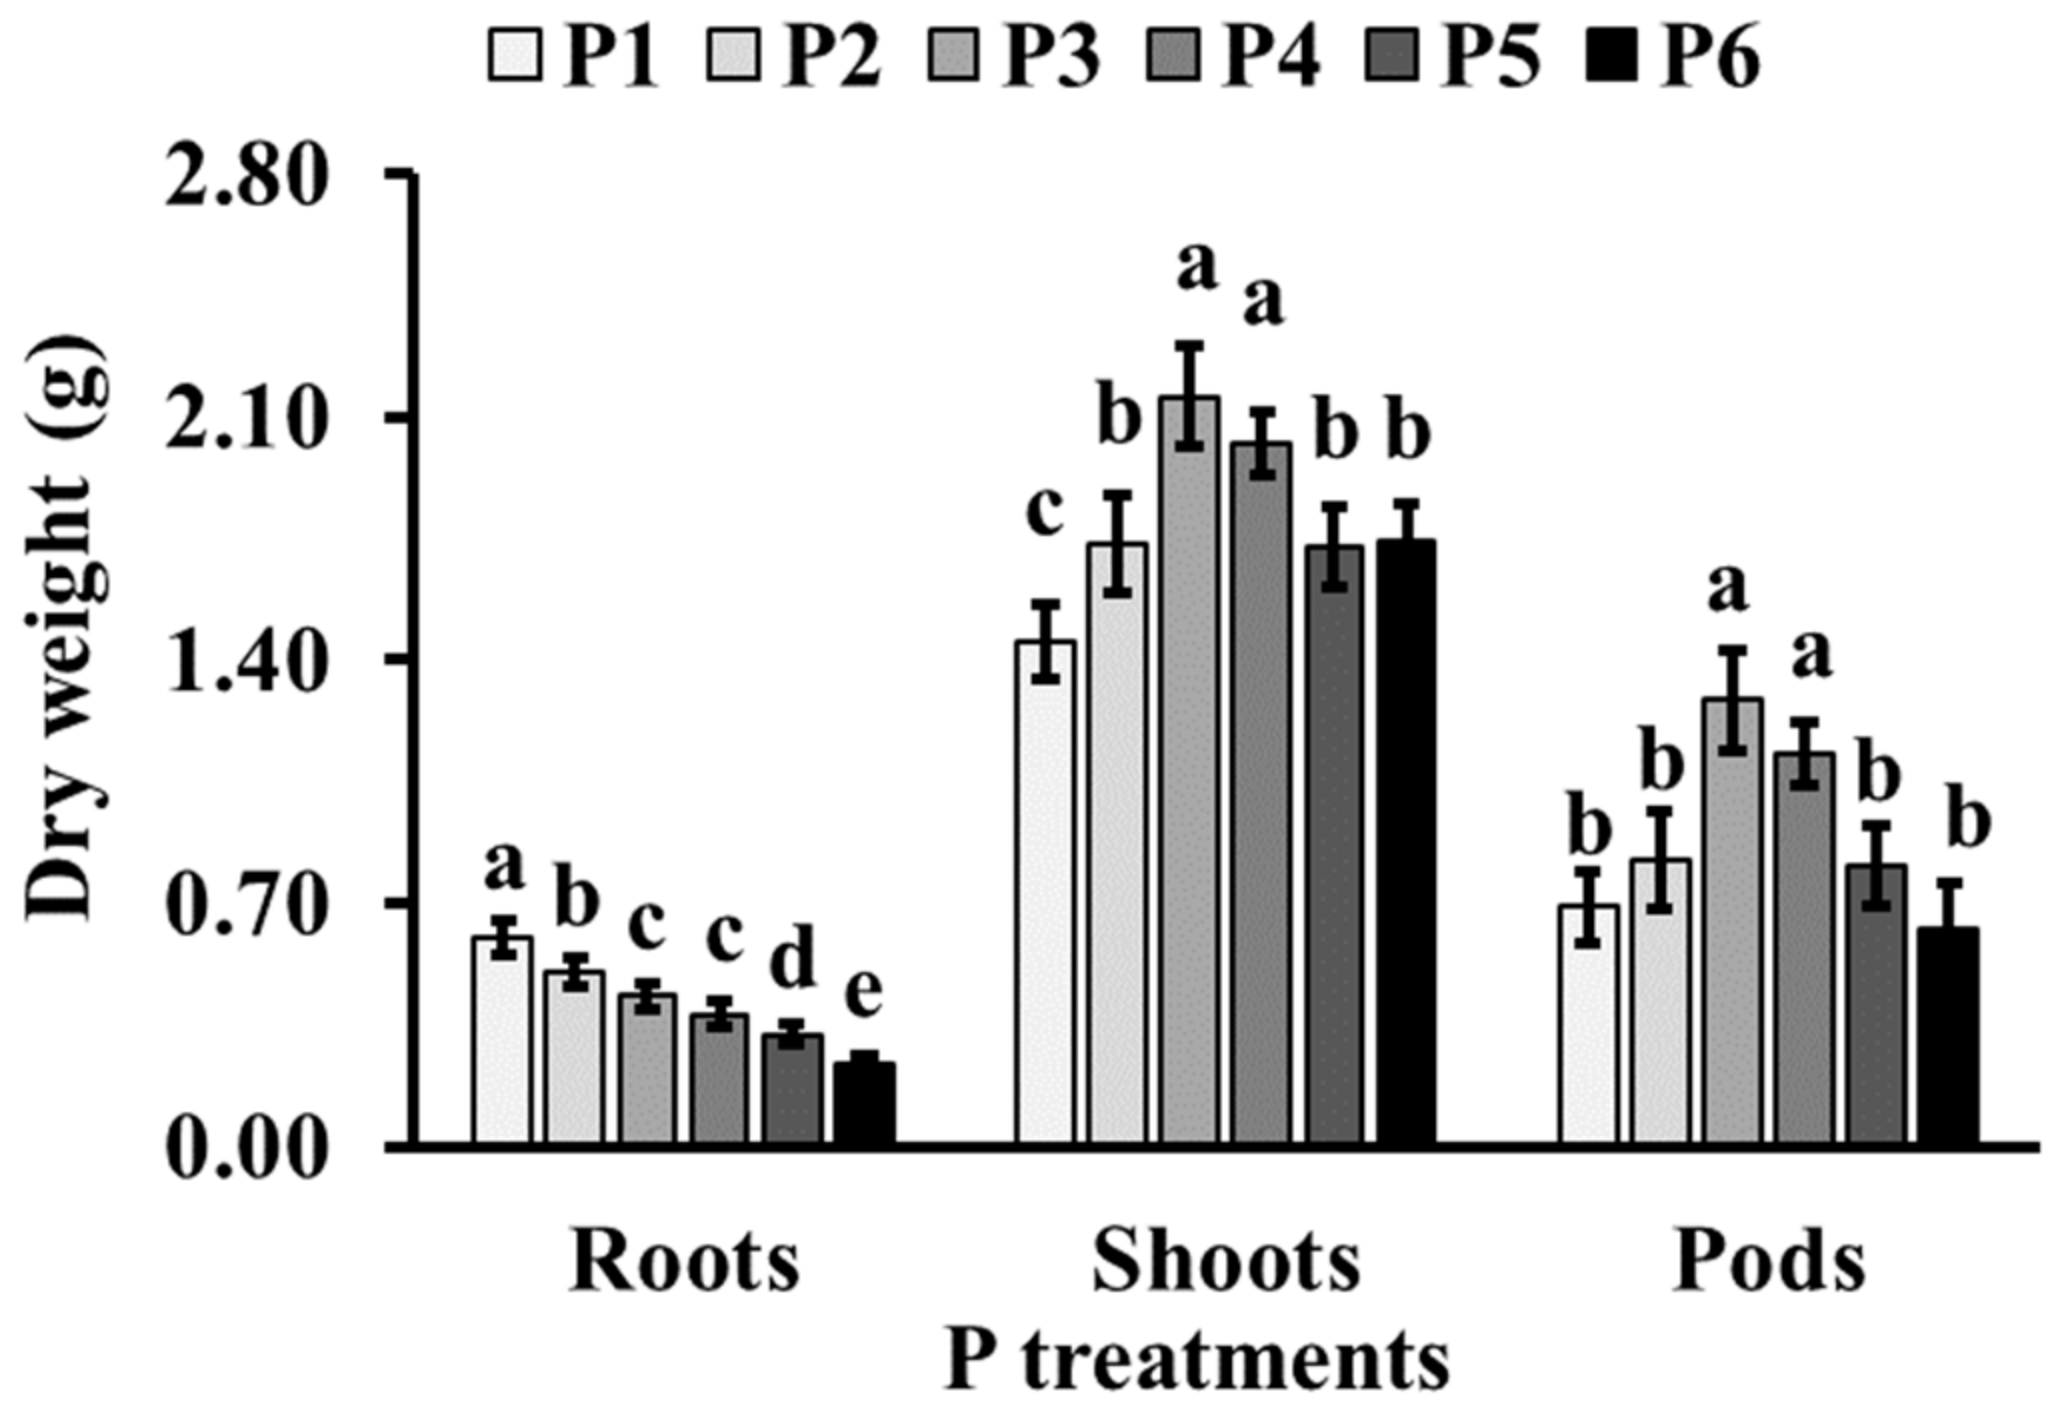
3.1. Plant Parameters

Green bean plants grown under P1 showed the highest value in roots, whereas plants grown under P3 and P4 showed the highest value in shoot and pod dry weight at the end of the experiment (Figure 1).

3.2. Carbohydrates Metabolism

Green bean plants showed higher concentrations of glucose, fructose, sucrose, and starch in shoots compared to roots at the end of the experiment. At root level, plants grown under P3 and P4 showed the highest concentration of glucose, fructose, and sucrose. In shoots, plants grown under the lowest (P1) phosphorus concentration supplied to the nutrient solution showed the highest concentration of glucose, fructose, and sucrose. With respect to starch, there were no significant differences between treatments at root and shoot level (Table 1).
With respect to sucrose biosynthesis, the values of sucrose phosphate synthase (SPS) and fructose 1,6-biphosphatase (F1,6BPase) were higher in plants grown under P3 and P4 at root and shoot level at the end of the experiment. The enzymes involved in sucrose degradation, sucrose synthase, and acid and alkaline invertase activities in roots were higher in plants grown under P3 and P4, whereas in shoots, sucrose synthase activity was higher under P3 and P4, while acid and alkaline invertase activities showed the lowest value under these P treatments (Table 2).

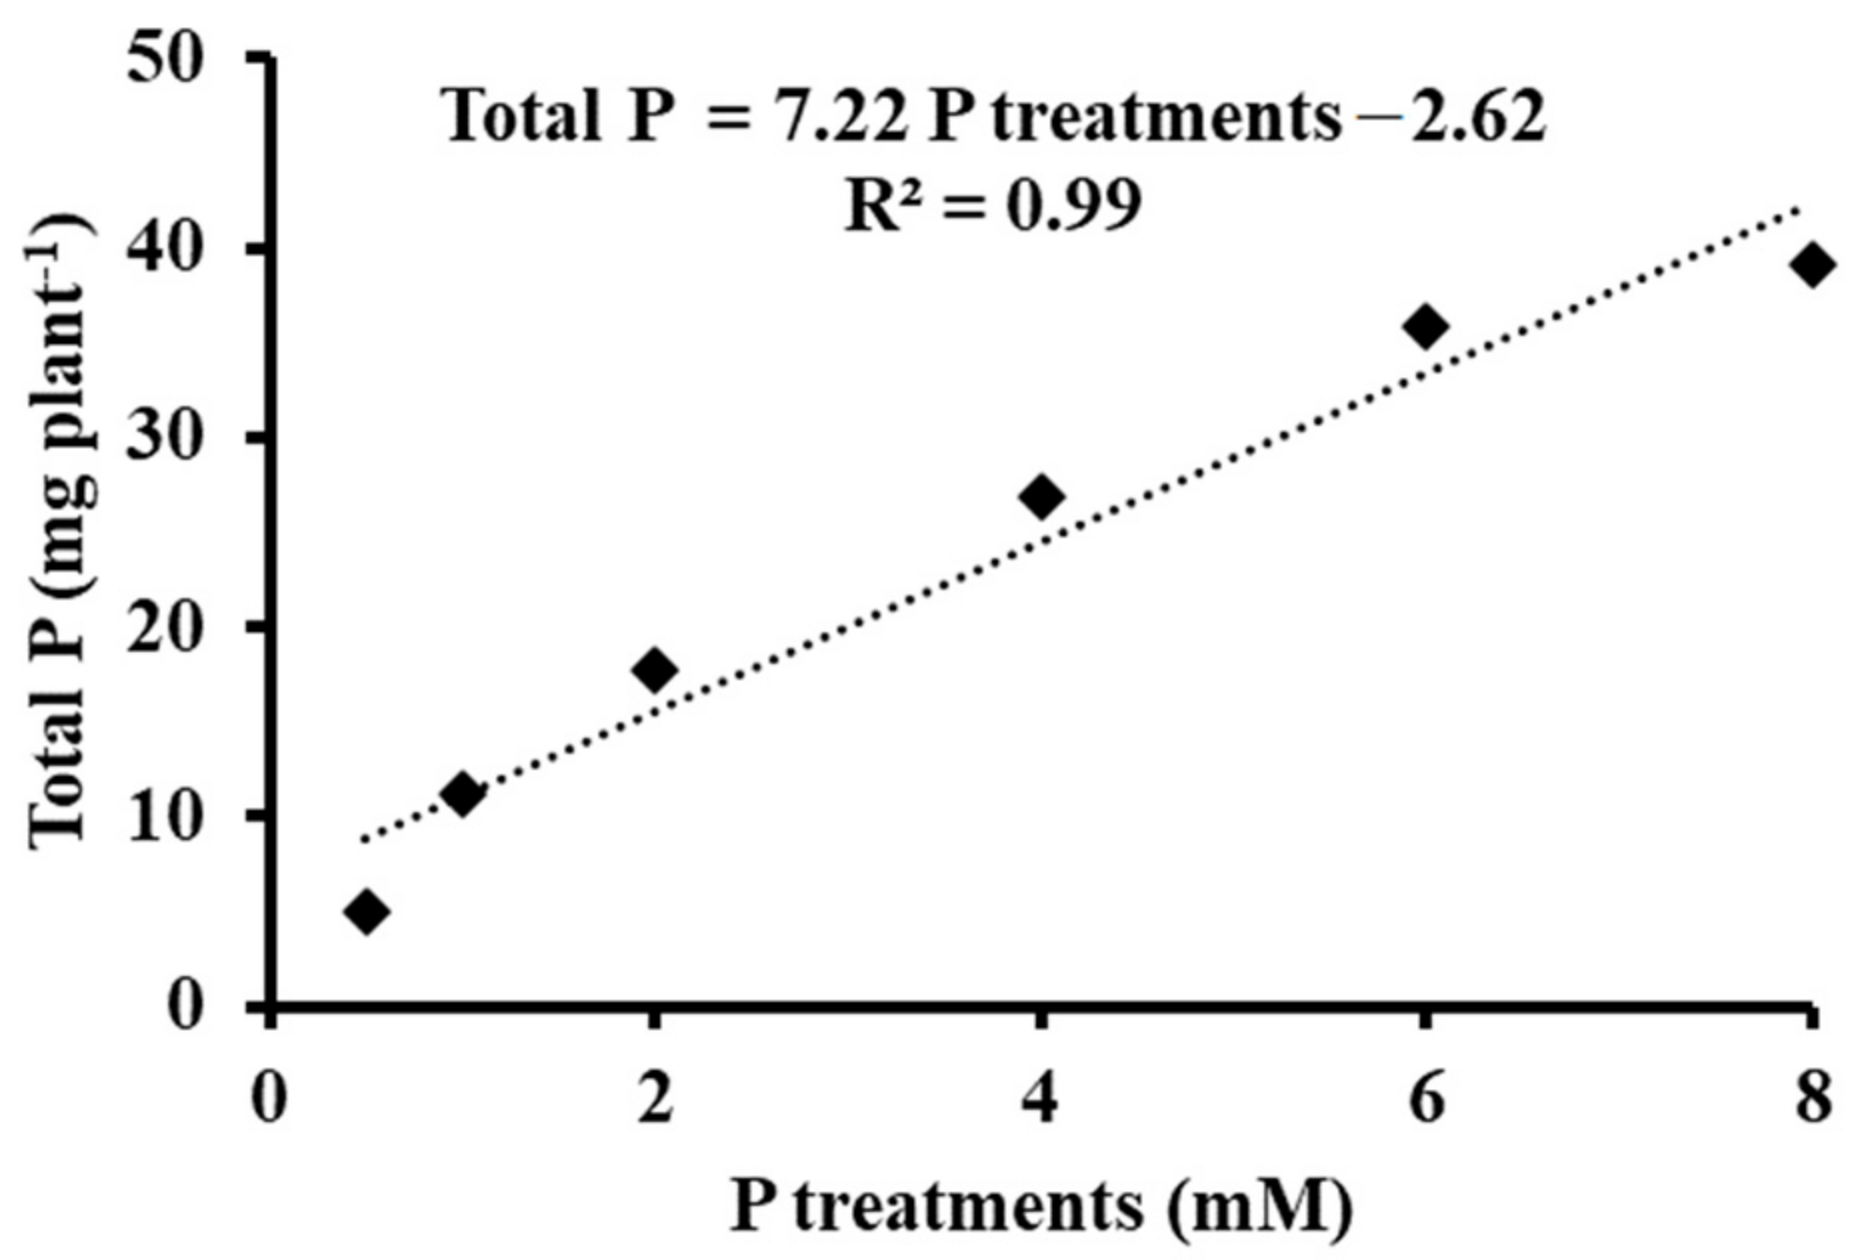
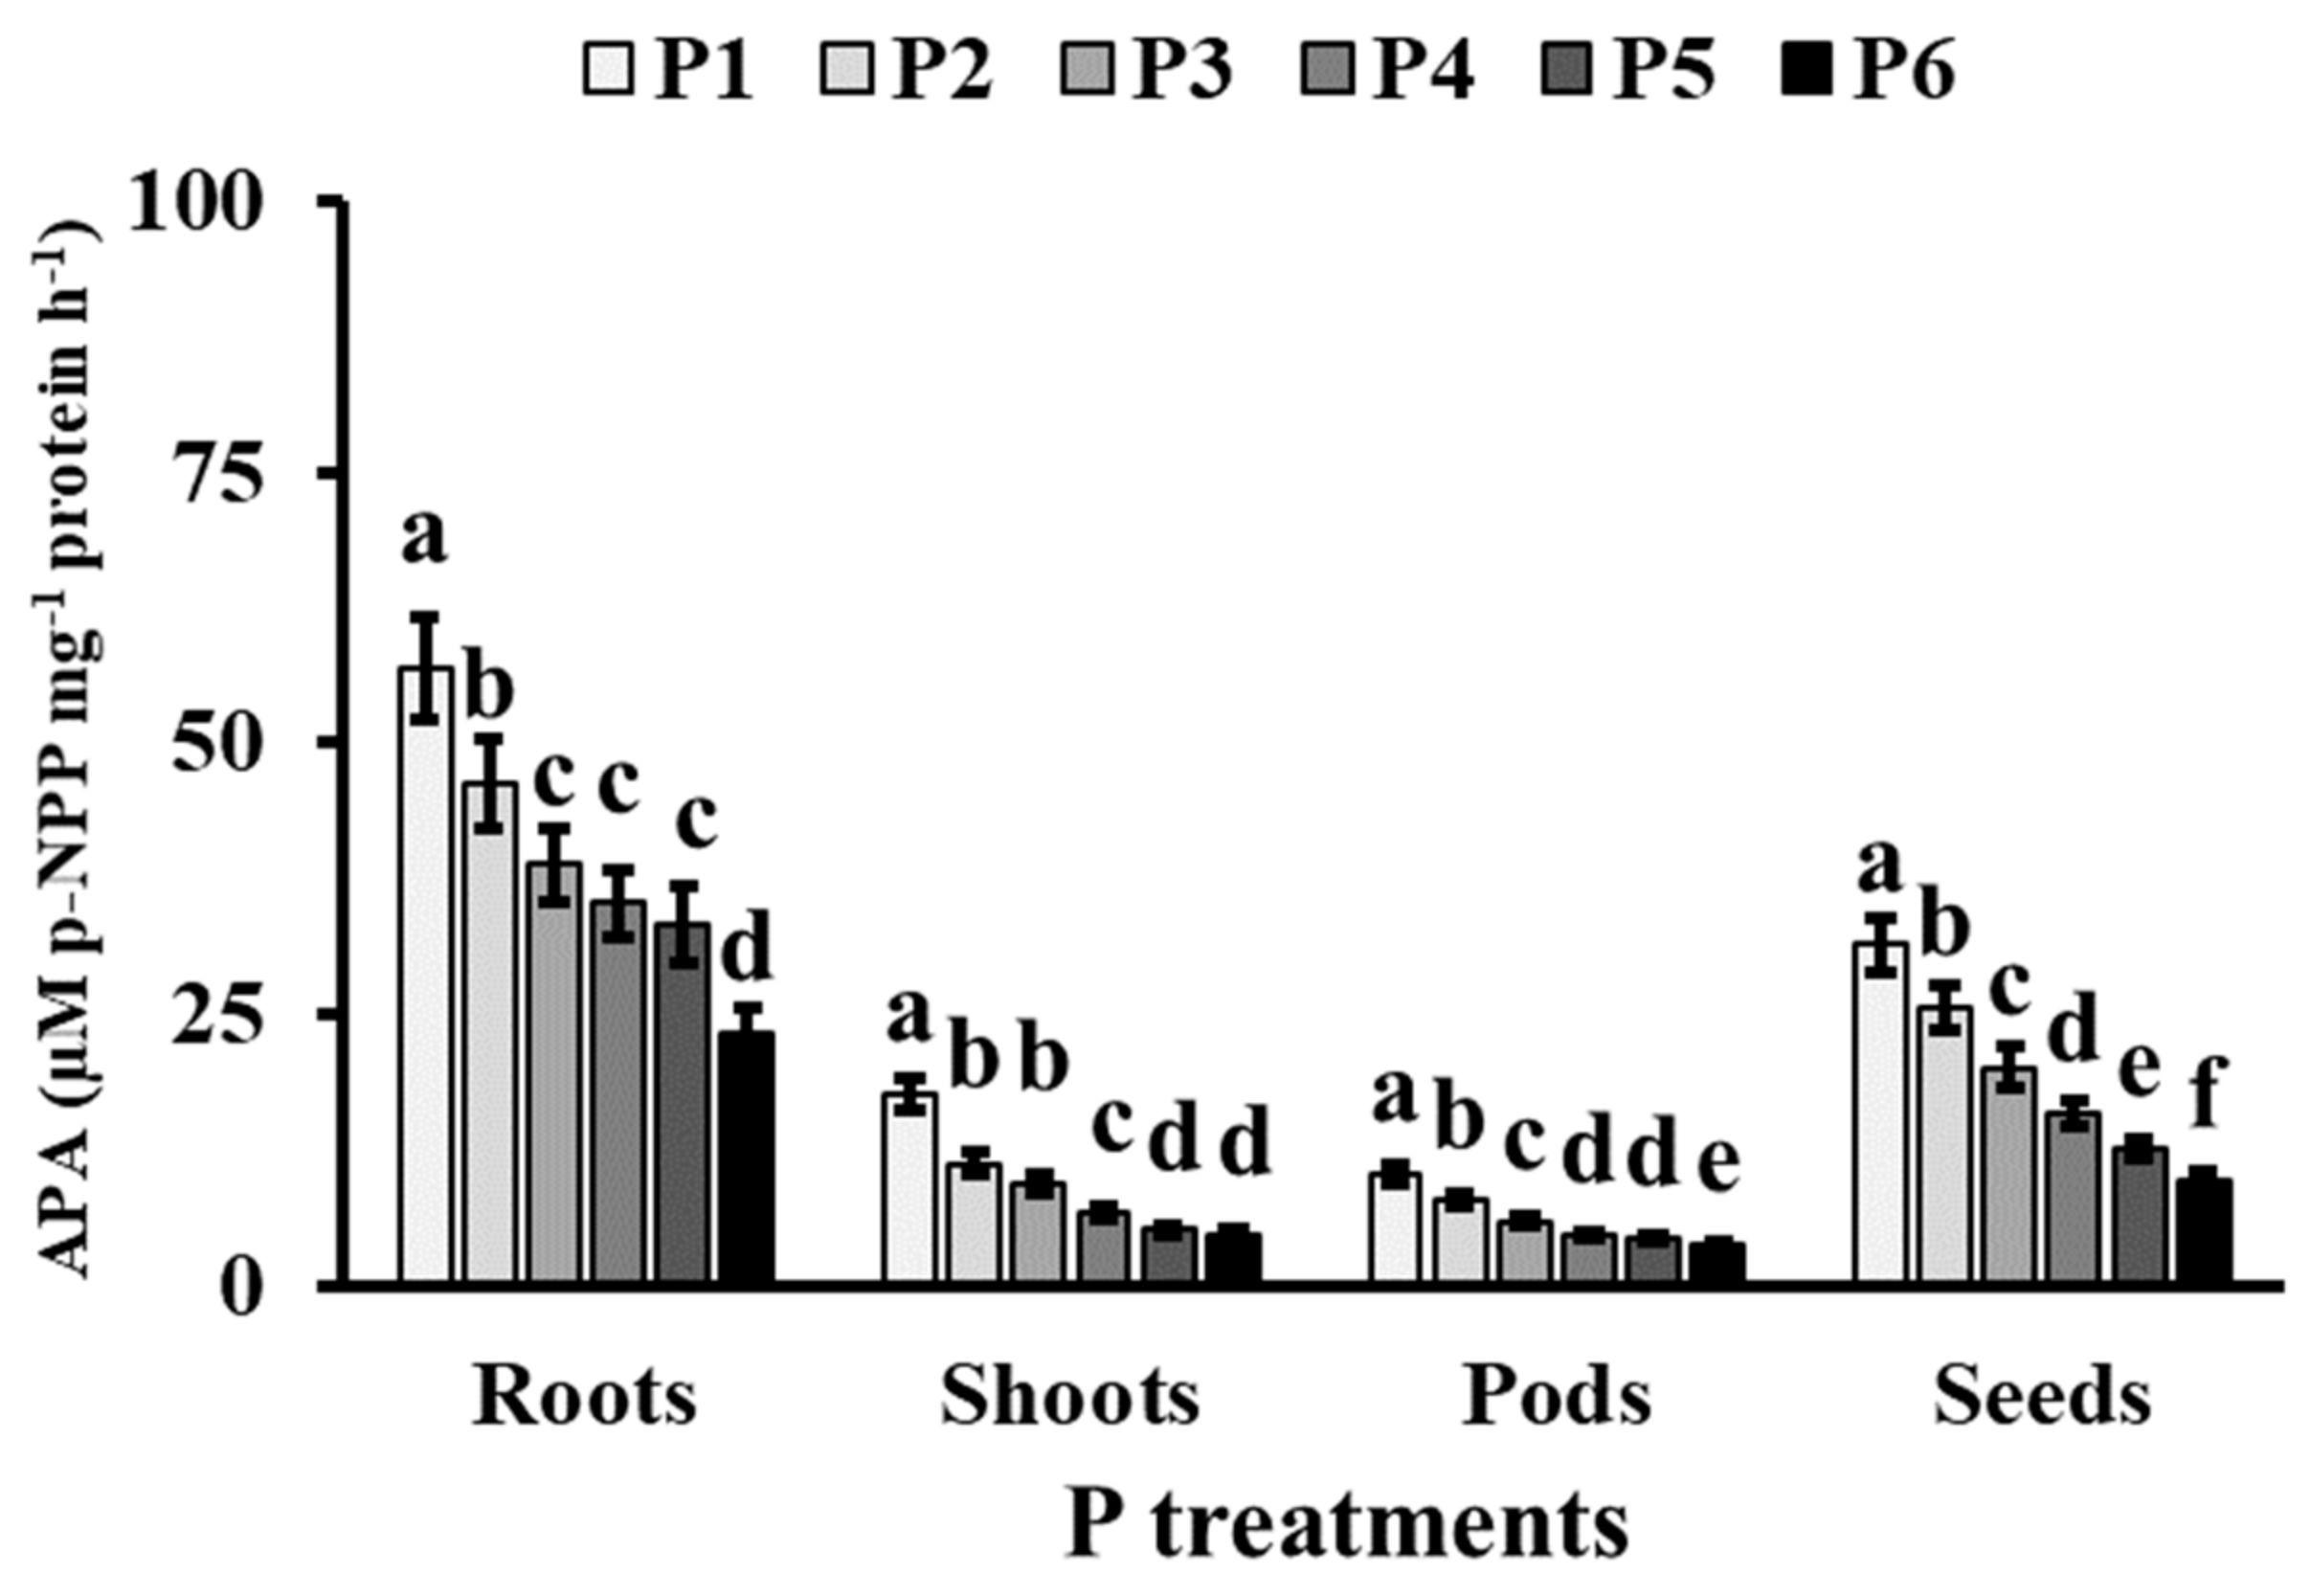
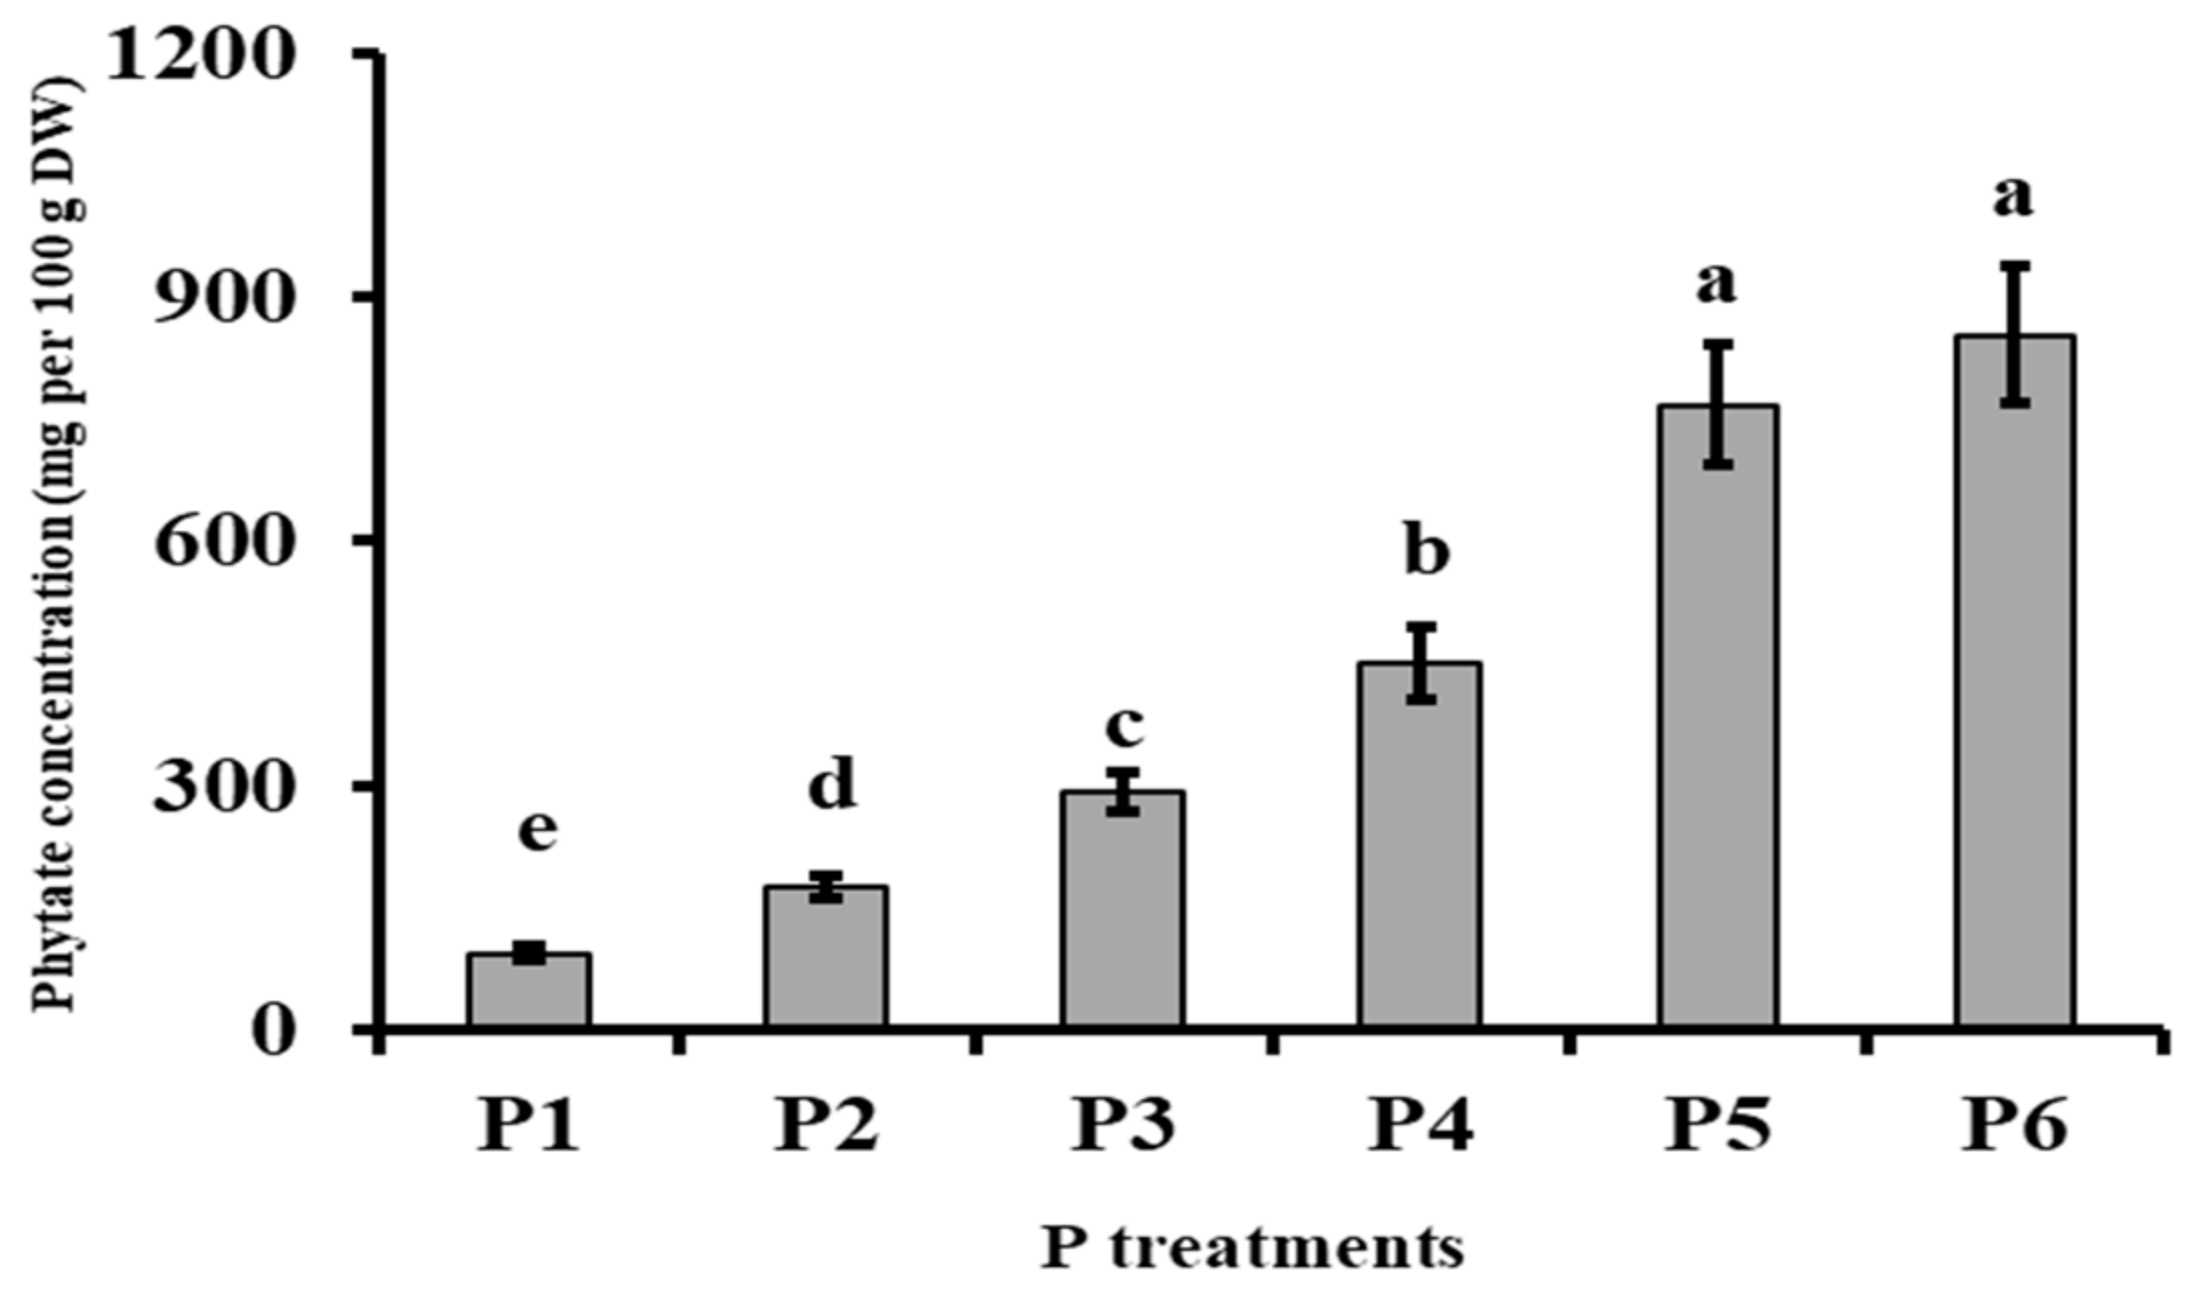
3.3. Phosphorus Metabolism

There was a highly positive relationship (R2 = 0.99) between the phosphorous concentration supplied to the nutrient solution and total P in the plant (Figure 2).
The concentrations of total and inorganic P forms increased under increasing phosphorus supply to the nutrient solution in all the organs studied (roots, shoots, pods, and seeds), showing the highest values in green bean plants subjected to the P6 treatment. Analogously, organic P concentration rose under increasing phosphorus supply to the nutrient solution in all the organs studied, showing the highest values in green bean plants subjected to P5 and P6 treatments, respectively, but with no significant differences between them. The ratio between organic and inorganic P increased under increasing phosphorus supply to the nutrient solution in roots, shoots, and pods, but in seeds it showed a contrary trend, showing the highest value in plants grown under P1 treatment (Table 3).
The concentrations of lipidic P, proteic P, RNA-P and DNA-P and forms followed the same trend in all the organs studied, showing the highest value in green bean plants grown under the highest concentration of phosphorus supplied to the nutrient solution (P6) (Table 4).
Regarding acid phosphatase activity, the trend was the opposite with respect to the different forms of P assessed in all the organs studied, with the control treatment (P1) showing the highest value (Figure 3).
The concentrations of phytates in seeds increased under increasing phosphorus supply to the nutrient solution, showing the highest values in green bean plants grown under P5 and P6 treatments (Figure 4).
Comparing the relationships between the different P-forms and the concentration of P supplied to the nutrient solution, the highest slope for lipidic and RNA-P fractions and the lowest for phytates can be highlighted. It is also necessary to point out that there was a high positive correlation in all cases, being especially close to 1 in RNA-P and DNA-P (Table 5).

4. Discussion

Several works have demonstrated that the growth of green bean plants under phosphorus deficit conditions results in a decline in dry weight in the aerial part of the plant and an increase in the root system [29,44]. In our experiment, the highest root growth under the lowest P concentration can be ascribed to the growth of long root hairs to improve P acquisition [45]. Nevertheless, the high values of shoot and pod dry weight under P3 and P4 treatments, and the consequent decrease at higher levels of P, differ from the results obtained by previous researchers [46,47]. The apparently contradictory results obtained in our experiment can be attributed to the longer duration imposed in our treatments. Moreover, our results suggest that levels of P greater than 4 mM may be toxic, or excessive, for adequate plant growth and hence shoot and pod dry weight decreased under the highest P treatments.
The results obtained in our experiment report higher concentrations of glucose, fructose, sucrose, and starch in shoots than in roots at the end of the experimental period. Nevertheless, it is necessary to point out that increasing doses of P in the nutrient solution resulted only in a remarkable increase in soluble sugars (fructose, glucose, and sucrose) in roots, especially in plants grown under P3 and P4. These results suggest an alteration of source/sink balance under different P levels (P deficiency in P1 and P2 and P excess in P5 and P6) as reported by Passarinho et al. [48]. The increase in soluble sugars in roots in green bean plants can be ascribed to the greater translocation from the aerial part to roots [26], a higher rate of hydrolysis of sucrose [27], and a decline in hexose phosphorylation [44]. It may also be due to energy consumption by the roots, which in the case of P deficit can be related to the active P uptake [49], and in the case of excess, with the maintenance of the cytoplasmic osmotic potential of the root cells [50]. In our experiment, the lack of variations in starch concentration in roots and shoots of green bean under increasing P concentration levels in the nutrient solution was not in line with previous findings noted by other researchers such as Fredeen et al. [51] and Rao et al. [52], who reported an increase in starch concentrations in organs of soybean and sugar beet under P increase, respectively. The excessive application of P can result in negative effects in chloroplasts, since they are involved in the exchange of triose P and other phosphorylated metabolites against phosphate; therefore, if the levels of P are too high, this may cause a depletion of the activity of this organelle in metabolites, which could affect photosynthesis (breakdown of RPPP) or transitory starch.
As far as enzymatic activities were concerned, the homeostasis of sugars in the different organs of a plant is controlled through different enzymes aiming to control the biosynthesis and degradation of soluble sugars according to the requirements of the plant. In the same vein, Ho et al. [53] reported that differences in enzymatic activities related to sucrose metabolism depended on the activity of the sucrose-degrading enzymes inside the sink, since they are responsible for the capacity of the sink organ to import assimilates and thus sink strength. With respect to P supply, we reported the same trend in the roots and shoots of sucrose biosynthesis enzymes (SPS and F1,6BPase) and sucrose degradation via SS activities. The highest activity was presented under P3 treatment, decreasing under deficit, insufficient, and excessive P supply. Nevertheless, it is necessary to point out a different trend in the biosynthesis and degradation of sucrose in the roots and shoots of green bean plants related to invertase activity. In roots, there was a similar trend with respect to the other enzymes, also suggesting a decrease in sugar metabolism under P deficit and excess conditions. Nevertheless, in shoots, there was no clear trend under increasing P supply to the nutrient solution.
The enzymes SPS and F1,6BPase participate in sucrose biosynthesis in the cytosol of the cell from triose-P, with SPS being the main enzyme responsible for the regulation of this biosynthesis [54]. Our results may suggest that in these treatments, both enzymes were involved in the biosynthesis of sucrose in roots.
The results obtained in our experiment report that the degradation of sucrose in shoots through the SS pathway can be related to the reduction in the energy of the invertase pathway to break down sucrose into two molecules of Fru-6-P, as reported by Black et al. [55]. In addition, the participation of SS in sucrose degradation could be due to this enzyme’s relationship with vascular tissues and its presence in the adjacent cells, as noted by Ciereszko et al. [26]. This may be justified by their function in hydrolysis and sucrose unloading via the phloem in the developing parts of green bean [27]. At root level, these results may suggest that phloem unloading was occurring via the symplast [56]. On the other hand, the higher activity of acid or alkaline invertases could be associated with the stage of the growing organs, since alkaline invertase is more crucial for sucrose breakdown, which occurs under P deficit treatments, while acidic invertase is more active in less-developed organs, which occurs under excess P treatments [57].
With regard to total P, the accumulation in all the organs of green beans under increasing doses of P in the nutrient solution agrees with the results reported by Thao et al. [58] who noted the same trend in lettuce. It is necessary to point out that in our experiment, there was a high correlation between the different fractions of P assessed and the increasing doses of P in the nutrient solution. Reviewing the previous literature, there are several references indicating that under increasing P concentration levels to the nutrient solution, P concentration increased in the different fractions assessed, as well as in the different organs studied in green beans [59,60,61], and in other crops such as wheat [62] and cucumber [63].
Inorganic P concentration in all the organs assessed in our experiment showed the same trend as the total P concentration. Considering the results obtained, it can be suggested that under increasing doses of P in the nutrient solution, green beans plants may have upregulated several genes involved in the activity of low affinity Pi transporters responsible for Pi uptake under increasing concentrations of P in the nutrient solution, as noted by Nussaume et al. [64] and Gu et al. [65]. Analogously, the highest concentration of inorganic P in the different sections, assessed under the highest concentration of P in the nutrient solution, can be due to the role of this fraction as a reserve for phosphorus which can be used by the plant during times of higher rate synthesis of new chemical compounds [66].
As far as organic P was concerned, the highest concentration of this P fraction in plants grown under P6 treatment suggests that there was an increase in nucleic acids and phospholipids under increasing P supply, as has been reported previously by Bieleski [12] in green bean plants. In our experiment, the increasing values of the organic P/inorganic P ratio in roots, shoots, and pods under increasing P supply in the nutrient solution suggest an efficient conversion of inorganic P into organic P for their consecutive use in the synthesis of phosphorous compounds, as reported by Lambers and Plaxton [67]. In the case of seeds, the decrease in the ratio under increasing P supply can be ascribed to the accumulation of organic P in the form of phytates [68].
Nevertheless, the P level in the different organs can be evaluated through different P pools [12]. In our experiment, we assessed the lipidic P, proteic P, RNA-P and DNA-P fractions in the different fractions of the plants: roots, shoots, pods and seeds as well as the phytates in pods. Considering the lipidic P fraction, our results show that the highest levels of P in the nutrient solution resulted in the highest concentration of lipidic P in all the organs assessed. This fact can be ascribed to the higher presence of Pi, as occurred in the P6 treatment, since one strategy to achieve Pi from internal sources is the degradation of biological molecules with Pi. In plants, the activation of phospholipases to hydrolyze phospholipids and the release of Pi is common [14].
Organic P is a crucial element in the chemical composition of nucleic acids (DNA and RNA) [69]. In our experiment, the different organs assessed in green beans had the highest concentration of DNA and RNA in plants grown under the highest application of P. The highest DNA concentration can be related to the overexpression of several P-responsive genes, responsible for phosphate transporter accumulation and phosphatases, as reported by Tian et al. [70]. In the case of RNA, the highest value in plants grown under P6 treatment could be due to the enhancement of protein synthesis under increasing P supply to the plant [71,72]. In our experiment, the highest concentration of proteic-P in plants grown under the highest P supply to the nutrient solution can be related to the previously mentioned protein biosynthesis increase. Although the application of increasing concentrations of P in the nutrient solution resulted in a consequent increase in P in all the forms and organs assessed, it could be possible that the excess of application changed several biological pathways with a crucial role in the growth of the plants, resulting in the decline in dry weight. Moreover, the increase in P uptake may suggest the presence of high and low-affinity transporters in green bean plants. The high affinity transporter whose activity was enhanced under low P supply and the low affinity transporter working at high P supply with a constitutive activity.
Acid phosphatases participate in several metabolic and bioenergetics processes at the cellular level, such as the uptake, allocation, and recycling of Pi. The expression of APase genes is affected by different environmental factors [73]. Reviewing the previous literature, there are several studies reporting that the activity of phosphatase acids can be enhanced under P deficiency in green beans [74], as well as in other crops such as lupinus [75], white clover [76], and wheat [77]. Nevertheless, our results reveal that under increasing P supply to green beans, the activity of phosphatase acid decreased in the different organs assessed. This fact can be explained because the decline in the activity of phosphatase acid responsible for the hydrolysis of Pi from phosphate-monoesters, such as nucleic acids and phospholipids [78], increased the concentration of several fractions of P, such as lipidic, DNA, and RNA fractions.
In our experiment, the concentrations of phytates in seeds increased under increasing phosphorus supply in the nutrient solution. These results are in line with previous findings reported by Lockhart and Hurt [79], who noted that the phytate concentration was highly correlated with phosphorus levels. High amounts of P in seeds is also crucial for their formation and development [80]. This increase in phytates in seeds can be ascribed to a reduction in the activity of chalcone isomerase (CHI) and phenylalanine ammonia-lyase (PAL), as reported by Chen et al. [81]. The negative effect of excess consumption of phytate in the human diet is worth mentioning, especially in vegetarians, since it is considered an anti-nutrient associated with low absorption of other nutrients such as Ca, Cu, Fe, Zn and Mn, resulting in negative nutritional well-being [82]. Moreover, the acceptable threshold of phytate concentration established by the FAO for green beans is 358 mg/100 g DW [83], therefore nutrition with green beans grown under P4, P5, and P6 treatments is not recommended. The increase in phytates in seeds can be associated with the fact that when the rate of Pi uptake is excessive, plants tend to prevent the accumulation of toxic Pi concentrations which can be carried out through the conversion of the inorganic form of P into organic storage compounds like phytates. Therefore, it would be recommendable to perform the fertigation of green beans with phosphorus concentrations below to 4 mM in order to avoid nutritional disorders and also a reduction in yield in this species.

5. Conclusions

The increase in P dose in the nutrient solution supplied to green bean reduced shoot dry weight, and the highest values for shoot and pod dry weight were in green beans plants grown under P3 and P4 treatments. After sixty days of sowing, increasing P supply in the nutrient solution resulted in higher concentrations of glucose, fructose, sucrose, and starch in the shoots compared to the roots of green bean plants. Non-structural carbohydrates (glucose, fructose and sucrose) showed the highest value in the roots in green bean plants grown under P3 and P4, whereas in shoots, they remained constant and lower than the control treatment under increasing P supply. With regard to starch, the concentration in roots and shoots did not change under different P doses. Considering the enzymatic activities related to the biosynthesis and degradation of soluble sugars, it is necessary to point out different trends in the roots and shoots for invertases. The increase in P supply to the nutrient solution resulted in an increase in the concentration of the different forms assessed for P in all the organs studied. Under increasing P supply, acid phosphatase activity declined in all the organs assessed, whereas seed phytate concentration increased. These results corroborate the significance of studying the physiological responses of P supply to select the most adequate P concentration for the growth of green bean plants, since human nutrition with green beans grown under P4, P5, and P6 treatments is not recommended.

Author Contributions

Conceptualization, M.T.L.; data curation, P.G.-C. and P.P.-R.; formal analysis, E.S.; investigation, P.G.-C. and E.S.; project administration, M.T.L.; supervision, M.T.L.; writing—original draft, P.G.-C. and E.S. All authors have read and agreed to the published version of the manuscript.

Funding

This research received no external funding.

Institutional Review Board Statement

Not applicable.

Informed Consent Statement

Not applicable.

Data Availability Statement

Not applicable.

Acknowledgments

The authors thank the funding of this work by the group AGR-242 from University of Almería (Sustainability of Horticultural and Ornamental Protected Systems).

Conflicts of Interest

The authors declare no conflict of interest.

References

  1. Zafar, M.; Abbasi, M.K.; Rahim, N.; Khaliq, A.; Shaheen, A.; Jamil, M.; Shahid, M. Influence of integrated phosphorus supply and plant growth promoting rhizobacteria on growth, nodulation, yield and nutrient uptake in Phaseolus vulgaris. Afr. J. Biotechol. 2011, 10, 16781–16792. [Google Scholar]
  2. Myers, J.R.; Kmiecik, K. Common bean: Economic importance and relevance to biological science research. In The Common Bean Genome; Springer: Cham, Switzerland, 2017; pp. 1–20. [Google Scholar]
  3. Food and Agriculture Organization of the United Nations (FAO). FAO Statistics. 2018. Available online: http://www.fao.org/faostat/en/#home (accessed on 30 November 2020).
  4. Pizzeghello, D.; Berti, A.; Nardi, S.; Morari, F. Phosphorus forms and P-sorption properties in three alkaline soils after long-term mineral and manure applications in north-eastern Italy. Agric. Ecosyst. Environ. 2011, 141, 58–66. [Google Scholar] [CrossRef]
  5. Pizzeghello, D.; Berti, A.; Nardi, S.; Morari, F. Relationship between soil test phosphorus and phosphorus release to solution in three soils after long-term mineral and manure application. Agric. Ecosyst. Environ. 2016, 233, 214–223. [Google Scholar] [CrossRef]
  6. Saad, S.; Lam-Son, P.T. Legume Nitrogen Fixation in Soils with Low Phosphorus Availability; Springer: Berlin/Heidelberg, Germany, 2017; p. 286. [Google Scholar]
  7. Vance, C.P.; Uhde-Stone, C.; Allan, D.L. Phosphorus acquisition and use: Critical adaptations by plants for securing a nonrenewable resource. New Phytol. 2003, 157, 423–447. [Google Scholar] [CrossRef] [Green Version]
  8. Yang, X.J.; Finnegan, P.M. Regulation of phosphate starvation responses in higher plants. Ann. Bot. 2010, 105, 513–526. [Google Scholar] [CrossRef]
  9. Hansen, J.C.; Cade-Menun, B.J.; Strawn, D.G. Phosphorus speciation in manure-amended alkaline soils. J. Environ. Qual. 2004, 33, 1521–1527. [Google Scholar] [CrossRef]
  10. Turner, B.L.; Richardson, A.E.; Mullaney, E.J. Inositol Phosphates: Linking Agriculture and the Environment; CAB International: Wallingford, UK, 2007; p. 304. [Google Scholar]
  11. Raghothama, K.G. Phosphate acquisition. Ann. Rev. Plant Physiol. Plant Mol. Biol. 1999, 50, 665–693. [Google Scholar] [CrossRef]
  12. Bieleski, R.L. Phosphate pools, phosphate transport, and phosphate availability. Ann. Rev. Plant. Physiol. 1973, 24, 225–252. [Google Scholar] [CrossRef]
  13. Maathuis, F.J.M. Physiological functions of mineral macronutrients. Curr. Opin. Plant Biol. 2009, 12, 250–258. [Google Scholar] [CrossRef]
  14. Plaxton, W.C.; Tran, H.T. Metabolic adaptations of phosphate-starved plants. Plant Physiol. 2011, 156, 1006–1015. [Google Scholar] [CrossRef] [Green Version]
  15. Pang, J.; Ryan, M.H.; Lambers, H.; Siddique, K.H. Phosphorus acquisition and utilisation in crop legumes under global change. Curr. Opin. Plant Biol. 2018, 45, 248–254. [Google Scholar] [CrossRef] [PubMed]
  16. Rees, T. Compartmentation of plant metabolism. In The Biochemistry of Plants; Davies, D.D., Ed.; Academic Press: San Diego, CA, USA, 1987; Volume 12: Physiology of, Metabolism, pp. 87–115. [Google Scholar]
  17. Wind, J.; Smeekens, S.; Hanson, J. Sucrose: Metabolite and signaling molecule. Phytochemistry 2010, 71, 1610–1614. [Google Scholar] [CrossRef]
  18. MacRae, E.; Lunn, J. Control of sucrose biosynthesis. Ann. Plant. Rev. 2018, 22, 234–257. [Google Scholar]
  19. Tauzin, A.S.; Giardina, T. Sucrose and invertases, a part of the plant defense response to the biotic stresses. Front. Plant Sci. 2014, 5, 293. [Google Scholar] [CrossRef]
  20. Xu, X.; Yang, Y.; Liu, C.; Sun, Y.; Zhang, T.; Hou, M.; Huang, S.; Yuan, H. The evolutionary history of the sucrose synthase gene family in higher plants. BMC Plant Biol. 2019, 19, 1–14. [Google Scholar] [CrossRef] [Green Version]
  21. Granot, D.; Stein, O. An overview of sucrose synthases in plants. Front. Plant Sci. 2019, 10, 95. [Google Scholar]
  22. Wan, H.; Wu, L.; Yang, Y.; Zhou, G.; Ruan, Y.L. Evolution of sucrose metabolism: The dichotomy of invertases and beyond. Trends Plant Sci. 2018, 23, 163–177. [Google Scholar] [CrossRef]
  23. Jin, J.; Tang, C.; Sale, P. The impact of elevated carbon dioxide on the phosphorus nutrition of plants: A review. Ann. Bot. 2015, 116, 987–999. [Google Scholar] [CrossRef] [Green Version]
  24. Raven, J.A.; Lambers, H.; Smith, S.E.; Westoby, M. Costs of acquiring phosphorus by vascular land plants: Patterns and implications for plant coexistence. New Phytol. 2018, 217, 1420–1427. [Google Scholar] [CrossRef] [Green Version]
  25. Khan, M.S.; Zaidi, A.; Ahmad, E. Mechanism of phosphate solubilization and physiological functions of phosphate-solubilizing microorganisms. In Phosphate Solubilizing Microorganisms; Springer: Cham, Switzerland, 2014; pp. 31–62. [Google Scholar]
  26. Ciereszko, I.; Gniazdowska, A.; Mikulska, M.; Rychter, A.M. Assimilate translocation in bean plants (Phaseolus vulgaris L.) during phosphate deficiency. J. Plant Physiol. 1996, 149, 343–348. [Google Scholar] [CrossRef]
  27. Ciereszko, I.; Zambrzycka, A.; Rychter, A.M. Sucrose hydrolysis in bean roots (Phaseolus vulgaris L.) under phosphate deficiency. Plant Sci. 1998, 133, 139–144. [Google Scholar] [CrossRef]
  28. Ciereszko, I.; Miłosek, I.; Rychter, A.M. Assimilate distribution in bean plants (Phaseolus vulgaris L.) during phosphate limitation. Acta Soc. Bot. Pol. 1999, 68, 269–273. [Google Scholar] [CrossRef] [Green Version]
  29. Ciereszko, I.; Barbachowska, A. Sucrose metabolism in leaves and roots of bean (Phaseolus vulgaris L.) during phosphate deficiency. J. Plant Physiol. 2000, 156, 640–644. [Google Scholar] [CrossRef]
  30. Wolf, B. A comprehensive system of leaf analysis and its use for diagnosing crop nutrient status. Commun. Soil Sci. Plant Anal. 1982, 13, 1035–1059. [Google Scholar] [CrossRef]
  31. Irigoyen, J.J.; Emerich, D.W.; Sánchez-Díaz, M. Water stress induced changes in the concentrations of proline and total soluble sugars in nodulated alfalfa (Medicago sativa) plants. Physiol. Plant 1992, 8, 455–460. [Google Scholar] [CrossRef]
  32. Hubbard, N.L.; Huber, S.C.; Pharr, D.M. Sucrose phosphate synthase and acid invertase as determinants of sucrose concentration in developing muskmelon (Cucumis melo L.) fruits. Plant Physiol. 1989, 91, 1527–1534. [Google Scholar] [CrossRef] [Green Version]
  33. Bradford, M.M. A rapid and sensitive method for the quantification of microgram quantities of protein utilizing the principle of protein-dye binding. Anal. Biochem. 1976, 72, 248–254. [Google Scholar] [CrossRef]
  34. Cheikh, N.; Brenner, M.L. Regulation of key enzymes of sucrose biosynthesis in soybean leaves. Plant Physiol. 1992, 100, 1230–1237. [Google Scholar] [CrossRef] [Green Version]
  35. Van Handel, E. Direct microdetermination of sucrose. Anal. Biochem. 1968, 22, 280–283. [Google Scholar] [CrossRef]
  36. Holaday, S.A.; Martindale, W.; Alred, R.; Brooks, A.L.; Leegood, R.C. Changes in activities of enzymes of carbon metabolism in leaves during exposure of plants to low temperature. Plant Physiol. 1992, 98, 1105–1114. [Google Scholar] [CrossRef] [Green Version]
  37. Geladopoulus, T.P.; Sotiroudis, T.G.; Evangelopoulus, A.E. A malachite green colorimetric assay for protein phosphatase activity. Anal. Biochem. 1991, 192, 112–116. [Google Scholar] [CrossRef]
  38. Miller, G.L. Use of dinitrosalicylic acid reagent for determination of reducing sugar. Anal. Chem. 1959, 31, 426–428. [Google Scholar] [CrossRef]
  39. Hogue, E.; Wilcow, G.E.; Cantlife, D.J. Effect of soil P on phosphate fraction in tomato leaves. J. Am. Soc. Hortic. Sci. 1970, 95, 174–176. [Google Scholar]
  40. López-Cantarero, I.; Ruiz, J.M.; Hernández, J.; Romero, L. Phosphorus metabolism and yield response to increases in nitrogen-phosphorus fertilization: Improvement in greenhouse cultivation of eggplant (Solanum melongena cv. Bonica). J. Agric. Food. Chem. 1998, 46, 1603–1608. [Google Scholar] [CrossRef]
  41. Besford, R.T. Phosphorus nutrition and acid phosphatase activity in leaves of seven plant species. J. Sci. Food Agric. 1979, 30, 282–285. [Google Scholar] [CrossRef]
  42. Ruiz, J.M.; Belakbir, A.; Romero, L. Foliar level of phosphorus and its bioindicators in Cucumis melo grafted plants. A possible effect of rootstock. J. Plant Physiol. 1996, 149, 400–404. [Google Scholar] [CrossRef]
  43. Graf, E.; Dintzis, F.R. High-performance liquid chromatographic method for the determination of phytate. Anal. Biochem. 1982, 119, 413–417. [Google Scholar] [CrossRef]
  44. Rychter, A.M.; Randall, D.D. The effect of phosphate deficiency on carbohydrate metabolism in bean roots. Physiol. Plant 1994, 91, 383–388. [Google Scholar] [CrossRef]
  45. Zhu, J.; Zhang, C.; Lynch, J.P. The utility of phenotypic plasticity of root hair length for phosphorus acquisition. Funct. Plant Biol. 2010, 37, 313–322. [Google Scholar] [CrossRef]
  46. Pieters, A.J.; Paul, M.J.; Lawlor, D.W. Low sink demand limits photosynthesis under Pi deficiency. J. Exp. Bot. 2001, 52, 1083–1091. [Google Scholar] [CrossRef] [Green Version]
  47. Warren, C.R.; Adams, M.A. Phosphorus affects growth and partitioning of nitrogen to Rubisco in Pinus pinaster. Tree Physiol. 2002, 22, 11–19. [Google Scholar] [CrossRef] [PubMed] [Green Version]
  48. Passarinho, J.A.; Rodrigues, M.L.; Osorio, M.L.; Ricardo, C.P.; Chaves, M.M. Physiological responses of Lupinus mutabilis to phosphorus nutrition and season of growth. J. Plant. Nutr. 2000, 23, 487–505. [Google Scholar] [CrossRef]
  49. Mengel, K.; Kirkby, E.A. Principles of Plant Nutrition; Kluwer Academic Publishers: Dordrecht, The Netherlands, 2001; 849p. [Google Scholar]
  50. Marschner, H. Mineral Nutrition of Higher Plants; Acaemic Press: London, UK, 2011; 645p. [Google Scholar]
  51. Fredeen, A.L.; Rao, I.M.; Terry, N. Influence of phosphorus nutrition on growth and carbon partitioning in Glycine max. Plant Physiol. 1989, 89, 225–230. [Google Scholar] [CrossRef] [Green Version]
  52. Rao, I.M.; Fredeen, A.L.; Terry, N. Leaf phosphate status, photosynthesis, and carbon partitioning in sugar beet III. Diurnal changes in carbon partitioning and carbon export. Plant Physiol. 1990, 92, 29–36. [Google Scholar] [CrossRef] [PubMed] [Green Version]
  53. Ho, L.C.; Lecharny, A.; Willenbrink, J. Sucrose cleavage in relation to import and metabolism of sugars in sink organs. In Phloem Transport and Assimilate Compartmentation; Bonneman, J.L., Delrot, S., Lucas, W.J., Danty, J., Eds.; Intercept Ltd.: Andover, UK, 1991; pp. 178–186. [Google Scholar]
  54. Stitt, M.; Herzog, B.; Heldt, H.W. Control of photosynthetic sucrose synthesis by fructose 2,6-bisphosphate, I: Coordination of CO2 fixation and sucrose synthesis. Plant Physiol. 1981, 75, 548–553. [Google Scholar] [CrossRef] [Green Version]
  55. Black, C.C.; Mustardy, L.; Sung, S.S.; Kormanik, P.P.; Xu, D.P.; Paz, N. Regulation and roles for alternative pathways of hexose metabolism in plants. Physiol. Plant 1987, 69, 387–394. [Google Scholar] [CrossRef]
  56. Ross, H.A.; Davies, H.V. Purification and characterization of sucrose synthase from the cotyledons of Vicia faba L. Plant Physiol. 1992, 100, 1008–1013. [Google Scholar] [CrossRef] [Green Version]
  57. Schaffer, A.A. Invertases in young and mature leaves of Citrus sinensis. Phytochemistry 1986, 25, 2275–2277. [Google Scholar] [CrossRef]
  58. Thao, H.T.B.; Yamakawa, T.; Shibata, K. Effect of phosphite-phosphate interaction on growth and quality of hydroponic lettuce (Lactuca sativa). J. Plant. Nutr. Soil Sci. 2009, 172, 378–384. [Google Scholar] [CrossRef]
  59. Gidago, G.; Beyene, S.; Worku, W.; Sodo, E. The response of haricot bean (Phaseolus vulgaris L.) to phosphorus application on Ultisols at Areka, Southern Ethiopia. J. Biol. Agric. Healthc. 2011, 1, 38–49. [Google Scholar]
  60. Ávila, F.W.; Faquin, V.; da Silva Lobato, A.K.; Ávila, P.A.; Marques, D.J.; Silva Guedes, E.M.; Tan, D.K.Y. Effect of phosphite supply in nutrient solution on yield, phosphorus nutrition and enzymatic behavior in common bean (Phaseolus vulgaris L.) plants. Austr. J. Crop. Sci. 2013, 7, 713. [Google Scholar]
  61. Gulmezoglu, N.; Daghan, H. The interactive effects of phosphorus and salt on growth, water potential and phosphorus uptake in green beans. Appl. Ecol. Environ. Res. 2017, 15, 1831–1842. [Google Scholar] [CrossRef]
  62. Hussain, A.; Larsson, H.; Kuktaite, R.; Johansson, E. Mineral composition of organically grown wheat genotypes: Contribution to daily minerals intake. Inter. J. Environ. Res. Public Health 2010, 7, 3442–3456. [Google Scholar] [CrossRef] [PubMed]
  63. Constan-Aguilar, C.; Sánchez-Rodríguez, E.; Rubio-Wilhelmi, M.M.; Camacho, M.A.; Romero, L.; Ruiz, J.M.; Blasco, B. Physiological and nutritional evaluation of the application of phosphite as a phosphorus source in cucumber plants. Commun. Soil Sci. Plant. Anal. 2014, 45, 204–222. [Google Scholar] [CrossRef]
  64. Nussaume, L.; Kanno, S.; Javot, H.; Marin, E.; Nakanishi, T.M.; Thibaud, M.C. Phosphate import in plants: Focus on the PHT1 transporters. Front. Plant Sci. 2011, 2, 83. [Google Scholar] [CrossRef] [Green Version]
  65. Gu, M.; Chen, A.; Sun, S.; Xu, G. Complex regulation of plant phosphate transporters and the gap between molecular mechanisms and practical application: What is missing? Mol. Plant 2016, 9, 396–416. [Google Scholar] [CrossRef] [Green Version]
  66. Bieleski, R.L.; Ferguson, I.B. Physiology and metabolism of phosphate and its compounds. In Encyclopedia of Plant Physiology; Lauchli, A., Bieleski, R.L., Eds.; Springer: Berlin/Heidelberg, Germany, 1983; Volume 15a, pp. 422–449. [Google Scholar]
  67. Lambers, H.; Plaxton, W.C. Phosphorus: Back to the roots. Ann. Plant Rev. 2015, 48, 3–22. [Google Scholar]
  68. Taliman, N.A.; Dong, Q.; Echigo, K.; Raboy, V.; Saneoka, H. Effect of phosphorus fertilization on the growth, photosynthesis, nitrogen fixation, mineral accumulation, seed yield, and seed quality of a soybean low-phytate line. Plants 2019, 8, 119. [Google Scholar] [CrossRef] [Green Version]
  69. Malhotra, H.; Sharma, S.; Pandey, R. Phosphorus nutrition: Plant growth in response to deficiency and excess. In Plant Nutrients and Abiotic Stress Tolerance; Springer: Singapore, 2018; pp. 171–190. [Google Scholar]
  70. Tian, J.; Venkatachalam, P.; Liao, H.; Yan, X.; Raghothama, K. Molecular cloning and characterization of phosphorus starvation responsive genes in common bean (Phaseolus vulgaris L.). Planta 2007, 227, 151–165. [Google Scholar] [CrossRef]
  71. Elser, J.J.; Fagan, W.F.; Kerkhoff, A.J.; Swenson, N.G.; Enquist, B.J. Biological stoichiometry of plant production: Metabolism, scaling and ecological response to global change. New Phytol. 2010, 186, 593–608. [Google Scholar] [CrossRef] [Green Version]
  72. Raven, J.A. Protein turnover and plant RNA and phosphorus requirements in relation to nitrogen fixation. Plant Sci. 2012, 188, 25–35. [Google Scholar] [CrossRef] [PubMed]
  73. Tran, H.T.; Hurley, B.A.; Plaxton, W.C. Feeding hungry plants: The role of purple acid phosphatases in phosphate nutrition. Plant Sci. 2010, 179, 14–27. [Google Scholar] [CrossRef]
  74. Araujo, A.P.; Plassard, C.; Drevon, J.J. Phosphatase and phytase activities in nodules of common bean genotypes at different levels of phosphorus supply. Plant Soil 2008, 312, 129. [Google Scholar] [CrossRef]
  75. Wasaki, J.; Ando, M.; Ozawa, K.; Omura, M.; Osaki, M.; Ito, H.; Matsui, H. Properties of secretary acid phosphatase from lupin roots under phosphorus-deficient conditions. Soil Sci. Plant Nutr. 1997, 43, 981–986. [Google Scholar] [CrossRef]
  76. Hunter, D.A.; McManus, M.T. Comparison of acid phosphatases in two genotypes of white clover with different responses to applied phosphate. J. Plant Nutr. 1999, 22, 679–692. [Google Scholar] [CrossRef]
  77. George, T.S.; Gregory, P.J.; Hocking, P.; Richardson, A.E. Variation in root-associated phosphatase activities in wheat contributes to the utilization of organic P substrates in vitro, but does not explain differences in the P-nutrition of plants when grown in soils. Environ. Exp. Bot. 2008, 64, 239–249. [Google Scholar] [CrossRef]
  78. Plaxton, W.C. Plant Response to Stress: Biochemical Adaptations to Phosphate Deficiency; Encyclopedia of Plant and Crop Science; Marcel Dekker: New York, NY, USA, 2004; pp. 976–980. [Google Scholar]
  79. Lockhart, H.B.; Hurt, H.D. Nutrition of Oats; American Association of Cereal Chemists: St. Paul, MN, USA, 1986; pp. 297–308. [Google Scholar]
  80. White, P.J.; Veneklaas, E.J. Nature and nurture: The importance of seed phosphorus content. Plant Soil 2012, 357, 1–8. [Google Scholar] [CrossRef]
  81. Chen, R.; Song, S.; Li, X.; Liu, H.; Huang, D. Phosphorus deficiency restricts plant growth but induces pigment formation in the flower stalk of Chinese kale. Hortic. Environ. Biotechnol. 2013, 54, 243–248. [Google Scholar] [CrossRef]
  82. Gupta, K.; Barat, G.K.; Wagle, D.S.; Chawla, H.K.L. Nutrient contents and antinutritional factors in conventional and non-conventional leafy vegetables. Food Chem. 1989, 31, 105–116. [Google Scholar] [CrossRef]
  83. Kennedy, G.; Nantel, G. Basic Guidelines for Validation of a Simple Dietary Diversity Score as an Indicator of Dietary Nutrient Adequacy for Non-Breastfeeding Children 2–6 Years; FAO: Rome, Italy, 2006. [Google Scholar]
Figure 1. Effects of different P treatments on root, shoot, and pod dry weight in green bean plants at the end of the experiment. Means with the same lower-case letter are not significantly different at p < 0.05 according to LSD and one-way ANOVA. Error bars represent standard deviation of the means (SE), n = 6.
Agronomy 11 00245 g001
Figure 2. Relationship between P treatments (expressed in mM) and total P (expressed in mg plant−1).
Agronomy 11 00245 g002
Figure 3. Effects of different P treatments on acid phosphatase activity in roots, shoots, pods and seeds of green bean plants at the end of the experiment. Means with the same lower-case letter are not significantly different at p < 0.05 according to LSD and one-way ANOVA. Error bars represent standard deviation of the means (SE), n = 6.
Agronomy 11 00245 g003
Figure 4. Effects of different P treatments on phytate concentration in seeds of green bean plants at the end of the experiment. Means with the same lower-case letter are not significantly different at p < 0.05 according to LSD and one-way ANOVA. Error bars represent standard deviation of the means (SE), n = 6.
Agronomy 11 00245 g004
Table 1. Effects of different P treatments on the accumulation of non-structural carbohydrates in the roots and shoots of green bean plants at the end of the experiment. n = 6. Means ± standard deviation within columns with different lower-case letters are significantly different at p < 0.05 (one-way ANOVA and LSD tests).
TreatmentsGlucose
(mg g−1 FW)
Fructose
(mg g−1 FW)
Sucrose
(mg g−1 FW)
Starch
(mg g−1 FW)
Roots
P12.05 ± 0.18 d2.19 ± 0.19 d1.99 ± 0.17 d11.75 ± 1.02 a
P22.68 ± 0.23 c2.85 ± 0.25 c2.59 ± 0.23 c11.69 ± 1.02 a
P36.44 ± 0.56 a6.86 ± 0.60 a6.23 ± 0.54 a11.11 ± 0.97 a
P46.68 ± 0.58 a7.11 ± 0.62 a6.46 ± 0.56 a12.14 ± 1.06 a
P54.52 ± 0.39 b4.81 ± 0.42 b4.37 ± 0.38 b11.58 ± 1.27 a
P62.60 ± 0.23 c2.77 ± 0.24 c2.52 ± 0.22 c10.28 ± 0.90 a
Shoots
P117.13 ± 1.49 a18.25 ± 1.59 a16.57 ± 1.44 a13.96 ± 1.65 a
P211.16 ± 0.97 b11.89 ± 1.04 b10.80 ± 0.94 b13.01 ± 1.40 a
P310.37 ± 0.90 b11.04 ± 0.96 b10.03 ± 0.87 b14.02 ± 1.36 a
P410.14 ± 0.88 b10.78 ± 0.88 b10.05 ± 0.88 b13.85 ± 1.29 a
P510.71 ± 1.11 b10.54 ± 1.18 b9.81 ± 0.86 b13.35 ± 1.16 a
P610.59 ± 1.05 b11.68 ± 1.02 b10.29 ± 1.07 b14.13 ± 1.23 a
Table 2. Effects of different P treatments on the key enzymes involved in the biosynthesis and degradation of sucrose in roots and shoots of green bean plants at the end of the experiment. n = 6. Means ± standard deviation within columns with different lower-case letters are significantly different at p < 0.05 (one-way ANOVA and LSD tests).
Sucrose BiosynthesisSucrose Degradation
TreatmentsSPS
(µmol Sucrose
mg−1 prot. h−1)
F1,6BPase
(µmol Pi
mg−1 prot. min−1)
SS
(µmol Sucrose
mg−1 prot. h−1)
Acid Invertase
(µmol Glucose
mg−1 prot. h−1)
Alkaline Invertase
(µmol Glucose
mg−1 prot. h−1)
Roots
P15.02 ± 0.44 c77.16 ± 6.73 d3.62 ± 0.32 c216.30 ± 18.86 b229.00 ± 19.96 d
P25.17 ± 0.45 c86.64 ± 7.55 d3.39 ± 0.30 c222.90 ± 19.92 b234.80 ± 20.47 d
P38.79 ± 0.77 a226.10 ± 19.71 a6.14 ± 0.54 a272.60 ± 23.76 a411.10 ± 35.84 a
P46.04 ± 0.53 b165.80 ± 14.45 b4.29 ± 0.37 b300.61 ± 26.21 a452.90 ± 39.48 a
P53.73 ± 0.40 d121.10 ± 10.56 c2.87 ± 0.24 c238.82 ± 20.82 b342.20 ± 29.83 b
P64.17 ± 0.36 d70.18 ± 6.12 d2.97 ± 0.26 c166.81 ± 14.54 c272.82 ± 23.78 c
Shoots
P14.27 ± 0.37 c84.03 ± 7.33 d3.51 ± 0.31 c46.87 ± 4.09 b155.10 ± 13.52 a
P24.56 ± 0.40 c108.80 ± 10.36 c3.22 ± 0.28 c21.63 ± 1.89 c96.18 ± 8.38 b
P37.47 ± 0.65 a179.70 ± 15.67 a5.76 ± 0.50 a14.39 ± 1.25 e37.54 ± 3.27 e
P46.60 ± 0.40 b127.60 ± 11.12 b4.43 ± 0.39 b17.65 ± 1.54 d59.10 ± 5.15 d
P54.17 ± 0.36 c107.90 ± 9.41 c3.70 ± 0.32 c55.34 ± 4.82 a77.40 ± 6.88 c
P64.42 ± 0.30 c105.01 ± 9.15 c3.31 ± 0.29 c59.72 ± 5.21 a± 7.12 c
Table 3. Effects of different P treatments on total, inorganic, organic and the organic P/inorganic P ratio in roots, shoots, pods, and seeds of green bean plants at the end of the experiment. n = 6. Means ± standard deviation within columns with different lower-case letters are significantly different at p < 0.05 (One-way ANOVA and LSD tests).
TreatmentsTotal P
(mg 100 g−1 DW)
Inorganic P
(mg 100 g−1 DW)
Organic P
(mg 100 g1 DW)
Organic P/Inorganic P
Roots
P1247.64 ± 22.18 f86.67 ± 8.17 f164.38 ± 16.21 d0.53 ± 0.04 e
P2531.85 ± 50.23 e228.61 ± 21.43 e303.59 ± 30.32 c0.75 ± 0.06 d
P3686.31 ± 64.25 d329.42 ± 29.64 d357.98 ± 33.60 c0.92 ± 0.08 c
P4953.82 ± 90.47 c476.90 ± 44.58 c477.76 ± 39.52 b1.00 ± 0.09 c
P51407.91 ± 141.22 b814.58 ± 79.28 b593.19 ± 45.44 a1.35 ± 0.06 b
P61655.56 ± 153.28 a991.82 ± 80.22 a664.58 ± 65.27 a1.49 ± 0.07 a
Shoots
P1167.08 ± 14.49 f50.12 ± 4.72 f117.11 ± 13.59 d0.43 ± 0.04 d
P2354.12 ± 29.91 e141.64 ± 11.94 e213.06 ± 21.74 c0.66 ± 0.06 c
P3449.02 ± 38.90 d188.59 ± 16.87 d261.76 ± 25.96 c0.72 ± 0.06 c
P4815.52 ± 79.88 c375.14 ± 31.46 c440.10 ± 34.79 b0.85 ± 0.08 b
P51218.13 ± 114.11 b596.88 ± 57.66 b622.26 ± 59.01 a0.96 ± 0.08 b
P61539.16 ± 145.45 a769.58 ± 71.17 a570.87 ± 56.64 a1.35 ± 0.11 a
Pods
P1144.52 ± 11.78 f40.46 ± 3.94 f104.46 ± 9.19 e0.39 ± 0.04 d
P2206.99 ± 19.57 e74.51 ± 6.94 e132.88 ± 14.04 d0.56 ± 0.06 c
P3343.67 ± 25.97 d134.02 ± 10.87 d209.60 ± 19.76 c0.64 ± 0.05 c
P4526.20 ± 49.78 c231.53 ± 19.88 c294.71 ± 29.03 b0.79 ± 0.06 b
P51021.42 ± 100.11 b439.84 ± 40.26 b582.63 ± 58.18 a0.75 ± 0.06 b
P61265.17 ± 111.25 a594.63 ± 47.07 a671.43 ± 69.42 a0.89 ± 0.07 a
Seeds
P1295.59 ± 21.49 f70.93 ± 6.44 e225.02 ± 25.59 e0.32 ± 0.02 a
P2486.67 ± 40.46 e107.06 ± 8.90 d379.33 ± 39.01 d0.28 ± 0.02 b
P3679.62 ± 62.93 d135.92 ± 10.43 c544.94 ± 59.96 c0.25 ± 0.02 b
P4977.44 ± 89.79 c175.93 ± 13.88 b802.51 ± 79.98 b0.22 ± 0.02 c
P51394.81 ± 101.15 b195.27 ± 16.86 b1200.47 ± 115.18 a0.16 ± 0.01 d
P61623.41 ± 103.45 a241.04 ± 19.97 a1383.57 ± 126.72 a0.17 ± 0.01 d
Table 4. Effects of different P treatments on lipidic P, proteic P, RNA-P and DNA-P in roots, shoots, pods and seeds of green bean plants at the end of the experiment. n = 6. Means ± standard deviation within columns with different lower-case letters are significantly different at p < 0.05 (One-way ANOVA and LSD tests).
TreatmentsLipidic P
(mg 100 g−1 DW)
Proteic P
(mg 100 g−1 DW)
RNA-P
(mg 100 g−1 DW)
DNA-P
(mg 100 g−1 DW)
Roots
P134.63 ± 3.17 e17.33 ± 1.70 f24.76 ± 2.19 e19.81 ± 1.18 e
P269.11 ± 5.45 d21.26 ± 2.23 e47.84 ± 4.55 d37.21 ± 2.83 d
P382.35 ± 7.42 c27.45 ± 2.54 d54.90 ± 5.60 d41.17 ± 3.59 d
P495.37 ± 8.26 c47.68 ± 4.06 c85.94 ± 7.92 c57.22 ± 4.58 c
P5135.70 ± 12.01 b60.31 ± 5.38 b135.70 ± 12.12 b75.39 ± 7.39 b
P6170.79 ± 14.19 a83.77 ± 8.22 a170.79 ± 13.54 a93.77 ± 7.23 a
Shoots
P125.06 ± 1.84 f13.36 ± 1.31 e18.37 ± 1.59 e15.03 ± 1.07 e
P242.49 ± 3.24 e14.16 ± 1.40 e35.41 ± 3.04 d28.32 ± 1.97 d
P358.37 ± 4.64 d22.45 ± 2.01 d40.41 ± 3.96 d31.43 ± 2.09 d
P489.70 ± 7.88 c48.93 ± 4.08 c81.55 ± 7.88 c57.08 ± 4.86 c
P5121.81 ± 11.01 b73.08 ± 6.86 b121.81 ± 11.18 b85.26 ± 8.04 b
P6169.30 ± 14.07 a 107.73 ± 10.07 a153.91 ± 12.89 a107.73 ± 9.26 a
Pods
P120.23 ± 1.44 d13.00 ± 1.04 e15.89 ± 1.35 f14.45 ± 1.49 f
P222.76 ± 1.24 d14.48 ± 1.11 e20.69 ± 1.86 e18.62 ± 1.71 e
P341.23 ± 3.87 c27.49 ± 2.57 d34.36 ± 2.96 d30.92 ± 2.80 d
P447.35 ± 4.18 c47.35 ± 3.88 c57.88 ± 5.08 c47.35 ± 4.02 c
P581.71 ± 6.86 b91.92 ± 8.81 b112.35 ± 10.16 b91.92 ± 9.01 b
P6139.16 ± 12.14 a111.21 ± 9.99 a126.51 ± 11.41 a111.21 ± 9.55 a
Seeds
P123.64 ± 1.51 f11.82 ± 0.94 e17.73 ± 1.04 f11.82 ± 1.12 e
P234.06 ± 2.14 e19.46 ± 1.52 d29.19 ± 2.04 e24.33 ± 2.01 d
P347.57 ± 3.95 d27.18 ± 2.17 c40.77 ± 3.47 d33.98 ± 2.90 c
P478.19 ± 6.18 c48.87 ± 4.47 b55.64 ± 5.13 c58.64 ± 4.63 b
P597.63 ± 8.24 b55.79 ± 5.16 b69.73 ± 6.18 b69.73 ± 6.11 b
P6133.63 ± 11.17 a69.93 ± 5.57 a88.16 ± 7.54 a84.16 ± 7.45 a
Table 5. Relationship between the different forms of P and the concentration of P supplied to the nutrient solution.
Regression EquationR2
Organic P = 0.13 P + 1.210.94
Lipidic P = 0.09 P + 0.310.97
Proteic P = 0.07 P − 0.150.97
RNA-P = 0.09 P − 0.040.99
DNA-P = 0.07 P + 0.100.99
Phytates = 0.03 P + 0.020.92
Publisher’s Note: MDPI stays neutral with regard to jurisdictional claims in published maps and institutional affiliations.

