Article

Genetic Purity of Cacao Criollo from Honduras Is Revealed by SSR Molecular Markers

1
Cacao and Agroforestry Program, Honduran Foundation for Agricultural Research (FHIA), La Lima Cortés 2067, Honduras
2
Dipartimento di Scienze e Tecnologie Agrarie, Alimentari Ambientali e Forestali (DAGRI), Sezione Colture Arboree, Università degli Studi di Firenze, Viale delle Idee, 30, 50019 Sesto Fiorentino, Italy
3
Rural Development Department, National Autonomous University of Honduras, Regional University Center of the Atlantic Littoral (UNAH-CURLA), Carretera CA-13, Desvio Frente a Maxi-Despensa Aeropuerto, La Ceiba 31101, Atlántida, Honduras
4
USDA-ARS Subtropical Horticulture Research Station, Old Cutler Road, Miami, FL 13601, USA
5
Dipartimento di Scienze e Tecnologie Agrarie, Alimentari Ambientali e Forestali (DAGRI), Sezione Scienze Agronomiche, Genetiche e Gestione del Territorio, Università degli Studi di Firenze, Piazzale delle Cascine 18, 50144 Firenze, Italy
*
Author to whom correspondence should be addressed.
Agronomy 2021, 11(2), 225; https://doi.org/10.3390/agronomy11020225
Submission received: 15 December 2020 / Revised: 19 January 2021 / Accepted: 22 January 2021 / Published: 26 January 2021
(This article belongs to the Special Issue Old Germplasm for New Needs: Managing Crop Genetic Resources)

Abstract

:
The cultivation of cacao represents an income option and a source of employment for thousands of small producers in Central America. In Honduras, due to the demand for fine flavor cacao to produce high-quality chocolate, the number of hectares planted is increasing. In addition, cacao clones belonging to the genetic group named Criollo are in great demand since their white beans lack of bitterness and excellent aroma are used in the manufacturing of premium chocolate. Unfortunately, the low resistance to pests and diseases and less productive potential of Criollo cacao leads to the replacement with vigorous new cultivars belonging to the other genetic groups or admixture of them. In this study, 89 samples showing phenotypic traits of Criollo cacao from four regions of Honduras (Copán, Santa Bárbara, Intibucá, and Olancho) were selected to study their genetic purity using 16 SSR molecular markers. The results showed that some samples belong to the Criollo group while other accessions have genetic characteristics of “Trinitario” or other admixtures cacao types. These results confirm the genetic purity of Criollo cacao in Honduras, reaffirming the theory that Mesoamerica is a cacao domestication center and also serves to generate interest in the conservation of this genetic wealth both in-situ and ex-situ.

1. Introduction

Cacao (Theobroma cacao L.) is an economically important crop because it produces the raw material for making chocolate. It is native to South America, with its center of origin in the upper Amazonian region spanning Peru, Colombia, Brazil, and Ecuador [1,2,3]. Cacao was initially thought to be domesticated in Southern Mexico and Central America since vessels used by pre-Columbian cultures in Honduras and Mexico contained trace remains of theobromine, confirming the use of cacao products 1800–1000 years BCE [4,5,6,7,8,9]. However, recent archaeological finds reveal that the upper Amazon region was also a center for the domestication of cacao [10].
Spanish settlers in Honduras were introduced to cacao and realized the importance of this crop [11,12]. Recent studies showed that during this period of domestication there was a high selection for genes related to anthocyanins and theobromine, which caused the cacao Criollo to maintain a high frequency of deleterious mutations [13].
Cacao has high genetic and morphological diversity, with a diploid genome consisting of 10 chromosomes (2n = 20) [14] with a genome size between 411 and 494 Mbp [15]. Initially based on phenotype, cacao was classified into three groups Criollo, Forastero, and Trinitario, which is a hybrid between Criollo and Forastero. Forastero cacao is characterized by seeds with purple cotyledons and most of the chocolate consumed in the world is produced from these seeds known as “bulk or ordinary” cacao [3]. Criollo cacao is characterized by having white or pale pink seeds, used for the formulation of premium chocolate that sells for higher prices in the market [16]. Trinitario beans are variable in cotyledon color and produce a liquor with a strong cacao flavor. Criollo and Trinitario are known collectively as “fine of flavor” cacao, along with Amelonado, Nacional, and Refractario (Nacional hybrids). There are different meanings of the term “Criollo”, depending on whether it is used by breeders, botanists, or growers. “True Criollo”, “Ancient Criollo”, and “Criollo” are the ways it is called respectively depending upon who is using the term [16]. Currently, Criollo is defined as a unique genetic group based on the classification proposed by Motamayor et al. [17]. In fact, with the use of molecular tools, a new classification of 10 genetic groups has been proposed, which has furthered the understanding of the genetic and phenotypic diversity of the crop, and “Criollo” cacao is one of the identified groups [17].
Knowing the genetic diversity of cacao has been of great interest to breeders and growers. The first classifications of the Theobroma species were made concerning their phenotypic characteristics, evidencing that one of the marked differences between Criollo and the others, was the content of anthocyanins in its seeds [2,4,18]. The first genetic diversity studies of cacao were made using RAPD and RFLP markers [19,20,21,22,23], followed by SSR markers [24,25,26,27,28,29,30,31,32], and SNP markers [33,34,35,36,37,38]. Some of these studies made it possible to identify Criollo as a different genetic group. A high level of homozygosity and significantly low genetic diversity within the Criollo population was also found [24] in a great part attributable to Criollo self-compatibility.
The results of the genetic diversity of cacao from Honduras and Nicaragua with SNP markers confirmed the existence of a population of ancient cacao Criollo. Furthermore, the Trinitario varieties of cacao used by growers are more influenced by the Amelonado genetic group than the Criollo genetic group [7]. The study also showed that although the varieties of cacao type Trinitario used by growers in both countries are different, the samples of ancient cacao Criollo analyzed were grouped in the same cluster [7]. Several studies on the genetic diversity of cacao have used samples of cacao Criollo from Honduras as a reference of the purity of the Criollo genetic group [2,7,16,29,35,39]. A phenotypic characterization study of cacao from Honduras determined that 72% of the production comes from cacao Trinitario type varieties and 28% comes from Amelonado type varieties [40]. The cacao growers in Honduras have the technical and scientific support provided by the Honduran Foundation for Agricultural Research (FHIA) for over 36 years and the foundation’s agroforestry program has been collecting genetic material and maintaining a germplasm bank in order to preserve elite material for the improvement of cacao cultivation. However, the genetic purity of Criollo in Honduras and its diversity has not been fully investigated, even if it would be highly beneficial to the cacao genetic improvement and the conservation of Criollo in-situ and ex-situ. Therefore, the goals of this study were to assess the genetic purity and diversity of 89 cacao accessions, which have been selected based on the Criollo phenotype from four different departments of Honduras, using single sequence repeat (SSR) markers. The results of the analyses have also been compared with a robust SSR dataset of 116 samples obtained from the original classification developed by Motamayor et al. [17] representing the ten cacao genetic groups.

2. Materials and Methods
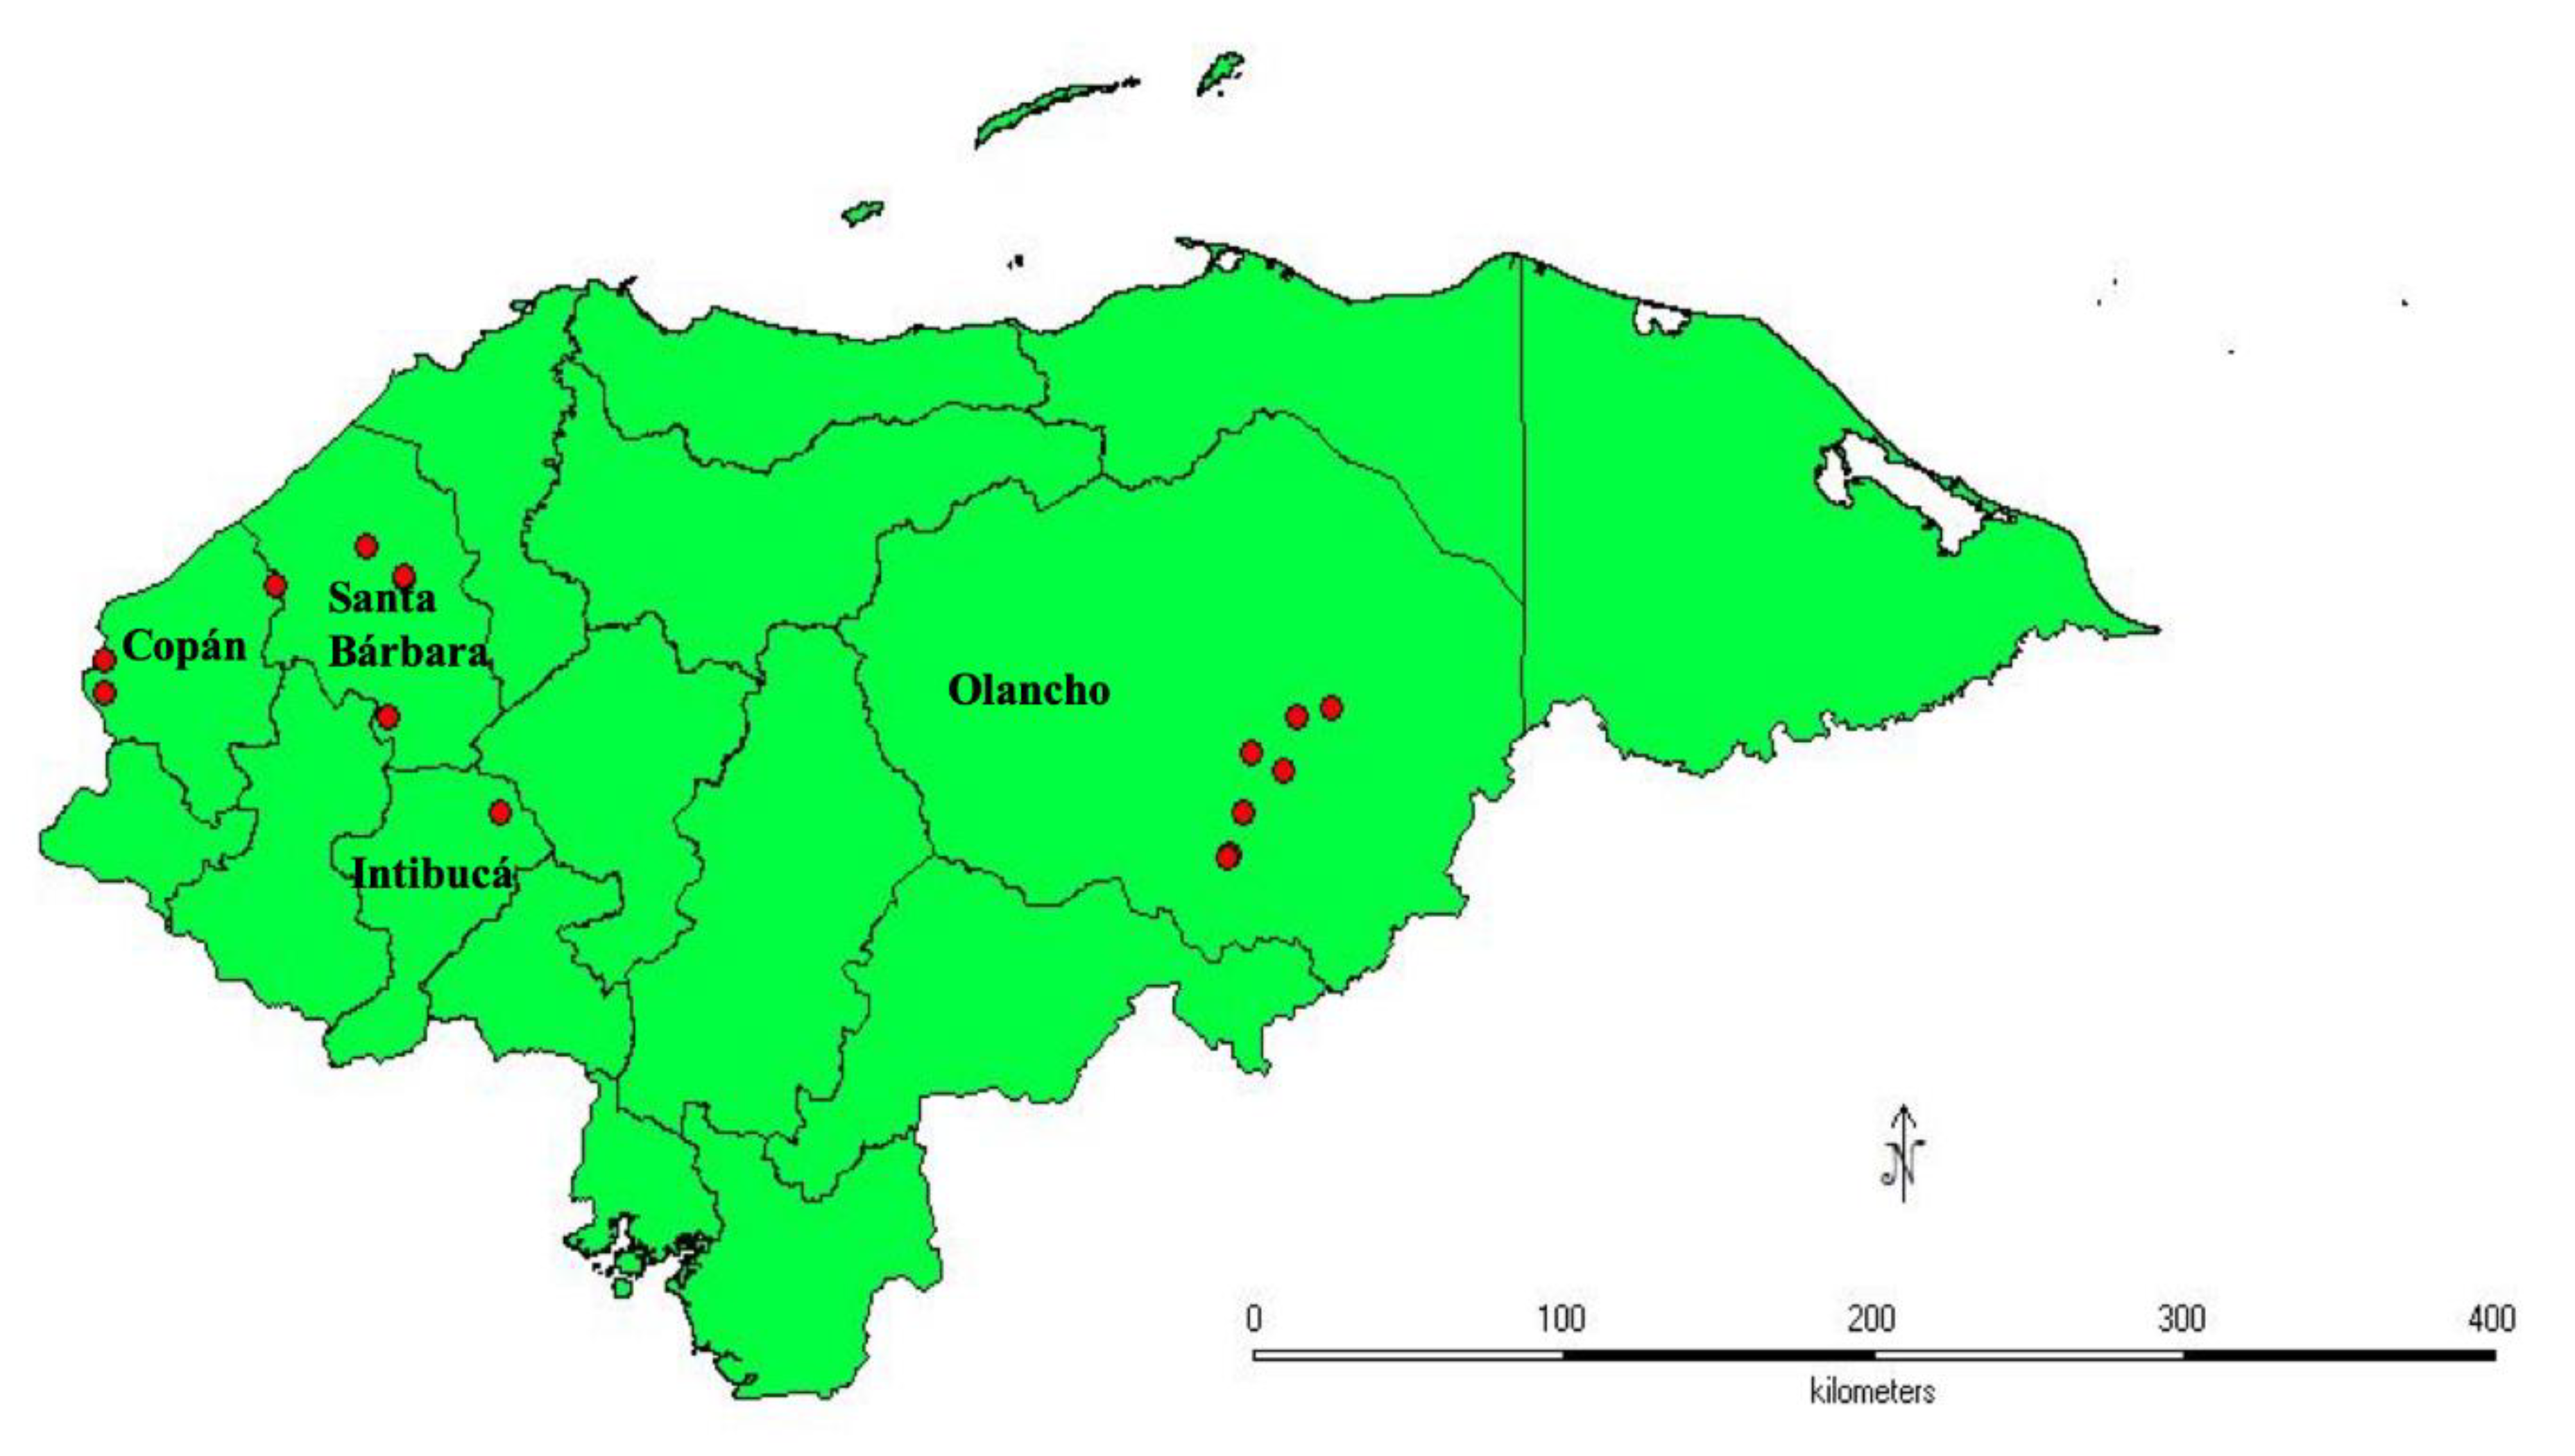
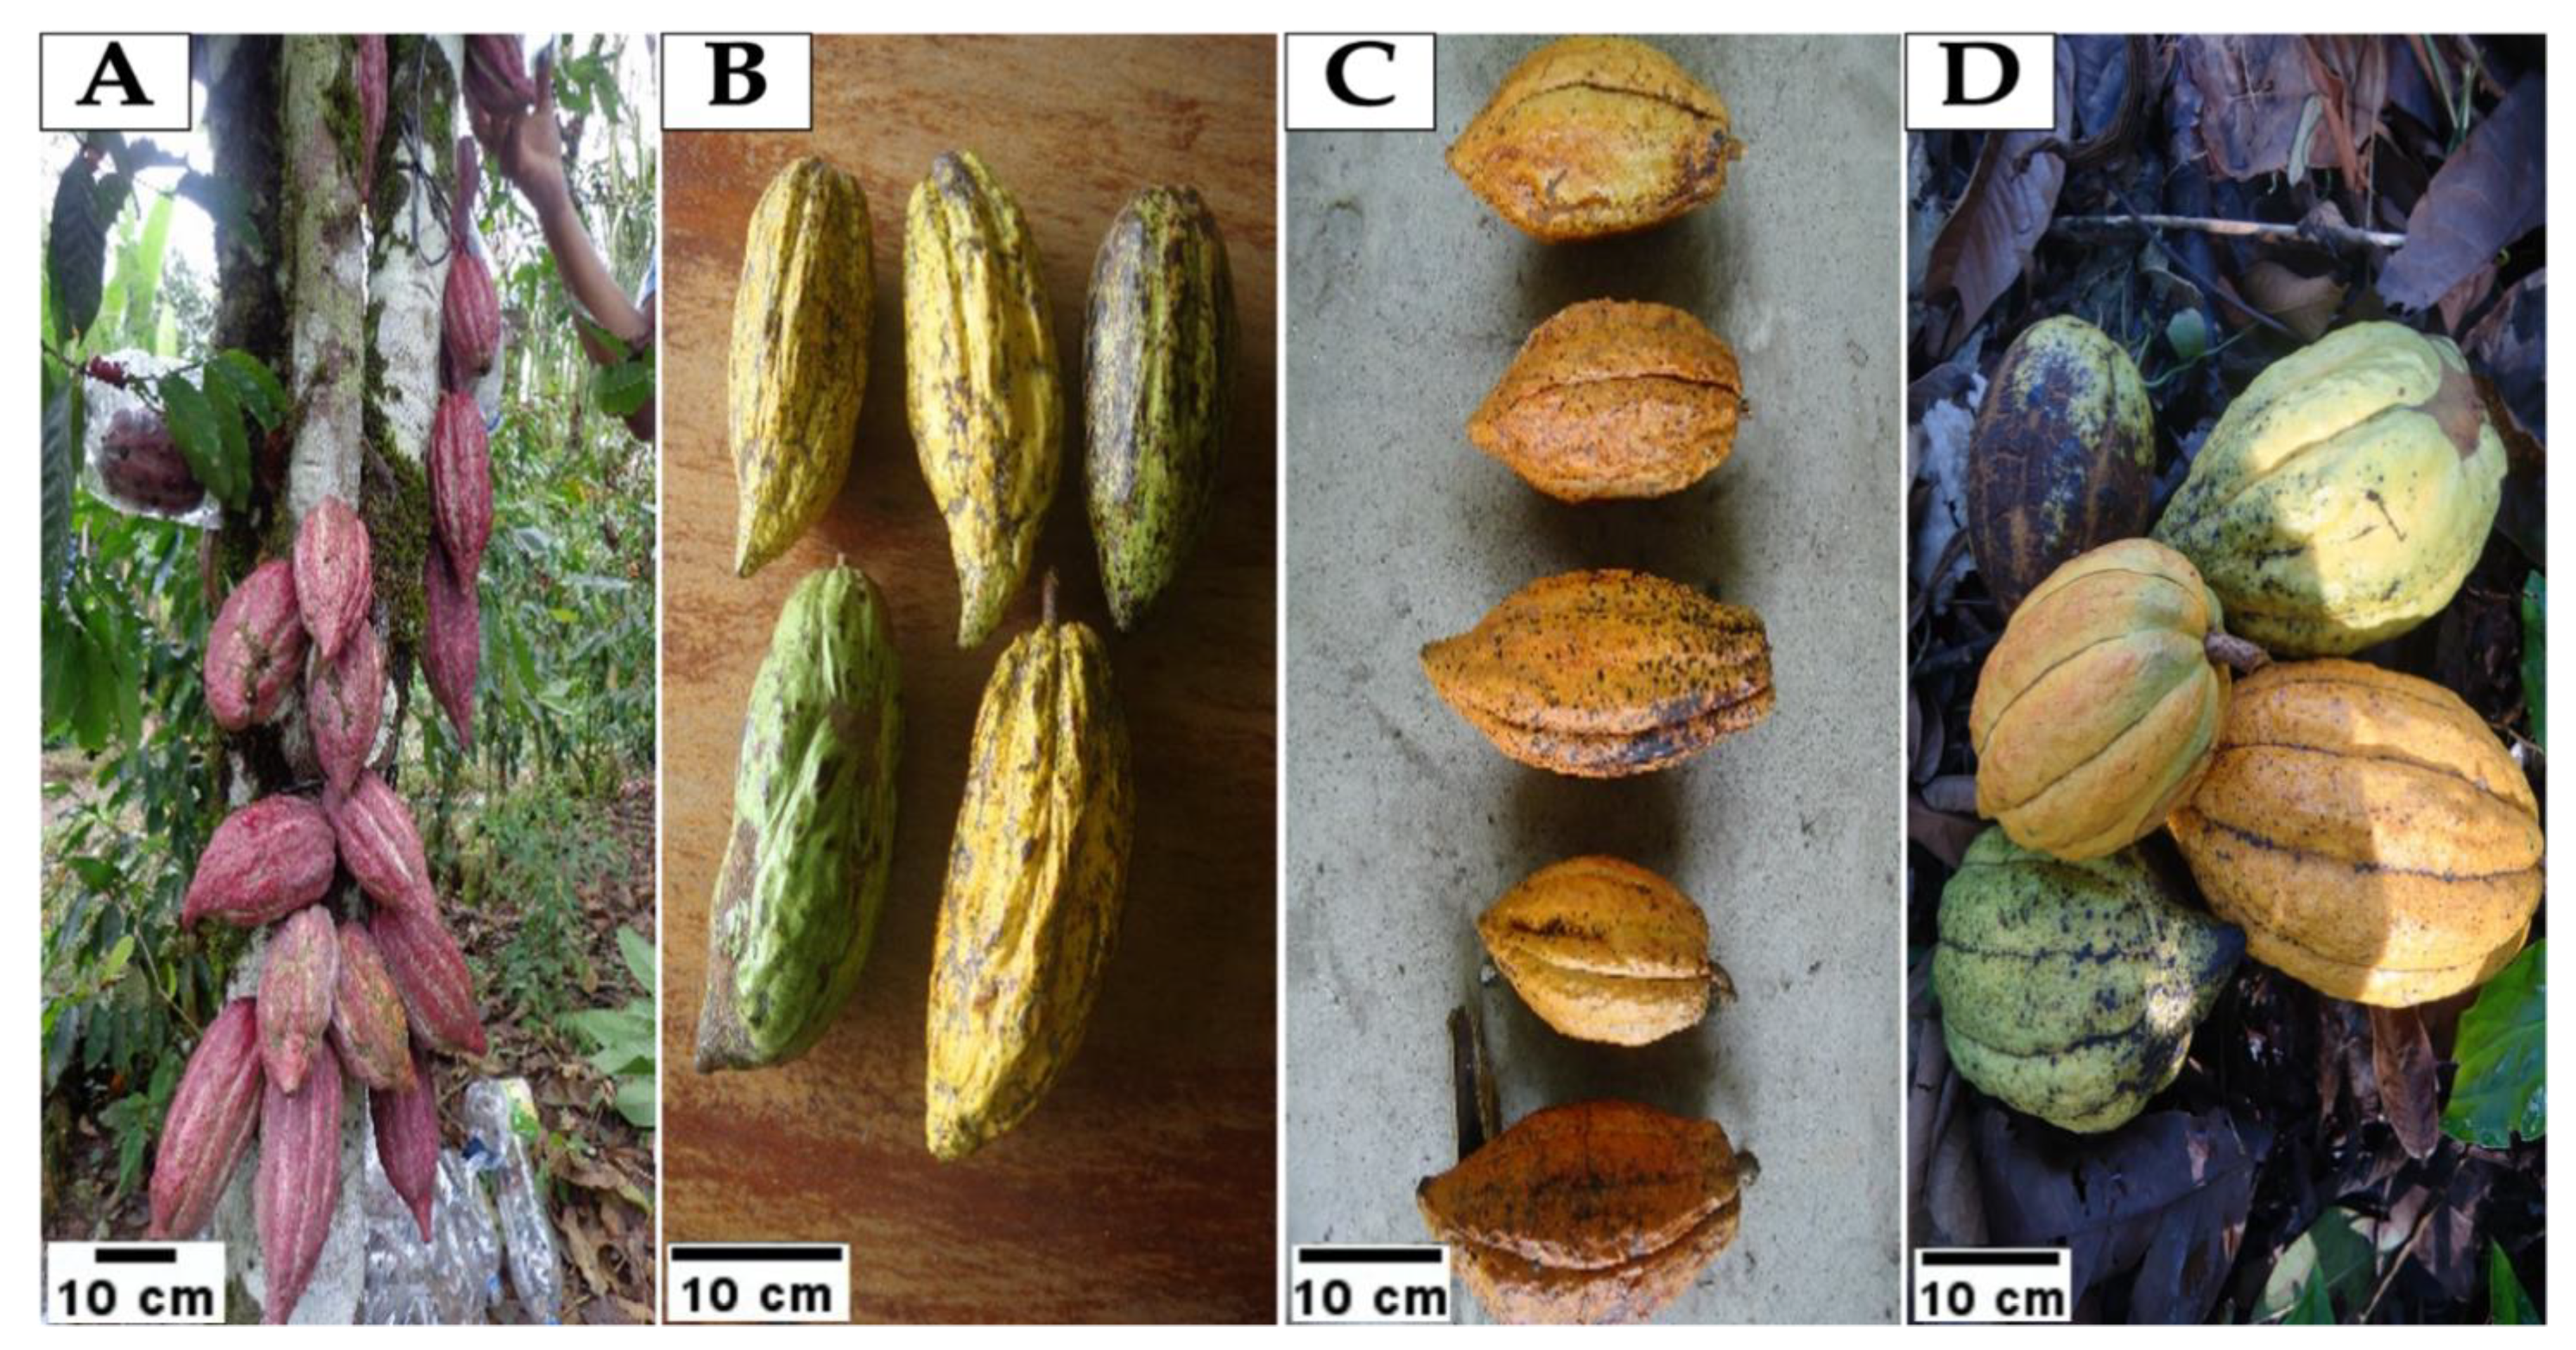
2.1. Plant Material

In this study, eighty-nine cacao plants were selected from four different departments in Honduras: Copán, Santa Bárbara, Olancho, and Intibucá (Figure 1). Cacao trees were previously identified by the farmers, who had preserved the genetic material for many years, and only trees showing phenotypical characteristics of Criollos were sampled (Figure 2). Generally, they were located inside small and medium-sized family farms, isolated, and not properly maintained. Two young fully expanded leaves were selected from each tree and conserved and transported inside 20 mL plastic tubes filled with 96% ethanol [41,42] for DNA extraction. The GPS coordinates were recorded for each tree for subsequent mapping (Table S1).

2.2. DNA Extraction and Quantification

For DNA extraction, 40–50 mg of dry leaf sample was placed in a 2 mL tube with tungsten carbide beads, frozen in liquid nitrogen, and finely ground in a tissue homogenizer (Tissue Lyser, QIAGEN, Hilden, Germany). DNA was extracted using an Invisorb Spin Plant Mini Kit (Stratec Molecular, Berlin, Germany). DNA has been electrophoresed on an agarose gel to validate quality and quantity.

2.3. SSR Markers

Sixteen previously reported SSR markers were used in this study [43,44]. The list of the SSR markers’ names, the EMBL accession, the chromosome where the locus is mapped, the specific primers, the observed size range of the amplicon, the motifs, and the references are reported in Table 1.

2.4. PCR Amplification and Electrophoresis

PCR amplifications were carried out in a final volume of 25 µL, containing 20 ng of genomic DNA, 2 mM MgCl2, 0.2 mM dNTPs, 0.2 µM each of the forward and reverse primer, 3% pure formamide, 1X GoTaq® colorless Reaction Buffer (Promega, Madison, WI, USA), and 1 Unit of GoTaq® Flexi DNA Polymerase (Promega, Madison, WI, USA). The PCR reactions were based on the following amplification protocol: a denaturation step of 4 min at 96 °C; 35 cycles of 40-s denaturation at 96 °C, 40-s primer annealing at appropriate temperature for each primer pairs, 40-s extension at 72 °C; and 5 min final extension at 72 °C. This protocol was performed on a Primus 96 advanced (PEQLAB Biotechnologie Gmbh, Erlanger, Germany) thermocycler. Each marker had a fluorescent tag on the forward primer (6-FAM, VIC, NED or PET) (Applied Biosystems, Inc., Waltham, MA, USA) for scoring fragment length. Fragments analysis of the PCR products was performed on two capillary electrophoresis instruments: an ABI-3130 Genetic Analyzer (Applied Biosystems, Inc., Waltham, MA, USA) using performance optimized polymer (POP7) at the University of Florence and an ABI-3730 Genetic Analyzer (Applied Biosystems, Inc. Waltham, MA, USA) using performance optimized polymer (POP7) at USDA-ARS in Miami. The accuracy and comparability of the sizing performance of the two sequencers were tested by genotyping nine shared reference accessions. The data generated were analyzed with GeneMapper 3.0 (Applied Biosystems, Inc. Waltham, MA, USA). An SSR dataset of 116 samples from Motamayor et al. [17] was included as reference accessions (Table S2) representing the ten cacao genetic groups identified by Motamayor et al. [17]: Amelonado, Contamana, Criollo, Curaray, Guiana, Iquitos, Marañon, Nacional, Nanay, and Purús. Two SSR data sets were generated, one including only the samples from Honduras, named “Honduras” and the other data set including both Honduras and reference accessions, named “Complete”. For the “Complete” dataset a representative number of reference accessions was analyzed along with our samples to assess the comparability of the two datasets.

2.5. Data Analysis

Despite gathering samples in a vast area, Honduran accessions sharing identical SSR profile were retrieved. Therefore, to reduce noise and to avoid any alteration of the results due to the presence of identical genotypes, a preliminary analysis was performed with the software Cervus 3.0.9 [45]. In this case, only the samples that shared 100% of their allele’s identity were considered. From this procedure, 32 identical samples were detected and then not taken into consideration in the subsequent evaluation unless they do not belong to the same department, reducing the number of examined genotypes to 57 (Table S3).
Concerning the “Honduras” dataset, for each SSR locus, the number of alleles (Na), the effective number of alleles (Ne), frequency of the predominant allele (Fa), the observed (Ho) and expected heterozygosity (He), and the fixation index (F) were calculated using Genealex 6.5 [46]. The polymorphic information content (PIC) was calculated with PowerMarker 3.25 [47].

2.6. Cluster Analysis

The Bayesian approach implemented in the software STRUCTURE v.2.3.4 [48] was used to define the population structure in both datasets, “Honduras” and “Complete”, as previously described. An admixtured and shared allele frequencies was adopted to determine the number of populations (K), assumed in the range from 1 to 10 in “Honduras” and from 1 to 20 in “Complete”. For each K value, 10 runs with 100,000 burn-in periods and 200,000 MCMC (Markov Chain Monte Carlo) iterations were performed. The ΔK of the Evanno method [49] was calculated to estimate the best value of K that fits the data, by using STRUCTURE HARVESTER [50]. The structure plot was obtained with the package pophelper v2.3.0 [51] in the R-project. The Criollo reference (Criollo 13) was included in the “Honduras” dataset to establish which Honduran samples were pure Criollo.
A further STRUCTURE analysis was performed with the 116 reference accessions from Motamayor et al. [17] along with the eight Honduran pure Criollo cacaos, which had the highest coefficient of membership (higher than 0.99) to the Criollo cluster in the STRUCTURE analysis of “Complete” dataset (Cop_22, Cop_23, Cop_24, Cop_28, Cop_29, San_106, San_107, and San_109) to sustain the fitness with the 10 genetic groups established in Motamayor et al. [17].
Moreover, concerning the “Complete” dataset, a matrix of Manhattan distances was obtained to produce a principal coordinates analysis (PCoA) with the packages adegenet 2.1.3 [52] and Ade4 [53] in the R-project. The result was plotted to show graphically if individuals tended to be grouped according to the 10 cacao genetic groups identified by Motamayor et al. [17].

3. Results

3.1. Descriptive Genetic Parameters of the SSR Loci

In total, the 16 SSR markers were able to amplify 88 alleles across all cacao samples of the “Honduras” dataset. As shown in Table 2, Na varied from 3 (MTcCIR22, MTcCIR115, and MTcCIR158) to 11 (MTcCIR33) with an average of 5.5 alleles for each locus. The effective number of alleles (Ne) ranged from 1.664 (MTcCIR60) to 3.926 (MTcCIR33) with a mean of 2.270. The frequency of a predominant allele (Fa) in polymorphic loci varied between 0.327 (MTcCIR33) and 0.746 (MTcCIR60) with an average of 0.610. The expected heterozygosity (He) ranged from 0.399 (MTcCIR60) to 0.745 (MTcCIR33) with a mean of 0.540, while observed heterozygosity (Ho) had values between 0.140 (MTcCIR158) and 0.386 (MTcCIR7) with an average of 0.293. For all loci, He was higher the Ho. The fixation index (F) was higher than zero for all loci and ranged between 0.077 (MTcCIR60) to 0.692 (MTcCIR158). The PIC varied from 0.360 (MTcCIR158) to 0.703 (MTcCIR33) with an average of 0.481.

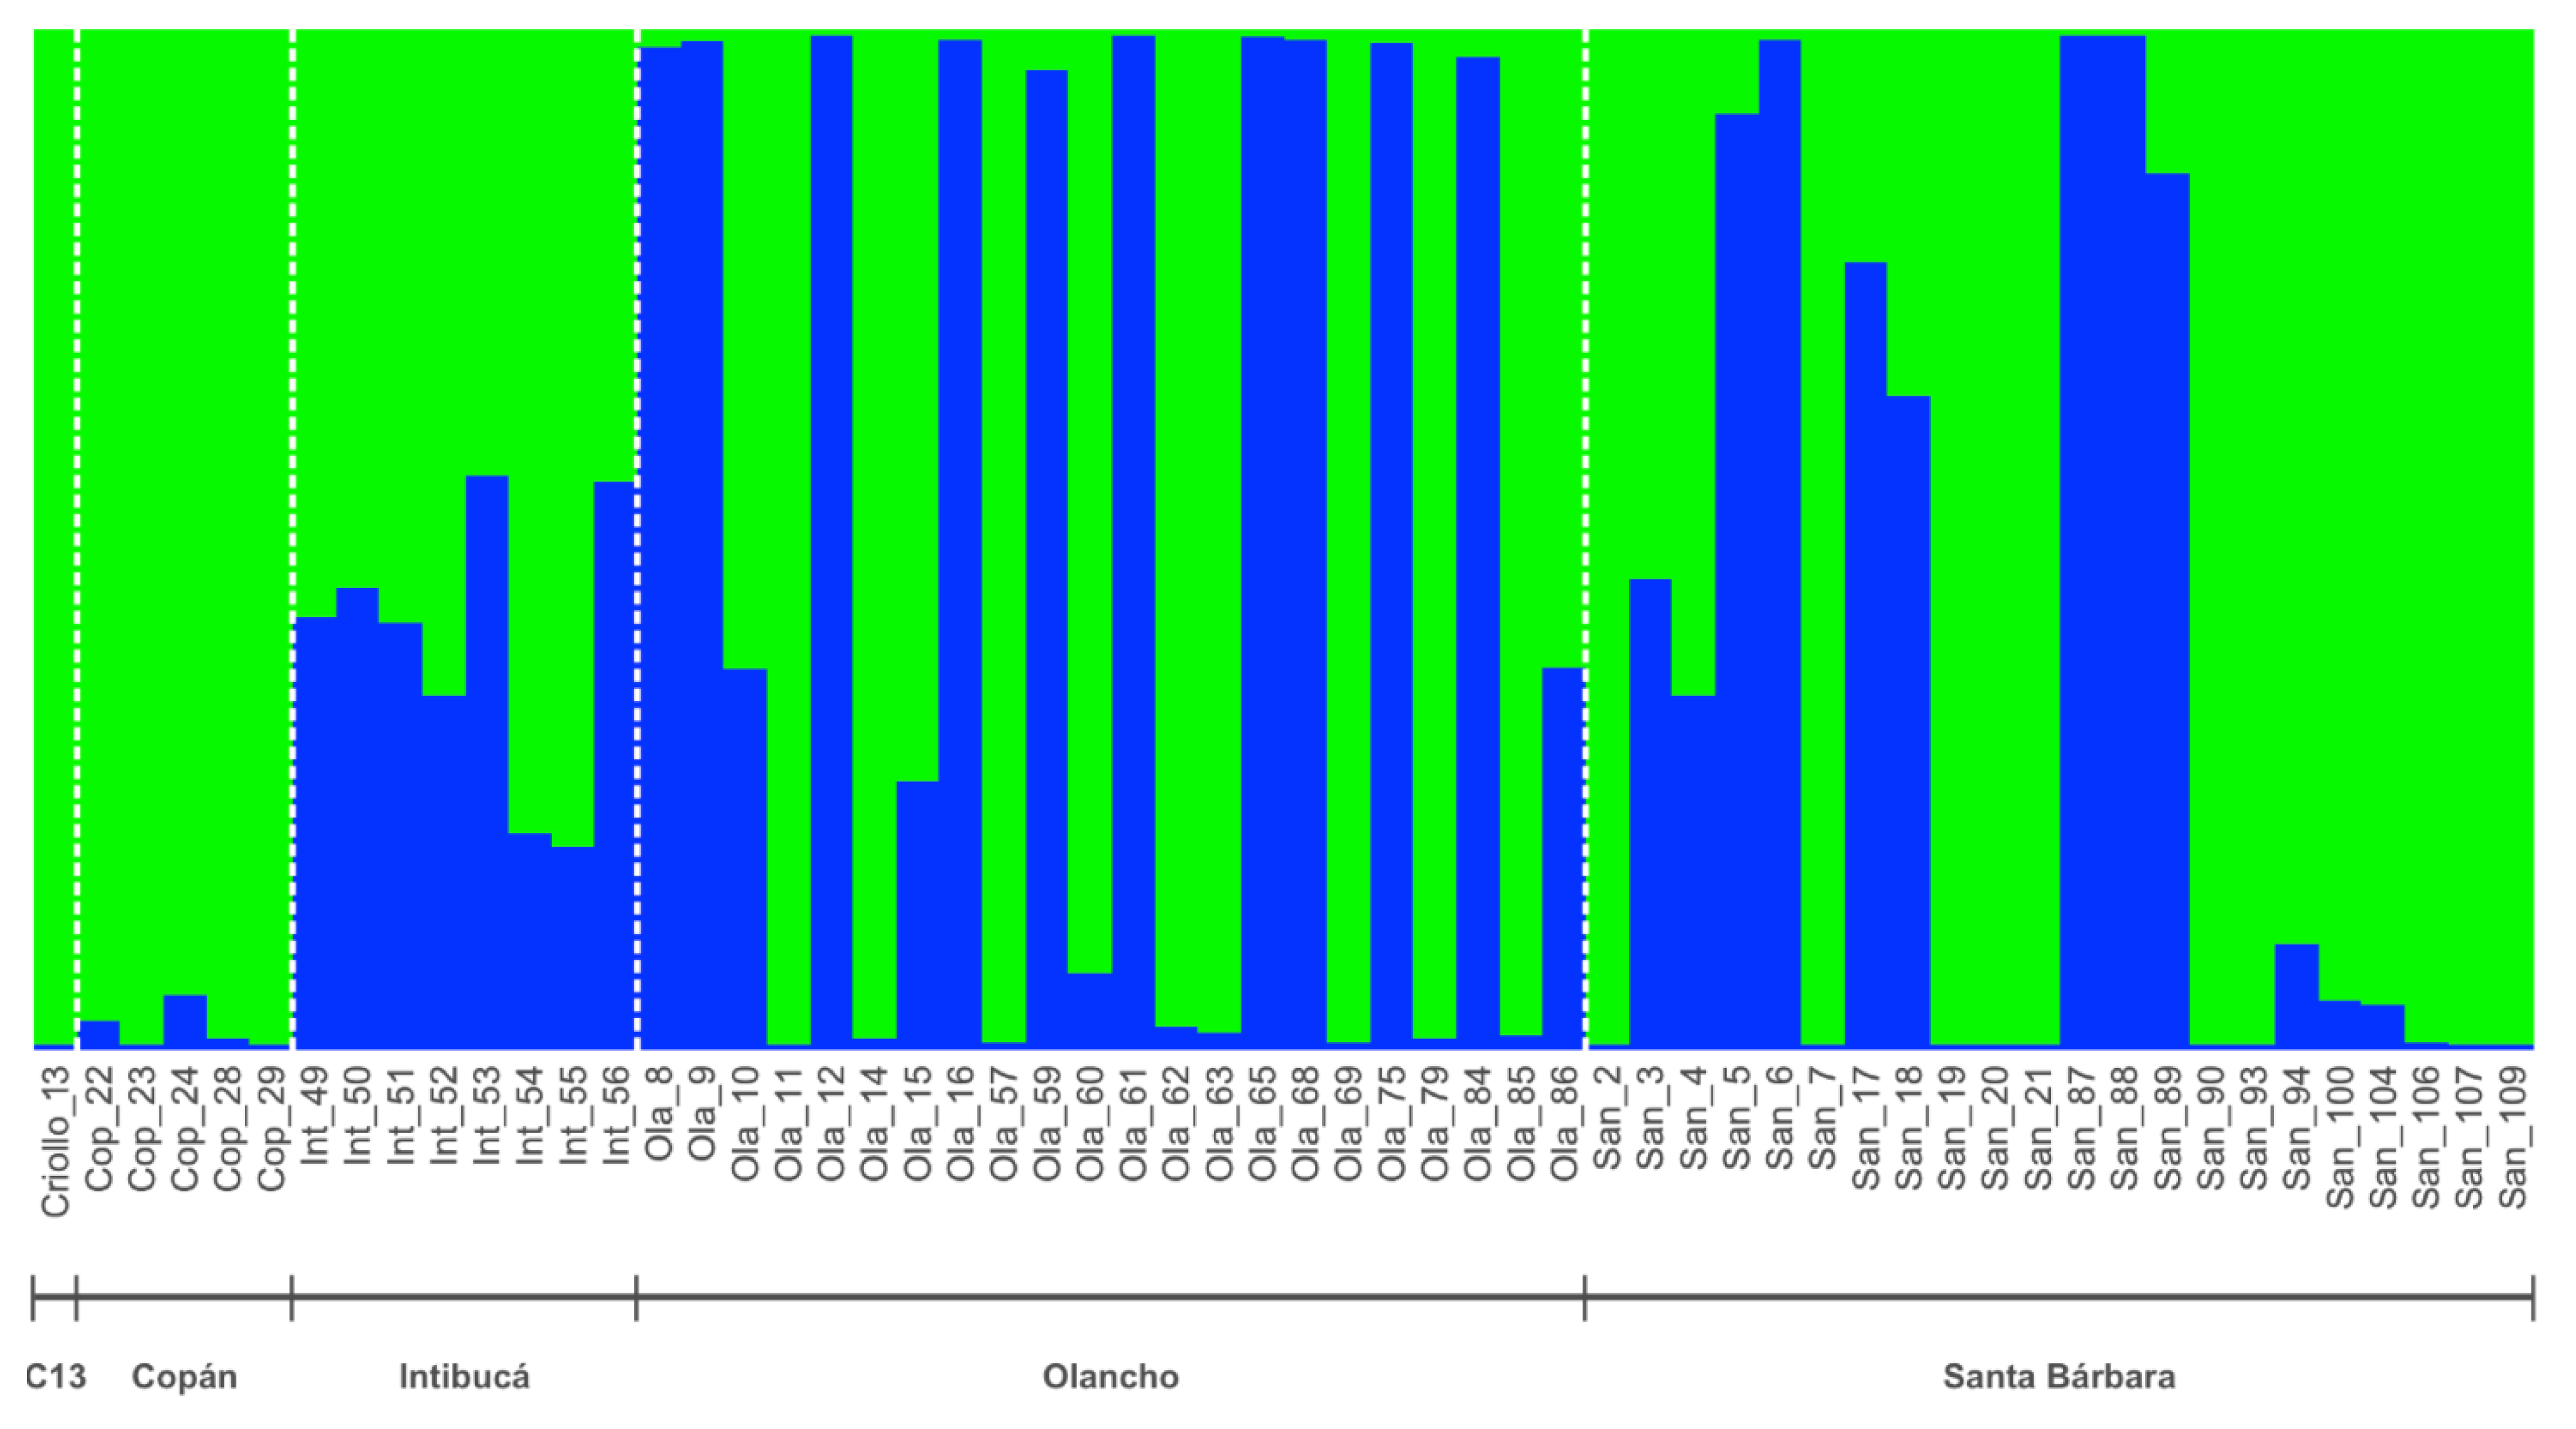
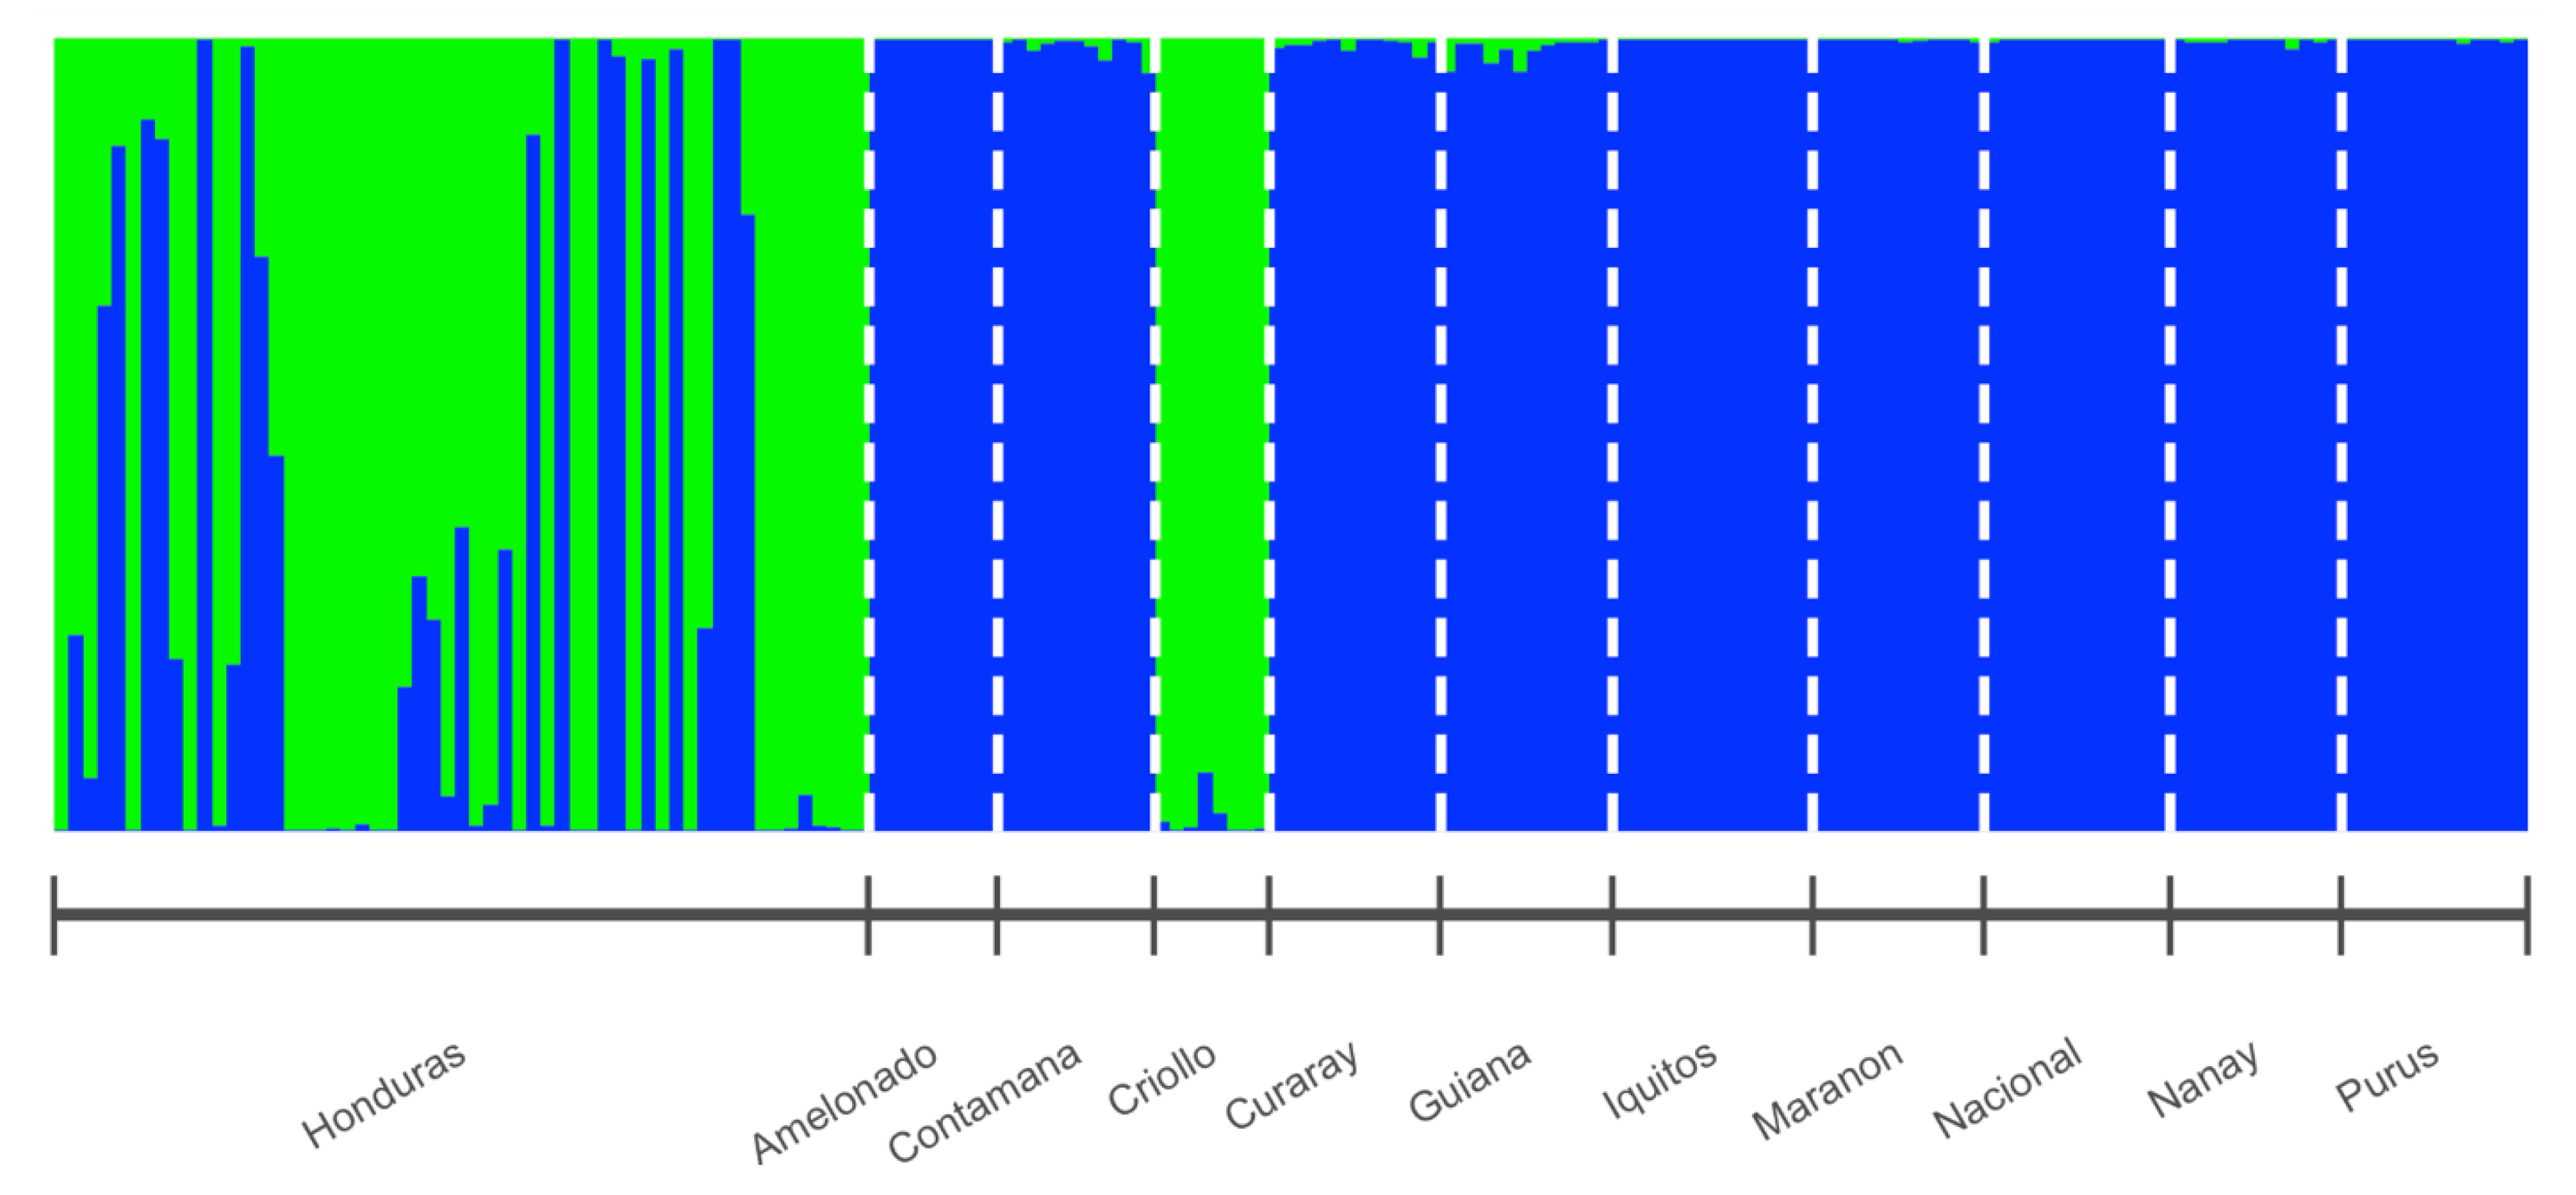
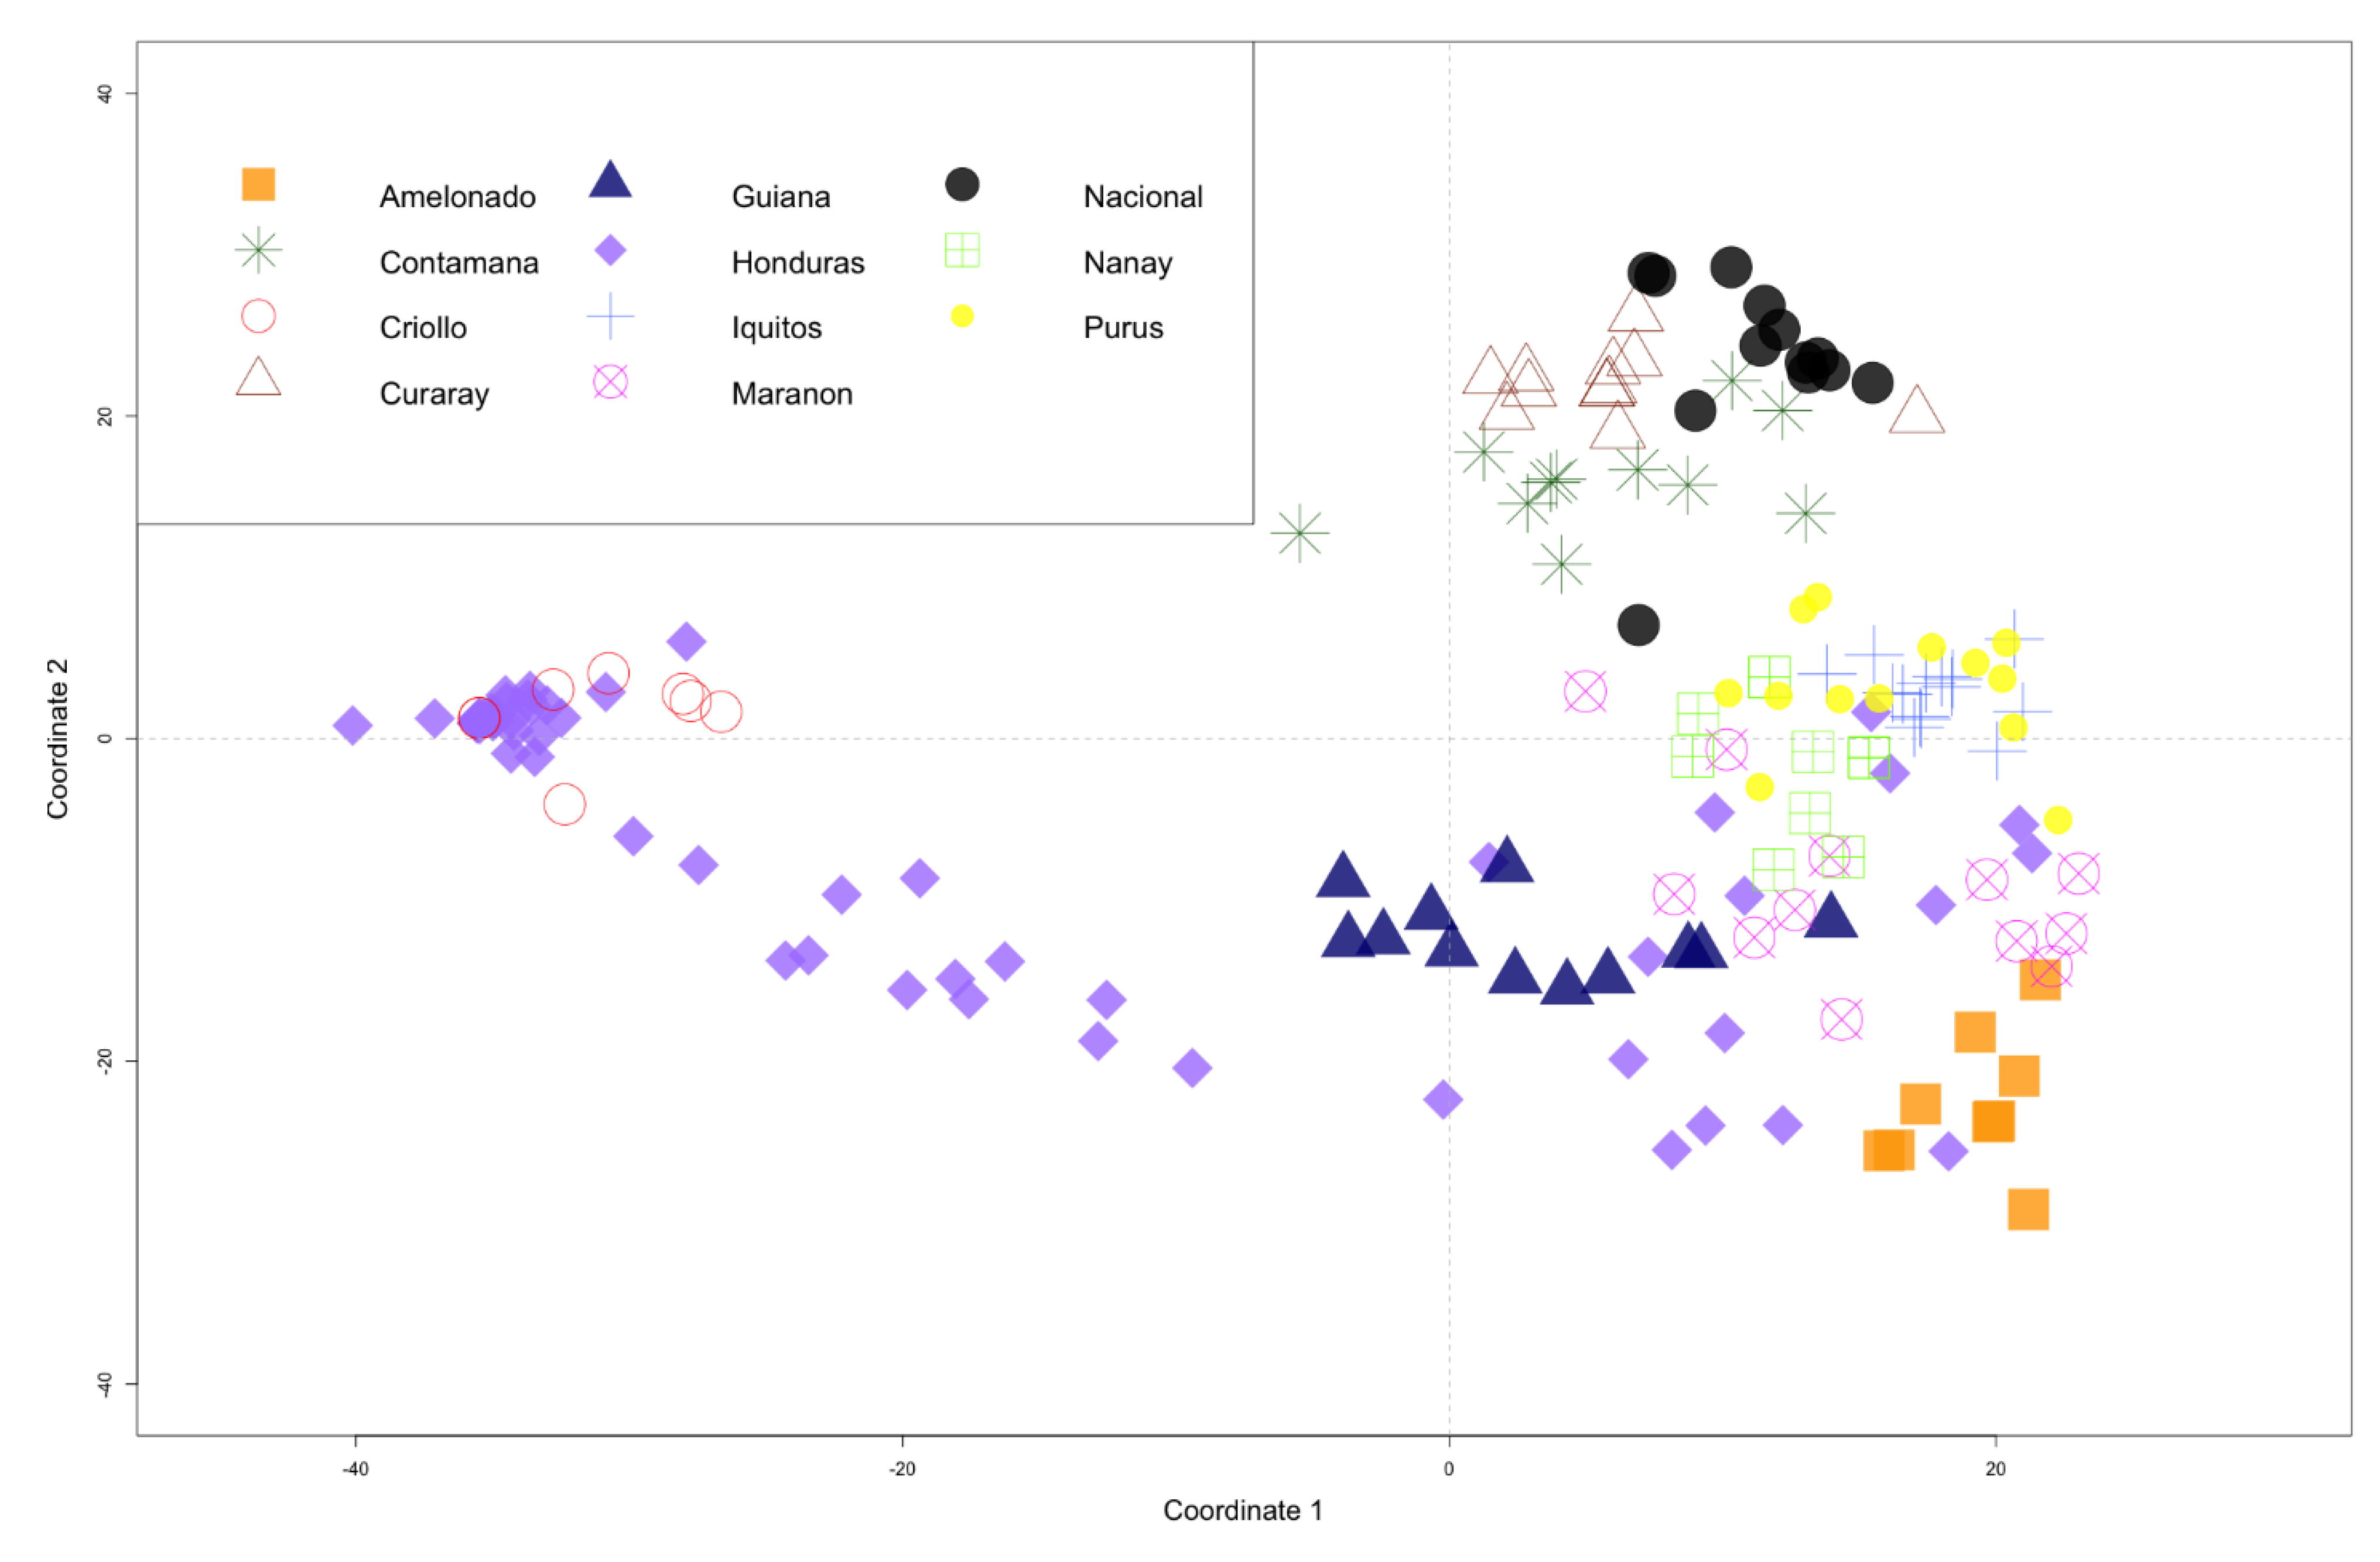
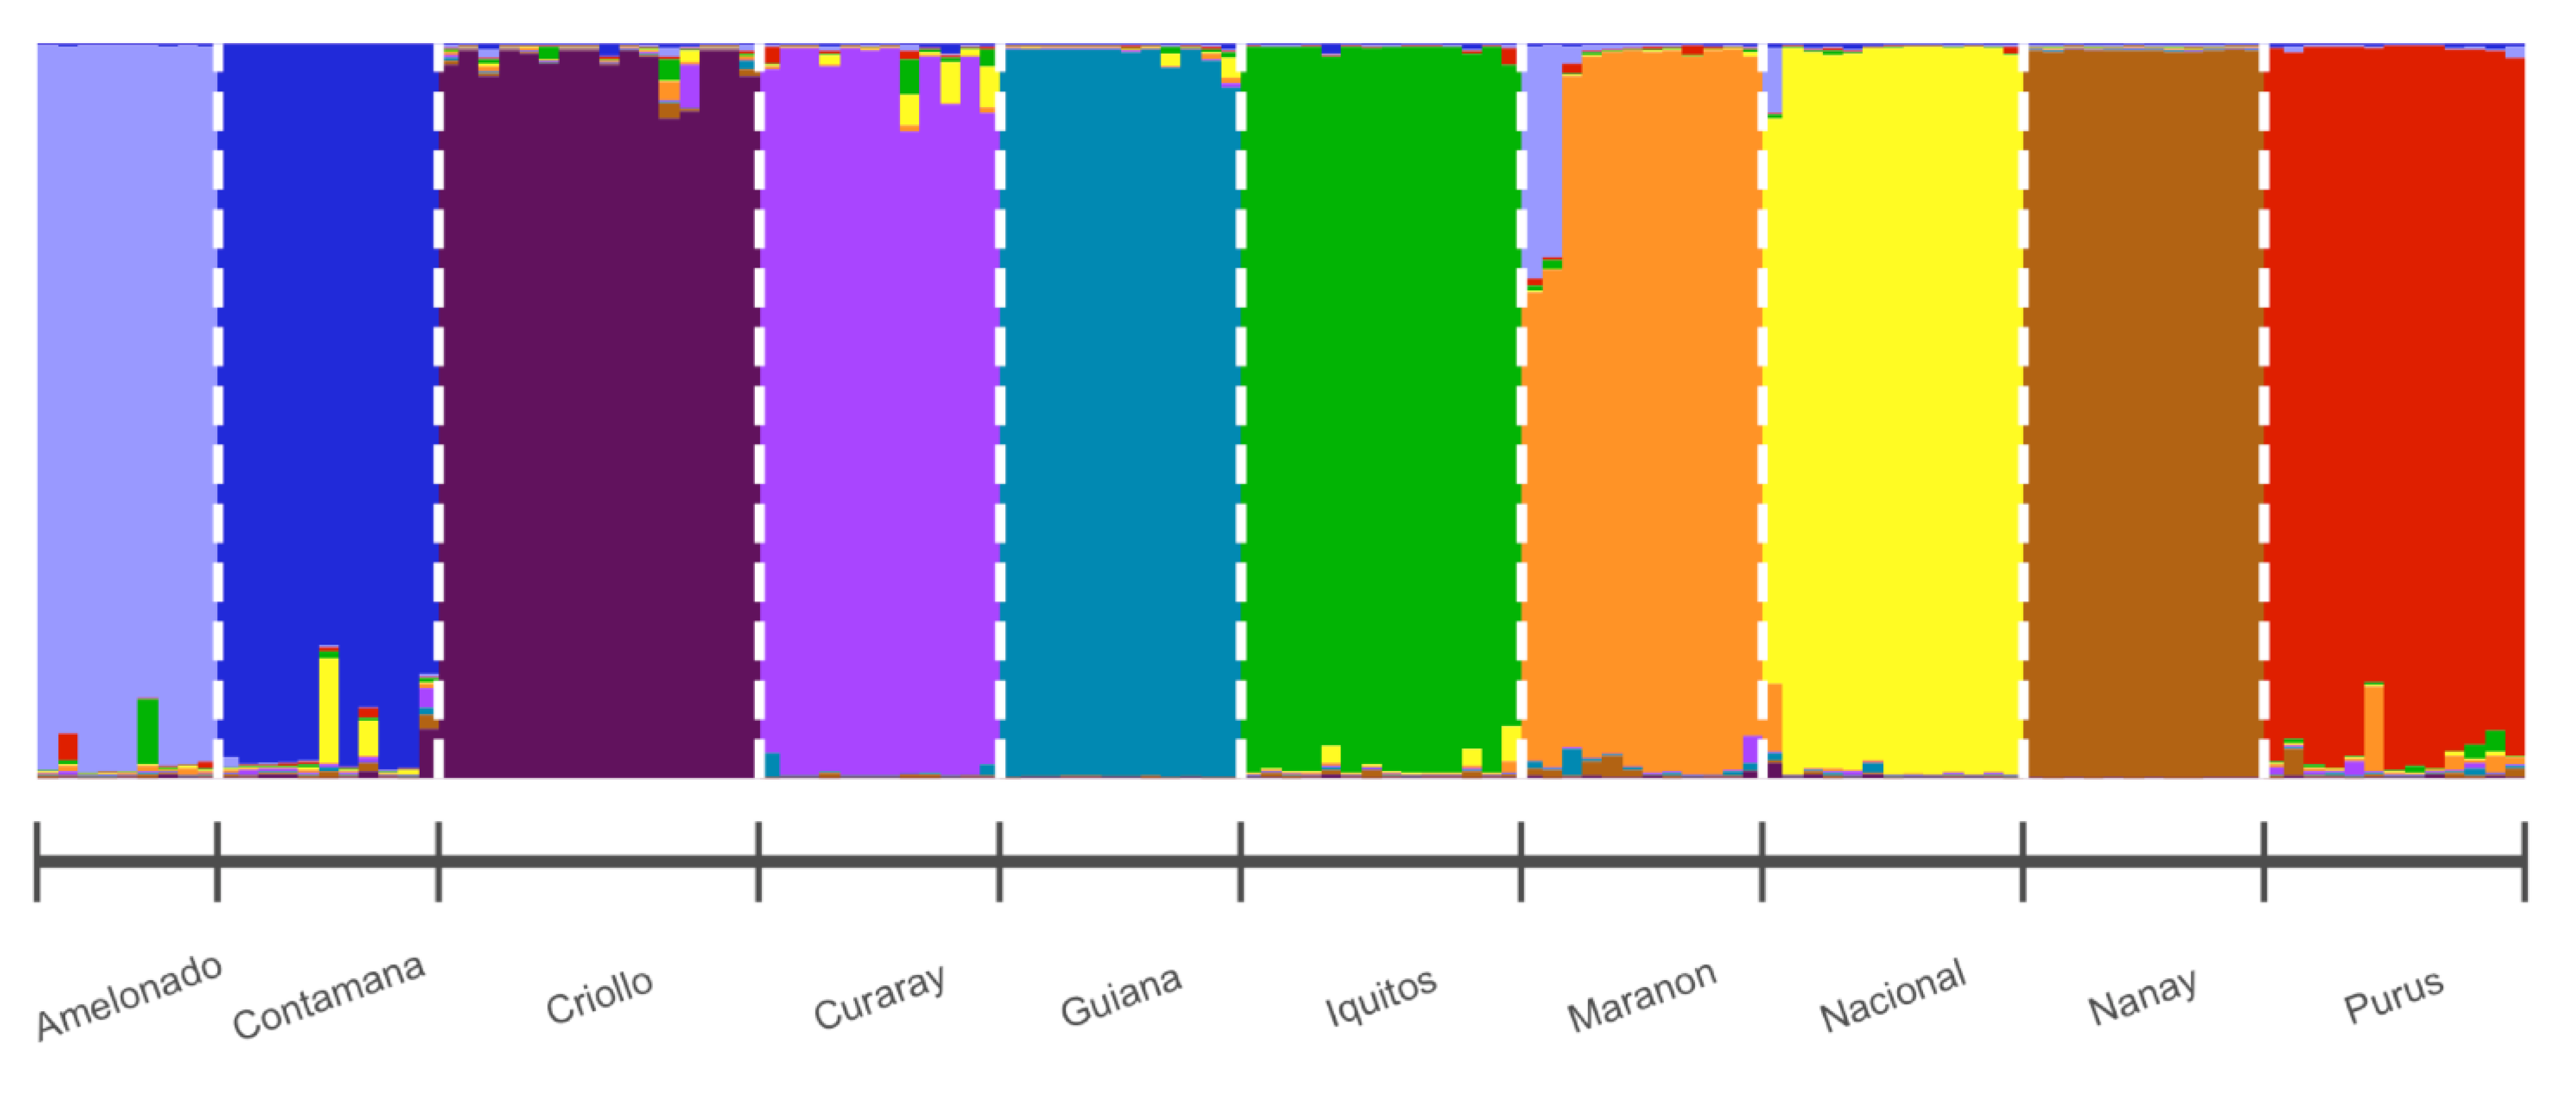
3.2. Cluster Analysis

The STRUCTURE analysis results indicated that the 57 Honduran samples were grouped in two clusters (Figure 3). Only the accessions with a coefficient of membership higher than 0.70 were considered belonging to one of the two clusters. Trees sampled in Copán and Santa Bárbara (except for San_5, San_6, San_17, San_87, San_88, and San_89) were clustered in the same population along with Criollo 13, which is the reference carrying the genetic characteristics of pure Criollo cacao. Only two accessions sampled in Intibucá (Int_54 and Int_55) were grouped along with Criollo 13. Additionally, some accessions collected in Olancho (Ola_11, Ola_14, Ola_15, Ola_57, Ola_60, Ola_62, Ola_63, Ola_69, Ola_79, and Ola_85) were found to be pure Criollo, while ten samples were grouped in the second population, being represented by the blue color of the bar (Ola_8, Ola_9, Ola_12, Ola_16, Ola_59, Ola_61, Ola_65, Ola_68, Ola_75, and Ola_84). The remaining genotypes from Intibucá and Ola_10, Ola_86, San_3, San_4, and San_18 showed an admixture of the genetic characteristics of both two clusters (being the bar roughly half blue and half green).
The ΔK of the Evanno method separated the “Complete” dataset into two main clusters (Figure S1). No other K was identified as a probable population number. The first cluster (in blue) consisted of all pure reference accessions of Criollo and most samples from Honduras with a different degree of Criollo purity (Figure 4). The second cluster included the other cacaos accessions presenting admixture population characteristics. This group contained the remaining genetic groups identified by Motamayor et al. [17]. The divergence between Criollo and the other groups was much higher than the genetic divergence among the remaining nine clusters, and the presence of many Criollo samples in the dataset determined the clustering of the other cacaos into the same group.
Honduran accessions included also Trinitario samples that showed genetic characteristics of Criollo and other genetic groups [54].
According to the Manhattan distances, a principal coordinates analysis was produced from the first two dimensions to show the genetic differences in the “Complete” dataset. The first dimension accounted for 24.42% of the total variation, while the second dimension for 9.69%. PCoA revealed the same result of the STRUCTURE analysis: two main clusters were identified. In the group located on the left of the plot all Criollo samples clustered together either those collected in Honduras either the reference Criollo accessions from Motamayor et al. [17], while the other nine genetics groups were clustered on the right side of the plot (Figure 5) along with some Honduran samples mainly distributed among the Amelonado, Guiana, and Marañon groups. Moreover, other Honduran samples, showing features of both of the two clusters and covering the genetic distances between Criollo and other genetic groups (Amelonado, Guiana, and Marañon), should be ascribed to as Trinitario.
A further STRUCTURE analysis was performed with the 116 references accessions from Motamayor et al. [17] along with the eight Honduran pure Criollo cacaos: Cop_22, Cop_23, Cop_24, Cop_28, Cop_29, San_106, San_107, and San_109. This reduction of the samples representative of the Honduran population was necessary to diminish the statistical weight of the Criollo accessions, which, due to their genetic distance with the other groups and to their low variability, determined a peak of the ΔK corresponding to K = 2 and not congruent with that of [17]. The ΔK of the Evanno method showed that the most probable population number is K = 2, highlighting a great genetic distance between Criollo and all the other genetic groups; however, peaks of K= 5 and K = 10 were also identified as the possible number of clusters (Figure S2). The value K = 10 showed the same results obtained by Motamayor et al. [17] (Figure 6). All Criollo accessions collected in Honduras correctly clustered with the Criollo references, while, all the other remaining genetic groups were identified.

4. Discussion

The cultivation of cacao is of great economic importance for small producers in Honduras. In recent years, the number of hectares planted was increased, and therefore the cacao export volumes have also grown, especially to Europe. The increase in the demand for Honduran cacao is due to the high quality chocolate produced by the fine flavor cacao genetically influenced by the mixture of Criollo cacao. However most of the cacao cultivated fields are of the Trinitario type, which is a mixture between Criollo and Amelonado [7,55], because of the advanced lack of interest of Criollo cultivation in Honduras where no commercial plantations are available. Since about 10 years ago, ex-situ conservation began, taking some trees of Criollo cacao from the farmers to the FHIA germplasm bank. The cacao cultivation in Honduras has a historical and cultural significance, it is known from anthropological discoveries that ancient populations such as the Mayas, Lencas, Chortis, Tolupanes, and others used cacao as a form of trade and even came to have importance in their ceremonial rites, and in the form of commodities exchange (used as money) [10]. It is believed that the Criollo cacao was the only cultivated in Mesoamerica before the arrival of the Europeans [2,24]. Some investigations indicate that cacao was domesticated in Mesoamerica, from Southern Mexico to Panama and that is why it is common that in these countries Criollo cacao is found in a dispersed way. Possibly, the Mesoamerican cacao producers stopped cultivating Criollo cacao due to the arrival of new cacao cultivars (Forastero type) that are more resistant to pests and diseases and overall more productive [7,16]. Although Criollo cacao did not continue to be cultivated, it is found in small plots or isolated areas that are about to disappear. It is observed that some Criollo cacao trees are not vigorous, possibly the genetic isolation has caused an increase in the level of homozygosity (as confirmed by the observed heterozygosity and F index detected in the present study) hindering their growth, development, and adaptability to other environmental conditions, but Criollo cacao is superior in quality [40].
There are few studies on the characterization of the genetic diversity of Criollo cacao of Honduras using genomic tools. The most important study was carried out by Ji et al. [7] using SNP markers, where eleven out of the fourteen samples collected as Criollo from Honduras turned out to be pure. Motilal et al. [39], investigating the genetic diversity of Belizean Criollo cacao found that eleven different genotypes belonged to the Criollo group out of 77 samples analyzed. In this study, five accessions of Criollo cacao from Honduras (Honduras 6, 10, 11, 13, and 18), which belong to the international cacao genebank in Trinidad and Tobago (ICG, T), were used as references. In both studies [7,39] the authors used Criollo 13 as a reference as was done in the present research. Criollo 13 belongs to the CATIE cacao germplasm bank in Costa Rica [16]. The results of the present study are similar to those found by [7,39]: in fact, thirty out of the fifty-seven samples considered were shown to be pure Criollo, using Criollo 13 as a reference in the analysis, and they are distributed in Copán, Santa Bárbara, and Olancho. However, although samples were taken from trees that phenotypically have characteristics of Criollo cacao, the results show that not all the collected samples have genetic purity: in fact, eleven cacaos (from Intibucá, Olancho, and Santa Bárbara) have a mixture of Criollo and other genetic groups and therefore they could be considered as Trinitario type (Figure 3 and Figure 4). Moreover, the remaining Honduras samples show a genetic profile clustering mainly with the Amelonado, Guiana, and Marañon genetic groups (Figure 5) and they are predominantly located in the Olancho departments, where the cultivation of cacao has been recently introduced. The geographical areas where the samples of Criollo cacao were collected in Honduras (Copán, Santa Bárbara, Intibucá, and Olancho) represent areas currently inhabited by indigenous groups that preserve the tradition of cacao cultivation, especially in Copán, which was in past times the most important ceremonial and astronomical center of the Mayan culture [24,56].
The observed heterozygosity level detected in the “Honduras” dataset is low and comparable with that observed within the cacao populations analyzed by [7,39]. This low level of heterozygosity is probably due to the fact that samples has been collected either in small-medium family farms either from wild sources where they live in isolation or in limited groups without any farming care. This condition might be conducive to inbreeding or possible crossover between siblings that could account for the low variability within the Criollo population. The low variability is also supported by the PCoA where the pure Criollos are located in a restricted area on the left side of the graphic (Figure 5). Moreover, the distribution of the groups in the PCoA shows a great affinity with those of the PcoA in Ji et al. [7] and of the multivariate analysis of the genetic distances in Motilal et al. [39], indicating that a fairly relative number of SSR marker is sufficient to identify the main cacao groupings.
The present study evidenced that notwithstanding the collection of samples has been carried on according to the morphological characteristics of Criollo, some samples showed a different genetic clustering. Therefore, the morphological characterization is not sufficient to identify Criollo cacao and genetic analysis is requested for a correct determination of the samples.

5. Conclusions

The SSR markers used in the current study were able to separate the samples of pure Criollo cacao from the other remaining genetic groups and admixture populations. Results highlighted the great genetic distance between Criollo and other genetic groups. Criollo 13 cacao continues to be a good reference for studies of cacao genetic diversity where Criollo samples are used. Finally, it was possible to determine the genetic purity of cacao Criollos from Honduras and affirm the results of other archaeological investigations that indicate that Mesoamerica is the center of cacao domestication. These results can be used to include these samples of Criollo cacao in a genetic improvement program and especially for the conservation of this genetic wealth that we have inherited from our ancestral peoples.

Supplementary Materials

The following are available online at https://www.mdpi.com/2073-4395/11/2/225/s1, Table S1: List of the 89 cacao accessions collected in Honduras. The ID, the department where samples were collected and the GPS coordinates are shown, Table S2: List of 116 reference from Motamayor et al. [17], Table S3: List of the allelic profiles of the 57 Honduran samples for the 16 SSR loci, Figure S1: The ΔK of the Evanno method for the “Complete” dataset, Figure S2: The ΔK of the Evanno method for the STRUCTURE analysis of the 116 references accessions along with the 8 representative Honduran pure Criollo.

Author Contributions

Conceptualization, M.L. and S.B.; methodology, M.G., L.B., M.L., O.G. and E.O.; formal analysis, L.B. and A.M.; investigation, E.O., E.D. and E.G.; resources, E.P. and E.G.; data curation, M.G. and L.B.; writing—original draft preparation, M.L., S.B. and L.B.; writing—review and editing, O.G., M.L., S.B. and L.B.; supervision, E.P. and M.L.; funding acquisition, E.P. All authors have read and agreed to the published version of the manuscript.

Funding

This research received no external funding.

Informed Consent Statement

Not applicable.

Data Availability Statement

The set of data regarding Honduras collected samples presented in this study are available in supplementary material here. Other data used for supporting the analyses carried out in this article must be requested to the corresponding author of the papers cited in the article.

Acknowledgments

This research was performed in the frame of the Master student grant program AICS-MAECI and the Master Course in Natural Resources Management for Tropical Rural Development—DAGRI—University of Florence—Italy, in cooperation with the National Autonomous University of Honduras (UNAH) La Ceiba, Atlántida—Honduras and the World Cocoa Foundation Fellowship.

Conflicts of Interest

The authors declare no conflict of interest. The funders had no role in the design of the study; in the collection, analyses, or interpretation of data; in the writing of the manuscript, or in the decision to publish the results.

References

  1. Cheesman, E. Notes on the Nomenclature, Classification and Possible Relationships of Cacao Populations; IPC Science and Technology Press: Guildford, UK, 1944. [Google Scholar]
  2. Bartley, B.G. The Genetic Diversity of Cacao and Its Utilization; CABI: Oxfordshire, UK, 2005; ISBN 1-84593-024-X. [Google Scholar]
  3. Flood, J.; Murphy, R. Cocoa Futures: A Source Book of Some Important Issues Facing the Cocoa Industry; Federación de Cafetaleros de Colombia: Bogotá, Colombia; CABI: London, UK, 2004; ISBN 958-97441-1-7. [Google Scholar]
  4. Cuatrecasas, J. Cacao and Its Allies: A Taxonomic Revision of the Genus Theobroma; Smithsonian Institution: Washington, DC, USA, 1964; Volume 35. [Google Scholar]
  5. Henderson, J.S.; Joyce, R.A.; Hall, G.R.; Hurst, W.J.; McGovern, P.E. Chemical and archaeological evidence for the earliest cacao beverages. Proc. Natl. Acad. Sci. USA 2007, 104, 18937–18940. [Google Scholar] [CrossRef] [PubMed] [Green Version]
  6. Powis, T.G.; Cyphers, A.; Gaikwad, N.W.; Grivetti, L.; Cheong, K. Cacao use and the San Lorenzo Olmec. Proc. Natl. Acad. Sci. USA 2011, 108, 8595–8600. [Google Scholar] [CrossRef] [PubMed] [Green Version]
  7. Ji, K.; Zhang, D.; Motilal, L.A.; Boccara, M.; Lachenaud, P.; Meinhardt, L.W. Genetic diversity and parentage in farmer varieties of cacao (Theobroma cacao L.) from Honduras and Nicaragua as revealed by single nucleotide polymorphism (SNP) markers. Genet. Resour. Crop Evol. 2013, 60, 441–453. [Google Scholar] [CrossRef]
  8. Crown, P.L.; Hurst, W.J. Evidence of cacao use in the Prehispanic American Southwest. Proc. Natl. Acad. Sci. USA 2009, 106, 2110–2113. [Google Scholar] [CrossRef] [Green Version]
  9. Wood, G.; Lass, R. Cocoa Tropical Agriculture; Wiley-Blackwell: Hoboken, NJ, USA, 1985. [Google Scholar]
  10. Zarrillo, S.; Gaikwad, N.; Lanaud, C.; Powis, T.; Viot, C.; Lesur, I.; Fouet, O.; Argout, X.; Guichoux, E.; Salin, F. The use and domestication of Theobroma cacao during the mid-Holocene in the upper Amazon. Nat. Ecol. Evol. 2018, 2, 1879–1888. [Google Scholar] [CrossRef]
  11. Coe, S.D.; Coe, M.D. The True History of Chocolate; Thames & Hudson: London, UK, 2013; ISBN 0-500-77093-X. [Google Scholar]
  12. Bergmann, J.F. The distribution of cacao cultivation in pre-Columbian America. Ann. Assoc. Am. Geogr. 1969, 59, 85–96. [Google Scholar] [CrossRef]
  13. Cornejo, O.E.; Yee, M.-C.; Dominguez, V.; Andrews, M.; Sockell, A.; Strandberg, E.; Livingstone, D.; Stack, C.; Romero, A.; Umaharan, P. Population genomic analyses of the chocolate tree, Theobroma cacao L., provide insights into its domestication process. Commun. Biol. 2018, 1, 1–12. [Google Scholar] [CrossRef] [Green Version]
  14. Bekele, F.; Bekele, I. A sampling of the phenetic diversity of cacao in the International Cocoa Gene Bank of Trinidad. Crop Sci. 1996, 36, 57–64. [Google Scholar] [CrossRef]
  15. Argout, X.; Salse, J.; Aury, J.-M.; Guiltinan, M.J.; Droc, G.; Gouzy, J.; Allegre, M.; Chaparro, C.; Legavre, T.; Maximova, S.N.; et al. The genome of Theobroma cacao. Nat. Genet. 2011, 43, 101–108. [Google Scholar] [CrossRef]
  16. Lachenaud, P.; Motamayor, J.C. The Criollo cacao tree (Theobroma cacao L.): A review. Genet. Resour. Crop Evol. 2017, 64, 1807–1820. [Google Scholar] [CrossRef]
  17. Motamayor, J.C.; Lachenaud, P.; Mota, J.W.d.S.e.; Loor, R.; Kuhn, D.N.; Brown, J.S.; Schnell, R.J. Geographic and genetic population differentiation of the Amazonian chocolate tree (Theobroma cacao L.). PLoS ONE 2008, 3, e3311. [Google Scholar] [CrossRef] [Green Version]
  18. Pound, F. A note on the cocoa population of South America. Rep. Proc. Cocoa Res. Conf. 1945, 1, 131–133. [Google Scholar]
  19. N’Goran, J.A.; Laurent, V.; Risterucci, A.-M.; Lanaud, C. Comparative genetic diversity studies of Theobroma cacao L. using RFLP and RAPD markers. Heredity 1994, 73, 589–597. [Google Scholar] [CrossRef] [Green Version]
  20. Lerceteau, E.; Robert, T.; Pétiard, V.; Crouzillat, D. Evaluation of the extent of genetic variability among Theobroma cacao accessions using RAPD and RFLP markers. Theor. Appl. Genet. 1997, 95, 10–19. [Google Scholar] [CrossRef]
  21. Whitkus, R.; De la Cruz, M.; Mota-Bravo, L.; Gómez-Pompa, A. Genetic diversity and relationships of cacao (Theobroma cacao L.) in southern Mexico. Theor. Appl. Genet. 1998, 96, 621–627. [Google Scholar] [CrossRef]
  22. Sounigo, O.; Umaharan, R.; Christopher, Y.; Sankar, A.; Ramdahin, S. Assessing the genetic diversity in the International Cocoa Genebank, Trinidad (ICG, T) using isozyme electrophoresis and RAPD. Genet. Resour. Crop Evol. 2005, 52, 1111–1120. [Google Scholar] [CrossRef]
  23. dos Santos, R.C.; Pires, J.L.; Lopes, U.V.; Gramacho, K.P.G.; Flores, A.B.; Bahia, R.d.C.S.; Ramos, H.C.C.; Corrêa, R.X.; Ahnert, D. Assessment of genetic diversity on a sample of cocoa accessions resistant to witches’ broom disease based on RAPD and pedigree data. Bragantia 2005, 64, 361–368. [Google Scholar] [CrossRef] [Green Version]
  24. Motamayor, J.C.; Risterucci, A.-M.; Lopez, P.A.; Ortiz, C.F.; Moreno, A.; Lanaud, C. Cacao domestication I: The origin of the cacao cultivated by the Mayas. Heredity 2002, 89, 380–386. [Google Scholar] [CrossRef] [Green Version]
  25. Zhang, D.; Mischke, S.; Johnson, E.S.; Phillips-Mora, W.; Meinhardt, L. Molecular characterization of an international cacao collection using microsatellite markers. Tree Genet. Genomes 2009, 5, 1–10. [Google Scholar] [CrossRef]
  26. Zhang, D.; Boccara, M.; Motilal, L.; Mischke, S.; Johnson, E.S.; Butler, D.R.; Bailey, B.; Meinhardt, L. Molecular characterization of an earliest cacao (Theobroma cacao L.) collection from Upper Amazon using microsatellite DNA markers. Tree Genet. Genomes 2009, 5, 595–607. [Google Scholar] [CrossRef]
  27. Zhang, D.; Martínez, W.J.; Johnson, E.S.; Somarriba, E.; Phillips-Mora, W.; Astorga, C.; Mischke, S.; Meinhardt, L.W. Genetic diversity and spatial structure in a new distinct Theobroma cacao L. population in Bolivia. Genet. Resour. Crop Evol. 2012, 59, 239–252. [Google Scholar] [CrossRef] [Green Version]
  28. Stack, J.C.; Royaert, S.; Gutiérrez, O.; Nagai, C.; Holanda, I.S.A.; Schnell, R.; Motamayor, J.-C. Assessing microsatellite linkage disequilibrium in wild, cultivated, and mapping populations of Theobroma cacao L. and its impact on association mapping. Tree Genet. Genomes 2015, 11, 19. [Google Scholar] [CrossRef] [Green Version]
  29. Motilal, L.A.; Zhang, D.; Mischke, S.; Meinhardt, L.W.; Umaharan, P. Microsatellite-aided detection of genetic redundancy improves management of the International Cocoa Genebank, Trinidad. Tree Genet. Genomes 2013, 9, 1395–1411. [Google Scholar] [CrossRef]
  30. Everaert, H.; Rottiers, H.; Pham, P.H.D.; Ha, L.T.V.; Nguyen, T.P.D.; Tran, P.D.; De Wever, J.; Maebe, K.; Smagghe, G.; Dewettinck, K. Molecular characterization of Vietnamese cocoa genotypes (Theobroma cacao L.) using microsatellite markers. Tree Genet. Genomes 2017, 13, 99. [Google Scholar] [CrossRef]
  31. Everaert, H.; De Wever, J.; Tang, T.K.H.; Vu, T.L.A.; Maebe, K.; Rottiers, H.; Lefever, S.; Smagghe, G.; Dewettinck, K.; Messens, K. Genetic classification of Vietnamese cacao cultivars assessed by SNP and SSR markers. Tree Genet. Genomes 2020, 16, 43. [Google Scholar] [CrossRef]
  32. Guiraud, B.S.H.B.; Tahi, M.G.; Fouet, O.; Trebissou, C.I.; Pokou, D.; Rivallan, R.; Argout, X.; Koffi, K.K.; Koné, B.; Zoro, B.I.A.; et al. Assessment of genetic diversity and structure in cocoa trees (Theobroma cacao L.) in Côte d’Ivoire with reference to their susceptibility to Cocoa swollen shoot virus disease (CSSVD). Tree Genet. Genomes 2018, 14, 52. [Google Scholar] [CrossRef]
  33. Lindo, A.A.; Robinson, D.E.; Tennant, P.F.; Meinhardt, L.W.; Zhang, D. Molecular characterization of cacao (Theobroma cacao) germplasm from Jamaica using single nucleotide polymorphism (SNP) markers. Trop. Plant Biol. 2018, 11, 93–106. [Google Scholar] [CrossRef]
  34. Adenet, S.; Regina, F.; Rogers, D.; Bharath, S.; Argout, X.; Rochefort, K.; Cilas, C. Study of the genetic diversity of cocoa populations (Theobroma cacao L.) of Martinique (FWI) and potential for processing and the cocoa industry. Genet. Resour. Crop Evol. 2020, 67, 1–11. [Google Scholar] [CrossRef]
  35. Arevalo-Gardini, E.; Meinhardt, L.W.; Zuñiga, L.C.; Arévalo-Gardni, J.; Motilal, L.; Zhang, D. Genetic identity and origin of “Piura Porcelana”—A fine-flavored traditional variety of cacao (Theoborma cacao) from the Peruvian Amazon. Tree Genet. Genomes 2019, 15, 11. [Google Scholar] [CrossRef]
  36. Cosme, S.; Cuevas, H.; Zhang, D.; Oleksyk, T.; Irish, B. Genetic diversity of naturalized cacao (Theobroma cacao L.) in Puerto Rico. Tree Genet. Genomes 2016, 12, 88. [Google Scholar] [CrossRef]
  37. Mata-Quirós, A.; Arciniegas-Leal, A.; Phillips-Mora, W.; Meinhardt, L.W.; Motilal, L.; Mischke, S.; Zhang, D. Assessing hidden parentage and genetic integrity of the “United Fruit Clones” of cacao (Theobroma cacao) from Costa Rica using SNP markers. Breed. Sci. 2018, 18057. [Google Scholar] [CrossRef] [PubMed] [Green Version]
  38. Olasupo, F.O.; Adewale, D.B.; Aikpokpodion, P.O.; Muyiwa, A.A.; Bhattacharjee, R.; Gutierrez, O.A.; Motamayor, J.C.; Schnell, R.J.; Ebai, S.; Zhang, D. Genetic identity and diversity of Nigerian cacao genebank collections verified by single nucleotide polymorphisms (SNPs): A guide to field genebank management and utilization. Tree Genet. Genomes 2018, 14, 32. [Google Scholar] [CrossRef]
  39. Motilal, L.A.; Zhang, D.; Umaharan, P.; Mischke, S.; Mooleedhar, V.; Meinhardt, L.W. The relic Criollo cacao in Belize–genetic diversity and relationship with Trinitario and other cacao clones held in the International Cocoa Genebank, Trinidad. Plant Genet. Resour. Charact. Util. 2010, 8, 106. [Google Scholar] [CrossRef] [Green Version]
  40. Durán, E.; Dubón, A. Tipos Genéticos de Cacao y Distribución Geográfica en Honduras; Centro de Comunicación Agrícola: Lima, Honduras, 2016. [Google Scholar]
  41. Murray, M.G.; Pitas, J.W. Plant DNA from alcohol-preserved samples. Plant Mol. Biol. Report. 1996, 14, 261–265. [Google Scholar] [CrossRef]
  42. Bressan, E.A.; Rossi, M.L.; Gerald, L.T.; Figueira, A. Extraction of high-quality DNA from ethanol-preserved tropical plant tissues. BMC Res. Notes 2014, 7, 268. [Google Scholar] [CrossRef] [PubMed] [Green Version]
  43. Saunders, J.A.; Mischke, S.; Leamy, E.A.; Hemeida, A.A. Selection of international molecular standards for DNA fingerprinting of Theobroma cacao. Theor. Appl. Genet. 2004, 110, 41–47. [Google Scholar] [CrossRef]
  44. Pugh, T.; Fouet, O.; Risterucci, A.-M.; Brottier, P.; Abouladze, M.; Deletrez, C.; Courtois, B.; Clément, D.; Larmande, P.; N’Goran, J.A. A new cacao linkage map based on codominant markers: Development and integration of 201 new microsatellite markers. Theor. Appl. Genet. 2004, 108, 1151–1161. [Google Scholar] [CrossRef]
  45. Kalinowski, S.T.; Taper, M.L.; Marshall, T.C. Revising how the computer program CERVUS accommodates genotyping error increases success in paternity assignment. Mol. Ecol. 2007, 16, 1099–1106. [Google Scholar] [CrossRef]
  46. Peakall, R.; Smouse, P.E. GENALEX 6: Genetic analysis in Excel. Population genetic software for teaching and research. Mol. Ecol. Notes 2006, 6, 288–295. [Google Scholar] [CrossRef]
  47. Liu, K.; Muse, S.V. PowerMarker: An Integrated Analysis Environment for Genetic Marker Analysis. Bioinformatics 2005, 21, 2128–2129. [Google Scholar] [CrossRef] [Green Version]
  48. Pritchard, J.K.; Stephens, M.; Donnelly, P. Inference of population structure using multilocus genotype data. Genetics 2000, 155, 945–959. [Google Scholar] [PubMed]
  49. Evanno, G.; Regnaut, S.; Goudet, J. Detecting the number of clusters of individuals using the software STRUCTURE: A simulation study. Mol. Ecol. 2005, 14, 2611–2620. [Google Scholar] [CrossRef] [PubMed] [Green Version]
  50. Earl, D.A. Structure harvester: A website and program for visualizing STRUCTURE output and implementing the Evanno method. Conserv. Genet. Resour. 2012, 4, 359–361. [Google Scholar] [CrossRef]
  51. Francis, R.M. Pophelper: An R package and web app to analyse and visualize population structure. Mol. Ecol. Resour. 2017, 17, 27–32. [Google Scholar] [CrossRef] [Green Version]
  52. Jombart, T. Adegenet: A R package for the multivariate analysis of genetic markers. Bioinformatics 2008, 24, 1403–1405. [Google Scholar] [CrossRef] [Green Version]
  53. Chessel, D.; Dufour, A.B.; Thioulouse, J. The ade4 package-I-One-table methods. R News 2004, 4, 5–10. [Google Scholar]
  54. Motamayor, J.C.; Risterucci, A.-M.; Heath, M.; Lanaud, C. Cacao domestication II: Progenitor germplasm of the Trinitario cacao cultivar. Heredity 2003, 91, 322–330. [Google Scholar] [CrossRef] [Green Version]
  55. Boza, E.J.; Motamayor, J.C.; Amores, F.M.; Cedeño-Amador, S.; Tondo, C.L.; Livingstone, D.S.; Schnell, R.J.; Gutiérrez, O.A. Genetic Characterization of the Cacao Cultivar CCN 51: Its Impact and Significance on Global Cacao Improvement and Production. J. Am. Soc. Hortic. Sci. 2014, 139, 219–229. [Google Scholar] [CrossRef]
  56. De la Cruz, M.; Whitkus, R.; Gómez-Pompa, A.; Mota-Bravo, L. Origins of cacao cultivation. Nature 1995, 375, 542–543. [Google Scholar] [CrossRef]
Figure 1. Geographical sites (red dots) where cacao’s leaves were collected in Honduras.
Agronomy 11 00225 g001
Figure 2. Pod samples of cacao Criollo from (A). Copán, (B). Intibucá, (C). Olancho, and (D). Santa Bárbara.
Agronomy 11 00225 g002
Figure 3. Population structure of Theobroma cacao L. of the “Honduras” dataset based on 16 SSR markers, using the best number of clusters according to the Evanno method (K = 2) [49]. Each individual sample is represented by a vertical line divided into K colored segments that represent the membership fraction for each cluster. The bar line under the plot represents the 4 Honduran departments. Criollo 13 has been used as Criollo reference and to identify the pure Honduran Criollo cacaos.
Agronomy 11 00225 g003
Figure 4. Population structure of Theobroma cacao L. of the “Complete” dataset based on 16 SSR markers, using the best assignment result retrieved according to the Evanno method (K = 2) [49]. Each individual sample is represented by a vertical line divided into K colored segments that represent the membership fraction for each cluster. The bar line under the plot represents the Honduras samples and the ten genetic groups identified by Motamayor et al. [17].
Agronomy 11 00225 g004
Figure 5. Principal coordinates analysis of the “Complete” dataset. The references accessions are divided based on the ten genetic groups [17], while all Honduran samples are identified by the same symbol to better visualize their wide distribution.
Agronomy 11 00225 g005
Figure 6. Population structure of Theobroma cacao L. of the 116 reference accessions along with 8 representative Honduran pure Criollo samples based on 16 SSR markers, using K = 10 according to the second best ΔK. Each individual sample is represented by a vertical line divided into K colored segments that represent the membership fraction for each cluster. The bar line under the plot represents the ten genetic groups identified by [17]. The 8 representative Honduras pure Criollo samples cluster with the Amazon Criollo reference accessions.
Agronomy 11 00225 g006
Table 1. List of the 16 SSR loci used for the analysis of the cacao samples: SSR names, EMBL accessions, chromosome number, forward and reverse primer sequences, observed size, repeat motifs, and references.
SSR NameEMBL AccessionChromosome No.Forward PrimerReverse PrimerSize (bp)MotifRef.
MTcCIR6Y1698065′-TTCCCTCTAAACTACCCT
AAAT-3′
5′-TAAAGCAAAGCAAT
CTAACATA-3′
224–246(TG)7(GA)13[43]
MTcCIR7Y1698175′-ATGCGAATGACAACTGG
T-3′
5′-GCTTTCAGTCCTTTG
CTT-3′
147–159(GA)11[43]
MTcCIR8Y1698295′-CTAGTTTCCCATTTACCA-3′5′-TCCTCAGCATTTTCTT
TC-3′
286–302(TC)5TT(TC)17TTT(CT)4[43]
MTcCIR11Y1698525′-TTTGGTGATTATTAGCA
G-3′
5′-GATTCGATTTGATG
TGAG-3′
290–316(TC)13[43]
MTcCIR12Y1698645′-TCTGACCCCAAACCTGT
A-3′
5′-ATTCCAGTTAAAGC
ACAT-3′
187–219(CATA)4N18(TG)6[43]
MTcCIR18Y1699145′-GATAGCTAAGGGGATTG
AGGA-3′
5′-GGTAATTCAATCATT
TGAGGATA-3′
331–345(GA)12[43]
MTcCIR22Y1699515′-ATTCTCGCAAAAACTTA
G-3′
5′-GATGGAAGGAGTGT
AAATAG-3′
277–289(TC)12N146(CT)10[43]
MTcCIR24Y1699695′-TTTGGGGTGATTTCTTC
TGA-3′
5′-TCTGTCTCGTCTTTTG
GTGA-3′
184–200(AG)13[43]
MTcCIR26Y1699885′-GCATTCATCAATACAT
TC-3′
5′-GCACTCAAAGTTCA
TACTAC-3′
289–307(TC)9C(CT)4TT(CT)11[43]
MTcCIR33AJ27182645′-TGGGTTGAAGATTTG
GT-3′
5′-CAACAATGAAAATA
GGCA-3′
270–344(TG)11[43]
MTcCIR37AJ271942105′-CTGGGTGCTGATAGAT
AA-3′
5′-AATACCCTCCACAC
AAAT-3′
144–184(GT)15[43]
MTcCIR40AJ27194335′-AATCCGACAGTCTTTAA
TC-3′
5′-CCTAGGCCAGAGAA
TTGA-3′
271–285(AC)15[43]
MTcCIR60AJ27195825′-CGCTACTAACAAACATCA
AA-3′
5′-AGAGCAACCATCAC
TAATCA-3′
188–212(CT)7(CA)20[43]
MTcCIR115AJ5664574 5′-GTGATTCAAATTCAAATA
TG-3′
5′-AATAGCAAGAGAGT
GATGAG-3′
189–195(TC)11[44]
MTcCIR158AJ5664894 5′-TGTAGGTTATGCAGCGTG
TTC-3′
5′-GATGAGGGGTGTAG
CTGTTTG-3′
211–217(CT)8[44]
MTcCIR168AJ5664974 5′-GGTAGTATTGAGGTGCGT
AT-3′
5′-GTGAATGAATGGAT
GTGAAA-3′
174–186(TC)9[44]
Table 2. Genetic parameters from 16 SSR loci. For each locus, the number of alleles (Na), the effective number of alleles (Ne), frequency of the predominant allele (Fa), the observed (Ho) and expected heterozygosity (He), the fixation index (F), and the polymorphic information content (PIC) of the “Honduras” dataset are shown.
LocusNaNeFaHoHeFPIC
MTcCIR66.02.100.630.260.520.500.46
MTcCIR75.02.240.600.390.550.300.49
MTcCIR85.02.010.660.330.500.340.45
MTcCIR115.02.040.620.280.510.450.43
MTcCIR127.02.180.610.350.540.350.48
MTcCIR185.01.970.670.300.490.390.44
MTcCIR223.01.800.690.250.440.440.37
MTcCIR245.02.790.520.280.640.560.59
MTcCIR266.02.710.540.260.630.580.58
MTcCIR3311.03.930.330.380.740.490.70
MTcCIR378.02.670.540.300.620.520.58
MTcCIR406.02.500.600.300.600.500.57
MTcCIR605.01.670.750.370.400.080.35
MTcCIR1153.02.060.630.280.510.450.44
MTcCIR1583.01.840.660.140.460.690.36
MTcCIR1685.01.820.710.210.450.530.41
Mean5.52.270.610.290.540.450.48
Publisher’s Note: MDPI stays neutral with regard to jurisdictional claims in published maps and institutional affiliations.

