Article

Improvement of Nitrogen-Fertilizer Recommendation by Consideration of Long-Term Site and Cultivation Effected Mineralization

1
G.U.B. Ingenieur AG, Niederlassung Dresden, Glacisstr. 2, 01099 Dresden, Germany
2
Sächsisches Landesamt für Umwelt, Landwirtschaft und Geologie (LfULG), Waldheimer Str. 219, 01683 Nossen, Germany
*
Author to whom correspondence should be addressed.
Retired.
Agronomy 2021, 11(12), 2492; https://doi.org/10.3390/agronomy11122492
Submission received: 19 October 2021 / Revised: 29 November 2021 / Accepted: 1 December 2021 / Published: 8 December 2021
(This article belongs to the Special Issue Nitrogen Cycle in Farming Systems)

Abstract

:
Organic matter (OM) and nutrient nitrogen (N) play vital roles in the fertility and production of soil in accordance with goals of efficient environmental protection. This study aimed to show the extent to which N delivery can contribute to improving nitrogen fertilizer requirements (NFR) through comparative analysis of OM and N. Systems determining the NFR in agricultural practices have thus far been challenged to estimate the annual rate of mineralization of the soil. OM and N turnover was investigated through an available evaluation consisting of 546 representatively distributed permanent test and observation plots (TP) of the German Federal State of Saxony farms. A solid database of at least 10-year field plot card records from 2001 to 2010 was selected for the analysis. A program (BEFU) widely used in agricultural practice, along with the simplified process model CCB, were applied. For the calculation of the amount of mineral N fertilizers used, the results of three different methods for determining the NFR were compared with each other. The determination of the farmers’ demand (=actual condition of the TP) with a mean value of 132 kg N ha−1 did not show a large difference between the calculated values with 137 kg N ha−1 by the BEFU program. Based on the available results for the most important crop species cultivated in Saxony, there were clear differences in the considerations of the N delivery from the soil. The BEFU program was able to calculate an average N delivery of 17 kg N ha−1 from tabulated data, whereas with the CCB process model, 66 kg N ha−1 of mineralization was determined with a distinct higher deviation by taking into account the 10-year field histories. Using the N delivery of the TP by the CCB model, a clear reduction of the mean N fertilization level, to about 80 kg N ha−1, was therefore achieved. These differences were particularly large for TP with organic fertilization (livestock), at a relatively low N fertilization level, and for certain crop species. With a high standard deviation, the average savings potential of mineral N fertilizers was 52–57 kg N ha−1. After including the corrected values for the N mineral fertilization, a decrease in the N balances by an average of 20–25 kg N ha−1 was ultimately achieved. In particular, the heavily oversupplied plots with D and E classification decreased by approximately 50%. The results of our study demonstrate clear improvements; therefore, increased efforts should be made in the future to optimize the determination of NFR using applicable methods that consider N mineralization in agricultural practice and consultation.

1. Introduction

Central European agriculture is facing major challenges. Agriculture should supply a continuously growing population with high quality food and increasingly provide renewable resources for energetic and industrial use. In view of the ongoing non-agricultural land consumption and limited resources, these requirements can often only be met by increasing land intensity and productivity. At the same time, the environmental impacts of agriculture are increasingly becoming the subject of social discussion. Consequently, there are also increasing calls to minimize the negative effects of agricultural production on the environment [1,2,3]. The long-term securing of the fertility and productivity of soil must be in accordance with the goals of efficient environmental protection, in particular, that of sustainable groundwater. For this reason, soil organic matter (OM) and the nutrient cycle of agricultural holdings are the focus of this work.
As a result of the intensification of fertilization, reports of negative environmental effects from agriculture have been increasing for some time, especially with regard to the use of the nutrient nitrogen [3,4,5]. In the year 1991, the EU issued the directive on the protection of groundwater and surface water from contamination, primarily through fertilization from agriculture [6]. In Germany, the directive is implemented by the current versions of the fertilizer ordinance.
For this purpose, e.g., in accordance with the German Fertilizer Ordinance [7], data from farms are collected in the form of the so-called “nutrient comparison”, whereby deductions are to be made for certain balance components. These results have generally showed relatively low positive mean N balances. Since a significant proportion of up to more than 50% of the arable land also showed negative balances, there was often no need for further action apart from the usual agronomic indications of the advantages of growing catch crops and reduced tillage [8,9,10].
Not only did uncertainties arise in the interpretation of such results from incomplete balancing, but due to the lack of knowledge of the technical relationships, the responsible administration often derived an incorrect need for advice and action within the framework of “good professional practice”, e.g., in such a way that, in the case of negative nutrient comparisons, warnings were provided on the dangers of decreasing soil fertility, and not only on organic farming fields [11,12,13]. Despite several efforts on the part of the responsible state institutions to implement these regulations, little progress has been made in this area over the past 30 years.
To ensure high and stable yields, N must be in a plant-available form, i.e., as ammonium or nitrate, and in sufficient quantities in the soil during the growing season. In the course of OM mineralization, these mineral compounds are continuously released and available to the plants. As with OM turnover, this release of soil N, known as “nitrogen delivery”, is also subject to the influences of the climate, the soil, and cultivation. According to the German fertilizer ordinance, the consideration of the nutrient delivery in systems of nitrogen fertilization is part of “good professional practice” [14]. Despite intensive research in recent decades, it has, so far, been difficult to estimate the available annual mineralization rates of the soil. As a general rule, 1–3% of the organically bound nitrogen can be assumed [15].
The methods used to date only consider a small proportion of the N amount of the OM in the fertilizer recommendation [16]. To correct deficits, particularly in the nutrient release from the OM turnover, a simplified process model was used. The CCB (CANDY Carbon Balance [17]) directly calculates the development of the carbon (Corg) content in the soil under the influence of various side effects and agricultural management. Finally, the rate of release of organically bound N and, therefore, the N mineralization from agricultural arable farming systems, can be quantitatively estimated from the Corg turnover.
On the basis of a field test plot (TP) network [8], an inventory of the long-term OM and N balance was first created from arable land representatively distributed over the German Federal State of Saxony. The recording and evaluation of the current situation in comparison to improved methods for determining the N-fertilizer requirement (NFR) were carried out with the BEFU (“Bestandesführung”) program, widely used in agricultural practice [18]. The aim of the study was to show the extent to which the N delivery can particularly contribute to improving for NFR methods through using comparative calculations based on OM and N balances.

2. Materials and Methods

2.1. Permanent Field Plots

The Saxon State Office for Environment, Agriculture and Geology (LfULG) operates a system of 1056 long-term TP on farms almost representatively distributed across the German state of Saxony. Every year, the management data of the TP are recorded quantitatively. Evaluations of the OM and nutrient status are made possible with the documentation of resources used and the crop yields. In addition, soil samples are obtained annually in spring and late autumn. A description of the TP and their cultivation can be found in [9].
The present work continues the analyses carried out by authors for the years 1998 to 2003. Management data from the years 1995 to 2010 were used. For the present study, TP were selected with a duration of the existing field records of at least 10 years. The relatively long running time of the test areas was chosen in order to take into account at least one full crop rotation in the further evaluations and to minimize the influence of short-term adjustments to the cultivation structures as much as possible. The results from the soil examinations, such as the Nmin content (NH4+-N, NO3-N, 0–60 or 90 cm depth [19]), were available in MS Excel format. Overall, data from the agricultural management of 546 plots or 5460 trading years and harvests were evaluated. During the study period, the following crop species were grown on the TP:
-
winter wheat 24.9%
-
winter rape 18.3%
-
winter barley 15.7%
-
silage maize 10.5%
-
spring barley 7.8%
-
triticale 4.8%
-
winter rye 3.5%
-
sugar beet 3.1%
-
grain maize 1.5%
-
others 9.9%.
The main soil types account for the following numbers or proportions of the study areas: sand (S), 7 areas (1%); poor loamy sand (Sl), 16 areas (3%); loamy sand (LS), 107 areas (20%); high sandy loam (SL), 81 areas (15%); sandy loam (sL), 281 areas (51%); and loam (L) 54 areas (10%).

2.2. Application of Process Models

One focus of the project was to use the CCB program according to the implementation in [17] to examine its possible application on arable land. The process model calculates the Corg and total nitrogen (Nt) dynamics directly from the turnover of the OM in the soil. In contrast to other process models mainly used in scientific research, such as the ROTHC [20], the CCB only needs a few data on soil type, climatic and weather conditions, cultivation and fertilization, which are already available on most farms or are easily obtainable. As a result of the simulation, the development of the Corg and Nt content in the soil over time and the dependent N mineralization or immobilization (Nm) can be predicted directly.
In the past, the model has been successfully tested and validated on the results of standardized long-term field trials [17,21,22]. Compared to the experimentally determined values from 65 long-term trials with 598 test variants, the CCB shows the following statistical certainties:
-
Calculation of contents or differences of Corg: mean error (ME) = −0.0016–−0.0041% Corg, root–mean–square error (RMSE) = 0.14–0.16% Corg, r = 0.74 (p < 0.001).
-
Nt calculations: ME = −0.0101–−0.0108% Nt, RMSE = 0.021–0.026% Nt, r = 0.40 (p < 0.001).
-
From the change in the Corg content, conclusions can also be drawn about the OM balance.

2.3. Organic Matter and Nitrogen Balancing

The BEFU or BESyD program was developed by the LfULG. It is widespread in agricultural practice and advisory services and is viewed in several states of eastern Germany as an officially recognized PC program for nutrient and OM (“humus”) balancing and for NFR determining [18,23].
The site-adapted method (STAND)—according to [24], a further development of the VDLUFA method [25,26]—was used to calculate the OM balance. The methods have been described in detail in some papers and compared with one another [21,22,27]. The statistical certainty of the STAND method for Corg differences in the RMSE is 0.11% Corg, r = 0.74 (p < 0.001). The VDLUFA (“Verband Deutscher Landwirtschaftlicher Untersuchungs- and Forschungsanstalten”, https://www.vdlufa.de accessed on 24 September 2021) classification according to [26] was applied to evaluate the OM balance results (Table 1).
In addition, the N balance was also carried out by the BEFU program with the stored parameter data sets. From the difference between the N input via mineral and organic fertilization as well as the symbiotic N2 fixation on the one hand and the N output with the main and by-products on the other hand, the program initially calculates net field balances. By adding the N inputs from the atmosphere deposition, gross balances were ultimately obtained.
The N deposition data were made available by the German Federal Environment Agency [28]. According to this, annual N inputs from the atmosphere through dry and wet depositions of 16–30 kg N ha−1 can be expected for the federal state of Saxony. The statistical certainty for calculating the N balances between the experimentally determined and calculated values is r = 0.79 (p < 0.001) [29]. To evaluate the N gross balances, a five-step matrix, based on the VDLUFA system for classifying the OM balance or the basic nutrient supply of soils was developed (Table 2 [21,30]).

2.4. Procedure for Determining Fertilizer Requirements

The methods currently used to determine the NFR are based on the Nmin method or an extended N balance approach [16,31,32]. Site-adapted planning models of agricultural practice, such as the BEFU program, in which the essential factors influencing the N demand of the plants are taken into account, enable a crop- and field-plot-specific NFR determination. The starting point of the calculation is a site-dependent N base or N target value as a measure for the crop-specific and the respective yield expectation-dependent N requirement. These values are derived from a large number of N fertilizer field trials and updated regularly. They correspond approximately to the N uptake by the grown vegetation of the crop species (main and by-product) and indicate the total amount of available N that leads to an optimal yield. The most important N sources listed below are still needed to determine the NFR [16,18,33]:
-
Soil Nmin reserve at the beginning of vegetation;
-
N-delivery during vegetation depending on the previous crop species, the organic fertilization of the previous crop and the type of soil;
-
N-supply from organic fertilization for the cultivated crop species, in particular as ammonium-N, depending on the amount, the type and the application date;
-
Plus/minus vegetation status, irrigation, weather, etc.
The NFR results from the difference between the N base value and the sum of Nmin, N delivery and N supply from organic fertilization. With the size “N-delivery”, an attempt is made to evaluate the N-release from the decomposition of the OM through mineralization with the help of tabular compilations. Only easily detectable parameters are taken into account, which are important for the conversion of the degradable OM of the soil, the so-called “nutrient humus” [34]. These simple estimates are based on results from N fertilizer trials and empirical values, which are intended to depict the N mineralization capacity of the crop residues and organic fertilizers. In the tables, the substrate and site dependence of the turnover of this OM fraction is expressed, whereby only the actual year of cultivation and the previous year are taken into account. The following fertilizer proportions of the total N content are no longer taken into consideration [14,33]:
-
slurry and liquid digestate 30–40%;
-
stable manure and solid digestate 60–65%;
-
compost 90%.
The total Corg content or earlier management measures, which, under certain circumstances, continue to have an effect into the year under review and can strongly influence the turnover rates of the OM, are not taken into account. Examples of this are a significant change in cultivation, such as a previous plowing of grassland or a long-standing high livestock population with corresponding slurry or stable manure. The after-effects of such measures can, so far, only be recorded via the poorly differentiated previous crop effect. In the CCB program, however, organic fertilization is treated as part of the total stock of OM. The N quantities that have been added with organic fertilizers over many years end up in the total N pool of the soil. The N release is calculated from the conversion of the OM depending on the type of soil (clay content), the temperature and the precipitation, and reported as “mineralization”.
The basic differences between the two models’ approaches become apparent from the following calculation examples. Figure 1 shows the average amounts of N delivery or N mineralization calculated with the BEFU or CCB models for 10 years. In both programs, the N supply from organic fertilization in the year of application is also considered. The arable field with a cereal crop rotation selected for these simulated calculations initially received a comparatively low slurry supply of approx. 30 kg N ha−1 (0.5 LU ha−1) annually before sowing over a period of 30 years. According to the BEFU calculations, approximately 15 kg N ha−1 of this quantity are available as N delivery. In the CCB over time, it is about 60 kg N ha−1, as the decomposable OM reserve in the soil also supplies N.
Depending on the type of fertilizer, this comparison shows that, in the BEFU calculation, only approximately 30–50% of the annual supplied manure-N is taken into account when determining the NFR. Due to the type of calculation, the predominant remainder of the fertilizer quantities supplied is excluded from the assessment and is no longer included in future determinations. In contrast, according to this example of a long-term supply, the CCB takes into account not only the total manure N but also a site-dependent N release from the soil reserve.
In the BEFU program, an increase in the annual slurry application after 30 years to 1 LU ha−1 (60 kg N ha−1) or 2 LU ha−1 (120 kg N ha−1) results only in a small increase in the N delivery of 5 kg ha−1 or around 15 kg Nha−1 a−1. After the manure application was quadrupled, the calculated N delivery will only be doubled. In the calculations of the CCB, on the other hand, the quadrupling of the slurry N dose leads over time to a drastic increase in the mineralization rates by more than three times. According to this calculation, up to 150 kg N ha−1 in the first decade and a maximum of 180 kg N ha−1 in the third decade would then be counted as delivery for the NFR determination. A subsequent reduction in the slurry fertilization after 60 years will not cause the annual mineralization rates to immediately fall back to the initial level, but to remain, on average and over the first 10 years, about 30 kg N ha−1 above this value. Even 20 years after the slurry had been decreased, a significant after-effect of the liquid manure, of about 10 kg N ha−1 a−1, can be expected (Figure 1).
Contrary to the previous estimate from tabular works, the authors of [22] propose to integrate the N mineralization predicted by the CCB model into the usual NFR calculation. As usual, a crop-dependent basic N value (target value) is used for this procedure. The Nmin content in the spring and the calculated amounts of N mineralization and supply from organic fertilizers in the year of use are then deducted from this base value as follows:
  • N-base value
  • −Nmin values at the beginning of vegetation
  • −N delivery from soil (calculated from model CCB=mineralization, Nm)
  • −N supply from manure (calculated from model CCB=Nm)
  • −Other N supplies
  • =NFR (mineral fertilizer).
This basic approach was used to calculate the mineral NFR for the most widely grown crop species in the TP on the basis of 10-year management data. These calculations were carried out with the same basic N values of the crop species and the same spring Nmin values as they were usually used with the BEFU program. In this way, the results of the following three methods for determining the NFR could be compared:
-
Determination according to the farmers’ needs (=actual condition of the TP);
-
Determination of needs according to BEFU on the basis of the field card records of the TP;
-
Determination of needs with BEFU using the N mineralization of the TP according to CCB.

2.5. Statistical Methods

The examined long-term test areas differ in their field sizes; therefore, calculations were based on one hectare of field size. In order to aggregate individual test features at the field level, the weighted mean value (MW mean) for absolute and relative values and specification of the number of values (n) was mostly used. Scatter and bar diagrams were created with the EXCEL program for the visual representation of the results. The statistical relationships between the various parameters are described using the standard deviation (s), correlation and regression analysis. Validation results between values were determined experimentally and values calculated by models were determined by ME (mean error), RMSE (root–mean–square error), the PEARSON correlation coefficient (r) and the significance levels (p).

3. Results

3.1. Fertilizer Recommendations

Taking into account the 10-year study cycle of the field records, NFR were calculated for six cultivated crops, which come from a total of n = 2424 harvest years and correspond to a share of almost 70% of the total cultivation cycles and 390 TP. First, the available harvest years of the TP were aggregated and evaluated separately for each crop species. Table 3 shows the parameters used for a comparison as mean values for the three examined methods of determining the NFR (program BEFU columns no. 3–5, program BEFU including Nm from CCB no. 6 and no. 7 in comparison to the actual applied fertilizer values of the TP no. 8). On average, for the sites and harvest years, the BEFU fertilizer requirement calculated for the individual crops (column no. 5) deviates only slightly from the average of the N-mineral fertilizer used by the farmers (no. 8). There is a considerable difference between the average fertilizer use (no. 8) and the recommendation (no. 5) only for triticale. In the weighted average of the TP (MW), there was a high level of agreement between the NFR according to BEFU of 137 kg N ha−1 and the N level used of 132 kg N ha−1.
If the individual values of the sites and years of cultivation are considered, there are usually only weakly directed relationships between the BEFU fertilization recommendation and the fertilizer levels used (Table 3, column no. 9). Only for grain maize and, with restrictions, also in the case of sugar beets, are the recommendation and the actual use of N-mineral fertilizers at similar levels. However, both crops were only grown to a comparatively small extent.
In two examples for winter wheat and winter rape, the actual N mineral fertilizer use was plotted against the BEFU requirement assessment (without representation). For winter wheat grown on a large scale, the calculated mean values for the NFR and the amount of fertilizer applied are in good agreement. For winter wheat, however, individual doses of between 100 kg N ha−1 and 200 kg N ha−1 a−1 were usual in practice, even if only half the amount of N or, in the opposite case, considerably higher doses would have been calculated after the BEFU NFR determination. For winter rape, the recommendation varied between 50 kg N ha−1 and 250 kg N ha−1. In fact, more than 175 kg N ha−1 was rarely applied. With 135 kg N ha−1 for this crop a lower N requirement of approximately 20 kg N/ha was calculated than was actually applied through fertilization (without representation).
The N mineralization performance determined with CCB (Nm, Table 3, no. 6) includes both the N release of the organic fertilization in the year of application and the N delivery of the soil, which is calculated from the entire, partly long-term, history of management measures of the field. The Nm values showed considerable differences between the crop species, as well as within the same crop, which can also be seen from the specified standard deviations. This variability reflects the clearly different site and cultivation conditions with strongly changing application rates of organic fertilizer of the individual TP. After the implementation of the CCB results in the determination of the NFR, the consideration of a longer period of pre-management and actual fertilizer use also finally led to strongly varying N fertilization recommendations between the individual sites and years of cultivation (Table 3, no. 7).
From the standard deviations listed, it can be seen that by using the CCB calculations for N mineralization, both the heterogeneity of the site and the differences in cultivation for all crop species were considered to a greater extent than is expressed in the variation of the applied fertilizer amounts. According to these investigations, the BEFU program apparently considered the lowest variability in cultivation conditions for all crop species. It becomes clear that the individual history of the TP and the diverse reality could evidently be better covered by the CCB program than with statistically determined tabular values, which originate from cultivation trials at corresponding locations (see Table 3, BEFU no. 3 and 4, CCB no. 6).
Taking into account the Nm values, an average NFR of 128 kg N ha−1 with a high standard deviation of ±64 kg N ha−1 was calculated (Table 3, no. 7). On average, winter barley, triticale and winter rape would have only required a fertilization of 50–60 kg N ha−1. Due to the extensive mineralization performance of the soil, for sugar beet an additional N fertilization of just 20 kg ha−1 would have been necessary on average, also with considerable variation between the years of cultivation. In practice, a comparatively uniform 67 kg N ha−1 was supplied instead (Table 3, CCB no. 7, practice no. 8).
In contrast to the BEFU calculations, statistical relationships were established between the NFR, taking into account the N mineralization and the fertilizer use actually applied on the TP for all crop species (Table 3 no. 10, winter wheat r = 0.302, p < 0.001, winter rape r = 0.281, p < 0.001). Apparently, a certain contribution of the N mineralization has already been considered by the farmers when calculating the N fertilization. Compared to the determinations of the CCB, which come from the entire history of the TP, this contribution was mostly still considerably underestimated.
The calculated NFR, taking into account the Nm values, and the actually provided N amounts only agree well for winter wheat and grain maize. Including all the long-term TP, the calculated NFR considering the CCB mineralization was approximately 52 kg N ha−1 a−1 lower than the amount supplied by the farmers (Table 3, MW no. 7 and no. 8). Overall, there was a closer correlation between the NFR, including the process-based N mineralization and the actual fertilization behavior of the farmers than with the approach of the BEFU method based on simple statistical derivations.
By using the calculated values for N mineralization, the following shift occurred in the importance of the individual components for the N supply (see Table 3, average in %):
ComponentBEFU calculationCCB calculation
Nmin values2324
N delivery8-
N mineralization-35
N mineral fertilization6942
N total input100100
While, in the BEFU calculation, the consideration of N delivery plays a minor role at 8% and the N mineral fertilization was attributed the highest importance, the mineralization according to the CCB calculation represented a component whose importance has been estimated at 35% on average. The N mineral fertilization, on the other hand, was rated lower. This was true for the weighted mean values presented, as well as for the standard deviation of the values. By considering the CCB mineralization, this component is even more important than the Nmin investigation in spring.
Although farm practice data usually have high variability, significant correlations between the conventional method of determining NFR using the BEFU program and the modified method were identified (Figure 2). There was a close linear regression between the two methods, since they were based on the same N target and Nmin values. Differences between the methods existed mainly in the level of N fertilization, since the NFR with consideration of the CCB mineralization can usually be clearly lower than those of the conventional BEFU method. In addition, there were also differences in the calculated NFR between the crop species analyzed.
On average, over all tested crops and years of cultivation, the recommendation for mineral N fertilization was 57 kg N/ha per year lower when using the modified method than according to the method previously used. NFR above the crop-specific target values are not mathematically possible when using the BEFU method. The NFR can also exceed the target values in individual years with the CCB calculations. This was the case, for example, when there is a strong temporary N fixation or negative release rates after a high straw fertilization.
Considerable differences can occur between the NFR taking into account the N mineralization and the actual N mineral fertilizer application. The search for further causes, using the example of winter wheat and winter rape, revealed a significant influence through the average amount of organic fertilization (Figure 3). The higher the N supply via organic fertilizers on the TP, the lower the CCB NFR was compared to the actual mineral fertilizer input of the practice. The total N content of the organic fertilizers was considered in the CCB calculations. The higher and longer the organic fertilization was applied, the higher the calculated N mineralization also was, depending on the turnover conditions of the sites. High mineralization rates ultimately led to low N fertilization recommendations. In practice, on the other hand, organic fertilization was often not adequately taken into account in the determination of requirements, because of the lack of procedural options.
Table 4 shows the results of NFR calculations, including the CCB N mineralization when differentiating between stockless (without organic fertilization) and livestock-keeping (with organic fertilization) management. Without livestock, the calculated N mineralization was at relatively low levels depending on the site and cultivation conditions. Empirically, it is known that winter rape had higher values (67 kg N/ha) than winter wheat (20 kg N/ha, Table 4). With livestock, winter wheat had received an average of 77 kg N ha−1 a−1 through organic fertilization in the 139 years of cultivation, with rapeseed it was 81 kg N ha−1 a−1. As a result of the accumulating effect on the soil, as expected, the N mineralization calculated by CCB increased steadily over the years with the use of organic fertilizers, an equilibrium was reached after a long time in which the manure N was almost completely reflected in the calculated mineralization rates of the rape or wheat plots (140 kg N/ha or 81 kg N/ha, Table 4).
If this mineralization performance was fully taken into account in the determination of the NFR, the mineral N fertilization in rapeseed could have been reduced by more than 3/4 to just 20 kg ha−1. For winter wheat, only 71 kg N ha−1 would have been required instead of 139 kg N ha−1. However, by the conventional calculations the mineral fertilizer application was not even reduced by 20 kg N ha−1. Compared to the total organic N supply, only about 25% on average was taken into account when calculating the mineral N fertilization.

3.2. Organic Matter and N Balancing

To describe the OM and N stocks, balances of both characteristics including N deposition rates and leguminous N2 fixation were established over a uniform 10-year period between 2001 and 2010. The mean N-balance of the 546 TP over this period was 41 kg N ha−1 with a standard deviation of ±40 kg N ha−1 a−1. The highest calculated 10-year balance was 153 kg N ha−1, and the lowest was −160 kg N ha−1 a−1. OM (humus) balances ranged from −508 HEQ to 750 HEQ ha−1, with a mean value of 66 (±134) HEQ ha−1. Highly significant relationships of r = 0.235 (p < 0.001) or r = 0.325 (p < 0.001) were determined between OM and N balances or N mineralization of the CCB, respectively, while there was only a very low correlation of r = 0.069 (p < 0.100) between the OM and the conventional determined N delivery of the BEFU. For every 100 HEQ ha−1, with a large variation the N balances increased by 7.0 kg N ha−1 and the Nm values by 11.9 kg N ha−1.
The relatively close relationship between the OM and N balance is also evident from the classification matrix used, in which both characteristics were assessed using similar classifications (Figure 4). To characterize the actual situation, an optimal supply of OM was found on slightly more than 50% of the plots, while, on a total of 37% of the TP, the OM balances were too high. For the nutrient nitrogen, about 47–48% of the investigated TP showed optimal N balances between 0–49 kg N ha−1 a−1 (balance group C). While too low balances hardly appeared, for around 29% of the plots increased values of up to 80 kg N ha−1 and for just 14–15% of the TP strongly increased N balances >80 kg N ha−1 a−1 were determined. The annual N balances were also elevated on about 45% of the investigated plots with these results, to such an extent that N losses to the environment cannot be ruled out or are even likely, in certain years, or after certain crop species.
There was also a highly significant linear relationship of r = 0.823 (p < 0.001) between the total nitrogen supply and the N balances. Among the N fertilizers used, mineral fertilizers predominated in all N balance groups. The annual mineral N application increased continuously from balance group A to group E, from about 25 kg N ha−1 to more than 136 kg N ha−1 a−1 (Figure 5). At the same time, from balance group A to group E, increasing amounts of organic fertilizers, mainly slurry and farmyard manure, were also applied. In group A, about 20 kg N ha−1 a−1 (~1/3 LU ha−1) was applied with manure; in groups B and C, 30 kg N ha−1 of manure was applied; and in group E, 60 kg N ha−1 a−1 (~1 LU ha−1) of manure was used. Therefore, TP, in balance groups E that were clearly oversupplied with nitrogen, received both the highest mineral and the highest organic N fertilization. It can be seen that a reduction of mineral N fertilization due to the increased use of organic fertilizers in this balance group and partly, also in the balance class D, did not take place or did not take place to a sufficient extent.
A relatively high degree of correspondence was determined for the classes A–E between the two different numbers of TP, so that there is a good basis for comparison in order to be able to assess the effects of the improved determination of NFR, including the CCB mineralization (see Figure 4). Since the correction of the estimated NFR determinations usually reduced the N mineral fertilization, the N balances decreased by 20–25 kg N ha−1 to an average of 17 (±40) kg N ha−1 a−1. The classification is thereby changed in a directed way. The most important result is that the TP portion for the classes D and E has been reduced by approximately 50% (factors 1.7–2.2). From the long-lasting, still moderately high organic fertilization in the TP of class B and slightly in A, there was also a relatively high N delivery, which can explain the increase of these classes due to the reduced mineral N supply calculated at that time. Together, the results of the N balancing were clearly improved by the inclusion of the N mineralization of the CCB model in the NFR determinations.

4. Discussion

One measure with a proven high success control in water protection advice is the implementation of nutrient balances at the field plot level or as a farm gate balance [35]. The results have a high informative value if they are collected completely in the sense of, for example, the PARCOM guideline [36], i.e., in the form of the gross balance [37,38]. In this work, a grouping of the N balance results, experimentally validated on long-term trials, was also performed, whereby suggestions from the literature were extended to an evaluation scheme with five balance groups (A to E) [21,39,40].
This establishes direct comparability with the VDLUFA classification, which has proven itself in practice for assessing OM balances [26] or for determining the lime requirement [41] of agricultural soils. The “optimum range” (balance group C) was defined at N balances between 0–49 kg N ha−1 a−1. The same delimitation is also made by [42]. In this range, there is sufficient certainty to achieve optimal crop yields; balanced OM supply and high N efficiency are ensured. If this balanced group C is complied with, there can be neither undesirable OM depletion due to nitrogen deficiency nor permanent N surpluses with their disadvantages for the environment.
A strictly balanced (gross) N balance should be considered as a lower limit, but often cannot be maintained, as certain N losses are unavoidable in arable farming. A demand-oriented nutrient management must compensate for these losses, otherwise N deficiency situations may actually occur over time. The level of these unavoidable N surpluses can vary within certain limits depending on site characteristics, weather conditions, crop rotation, and fertilizer forms [43]. Classes A and B show an undersupply, whereas D and E lead to an increasing oversupply with indications of possible environmental hazards [30].
In this work, the OM and N balances of a total of 546 permanent TP with records from arable field plot cards of at least 10 years’ duration from farms in the federal state of Saxony were evaluated in the manner shown. With the correspondingly complete determination of the humus and nutrient balances, 36% of the TP were characterized by high OM balances and 44% of the plots were found to have excessively high N balances. Similar results were also found in other comparable studies from Saxony using different evaluation methods [8,44,45]. Over the course of several decades, only minor changes have occurred. Accordingly, the differences to the conditions of the official fertilizer ordinance are between 30–40 kg N ha−1. Compared with other German Federal States, the balances determined are overall at a comparatively average to low level [5,46,47].
The results show that on the one hand, a realistic representation can be assumed, and, on the other hand, a partly clear need for action can be derived. These results occurred, despite the fact that, in Saxony, only a supply of 30 kg N ha−1 a−1 took place via organic fertilizers in the 10-year average of the TP examined here, which corresponds approximately to 0.5 LU ha−1. Therefore, organic fertilizers contributed only about 27% of the nitrogen supply; on the TP areas with organic fertilizers, it was almost 30% of the supply with 41 kg N ha−1 (slurry, stable manure).
It is known that excessive organic fertilizer use inevitably leads to undesirable N and OM surpluses in the medium term, unless straw can be harvested more frequently at the same time or the OM reproduction capacity of the farming system can be reduced in other ways, for example, by changing the crop rotation [45,47]. This is also evident from the inventory of a part of the Saxon test plots, as well as from the calculation of different scenarios for the OM balance. In contrast to the OM level, which showed certain deficiencies on the light arable soils, in particular, the over-supply with nitrogen turned out to be higher the lighter the soils were that needed to be addressed. The relative oversupply was therefore not primarily caused on the light soils by an excessive supply of organic fertilizers but rather by an inappropriately high mineral N fertilization.
Despite intensive consultation, organic fertilizer has still apparently been regarded as waste and not as a valuable resource on many farms. This is a plausible explanation for why the TP in N balance groups D and E received both the highest organic and the highest mineral fertilization. On the other hand, it could hardly be seen that the use of organic fertilization led to corresponding savings in mineral N fertilization. This high supply of fertilizers, then, led to the fact that more than half of the nitrogen used in these fields was not removed with the harvests but remained on the land and was essentially to be regarded as losses. Such clearly too-low values in the nutrient efficiency were determined not only on the sandy soils, but also in dry sites, especially with pronounced spring drought, with increased use of organic fertilizers and with higher root crop and winter rape portions in the crop rotation [48].
Nutrient balances are therefore primarily an instrument for identifying errors in the nutrient management of the farms, whereby reference should first be made to the fertilizer use. High N surpluses of >80 kg N ha−1 a−1 or strong deficits of <−30 kg N ha−1 a−1, as results of the balancing, should give every farm manager reason to critically reconsider the fertilization practice. However, in order to gain a realistic overview of possible losses, it is necessary to record all essential nutrient inputs and outputs and to offset them against each other. This also applies to organic fertilizers, which must be included in the field plot balance with their total nutrient content, even if initially only a small part of it is directly available to the plants after application. The extent to which stable manure, slurry or other organic fertilizers can be used to substitute mineral fertilization and thus to reduce costs must be carefully examined from field to field; this must be carried out without on the one hand endangering the set yield targets and on the other hand, accumulating excessive amounts of OM in the soil, which could later lead to an uncontrollable N release.
The sensible integration of organic fertilizers into the fertilization planning, however, places high demands on the operational OM and nutrient management. Correctly used, they can help to stabilize the OM balance and to save mineral N fertilizers. In practice, considerable uncertainties remain as to the extent to which nitrogen from organic fertilization can be taken into account when determining fertilizer requirements. The present evaluations have shown that the NFR calculation carried out usually lead to only an average of approximately 25–30% of the nitrogen quantity supplied via the organic fertilizers being achieved. The remainder of N, which becomes available in subsequent years, cannot yet be taken into account in the determination of requirements because farmers do not have suitable instruments for this purpose.
Therefore, in many cases, an increased soil N release has not been recognized, which, depending on the site, has led to over-fertilization. It can be assumed that, for these reasons, certain safety margins are still common in mineral N fertilization in order to prevent possible deficiency situations and feared yield losses [49]. In Saxony, in addition to a generally excessive fertilization of certain crops (e.g., winter rape), the causes were identified as an overestimation of the expected or intended yield level, especially on the light soils of the eastern German drylands. Moreover, optimal N utilization is only possible if all growth factors are at the optimum. Additional irrigation could possibly help at these sites [44,48].
It is well known that as a result of organic fertilization measures the majority of the N content initially enters the soil’s N store in organically bound form. Depending on the prevailing environmental conditions (soil, climate), a steady supply of organic fertilizers leads to increasing N supply rates over the years until a balance is reached between the supply and decomposition of OM and the mineralization of nutrients [34,50,51,52,53]. The gross ammonification can thereby show values of more than 20 kg N ha−1 day−1, which are sufficient without additional N applications to amply cover the uptake peaks of maize of 4.4 kg or of potatoes of up to 8 kg N ha−1 day−1 [54,55].
Farms regularly using such manure build up a corresponding N pool in this way, which finally becomes noticeable in the course of the years in a regularly higher N delivery. According to the calculations carried out here, a doubling of the N release through mineralization can already be expected with manure applications of an average of 0.7 LU ha−1 a−1 (corresponding to 40 kg N ha−1 a−1) compared to cultivation methods with the same crop rotation but without organic fertilization. In absolute values, the release on heavy soils is far greater than on light sites. As also shown by simulation calculations, this effect continues to have an impact for several years to decades even after organic fertilization has been discontinued due to slowly decreasing release rates, depending on the level of OM and N accumulation achieved.
The results of special evaluations of long-term field experiments from recent times lead to the conclusion that more or less all of the OM added to the soil from crop and root residues and from organic fertilization is subject to conversion and decomposition in time sequences of several decades, and that the nutrients released via mineralization are then principally used for plant growth. As a function of the supply level, experimentally determined total efficiencies were calculated from this work, which, on the one hand show higher values for nitrogen than previously assumed by [56,57], and, furthermore, show hardly any differences between mineral and organic N sources [34,58,59].
The results of static long-term field experiments with combined increasing organic and mineral N fertilization can also explain the yield reactions of the crop species on farms with the use of organic fertilizers. Due to the increasing delivery of periodically used organic fertilizers over time, there is a steady increase in the yield of the crops grown in the crop rotations following the law of diminishing yield growth [60]. In this context, the yield deviation of the crop rotation between the variants decreases with increasing mineral N fertilization, e.g., in an IOSDV trial on loamy soil in Hungary from initial s = 0.66 t DM to s = 0.53 t DM ha−1 after 12 trial years [61]. As the duration of the trial progresses, the N delivery capacity can increase to such an extent that, in the variants with additional mineral N fertilization, either no more yield effect is achieved and thus maximum yields are reached, or the fertilization level can be reduced markedly in some cases to achieve optimum yields [62,63,64,65,66,67,68].
An important key to optimizing N fertilization is, therefore, to predict the N delivery or mineralization from the soil as precisely as possible. Until now, the most common methods for determining NFR have been used for this purpose, being kept up to date by the German Federal State institutions depending on legal regulations [33,69]. As a rule, the N delivery is estimated from tables that have been determined using statistical methods, taking into account the soil type, the cultivated, and the previous crop species as well as the type, amount, and application date of the organic fertilizer. The lower the “mineral fertilizer equivalent” (MFE) of the organic fertilizers is estimated, the smaller this counted portion is. MFE is the proportion of the nitrogen content of organic fertilizers that is more or less directly available to plants in the year of application [70,71,72,73]. Nutrient losses during application and through leaching, as well as the N fraction present in organic fixation, are not counted. In the year of application, the MFE thus indicates how high the direct effect of the nitrogen in organic fertilizers is to be assessed in comparison to mineral N fertilizers.
Numerous experiments [72,74,75] have clearly shown that organic fertilizers generally do not have the same N fertilization effect in the year of application as the same mineral N fertilizer amount. In the current recommendations for determining NFR according to “good professional practice”, for example, in the BEFU program used here [18,33], this is taken into account by means of appropriate reductions depending on the type of organic fertilizer, the application date, the crop to be cultivated, and, if necessary, the organic fertilizer applied to the previous crop species. For example, in the specifications of the fertilizer regulations [7,14,76], it is assumed that the N not counted from farm manure is then bound in the OM of the soil and/or must be accepted as a source of loss.
In the case of the various types of slurry and liquid digestate, this proportion is between 20–40%, with stable manure 40–80% and, in the case of composts, it can even be approximately 90% of the nitrogen contained in these fertilizers, which is then no longer taken into account for any further requirements. If the fertilizer demand is determined once or at most twice, according to this scheme, obviously useful results for the estimation of the NFR are found. However, if organic fertilizer is applied periodically or annually, the calculations according to MFE lead to increasingly inaccurate results the longer this cultivation lasts. In a long-term field trial, for example, it was shown that an N calculation according to MFE for stable manure and slurry variants led to constantly higher yields than in the corresponding mineral comparison variants due to the increasing delivery supply [77].
If this N portion, which is not or not immediately available to plants, is not taken into account, or is compensated for or even replaced by mineral fertilization, as the current rules previously provide, the use of organic fertilizers, consequently, always leads to higher N balances than after the sole use of mineral N fertilization. This result could also be confirmed by the inventory of the nitrogen household of the Saxon TP carried out here. As soon as N-quantities of >40 kg ha−1 a−1 were applied with the organic fertilization, the majority of the plots were assigned to the N balance groups D and E.
This insufficient consideration of the nitrogen supplied with farm manure in the NFR is to be regarded as a major cause for the high N balances determined with risks for N discharges into the environment of Saxon agriculture. As already mentioned in the introduction of the disadvantages of nutrient comparisons, it can also be deduced from these results that the goals for improving the environmental impact of agriculture will hardly be met by the new fertilizer ordinance [14] with this conventional form of determining the NFR; [78,79] have also come to similar assessments for various reasons.
As a typical value, it can be assumed that approximately 1–3% of the organically bound nitrogen in the soil is subject to mineralization per year [15]. Considering the average OM contents of 2–4% in agriculturally used soils, this corresponds to an N delivery of between 50 kg ha−1 and up to over 300 kg N ha−1 a−1. The wide range of possible rates reflects the influence of soil moisture, temperature, and management. Despite intensive research, it has not been possible to narrow down this range to the point where it is possible to predict the N delivery with sufficient certainty on the basis of easily detectable properties. Efforts to determine the extent of N mineralization, e.g., by chemical, mechanical or other laboratory methods, have therefore remained largely unsuccessful to date [80,81,82,83,84,85,86,87].
In addition, trying to derive an improvement in NFR determination using soil test results, sensors, precision, and smart farming methods, as well as by more accurately considering the current weather of the cropping year [16,88,89,90,91], seems to being slowly exhausted as well, with only little progress made in test phases, for example. In principle, simulation models can better represent the complexity of N turnover [53,92]. However, most of the methods currently under scientific development for quantifying N delivery have hardly been tested under field conditions. They are often too complex for use in agricultural practice, or the necessary data basis is lacking [93,94,95,96,97].
In systems with high levels of organic fertilization, the early spring Nmin values also increase somewhat depending on the fertilizers used, which can usually already be taken into account when determining NFR. As a result, only a small proportion of the N delivery is considered, because the majority of the mineralization that occurs usually takes place after the Nmin test date, parallel to rising temperatures during the vegetation period. A comparison between livestock-less and livestock-rich TP has shown that the Nmin values in spring increase by only 6–7 kg N ha−1, while the calculated mineralization amounts have increased by 61–73 kg N ha−1. Similar increases in Nmin values are obtained in long-term experiments at comparable levels of organic fertilizer supply [64,68,77]. An extremely high accumulation of soluble N compounds only occurs after simultaneously high mineral and organic fertilizer supply.
It is also possible to qualitatively record this increased subsequent delivery in the course of the vegetation by using certain methods, such as a late Nmin determination or the use of rapid tests (nitrate test, N-tester [90]). However, from a temporal perspective, a quantitative consideration in fertilization planning is hardly possible with such methods. Increasing N mineralization rates also result in a higher annual variability of the mineralization, which can only be taken into account in the calculations by recording the climatic differences. This is another aspect that may appear to be important when determining the NFR, but its forecast reliability is difficult and, moreover, has hardly been noticed until now.
The CCB model [17] used in this work requires only a few data already available in the field plot cards of most farms to estimate the N mineralization rates depending on soil type and current or mean weather data (precipitation, temperature). The program calculates the N delivery (N mineralization, Nm) directly from the turnover of the active part of the soil OM (=“nutrient humus”), whereby the organic fertilizer is considered as part of this soil OM portion after application. Using the results of many long-term field trials, there is a high statistical accuracy in most cases between the change in Corg and Nt contents over time (which contain around 95% of the soil N content) and the calculated changes in the CCB model after an average of 26 trial years [22], so it can be assumed that the extent of mineralization can be calculated with sufficient confidence. The longer the time period of the calculated cultivation and fertilization data from the field history is available and can therefore be taken into account, the more accurate will be the calculations for N mineralization but also for checking nutrient management with the help of balancing and efficiency evaluations.
As a rule, the CCB model calculates higher values of N delivery than the conventional usual methods, e.g., when determining NFR with the BEFU program. The differences clearly rise with increasing organic N fertilization and the number of years of application. In the average of the cultivated crop species, with BEFU, a mean delivery value of 17 kg N ha−1 and with the CCB model, a value of 66 kg N ha−1 a−1, could be determined. These results could be obtained although the TP of agricultural practice used are characterized by a relatively high statistical dispersion. From the standard deviations listed, it could also be seen that by using the CCB, the site-specific and cultivation-related heterogeneity of the fields could be represented much better than with the BEFU program.
As already listed in the above-mentioned static combination field trials, the mineral N fertilization quantities of the farm TP could also be reduced clearly in some cases, after integration of the N mineralization determined with the CCB model into the NFR. On average, of the TP investigated for this purpose with a minimum 10-year duration, the savings could amount to around 50 kg N ha−1 a−1, which would be of considerable importance, both from an economic point of view and for reasons of environmental protection. A reduction potential of 30–50 kg N ha−1 was arrived at in a previous study [49]. After incorporating the corrected level of N mineral fertilization into the N balancing, the average N balances could be reduced by at least 20 kg N ha−1 a−1. Above all, the oversupplied test plots of classes D and E were significantly reduced.

5. Conclusions

It can be concluded from the findings that, more than any other influencing factor, the consideration of N mineralization has contributed to an improvement of the N management of the cultivation methods. It could be shown that the situation on farms is much more similar to the conditions on special long-term field trials than to those of short-term trials with an annual change of location, usually used to improve N fertilization systems. Therefore, there is a need for action to revise the procedures for determining NFR to consider the N delivery from OM turnover, from the current year as well as previous cultivation years. Therefore, it is necessary to expand the records in the field plot cards in order to document this cultivation history. In the next phase, both the suitability of N mineralization methods and the magnitude of inclusion should be tested separately in long-term field experiments and on-farm trials to further optimize the NFR.

Author Contributions

Conceptualization, H.K.; Data curation, D.M.; Investigation, D.M.; Methodology, D.M. and H.K.; Writing, D.M. and H.K. All authors have read and agreed to the published version of the manuscript.

Funding

This research was funded by the Saxon Ministry SMUL, Dresden, Germany.

Institutional Review Board Statement

Not applicable.

Informed Consent Statement

Not applicable.

Data Availability Statement

The data presented in this study are available on request from the corresponding author.

Conflicts of Interest

The authors declare no conflict of interest.

References

  1. The Royal Society. Reaping the Benefits: Science and the Sustainable Intensification of Global Agriculture. 2009. Available online: https://royalsociety.org/-/media/Royal_Society_Content/policy/publications/2009/4294967719.pdf (accessed on 24 September 2021).
  2. Godfray, H.C.J.; Garnett, T. Food security and sustainable intensification. Phil. Trans. Soc. 2014, 369, 1–10. [Google Scholar] [CrossRef]
  3. Taube, F. Umwelt-und Klimawirkungen der Landwirtschaft. Eine kritische Einordnung–Statusbericht, Herausforderungen und Ausblick. Mod. Landwirtsch. Zwischen Anspruch Und Wirklichk. Arch. DLG 2016, 110, 13–38. [Google Scholar]
  4. Taube, F. Nährstoffversorgung von Pflanzen und Tieren im Spannungsfeld von Ökonomie und Ökologie. VDLUFA-Schriftenr. 2014, 70, 15–31. [Google Scholar]
  5. Eulenstein, F.; Cremer, N.; Schindler, R.; Pickert, J. Stickstoffeintrag in Oberflächengewässer und Grundwasser in Deutschland auf Basis bundesweiter Auswertungen. Korresp. Wasserwirtsch. 2018, 11, 3–11. [Google Scholar]
  6. Der europäischen Kommision, R. Richtlinie 91/676/EWG des Rates vom 12. Dezember 1991 zum Schutz der Gewässer vor Verunreinigung durch Nitrat aus landwirtschaftlichen Quellen. ABl. 31. Dezember 1991, 375, 1–8. [Google Scholar]
  7. Anonymous. Verordnung über die Anwendung von Düngestoffen, Bodenhilfsstoffen, Kultursubstraten und Pflanzenhilfsstoffen nach den Grundsätzen der guten fachlichen Praxis beim Düngen (Düngeverordnung–DüV). Bundesgesetzblatt 2007, 7, 222–240. [Google Scholar]
  8. Barth, N.; Tannert, R.; Kurzer, H.J.; Kolbe, H.; Andreae, H.; Jacob, F.; Haferkorn, U.; Rust, M.; Grunert, M. Stickstoffmonitoring Sächsischer Böden; Landesamt für Umwelt, Landwirtschaft und Geologie (LfULG): Dresden, Germany, 2016. [Google Scholar]
  9. Reinicke, F.; Wurbs, D. Nitratausträge Landwirtschaftlich Genutzter Flächen–Erfassung und Auswertung Langjähriger Messreihen von Dauermonitoringflächen. Schriftenr. Landesamt Umw. Landwirtsch. Geologie (LfULG) 2012, 40, 1–53. [Google Scholar]
  10. Wachmüller, A.; Sundrum, A. Der Einfluss länderspezifischer Berechnungsverfahren auf den betrieblichen Nährstoffvergleich gemäß Düngeverordnung. Landbauforsch. 2014, 1, 17–30. [Google Scholar]
  11. Herold, L.; Wagner, S. Vergleichende Untersuchungen zwischen konventioneller und öko-logischer Bewirtschaftung. VDLUFA-Schriftenr. 2007, 62, 362–365. [Google Scholar]
  12. Menge, M. Umweltgerechte Landwirtschaft 2005. Schriftenr. Sächsische Landesanst. Landwirtsch. (LfL) 2007, 1, 1–160. Available online: https://publikationen.sachsen.de/bdb/artikel/14127 (accessed on 24 September 2021).
  13. Osterburg, B.; Rühling, I.; Runge, T.; Schmidt, T.G.; Seidel, K.; Antony, F.; Gödecke, B.; Witt-Altfelder, P. Kosteneffiziente Maßnahmenkombinationen nach Wasserrahmenrichtlinie zur Nitratreduktion in der Landwirtschaft. In Maßnahmen zur Reduzierung von Stickstoffeinträgen in Gewässer–eine Wasserschutzorientierte Landwirtschaft zur Umsetzung der Wasserrahmenrichtlinie; Osterburg, B., Runge, T., Eds.; Landbauforschung Völkenrode, FAL: Völkenrode, Germany, 2007; Volume SH 307, pp. 3–156. [Google Scholar]
  14. Anonymous. Verordnung zur Neuordnung der guten fachlichen Praxis beim Düngen. Bundesgesetzblatt 2017, 32, 1305–1348. [Google Scholar]
  15. Baumgärtel, G.; Scharpf, H.-C. Gute Fachliche Praxis der Stickstoffdüngung; AID Infodienst: Bonn, Germany, 2002. [Google Scholar]
  16. Olfs, H.-W.; Blankenau, K.; Brentrup, F.; Jasper, J.; Link, A.; Lammel, J. Soil-and plant-based nitrogen-fertilizer recommendations in arable farming. J. Plant Nutr. Soil Sci. 2005, 168, 414–431. [Google Scholar] [CrossRef]
  17. Franko, U.; Kolbe, H.; Thiel, E.; Ließ, E. Multi-site validation of a soil organic matter model for arable fields based on generally available input data. Geoderma 2011, 166, 119–134. [Google Scholar] [CrossRef]
  18. Förster, F. BEFU Düngungsempfehlungs-und Bilanzierungssystem; Sächsisches Landesamt für Umwelt, Landwirtschaft und Geologie (LfULG): Dresden, Germany, 2013; Available online: https://publikationen.sachsen.de/bdb/artikel/13447 (accessed on 24 September 2021).
  19. Hoffmann, G. Bestimmung von mineralischem Stickstoff (Nitrat und Ammonium) in Bodenprofilen (Nmin-Labormethode). In Die Untersuchung von Böden; VDLUFA-Methodenbuch 1; VDLUFA-Verlag: Darmstadt, Germany, 1991; Teil A, Abschnitt 6.1.4.1. [Google Scholar]
  20. Coleman, K.; Jenkinson, D. RothC-26.3: A Model for the Turnover of Carbon in Soil. Model Description and Windows Users’ Guide: November 1999 Issue; Lawes Agricultural Trust (LAT): Harpenden, UK, 1999. [Google Scholar]
  21. Kolbe, H. Zusammenführende Untersuchungen zur Genauigkeit und Anwendung von Methoden der Humusbilanzierung im Konventionellen und Ökologischen Landbau. Bilanzier. Und Versorg. Für Humus; Schriftenr. Landesamt Umw. Landwirtsch. Geologie (LfULG) 2012, 19, 4–82. [Google Scholar]
  22. Kolbe, H.; Franko, U.; Thiel, E.; Ließ, E. Verfahren zur Abschätzung von Humusreproduktion und N-Umsatz im ökologischen und konventionellen Ackerbau. Schriftenr. Landesamt Umw. Landwirtsch. Geologie (LfULG) 2013, 1, 1–119. Available online: https://orgprints.org/23095/ (accessed on 24 September 2021).
  23. Peter, C. Bilanzierungs-und Empfehlungssystem Düngung BESyD–das Kostenfreie Programm incl. aller Düngerechtlichen Regelungen für den Konventionellen und Ökologischen Landbau; Sächsisches Landesamt für Umwelt, Landwirtschaft und Geologie (LfULG): Dresden, Germany, 2021; Available online: https://www.landwirtschaft.sachsen.de/duengebedarfsermittlung-besyd-20619.html (accessed on 24 September 2021).
  24. Kolbe, H. Site-adjusted organic matter-balance method for use in arable farming systems. J. Plant Nutr. Soil Sci. 2010, 173, 678–691. [Google Scholar] [CrossRef] [Green Version]
  25. Körschens, M.; Rogasik, J.; Schulz, E.; Böning, H.; Eich, D.; Ellerbrock, R.; Franko, U.; Hülsbergen, K.-J.; Köppen, D.; Kolbe, H.; et al. Standpunkt Humusbilanzierung–Methode zur Beurteilung und Bemessung der Humusversorgung von Ackerland; Verband Deutscher Landwirtschaftlicher Untersuchungs-und Forschungsanstalten (VDLUFA): Bonn, Germany, 2004; Available online: https://www.vdlufa.de/de/index.php/fachinformationen-35/standpunkte-des-vdlufa (accessed on 24 September 2021).
  26. Ebertseder, T.; Engels, C.; Heyn, J.; Hülsbergen, K.-J.; Isermann, K.; Kolbe, H.; Leithold, G.; Reinhold, J.; Schmid, H.; Schweitzer, K.; et al. Standpunkt Humusbilanzierung–Methode zur Beurteilung und Bemessung der Humusversorgung von Ackerland; Verband Deutscher Landwirtschaftlicher Untersuchungs-und Forschungsanstalten (VDLUFA): Bonn, Germany, 2014; Available online: https://www.vdlufa.de/Dokumente/Veroeffentlichungen/Standpunkte/11-Humusbilanzierung.pdf (accessed on 24 September 2021).
  27. Brock, C.; Franko, U.; Oberholzer, H.-R.; Kuka, K.; Leithold, G.; Kolbe, H.; Reinhold, J. Humus balancing in Central Europe–concepts, state of the art, and further challenges. J. Plant Nutr. Soil Sci. 2013, 176, 3–11. [Google Scholar] [CrossRef]
  28. Builtjes, P.; Hendriks, E.; Koenen, M.; Schaap, M.; Banzhaf, S.; Kerschbaumer, A.; Gauger, T.; Nagel, H.-D.; Scheuschner, T.; Schlutow, A. Erfassung, Prognose und Bewertung von Stoffeinträgen und ihren Wirkungen in Deutschland (Modelling of Air Pollutants and Ecosystem Impact–MAPESI); Abschlussbericht zum UFOPLAN-Vorhaben FKZ 3707 64 200, Texte 42; Umweltbundesamt: Dessau-Rosslau, Germany, 2011; Available online: https://www.umweltbundesamt.de/publikationen/erfassung-prognose-bewertung-von-stoffeintraegen-3 (accessed on 24 September 2021).
  29. Meyer, D.; Kolbe, H.; Schuster, M. Berichte aus dem Ökolandbau 2021—Das Ökofeld Roda. Ergebnisse zur langjährigen Bewirtschaftung von Feldversuchsflächen der Versuchsstation Roda in Sachsen; Dr. H. Kolbe: Schkeuditz, Germany, 2021; Available online: https://slub.qucosa.de/api/qucosa%3A76643/attachment/ATT-0/ (accessed on 1 December 2021).
  30. Spiegel, H.; Cermak, P.; de Haan, J.; Füleky, G.; Grignan, C.; D´Hose, T.D.; Staugaitiene, L.R.; Zorn, W.; Guzman, G.; Pikula, D.; et al. Düngeempfehlungen in Europa. VDLUFA-Schriftenr. 2014, 70, 48–56. [Google Scholar]
  31. Wehrmann, J.; Scharpf, H.C. Der Mineralstickstoffgehalt des Bodens als Maßstab für den Stickstoffdüngerbedarf (Nmin-Methode). Plant Soil 1979, 52, 109–126. [Google Scholar] [CrossRef]
  32. Geypens, M.; Vandendriessche, H. Advisory systems for nitrogen fertilizer recommendations. Plant Soil 1996, 181, 31–38. [Google Scholar] [CrossRef]
  33. Albert, E.; Förster, F.; Ernst, H. Wirksamkeit der Organischen Düngung–Berechnung der Pflanzenbaulichen Wirksamkeit Organischer Düngung; Sächsische Landesanstalt für Landwirtschaft (LfL): Dresden, Germany, 2007; Available online: https://publikationen.sachsen.de/bdb/artikel/15271 (accessed on 24 September 2021).
  34. Kolbe, H.; Zimmer, J. Leitfaden zur Humusversorgung–Informationen für Praxis, Beratung und Schulung; Verbund der Landesanstalten und Landesämter für Landwirtschaft; Sächsisches Landesamt für Umwelt, Landwirtschaft und Geologie (LfULG): Dresden, Germany, 2015; Available online: https://publikationen.sachsen.de/bdb/artikel/25484 (accessed on 24 September 2021).
  35. Peter, M.; Beisecker, R.; Pecoroni, D.; Miller, R. Nährstoffbilanzierungen zur Erfolgskontrolle der Gewässerschutzberatung. Korresp. Wasserwirtsch. 2018, 11, 12–17. [Google Scholar]
  36. PARCOM. PARCOM Guide Lines for Calculating Mineral Balances; Meeting of the ad hoc working group on measures to reduce the nutrient lod from agriculture 3; PARCOM: Hague, The Netherlands, 1993. [Google Scholar]
  37. Kolbe, H. Landnutzung und Wasserschutz; Land Use and Water Protection; WLV Wissenschaftl. Lektorat & Verlag: Leipzig, Germany, 2000. [Google Scholar]
  38. Bach, M.; Frede, H.G. Methodische Aspekte und Aussagemöglichkeiten von Stickstoff-Bilanzen; Institut f. Landwirtschaft u. Umwelt (ILU): Bonn, Germany, 2005. [Google Scholar]
  39. Brentrup, F.; Pallière, C. Nitrogen use efficiency as an agro-environmental indicator. Lessons learned and future directions. In Proceedings of the OECD Workshop on OECD Agri-Environmental Indicators, Leysin, Switzerland, 23–26 March 2010; Available online: https://www.oecd.org/greengrowth/sustainable-agriculture/44810433.pdf (accessed on 24 September 2021).
  40. Oenema, O.; Brentrup, F.; Lammel, J.; Bascou, P.; Billen, G.; Dobermann, A.; Erisman, J.W.; Garnett, T.; Hammel, M.; Haniotis, T.; et al. Nitrogen Use Efficiency (NUE)–An Indicator for the Utilization of Nitrogen in Agriculture and Food Systems; Wageningen University: Wageningen, The Netherlands, 2015; Available online: http://www.eunep.com/wp-content/uploads/2017/03/Report-NUE-Indicator-Nitrogen-Expert-Panel-18-12-2015.pdf (accessed on 24 September 2021).
  41. VDLUFA. Standpunkt Bestimmung des Kalkbedarfs von Acker-und Grünlandböden; Verband Deutscher Landwirtschaftlicher Untersuchungs-und Forschungsanstalten (VDLUFA): Bonn, Germany, 2000; Available online: https://www.vdlufa.de/Dokumente/Veroeffentlichungen/Standpunkte/0-9-kalk.pdf (accessed on 24 September 2021).
  42. Schmid, H.; Hülsbergen, K.-J. Analyse betrieblicher Nährstoffströme und das Nitrat-Belastungspotenzial in Wasserschutzgebieten. In 17. Grundwasser-Workshop der Niedersächsischen Wasserwirtschaftsverwaltung; NLWKN: Cloppenburg, Germany, 2012; Available online: https://www.nlwkn.niedersachsen.de/download/70072/Vortrag_Schmid.pdf (accessed on 24 September 2021).
  43. VDLUFA. Vorschlag des AK Nachhaltige Nährstoffhaushalte im VDLUFA zur Novellierung der Düngeverordnung; Positionspapiere, Verband Deutscher Landwirtschaftlicher Untersuchungs-und Forschungsanstalten VDLUFA): Bonn, Germany, 2012; Available online: https://www.vdlufa.de/download/AK_Nachhaltige_Naehrstoffhaushalte.pdf (accessed on 24 September 2021).
  44. Heinitz, F.; Albert, E.; Reinicke, F.; Wagner, B. Analysen des Stickstoff-Managements von Praxisbetrieben in Sachsen auf Grundlage von Nährstoffbilanzierungen. Schriftenr. Sächsische Landesamt Umw. Landwirtsch. Geologie (LfULG) 2010, 25, 1–35. [Google Scholar]
  45. Kolbe, H. Untersuchungen zum Niveau der Humusversorgung in Sachsen. Bilanzierungsmethoden und Versorgungsniveau für Humus; Schriftenr. Landesamt Umw. Landwirtsch. Geologie (LfULG) 2012, 19, 83–103. [Google Scholar]
  46. Hülsbergen, K.-J.; Maidl, F.-X.; Prücklmaier, J. Minderung von Nitratausträgen in Trinkwassereinzugsgebieten durch Optimiertes Stickstoffmanagement am Beispiel der Gemeinde Hohenthann (Niederbayern) mit Intensiver Landwirtschaftlicher Flächennutzung; Forschungsbericht, TU München: Freising-Weihenstephan, Germany, 2017; Available online: https://www.lfu.bayern.de/wasser/gw_gefaehrdung_schutz/gwschutz_landwirtschaft/projekte_hohenthann/doc/tum_bericht_hohenthann.pdf (accessed on 24 September 2021).
  47. Häußermann, U.; Bach, M.; Klement, L.; Breuer, L. Stickstoff-Flächenbilanz für Deutschland mit Regionalgliederung Bundesländer und Kreise–Jahre 1995 bis 2017. Methodik, Ergebnisse und Minderungsmaßnahmen; Texte 131; Umweltbundesamt: Dessau-Roßlau, Germany, 2019; Available online: https://www.umweltbundesamt.de/publikationen/stickstoff-flaechenbilanzen-fuer-deutschland (accessed on 24 September 2021).
  48. Meyer, D.; Grandner, N.; Kolbe, H. Strategien zur Optimierung betrieblicher Kohlenstoff-und Stickstoffkreisläufe von landwirtschaftlichen Anbausystemen in Sachsen. Optim. Von Kohlenst. -Und Stickst.; Schriftenr. Landesamt Umw. Landwirtsch. Geologie (LfULG) 2019, 15, 1–138. Available online: https://publikationen.sachsen.de/bdb/artikel/34764 (accessed on 24 September 2021).
  49. Beisecker, R.; Piegholdt, C.; Seith, T.; Helbing, F. Abschätzung der standortspezifischen Stickstoffnachlieferung zur Optimierung der gewässerschonenden Stickstoffdüngung; Abschlussbericht zum Forschungsvorhaben W1-01-11; DVGW: Bonn, Germany, 2015. [Google Scholar]
  50. Scherer, H.W.; Werner, W.; Kohl, A. Einfluß langjähriger Gülledüngung auf den Nährstoffhaushalt des Bodens. 1. Mitteilung: N-Akkumulation und N-Nachlieferungsvermögen. Z. Pflanzenernähr. Bodenk. 1988, 151, 57–61. [Google Scholar] [CrossRef]
  51. Whalen, J.K.; Chang, C.; Olson, B.M. Nitrogen and phosphorus mineralization potentials of soils receiving repeated annual cattle manure applications. Biol. Fertil. Soils 2001, 34, 334–341. [Google Scholar] [CrossRef]
  52. Diacono, M.; Montemurro, F. Long-term effects of organic amendments on soil fertility. A review. Agron. Sustain. Dev. 2010, 30, 401–422. [Google Scholar] [CrossRef] [Green Version]
  53. De Clercq, T. The Effect of Long-Term Organic Fertilization on the Soil Nitrogen and Carbon Dynamics. Ph.D. Thesis, KU Leuven University, Leuven, Belgium, 2017. Available online: https://limo.libis.be/primo-explore/fulldisplay?docid=LIRIAS1718683&context=L&vid=Lirias&search_scope=Lirias&tab=default_tab&lang=en_US&fromSitemap=1 (accessed on 24 September 2021).
  54. Kolbe, H.; Stephan-Beckmann, S. Development, growth and chemical composition of the potato crop (Solanum tuberosum L.). II. Tuber and whole plant. Potato Res. 1997, 40, 135–153. [Google Scholar] [CrossRef]
  55. Osterholz, W.R.; Rinot, O.; Liebman, M.; Castellano, M.J. Can mineralization of soil organic nitrogen meet maize nitrogen demand? Plant Soil 2017, 415, 73–84. [Google Scholar] [CrossRef] [Green Version]
  56. Gutser, R.; Ebertseder, T. Steuerung der Stickstoffkreisläufe landwirtschaftlicher Betriebe durch effiziente Verwertung der Wirtschaftsdünger. In KTBL-Schrift 408 Neue Wege in der Tierhaltung; Kuratorium f. Technik u. Bauwesen i.d. Landwirtschaft (KTBL): Darmstadt, Germany, 2002; pp. 153–168. [Google Scholar]
  57. Gutser, R.; Ebertseder, T.; Weber, A.; Schraml, M.; Schmidhalter, U. Short-term and residual availability of nitrogen after long-term application of organic fertilizers on arable land. J. Plant Nutr. Soil Sci. 2005, 168, 439–446. [Google Scholar] [CrossRef]
  58. Schröder, J.J.; Jansen, A.G.; Hilhorst, G.J. Long-term nitrogen supply from cattle slurry. Soil Use Manag. 2005, 21, 196–204. [Google Scholar] [CrossRef]
  59. Kolbe, H. Humusumsatz und Nährstoffbilanzen–Ergebnisse und Schlussfolgerungen aus Dauerversuchen Mitteleuropas. In 50 Jahre Dauerversuche L 28 in Methau, Spröda und Bad Salzungen; Thüringer Landesanstalt für Landwirtschaft (TLL), Landesamt für Umwelt, Landwirtschaft und Geologie (LfULG); Landwirtschafts-und Umweltzentrum: Nossen, Germany, 2015; Available online: https://www.landwirtschaft.sachsen.de/download/07_Endfassung_Kolbe_Humus_N-Bilanz_DauerversL28_Nossen15-1.pdf (accessed on 24 September 2021).
  60. Mitscherlich, E.A. Das Gesetz des Minimums und das Gesetz des abnehmenden Bodenertrages. Landwirtsch. Jahrb. 1909, 38, 537–552. [Google Scholar]
  61. Hoffmann, S.; Kismanyoky, T.; Balazs, J. Der Internationale Organische Stickstoffdauerdüngungsversuch (IOSDV) Keszthely nach 12 Versuchsjahren. Arch. Acker. Pfl. Boden. 1997, 41, 123–132. [Google Scholar] [CrossRef]
  62. Asmus, T. Versuch M4 Groß Kreutz–Wirkung organischer und mineralischer Düngung und ihrer Kombination auf Pflanzenertrag und Bodeneigenschaften. In Dauerfeldversuche; Akademie Landwirtschaftswiss. (ADL): Berlin, Germany, 1990; pp. 245–250. [Google Scholar]
  63. Beer, K.; Koriath, H.; Podlesak, W. Organische und Mineralische Düngung; Deutscher Landwirtschaftsverlag: Berlin, Germany, 1990. [Google Scholar]
  64. Hülsbergen, K.-J.; Rauhe, K.; Scharf, H.; Matthies, H. Langjähriger Einfluss kombinierter organisch-mineralischer Düngung auf Ertrag, Humusgehalt und Stickstoffverwertung. Kühn-Arch. 1992, 86, 11–24. [Google Scholar]
  65. Rogasik, J.; Obenauf, S.; Lüttich, M.; Ellerbrock, R. Faktoreinsatz in der Landwirtschaft–ein Beitrag zur Ressourcenschonung (Daten und Analysen aus dem Müncheberger Nährstoffsteigerungsversuch). Arch. Acker Pfl. Boden. 1997, 42, 247–263. [Google Scholar]
  66. Stumpe, H. Organisch-mineralischer Dauerdüngungsversuch (“Feld F”). In Dauerdüngungsversuche für Nachhaltige Landnutzung und Quantifizierung von Stoffkreisläufen; Merbach, W., Körschens, M., Eds.; UFZ-Bericht: Leipzig, Germany, 1999; Volume 24, pp. 13–16. [Google Scholar]
  67. Kolbe, H. Prüfung der VDLUFA-Bilanzierungsmethode für Humus durch langjährige Dauerversuche. Arch. Agron. Soil Sci. 2005, 51, 221–239. [Google Scholar] [CrossRef]
  68. Grunert, M. Der Dauerdüngungsversuch L28–Aufbau, Anlage und Ergebnisse zur Nährstoffeffizienz in Methau und Spröda. In 50 Jahre Dauerversuche L 28 in Methau, Spröda und Bad Salzungen; Thüringer Landesanstalt für Landwirtschaft (TLL), Landesamt für Umwelt, Landwirtschaft und Geologie (LfULG); Landwirtschafts-und Umweltzentrum: Nossen, Germany, 2015; Available online: https://www.landwirtschaft.sachsen.de/download/05_Endfassung_Grunert_L28MeSp_Nossen_Vortrag_2015_12_08_2.pdf (accessed on 24 September 2021).
  69. Zorn, W.; Heß, H.; Albert, E.; Kolbe, H.; Kerschberger, M.; Franke, G. Düngung in Thüringen 2007 nach “Guter fachlicher Praxis”. Schriftenr. Landwirtsch. Landsch. Thüringen 2007, 7, 1–186. Available online: http://www.tll.de/ainfo/pdf/dung0108.pdf (accessed on 24 September 2021).
  70. Tietjen, C. Der ertragswirksame Anteil des Stickstoffs in organischen Düngern. Z. Acker Pflanzenb. 1963, 117, 55–76. [Google Scholar]
  71. Eghball, B.; Wienhold, B.J.; Gilley, J.E.; Eigenberg, R.A. Mineralization of manure nutrients. J. Soil Water Conserv. 2002, 57, 470–473. [Google Scholar]
  72. Baumgärtel, G. Stickstoffsalden minimieren. In Mitteilung der Landwirtschaftskammer Hannover; 1–8, LWK: Hannover, Germany, 2009; pp. 1–8. [Google Scholar]
  73. Gutser, R.; Ebertseder, T.; Weber, A.; Schraml, M.; Schmidhalter, U. Stickstoffeffiziente und umweltschonende organische Düngung. KTBL-Schrift 2010, 483, 31–50. [Google Scholar]
  74. Albert, E. Wirkung einer langjährig differenzierten mineralisch-organischen Düngung auf Ertragsleistung, Humusgehalt, Netto-N-Mineralisierung und N-Bilanz. Arch. Agron. Soil Sci. 2001, 46, 187–213. [Google Scholar] [CrossRef]
  75. Zorn, W.; Schröter, H. Effizienter Einsatz von Gärresten im Pflanzenbau. In Beitrag zur Düngungstagung, Groitzsch; Thüringer Landesanstalt für Landwirtschaft, Referat Ackerbau und Düngung: Jena, Germany, 2012; Available online: https://www.gartenbau.sachsen.de/download/03_20120224_Zorn_Schroeter_Duengungstagung2012.pdf (accessed on 24 September 2021).
  76. Klages, S. Effizient Düngen; Anwendungsbeispiele zur Düngeverordnung; Bundesanstalt f. Landwirtschaft u. Ernährung (BLE): Bonn, Germany, 2018; pp. 1–68. Available online: https://www.ble-medienservice.de/1770/effizient-duengen-anwendungsbeispiele-zur-duengeverordnung (accessed on 24 September 2021).
  77. Kolbe, H.; Beckmann, U. Einfluss extrem unterschiedlich hoher mineralischer und organischer Düngung und Beregnung auf Ertragsleistung der Kulturarten, Bodenfruchtbarkeit und Umweltverträglichkeit eines Sandbodens. Umw. Und Extensivierung; Schriftenr. Sächsische Landesanst. Landwirtsch. (LfL) 2003, 6, 1–41. Available online: https://publikationen.sachsen.de/bdb/artikel/14035 (accessed on 24 September 2021).
  78. Taube, F. Expertise zur Bewertung des neuen Düngerechts (DüG, DüV, StoffBilV) von 2017 in Deutschland im Hinblick auf den Gewässerschutz; Grünland u. Futterbau, Ökologischer Landbau, Universität: Kiel, Germany, 2018; pp. 1–25. Available online: https://www.bdew.de/media/documents/Expertise_Bewertung_D%C3%BCG_D%C3%BCV_StoffBilV_Taube_11.06.2018_oeffentlich.pdf (accessed on 24 September 2021).
  79. Reinhardt, M. Zur Bewertung der novellierten Düngeverordnung im Lichte des Urteils des Europäischen Gerichtshofs vom 21. Juni 2018 (C-543/16) über die Umsetzung der Nitratrichtlinie 91/676/EWG; Institut für Deutsches und Europäisches Wasserwirtschaftsrecht der Universität: Trier, Germany, 2019; pp. 1–28. Available online: https://guelleverschmutzung-stoppen.de/wp-content/uploads/2019/05/Rechtsgutachten_Uni_Trier_NitratRL_2019.pdf (accessed on 24 September 2021).
  80. Stadelmann, F.X.; Furrer, O.J.; Gupta, S.K.; Lischer, P. Einfluß von Bodeneigenschaften, Bodennutzung und Bodentemperatur auf die N-Mobilisierung von Kulturböden. Z. Pflanzenernähr. Bodenk. 1983, 146, 228–242. [Google Scholar] [CrossRef]
  81. Stahr, K.; Rück, F.; Lorenz, G. Vorhersage der Stickstoffmineralisierung in Böden Baden-Württembergs. Freiberger Bodenkundliche Abhandlungen 1992, 30, 103–130. [Google Scholar]
  82. Kandeler, E. Bestimmung der N-Mineralisation im anaeroben Brutversuch. In Bodenbiologische Arbeitsmethoden; Schinner, F., Öhlinger, R., Kandeler, E., Margesin, R., Eds.; Springer: Berlin/Heidelberg, Germany, 1993; pp. 129–131. [Google Scholar]
  83. Jarvis, S.C.; Stockdale, E.A.; Shepherd, M.A.; Powlson, D.S. Nitrogen mineralization in temperate agricultural soils: Processes and measurement. Adv. Agron. 1996, 57, 187–235. [Google Scholar]
  84. Del Pino Machado, A.S. Estimating Nitrogen Mineralization Potential of Soils and the Effect of Water and Temperature and Crop Residues on Nitrogen Net Mineralization; Cuvillier Verlag: Göttingen, Germany, 2005. [Google Scholar]
  85. Appel, T.; Beisecker, B. Abschätzung des mineralisierbaren Stickstoffs in ackerbaulich genutzten Böden mithilfe von Kenngrößen. VDLUFA-Schriftenr. 2015, 71, 358–365. [Google Scholar]
  86. Ebertseder, F.; Homeier, E.; Lohr, D.; Fischer-Kaiser, K.; Henkelmann, G.; Haas, C.; von Tucher, S.; Heuwinkel, H. Prüfung alternativer Labormethoden mit dem Ziel der Bewertung der N-Düngewirkung organischer Dünger. VDLUFA-Schriftenr. 2015, 71, 228–237. [Google Scholar]
  87. Geisseler, D.; Miller, K.S.; Aegerter, B.J.; Clark, N.E.; Miyao, E.M. Estimation of annual soil nitrogen mineralization rates using an organic-nitrogen budget approach. Soil Sci. Soc. Am. J. 2019, 83, 1227–1235. [Google Scholar] [CrossRef]
  88. Dittert, K. Nährstoffbedarf und Nährstoffversorgung von Pflanzen–Kriterien und Herausforderungen. VDLUFA-Schriftenr. 2014, 70, 32–39. [Google Scholar]
  89. Maidl, F.-X.; Spicker, A.; Hülsbergen, K.-J. Mit Sensoren die Bestände besser führen? Neue Tech. Im Ackerbau; Schriftenr. Bayer. Landesanst. Landwirtsch. (LfL) 2014, 7, 65–74. Available online: https://www.lfl.bayern.de/mam/cms07/publikationen/daten/schriftenreihe/neue-techniken-ackerbau_ilt-jahrestagung-2014_lfl-schriftenreihe-7-2014.pdf.pdf (accessed on 24 September 2021).
  90. Schmidhalter, U. Sensorgestützte Ermittlung des Nährstoffbedarfs. VDLUFA-Schriftenr. 2014, 70, 58–66. [Google Scholar]
  91. Westermeier, M.; Maidl, F.-X. Vergleich von Spektralindizes zur Erfassung der Stickstoffaufnahme bei Winterweizen (Triticum aestivum L.). J. Kulturpfl. 2019, 71, 238–248. [Google Scholar]
  92. Engel, T.; Klöcking, B.; Priesack, E.; Schaaf, T. Simulationsmodelle zur Stickstoffdynamik. Analyse und Vergleich. Agrarinformatik 1993, 25, 1–484. [Google Scholar]
  93. Hege, U.; Maidl, F.-X.; Dennert, J.; Liebler, J.; Offenberger, K. Düngestrategien für Stickstoff zu Winterweizen: Ein Vergleich von Simulationsmodellen und Düngeberatungssystemen. Pflanzenbauwiss 2002, 6, 25–35. [Google Scholar]
  94. Kersebaum, K.C. Modelling nitrogen dynamics in soil-crop systems with HERMES. Nutr. Cycl. Agroecosys. 2007, 77, 39–52. [Google Scholar] [CrossRef]
  95. Heumann, S.; Ringe, H.; Böttcher, J. Field-specific simulations of net N mineralization based on digitally available soil and weather data. I. Temperature and soil water dependency of the rate coefficients. Nutr. Cycl. Agroecosys. 2011, 91, 219–324. [Google Scholar] [CrossRef]
  96. Heumann, S. Net N Mineralization in Agricultural Soils–Experimentally Parameterized Modelling for N Fertilizer Recommendations and Inhibition Effects in Soils With Specific Former Land-Use. Habilitation Thesis, Hannover University, Hannover, Germany, 2016. Available online: https://www.repo.uni-hannover.de/bitstream/handle/123456789/4481/Habilschrift_Heumann.pdf?sequence=3&isAllowed=y (accessed on 24 September 2021).
  97. Yin, X.; Kersebaum, K.-C.; Beaudoin, N.; Constantin, J.; Chen, F.; Louarn, G.; Manevski, K.; Hoffmann, M.; Kollas, C.; Armas-Herrera, C.M.; et al. Uncertainties in simulating N uptake, net N mineralization, soil mineral N and N leaching in European crop rotations using process-based models. Field Crops Res. 2020, 255, 107863. [Google Scholar] [CrossRef]
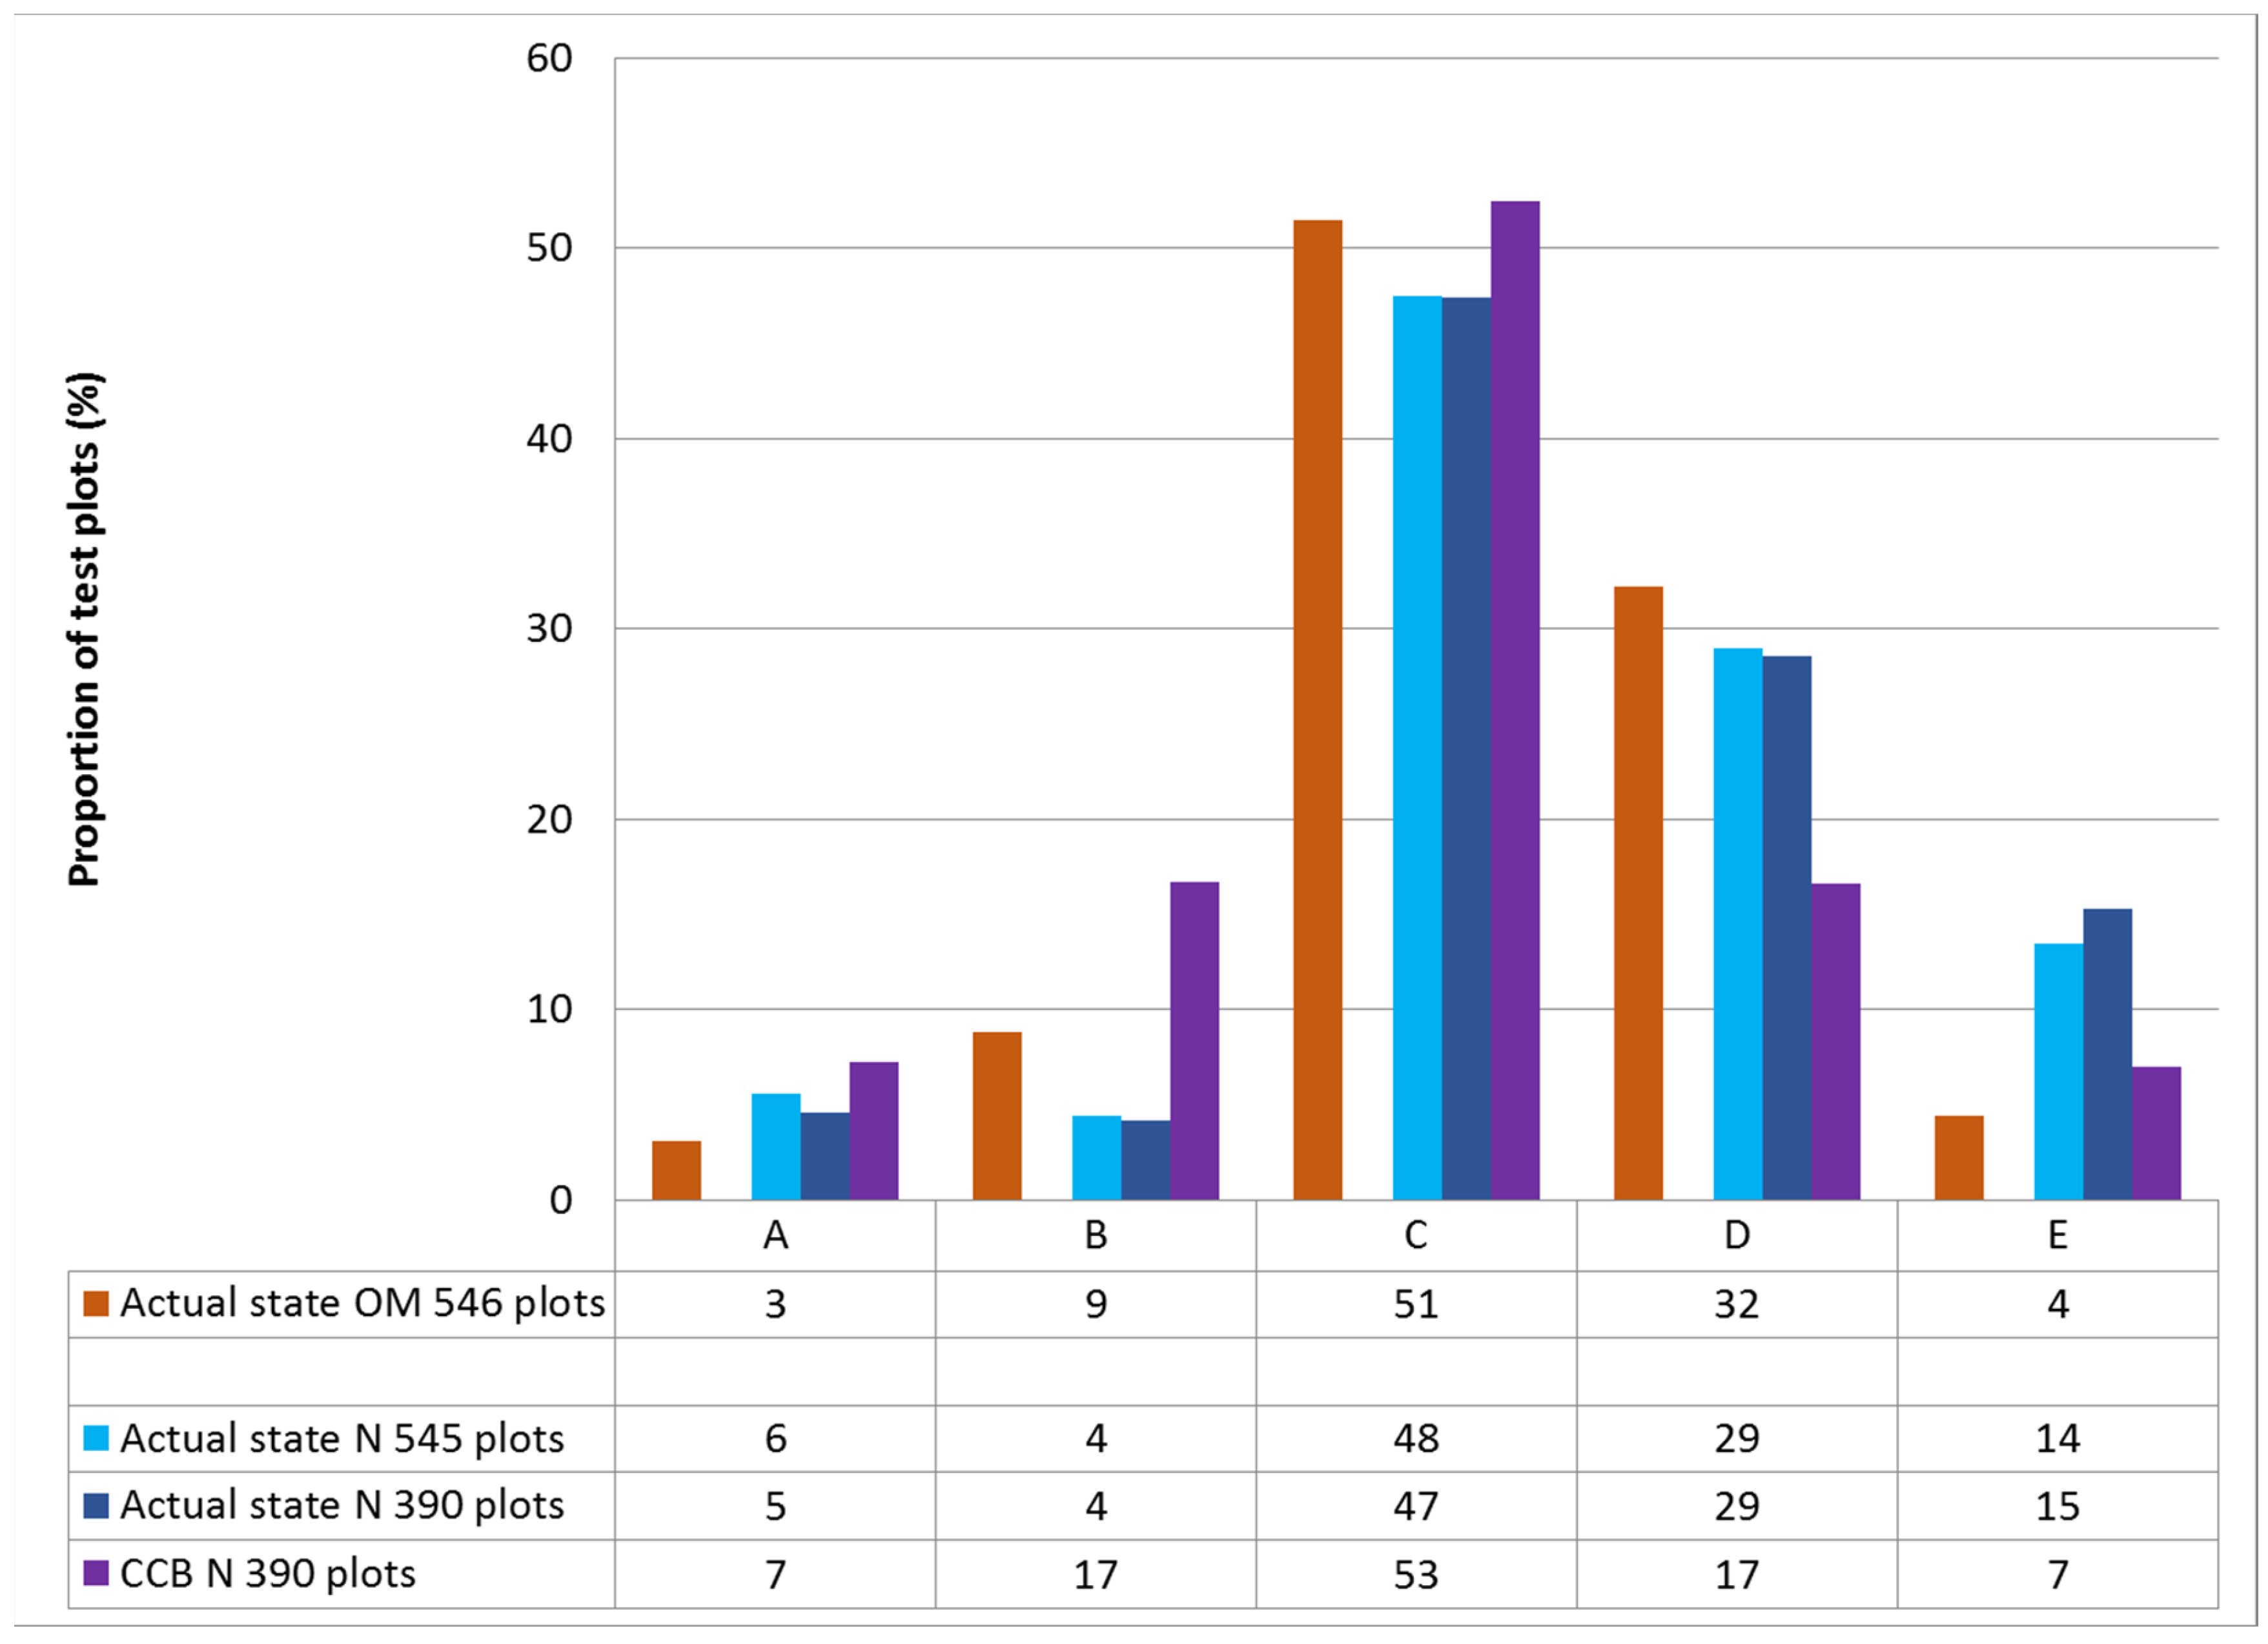
Figure 1. Comparison of the N delivery or mineralization between the BEFU and CCB programs after a temporarily increasing slurry use, calculated over 10-year periods for a cereal crop rotation with 30% winter rape, the by-product straw remains on the field.
Agronomy 11 02492 g001
Figure 2. Comparison of the NFR by the BEFU program with conventional consideration of the N delivery and with the N mineralization determined by the CCB program (*** means p < 0.001).
Agronomy 11 02492 g002
Figure 3. Effect of the average organic N supply of the long-term TP on the difference between the NFR using the CCB program and the actual applied N mineral fertilizer application of winter wheat (orange) and winter rape (green) (*** means p < 0.001).
Agronomy 11 02492 g003
Figure 4. OM and N balance classes for describing the actual state and after taking into account the CCB N mineralization and corrected mineral N fertilization of the TP (total = 546 plots, on 390 plots (71%) NFR were performed).
Agronomy 11 02492 g004
Figure 5. Intensity and standard deviation of N fertilization with organic and mineral N fertilizers in the N balance classes for the determined gross N balances.
Agronomy 11 02492 g005
Table 1. Evaluation of OM balances according to VDLUFA.
OM Balance (HEQ ha−1 a−1)GroupEvaluation
<−200AUnfavorable effects on soil functions and yield
−200 to −76 BTolerable in the medium term, especially on soils enriched with OM
−75 to 100 COptimal in terms of yield security with low risk of loss, long-term fixation of site-specific OM contents
101 to 300 DTolerable in the medium term, especially on soils impoverished with OM
>300 ENot tolerable in the long term, increased risk of N loss, low N efficiency
HEQ = Humus equivalents.
Table 2. Evaluation of the (gross) N balances.
N Balance (kg N ha−1 a−1)GroupEvaluation
<−30AUndersupply, increased yield risk
−29 to −1 BShort-term tolerable, especially after crops with low-N stand and root residues
0 to 49 COptimal in terms of yield security with low risk of N losses
50 to 80 DShort-term tolerable, especially after crops with N-rich stand and root residues
>80 EIncreased risk of N losses, low N efficiency
Table 3. Calculated mean values and standard deviation of characteristics for determining NFR with the BEFU program and using the N mineralization determined with the CCB model in comparison with the actual N mineral fertilizer use for various crop species in the long-term TP network.
Column:12345678910
Crop SpeciesN Base ValueNmin Value (Spring)BEFU N Supply Organic FertilizationBEFU N Delivery SoilBEFU Calculated NFR CCB N Mineralization (Nm)BEFU, CCB Calculated NFRPractice NFR (Actual Use)Correlation BEFU Requirement/UseCorrelation CCB Requirement/Use
(n = Cultivation Years)(kg ha−1)(kg ha−1)(kg ha−1)(kg ha−1)(kg ha−1)(kg ha−1)(kg ha−1)(kg ha−1)(r)(r)
winter wheat (n = 841)21052 (±28)3 (±25)6 (±5)150 (±28)30 (±56)128 (±64)147 (±44)0.174 (p < 0.001) 0.302 (p < 0.001)
winter barley (n = 565)18040 (±19)3 (±6)1 (±3)137 (±20)55 (±61)58 (±64)116 (±38)0.093 (p < 0.05)0.243 (p < 0.001)
triticale (n = 212)19039 (±21)7 (±14)7 (±14)144 (±26)102 (±82)49 (±86)88 (±40)0.140 (p < 0.05)0.188 (p < 0.01)
winter rape (n = 668)200 38 (±26)9 (±9)19 (±3)135 (±29)108 (±68)54 (±73)153 (±39)0.0340.281 (p < 0.001)
sugar beet (n = 88)17064 (±29)24 (±24)36 (±3)57 (±32)88 (±48)19 (±61)67 (±30)0.376 (p < 0.01)0.227 (p < 0.05)
grain maize (n = 50)20060 (±45)44 (±52)26 (±5)71 (±74)52 (±103)87 (±119)74 (±50)0.646 (p < 0.001)0.593 (p < 0.001)
MW (n = 2424)-45 17 (column 3 + 4)1376680132--
Table 4. Calculated mean values and standard deviation of characteristics for determining the NFR using CCB N mineralization in comparison with the actual N mineral fertilizer use on long-term TP with winter wheat and winter rape with and without organic fertilization.
Crop SpeciesN Base ValueNmin Value (Spring)N Mineralization (Nm, CCB)NFR (Calculated)NFR (Actual Use)Correlation Requirement/Use
(n = Cultivation Years)(kg ha−1)(kg ha−1)(kg ha−1)(kg ha−1)(kg ha−1)(r)
Test Plots Without Organic Fertilization (Stockless)
winter wheat (n = 702)21051 (±28)20 (±56)139 (±57)150 (±43)0.241 (p < 0.001)
winter rape (n = 297)20035 (±25)67 (±61)98 (±55)131 (±39)0.268 (p < 0.001)
Test plots with organic fertilization (livestock)
winter wheat (n = 139)21058 (±28)81 (±64)71 (±68)133 (±46)0.316 (p < 0.001)
winter rape (n = 371)20041 (±25)140 (±65)19 (±67)146 (±37)0.187 (p < 0.001)
Publisher’s Note: MDPI stays neutral with regard to jurisdictional claims in published maps and institutional affiliations.

