Article

Modeling of Flowering Time in Vigna radiata with Approximate Bayesian Computation

1
Mathematical Biology and Bioinformatics Lab, Institute of Physics and Mechanics, Peter the Great St. Petersburg Polytechnic University, 195251 St. Petersburg, Russia
2
Institute of Ecology and Evolutionary Biology, National Taiwan University, Taipei 10617, Taiwan
3
Department of Life Science, National Taiwan University, Taipei 10617, Taiwan
4
World Vegetable Center, Tainan 74151, Taiwan
5
Department of Plant and Soil Science, Gund Institute for the Environment, University of Vermont, Burlington, VT 05405, USA
6
Program Molecular and Computation Biology, University of California, Los Angeles, CA 90095, USA
*
Author to whom correspondence should be addressed.
Agronomy 2021, 11(11), 2317; https://doi.org/10.3390/agronomy11112317
Submission received: 22 September 2021 / Revised: 4 November 2021 / Accepted: 10 November 2021 / Published: 16 November 2021
(This article belongs to the Special Issue Improvement of Crops: Current Status and Future Prospects)

Abstract

:
Flowering time is an important target for breeders in developing new varieties adapted to changing conditions. A new approach is proposed that uses Approximate Bayesian Computation with Differential Evolution to construct a pool of models for flowering time. The functions for daily progression of the plant from planting to flowering are obtained in analytic form and depend on daily values of climatic factors and genetic information. The resulting pool of models demonstrated high accuracy on the dataset. Day length, solar radiation and temperature had a large impact on the model accuracy, while the impact of precipitation was comparatively small and the impact of maximal temperature has the maximal variation. The model pool was used to investigate the behavior of accessions from the dataset in case of temperature increase by 0.05 6.00 ° . The time to flowering changed differently for different accessions. The Pearson correlation coefficient between the SNP value and the change in time to flowering revealed weak but significant association of SNP7 with behavior of the accessions in warming climate conditions. The same SNP was found to have a considerable influence on model prediction with a permutation test. Our approach can help breeding programs harness genotypic and phenotypic diversity to more effectively produce varieties with a desired flowering time.

1. Introduction

Among the cultivated species in the legume family, mungbean (Vigna radiata (L.) Wilczek), also known as green gram), a short duration crop, is sometimes considered as a “minor’’ crop, due to limited breeding efforts and restricted planting area that is much less than the range of suitable soil and climatic conditions [1]. Noteworthy, it has become an increasingly important crop across Asia and beyond, showing a steady rise in global production (FAO 2018). Mungbean may provide additional income to farmers as a rotation crop and it adds nitrogen to the soil. It is a valuable source of protein and essential micronutrients such as folate and iron. With few secondary metabolites that generate a beany taste [2], it works well as a plant-based protein. Mungbean is a well-suited model organism among legume plants due to its relatively small genome size, short life-cycle, self-pollination, and close genetic relationship to other important legume crops.
Genebanks, such as the World Vegetable Center (Taiwan), the National Bureau of Plant Genetic Resources (India), the Institute of Crop Germplasm Resources (China), the Plant Genetic Resources Conservation Unit (USA), the genebank of the Commonwealth Scientific and Industrial Research Organization (Australia), and Plant Genetic Resources Program (Pakistan), hold biodiverse collections of mungbean. In Russia, the N.I. Vavilov All-Russian Institute of Plant Genetic Resources contains 1478 accessions of V. radiata and 230 of V. mungo [3,4]. To characterize the biodiversity of mungbean for utilization in breeding programs different core collections were organized [5].
Studies revealed that high yielding mungbean varieties are characterized by larger leaf area, higher total dry mass production ability, superior crop growth rate at all growth stages, and high relative growth rate and net assimilation rate at vegetative stage [6]. The importance of genotype-by-environment (G × E) interactions for phenotypes including time to flowering and maturity was shown in international trials [7]. It was also demonstrated that time to flowering in mungbean is subject to both genetic [8], and environmental control [9]. Promising genotypes need to be evaluated in multiple environments over several years [10].
Though the use of marker-assisted selection is widening in all major crops due to the establishment of marker-trait associations for important agronomic traits [11] the progress in this area in mungbean breeding programs has been limited [12]. Several studies have been carried out for identification of molecular markers and linkage maps for mugbean based on the reference genome of the cultivated mungbean (V. radiata var. radiata VC1973A) released recently [13]. Together with the de novo sequencing of a wild relative mungbean (V. radiata var. sublobata) this established a basis for genome-wide association and functional studies for identification of markers associated with important agronomic traits [4,13,14].
The design of genome-wide association studies (GWAS) may become expensive and cumbersome, particularly in multi-enviromental set-ups and thus GWAS can be complemented by crop models that account for genotype-by-environment interactions.
Various mathematical techniques are used for crop modeling from linear regression to artificial neural networks [15]. Crop models that utilize the information on molecular markers can be critically important tools [16]. The effect of weather conditions on the daily rate of progression to the next phenological phase is quantitatively characterized using concepts like Heat Unit Index (HUI) [17], Crop Heat Units (CHI), hydrothermal degrees (DHD) [18], Degree Days (DD), or Biological Days (BD) [19]. Both DD and BD could depend on temperature, water content and photoperiod. DSSAT [16,20,21,22,23] was used to simulate growth and yield in soybean [24] and chickpea [25] among several other crops [26,27,28,29]. The models of this type have been developed for different species of cultivated Vigna, including mungbean. The AquaCrop model was used to investigate the important oil seed crop bambara groundnut (Vigna subterranea) [30]. The preliminary results confirmed the potential of this crop to be cultivated in marginal agricultural production areas. Characterization of growing environments provided by APSIM model can be used to minimize interactions to match target production environment that was applied to studies of sorghum [31]. The validation of obtained results was needed to assist breeding programs [32].
However, crop process-based models developed before the spread of genomic technologies used a simplified set of “genetic coefficients” that do not correspond to actual genes to simulate the genotype impact [33]. The performance of well-characterized genotype in a well-characterized environment can be evaluated by a validated mathematical model that takes climatic and genetic factors as input and output the prediction of agronomic traits [34,35]. As a consequence of increased greenhouse gas emissions the global climate is changing and impacts agriculture with increasing strength [36]. Prediction of the effects of global warming on local agricultural practices therefore has very high importance [37], and crop models can be used to investigate the climate change impacts on crop performance [38,39].
In this work, we built a new dynamical model for time to flowering in 1596 accessions of Vigna radiata phenotyped during six field trials in different years and locations. Developing on our previous studies for chickpea [40,41,42] and mungbean [43], a new approach was proposed that uses Approximate Bayesian Computation with Differential Evolution [44,45] to construct a pool of models for time to flowering. The models in the pool use daily values of climatic factors and GWAS results for genetic information and genotype-by-environment interactions to model a daily progression rate from sowing to flowering.
The pool of models is used to investigate the impacts of different factors on the predicted time to flowering. Further, the performance of accessions in the available dataset was simulated in climate warming conditions using the daily temperature increased on 0.05 6.00 ° . The association of variation of time to flowering and genotype information was analyzed using Pearson correlation coefficient.

2. Materials and Methods

2.1. The Overview

The methodology proposed in this work consists of construction of pool of models with low training and validation scores using Approximate Bayesian Computation, investigation of impacts of different factors to the model using permutation test, forecast of time to flowering using generated daily weather with increased minimal temperature (see Figure 1).
These steps are further described below.

2.2. Plant Material

The mungbean accessions from a WorldVeg collection described in [5] were phenotyped during several field experiments (see Table 1). Details on the phenotyping experiment and its subsequent analysis will be presented in a future manuscript (Sokolkova et al. in preparation).
The time to flowering for this dataset ranges from 31 to 249 (see Figure 2). To build the simulation model for time to flowering we used 1438 accessions for cross-validation and 158 for control (see Figure 1).
The phenotypic effect of a gene is most often described by an average difference between different genotypes, but a gene can further influence the phenotype, causing differences in variance between genotypes. To investigate this opportunity the variance-heterogeneity GWAS (vGwas) has been proposed [46]. The vGWAS approach facilitates the identification of loci that are involved in the genetic control of environmental variability.
The vGWAS uses a Brown–Forsythe (similar to Levene’s test), statistical test for equality of group variances based on an ANOVA of the absolute deviation from the median to identify SNPs that control phenotypic variance. This test is resistant to deviations from the normal phenotypic distribution in GWAS.
The SNP from indels were excluded together with those with gaps in at least one sample and the number of variants greater than two. The minimum frequency of the alternative allele was set to 15%. Using vGWAS approach, 15 SNP were selected (see Table 2) associated with flowering time at a significance level of 0.05 [46].

2.3. Climate Data

The data on daily values of climatic factors:
  • a day length D,
  • a minimal temperature T n ,
  • a maximal temperature T x ,
  • a precipitation R,
  • for field experiments were taken from a publicly available website https://rp5.ru/Weather_in_the_world (accessed on 26 January 2020) that provides historical weather archives for 172,500 locations, reported by weather stations. The data on solar radiation S were obtained from the NASA Langley Research Center (LaRC) POWER Project funded through the NASA Earth Science/Applied Science Program [47].

2.4. Prediction of Time to Flowering with a Pool of Models

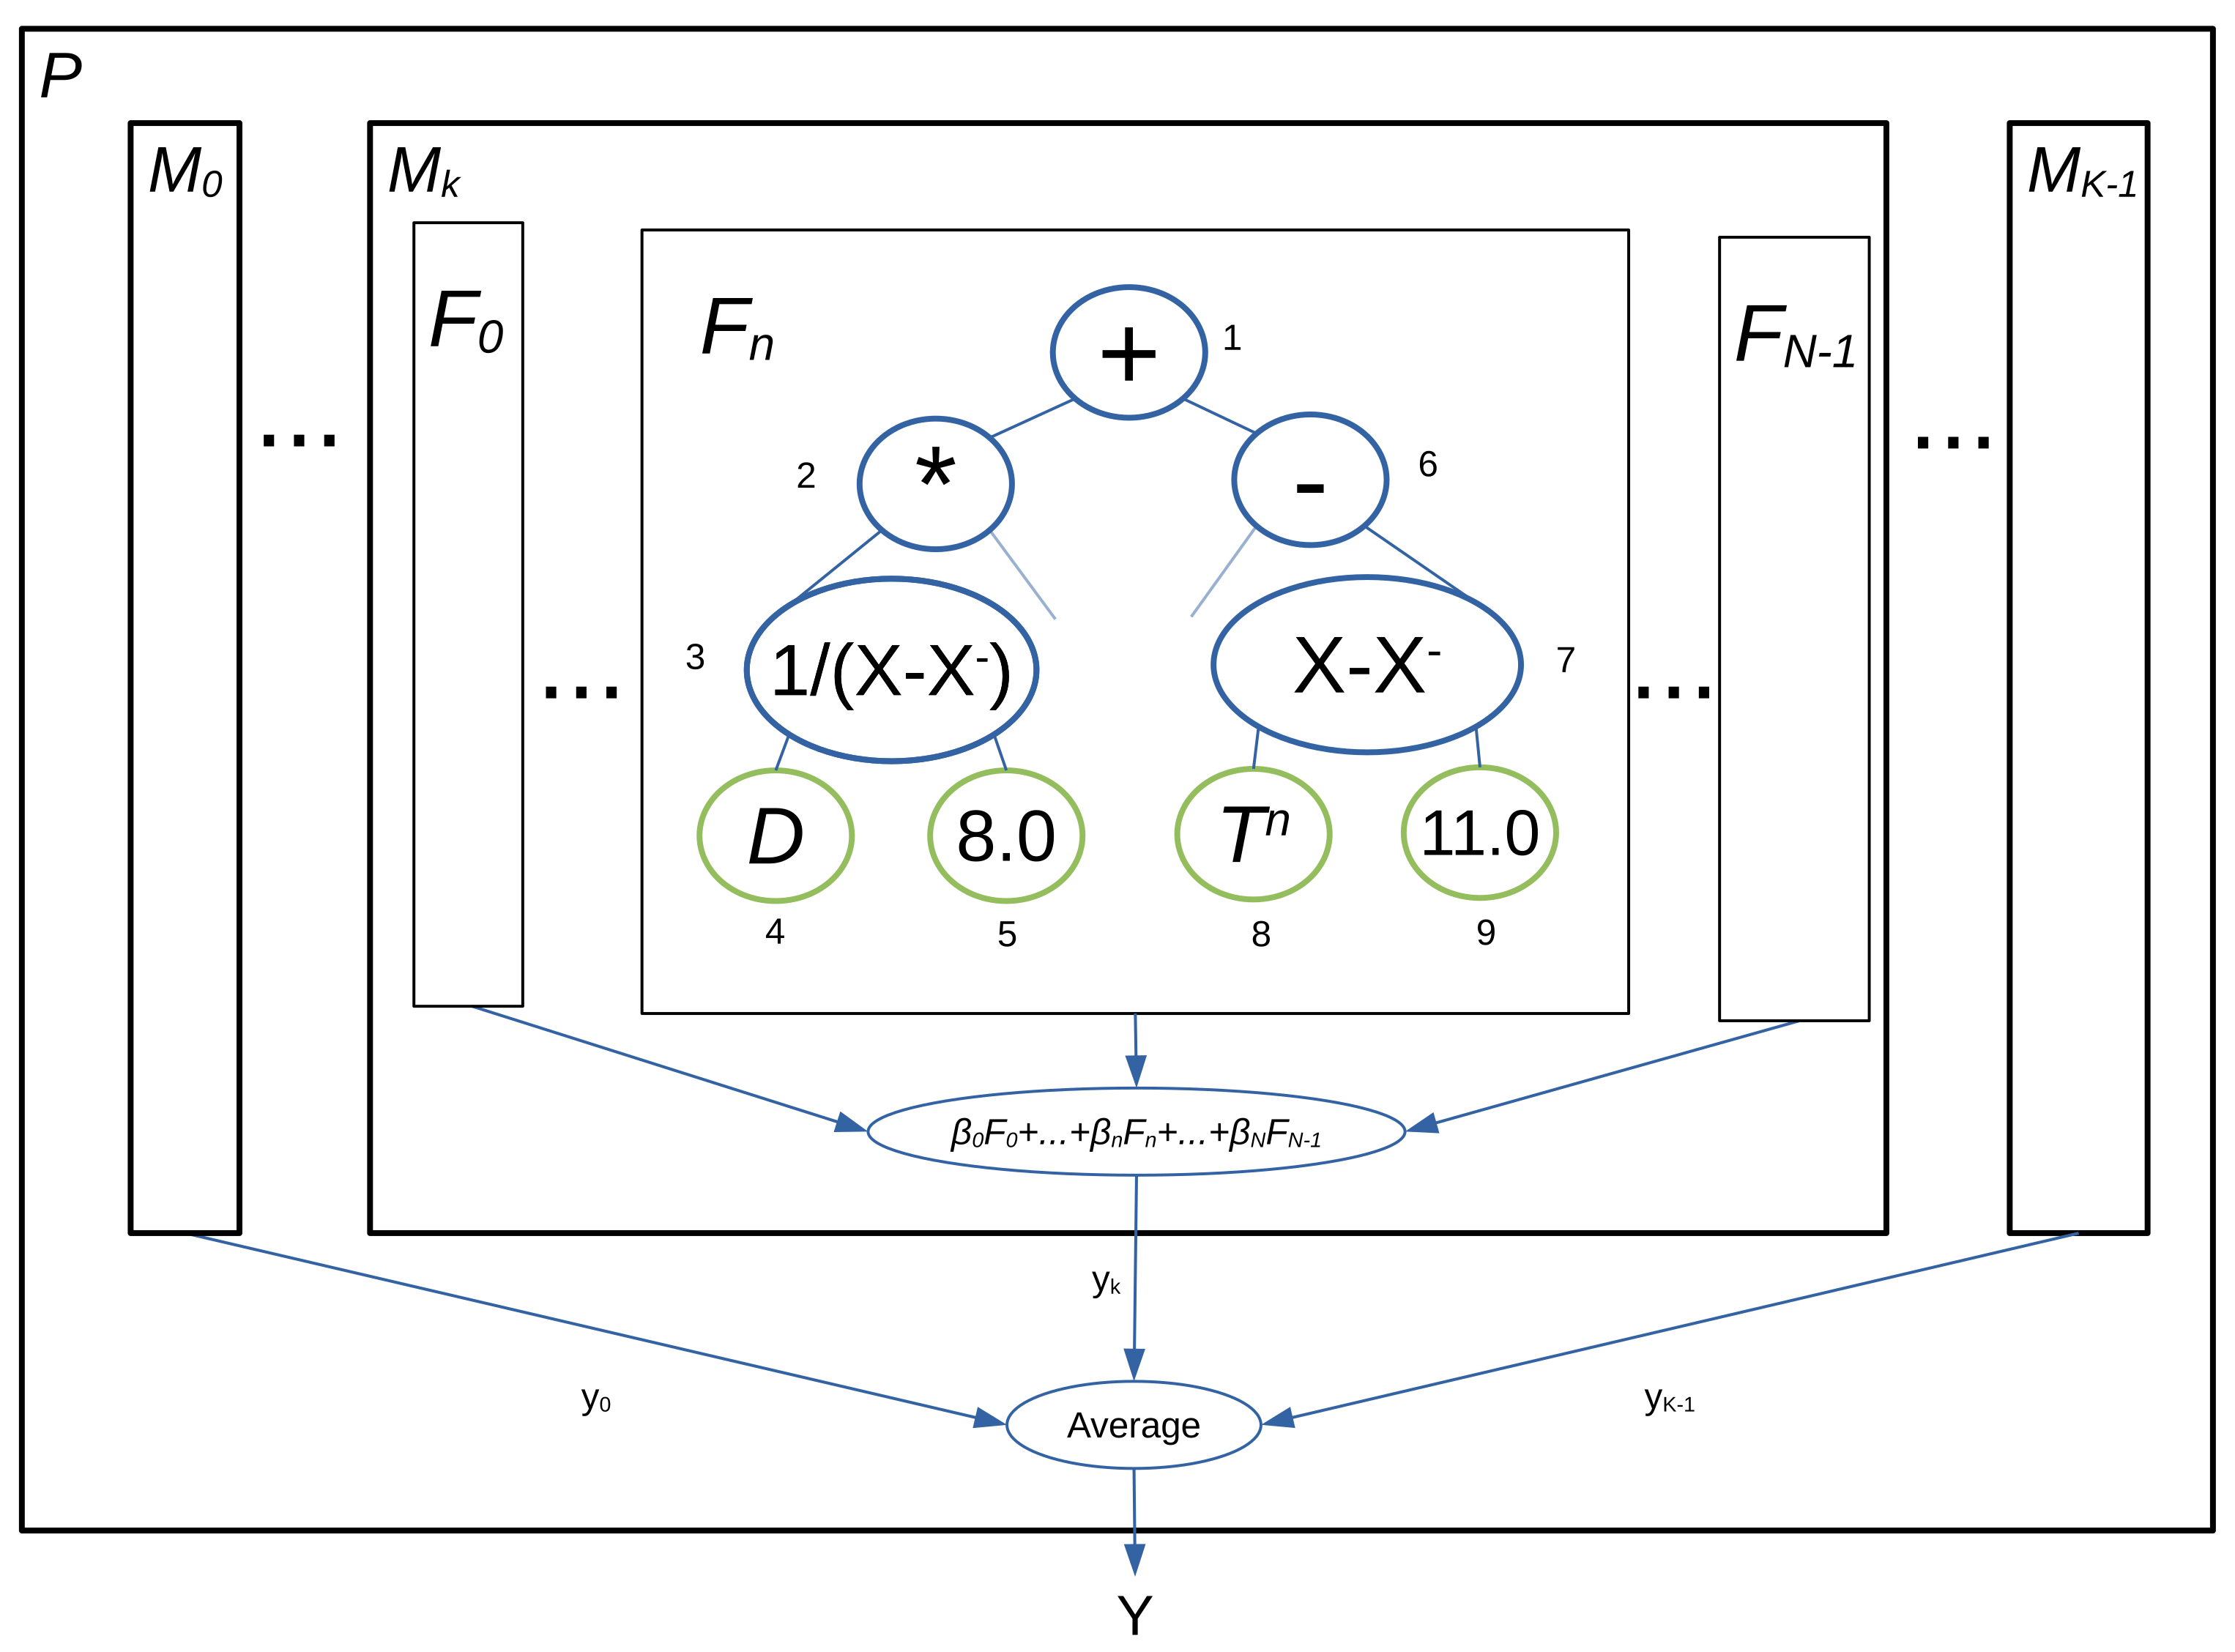
Let’s denote a pool P = { M k , k = 0 , , K 1 } of individual models M k and a function Y ( M , i ) that predict time to flowering given a model and an information on a sample i as its arguments. Then, the predicted time to flowering y i of sample i is calculated as (1).
y i = 1 K k = 0 K 1 Y ( M k , i )
Information on a sample includes the data on climatic factors and genotype.
Let’s denote for the model M k the fitness threshold that the plant needs to reach to be able to flower as U k and the plant’s fitness to start flowering at day t as u k ( i , t ) . Then, Y ( M k , i ) is defined as (2).
Y ( M k , i ) = t : u k ( i , t ) U k & u k ( i , t 1 ) < U k
The plant’s fitness to start flowering u k ( i , t ) increases at each day by the value v ( i , t ) that is calculated as a linear combination of N control functions F n with coefficients β n (3).
v ( i , t ) = n = 0 N 1 β n + j = 0 J 1 β n J + j + N G ( i , j ) F n ( X ( t ) )
where β n , n = 0 , , J N + N 1 are coefficients, F n , n = 0 , , N 1 are non-linear control functions and vector X ( t ) = ( D ( t ) , T n ( t ) , T x ( t ) , R ( t ) , S ( t ) ) combines climatic factors, matrix G ( i , j ) contains information on SNP j for sample i.
Control function can be represented as a tree with elementary functions in the nodes and climatic factors in its leaves (see Figure 3). The list of elementary functions includes arithmetic operations: ‘+’, ‘−’, ‘*’, ‘/’, and expressions: X, ( X X b , ) , 1 / ( X X b , ) , ( X b , + X ) , 1 / ( X b , + X ) , where X is a name of a climatic factor and X b , ± is a constant base value of this factor. These constants are specific to factors, so there are T x b , ± base maximal and T n b , ± minimal temperature, R b , ± precipitation, D b , ± day length and S b , ± solar radiation. The tree is encoded using Grammatical Evolution (GE) [48,49] as a vector of length L of integer valued codons using breadth-first search (BFS).

2.5. Approximate Bayesian Computation

The model M is characterized by parameters that include coefficients β n , n = 0 , , J N + N 1 together with fitness threshold U, the minimal coefficient value β m i n , L GE codons (integer numbers) and constants T x b , ± , T n b , ± , R b , ± , D b , ± and S b , ± . Parameters are to be found that minimize the deviation of the model output from data defined by Formula (4):
Q ( M , I , α , λ ) = i I ( τ i Y ( M , i ) ) 2 + λ n = 0 J N + N 1 | β n | + α n = 0 J N + N 1 β n 2 ,
where α and λ are regularization coefficients, τ i is a number of days from planting to flowering measured experimentally. Thus, in addition to parameters, the model M is characterized by hyperparameters: the number of control functions N and the number of codons L and regularization coefficients α and λ .
The Approximate Bayesian Computation (ABC) algorithm proposed in [45], in combination with Differential Evolution Entirely Parallel (DEEP) method [50,51], was adapted for construction of a new model. Using a prior distribution for hyperparameters ( N , L , α , λ ) and a measure of discrepancy between model solution and data Q Equation (4), ABC allows us to construct a chain of hyperparameter values sampled from their posterior distribution.
The algorithm operates on a set B of parameter vectors θ j = ( N , L , α , λ ) . Hyperparameters are initialized from the prior distribution and updated on each iteration using a recombination rule Equation (5).
θ * = θ j + W 1 ( θ m θ n ) + W 2 ( θ b θ j ) + ε ,
where W 1 , 2 are weight coefficients sampled from normal distribution, m , n are indices of members from B, b is an index of the best vector, and ε is a vector of small normally distributed numbers. Hyperparameters are accepted or rejected using a probabilistic criterion that compares chances of new hyperparameters to be sampled from the posterior with a random number.
Optimization procedures include cross-validation to avoid overfitting. The 10% of samples from the available dataset are saved as a control set and are excluded from optimization. The remaining cross-validation set of samples is split on each iteration into training I t r a i n i n g and test I t e s t samples containing 80% and 20% of samples counting from cross-validation set. For each set of hyperparameters produced by ABC, a model M * is obtained using DEEP method that minimizes Q Equation (4) on a training set, and Q t r a i n i n g = Q ( M , I t r a i n i n g , 0 , 0 ) and Q t e s t = Q ( M , I t e s t , 0 , 0 ) are then calculated on a training and test set, respectively. The algorithm is run during the predefined number of iterations G.

2.6. Construction of the Pool of Models

The output of the algorithm consists of three sequences: models M g , g = 0 , , G 1 , training Q g t r a i n i n g , g = 0 , , G 1 and test Q g t e s t , g = 0 , , G 1 scores, respectively. We apply a transform Q = Q / dim ( I ) to make training and test scores comparable, where dim ( I ) is the number of samples in corresponding set.
As with all similar inference methods, the members of these sequences represent posterior distribution only after some burn-in iterations. To determine the index starting from which models are considered to be acceptable we compared the sequences of Q g t r a i n i n g and Q g t e s t , g = C , , G 1 with Mann–Whitney criterion for a series of C = 10 , 20 , 30 , , G 11 . The minimal C for which p-value of test is greater than 0.05 defines a subsequence of models that passes a cross-validation test that means that the scores on training and test sets are indistinguishable. This subsequence of models contains candidates for the desired pool.
To further restrict the pool size, only those models are included for which the median absolute difference in days between measured time to flowering and model prediction is less than predefined threshold.

2.7. Estimation of Impacts of Climatic Factors and Genotype Information to the Model

A permutation test was performed to analyze the contribution of climatic factors T x , T n , P, S, D and SNP values to time to flowering. The essence of the method is to rearrange the data of the factor of interest between dates or samples and record the change in the error. The impact of the climatic factor is then an average error increase over all permutations.

2.8. Simulation of Climate Warming

To explore the impact of climate warming, we simulated development of accessions with our model increasing the minimal temperature on 0.00, 0.05, 0.10, 0.25, 0.50, 0.75, 1.00, 1.05, 1.25, 1.50, 1.75, 2.00, 2.25, 2.50, 3.00, 3.05, 3.10, 3.25, 3.50, 3.75, 4.00, 4.05, 4.25, 4.50, 4.75, 5.00, 5.25, 5.50, and 6.00 ° . Other factors were left unchanged.

3. Results

3.1. A Pool of Models for Time to Flowering

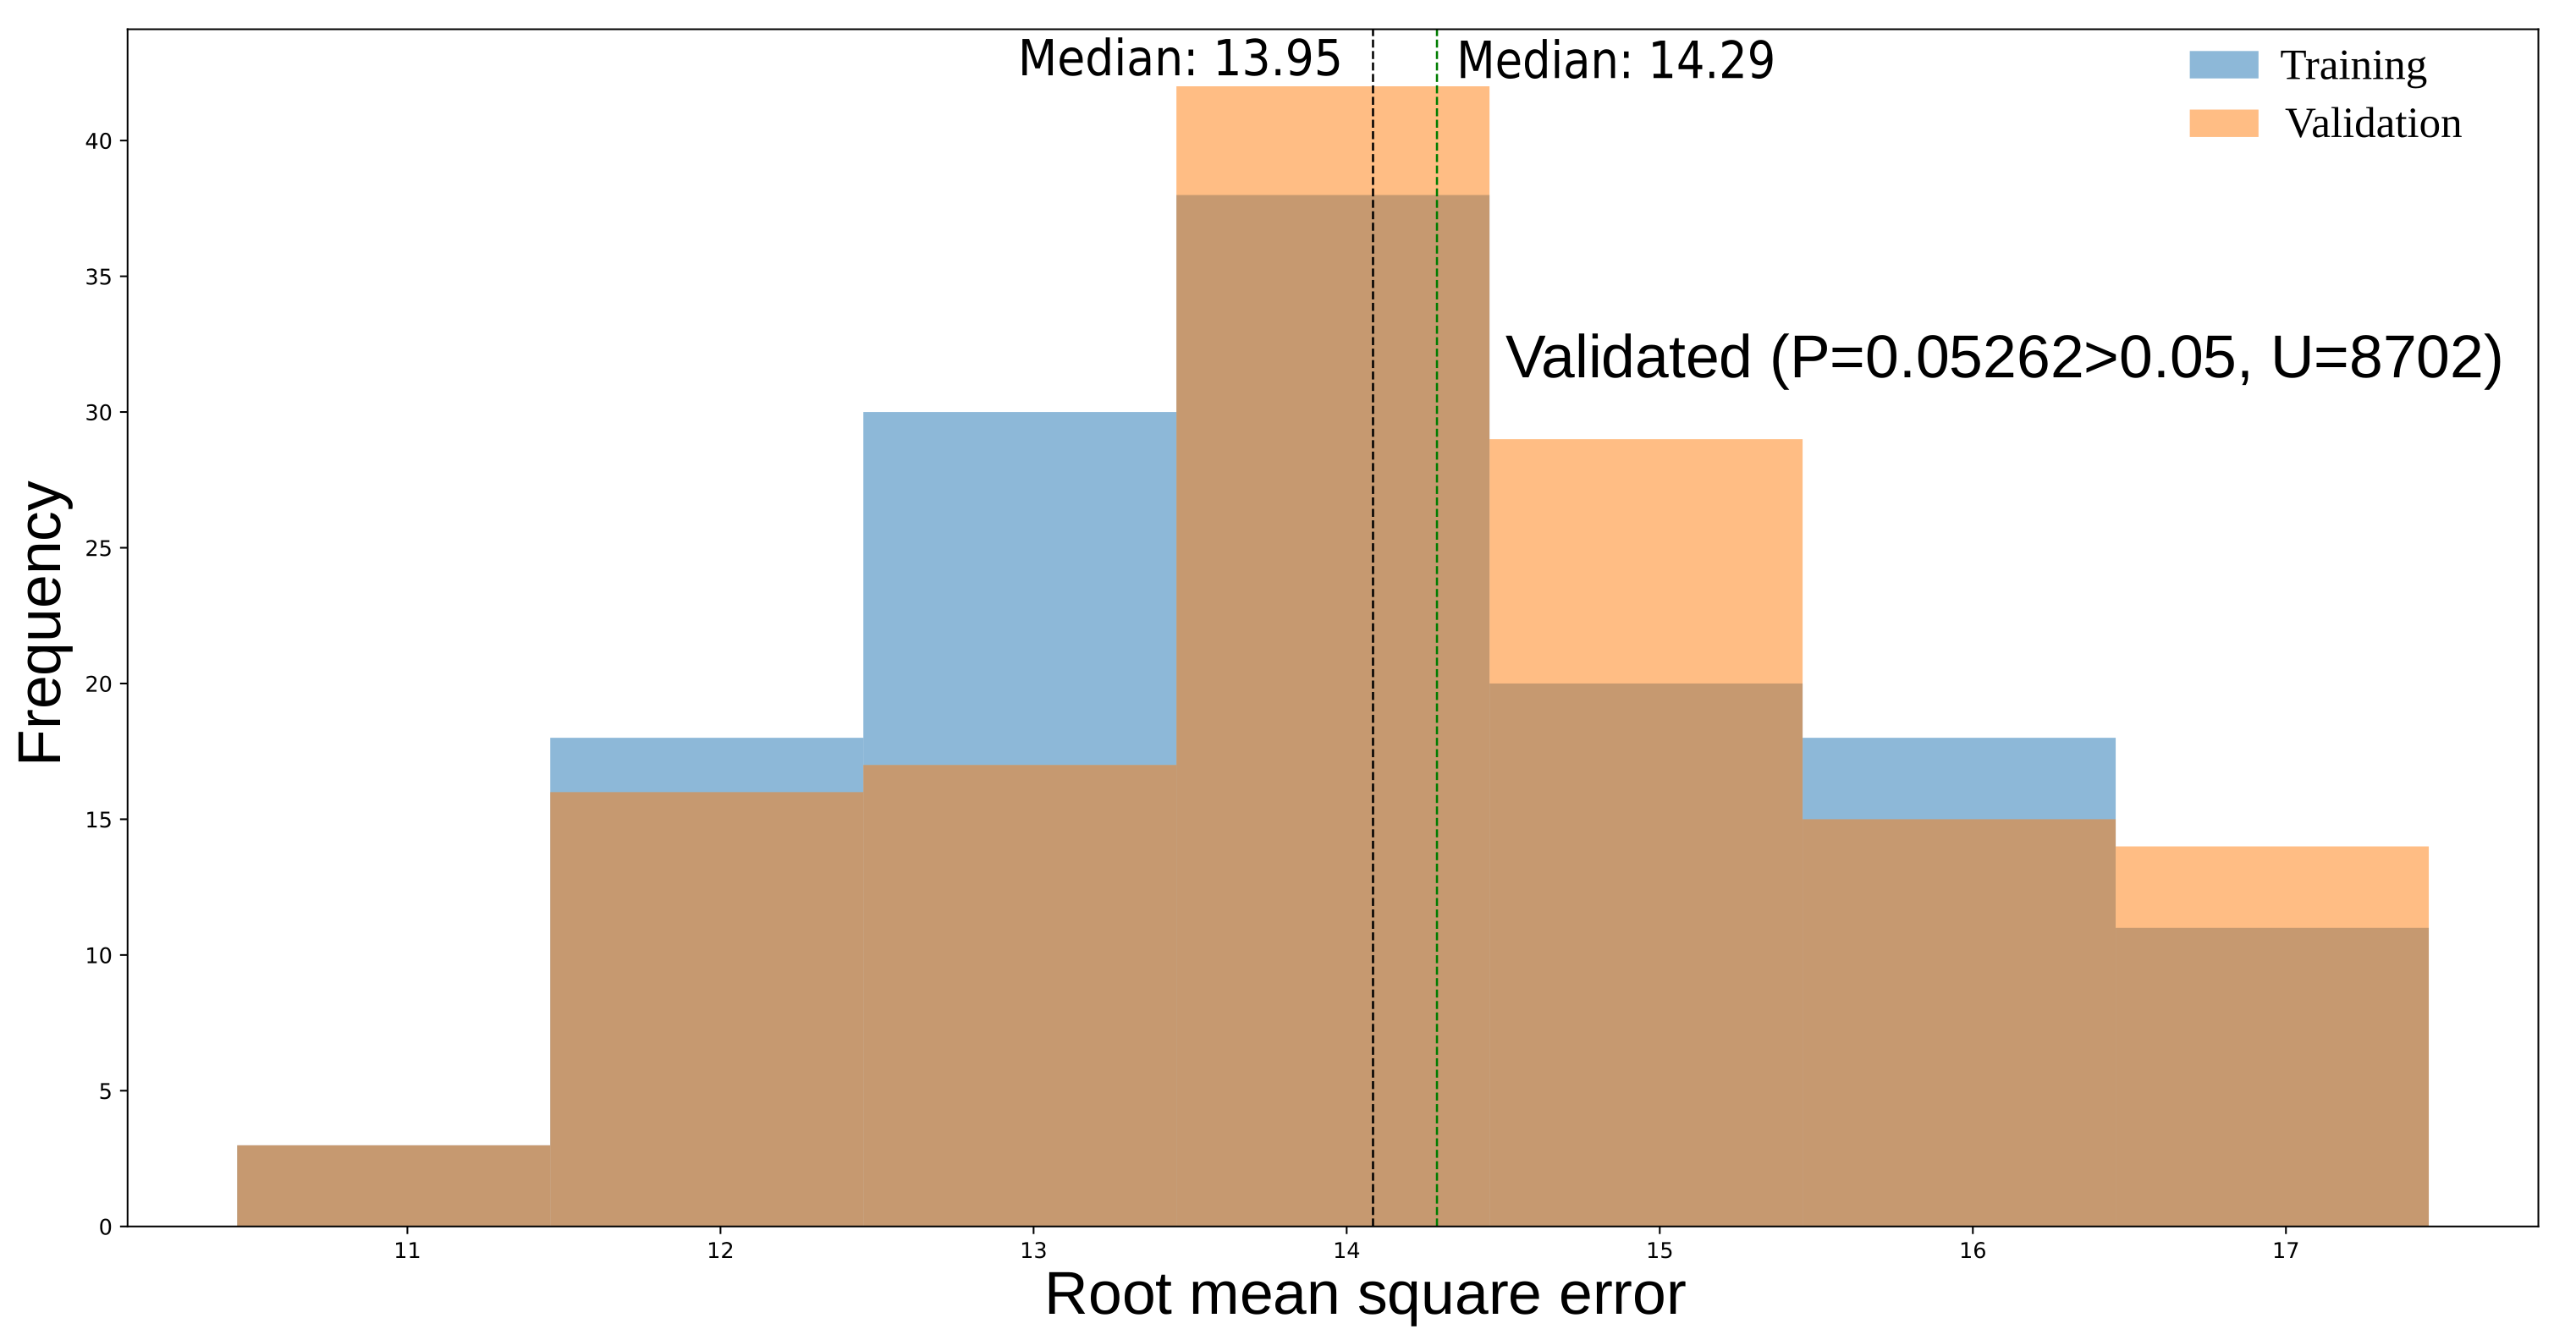
An optimization procedure of Approximate Bayesian Computation described in Section 2.5 was run for 500 iterations with 40 burn-in steps with 8 parameter vectors in a set. DEEP method used 1152 and 286 samples for training and test set, respectively. Using procedure described in Section 2.6 the convergence was found after 360 iterations (see Figure 4).
To verify the validity of the constructed model we compared the mean values of the root mean scores with a Mann–Whitney–Wilcoxon criterion. The difference between training and validation scores, 13.95 and 14.29 , respectively, was not statistically significant (p = 0.05262 > 0.05 ).
As described in Section 2.6, 22 models were selected for the pool from 60 candidates with the lowest root mean square scores for control set for which the median absolute difference in days between measured time to flowering and model prediction is less than 72. The models in the pool accurately describe cross-validation and control data in terms of the Pearson correlation coefficient, median and root mean square difference in the number of days to flowering between model solution and data (see Table 3). The models in the pool consist of different control functions.
The prediction of time to flowering with a pool is made using Formula (1). The Pearson correlation coefficient between the pool solution and data is 0.98 , median discrepancy in days is 6.47 and root mean squared error is 11.25 . Thus, the accuracy of the pool for the control set is better than any model in the pool.
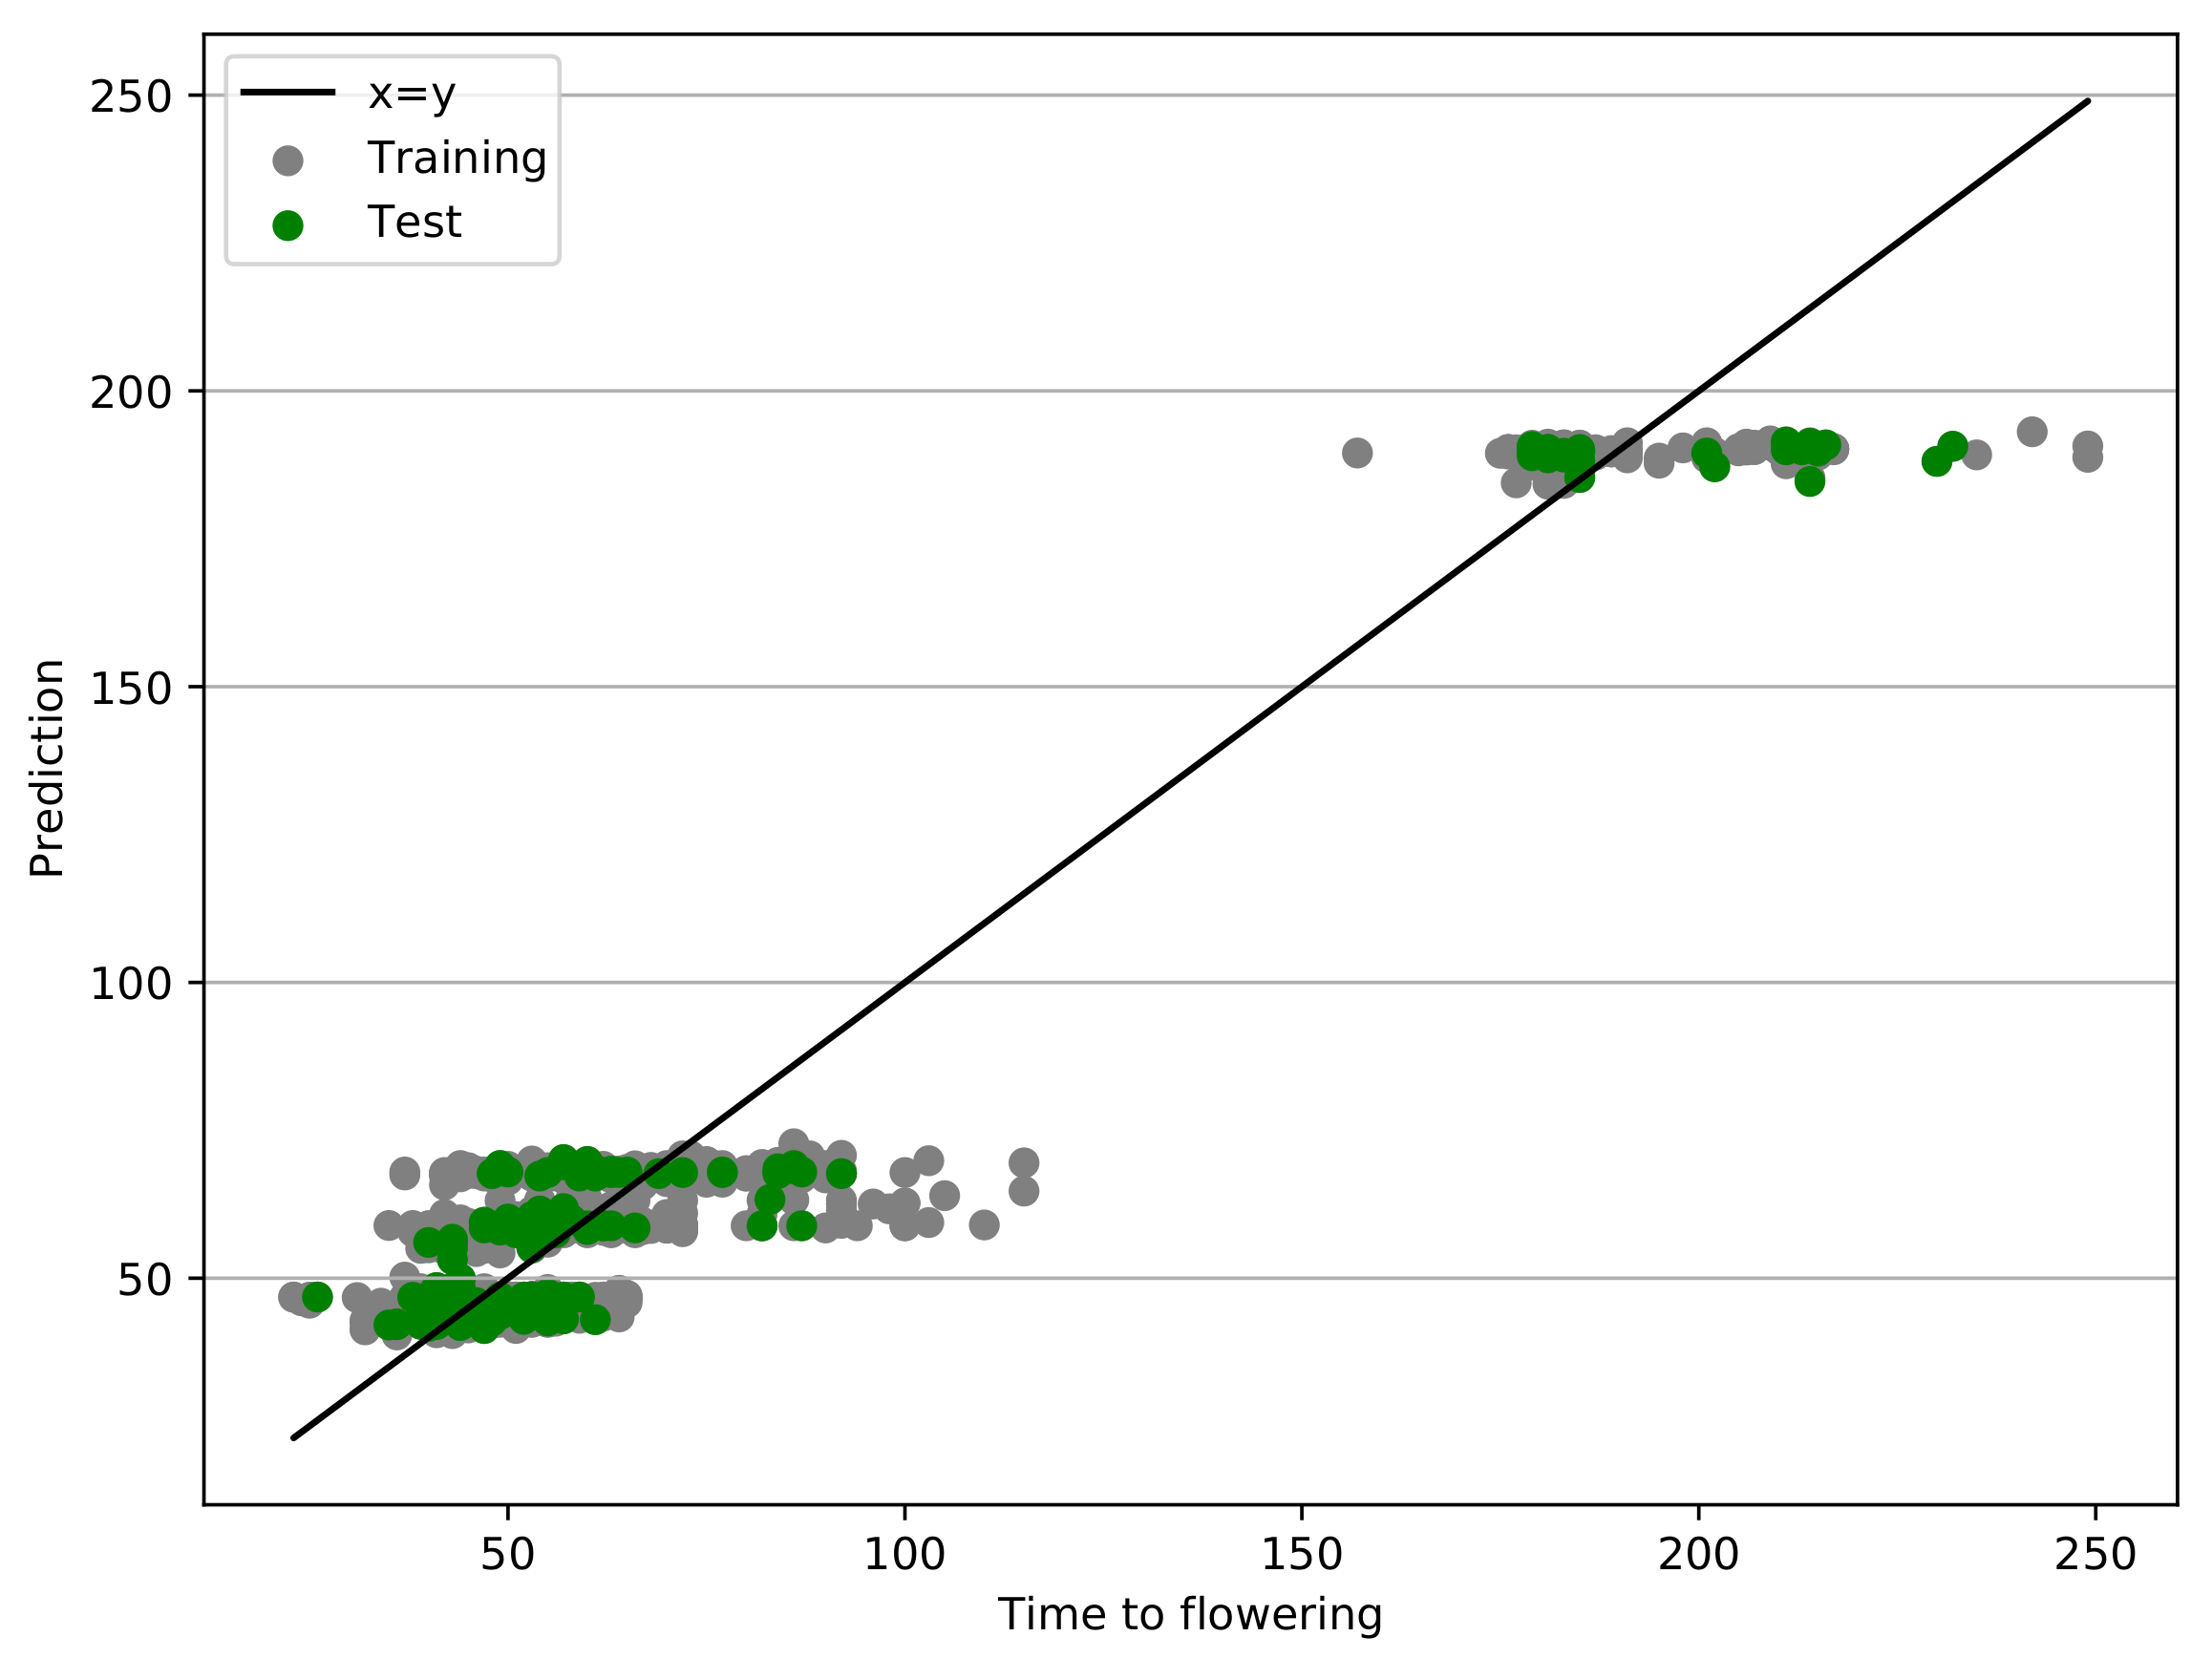
The pool accurately describes cross-validation and control data (see Figure 5), and the Pearson correlation coefficient is ≈0.98 in both cases.

3.2. The Best Model in the Pool

The best model in the pool is № 9 (see Table 3) and has 6 control functions Equation (6), and the Pearson correlation coefficient is 0.98 for the control set.
v ( i , t ) = 9.83 F 0 + 10.00 F 1 + 2.32 F 2 2.92 F 3 + 6.32 F 4 10.00 F 5 F 0 = 1 T x 25.00 ( 6.70 S ) 2 18.00 D F 1 = 45.00 ( 18.00 D ) ( 45.00 T x ) T x F 2 = 1 T x 25.00 F 3 = 1 ( 45.00 T x ) ( 6.70 T x ) F 4 = 1 ( S 4.97 ) ( ( T n 10.00 ) + ( 1 / ( T n 10.00 ) ) D ) F 5 = D 11.66 T n ( 1 / ( D 11.14 ) ) + R S ,
where F n are climatic control functions.
All control functions are non-linear, and all climatic factors except day length D in F 5 have non-linear effect in all functions. This illustrates the complex nature of the effect of climatic factors on time to flowering for accessions in the dataset.

3.3. Impacts of Climatic Factors and SNPs to the Model

To assess the impacts of climatic factors to the pool a permutation test was performed with 100 permutations (see Figure 1).
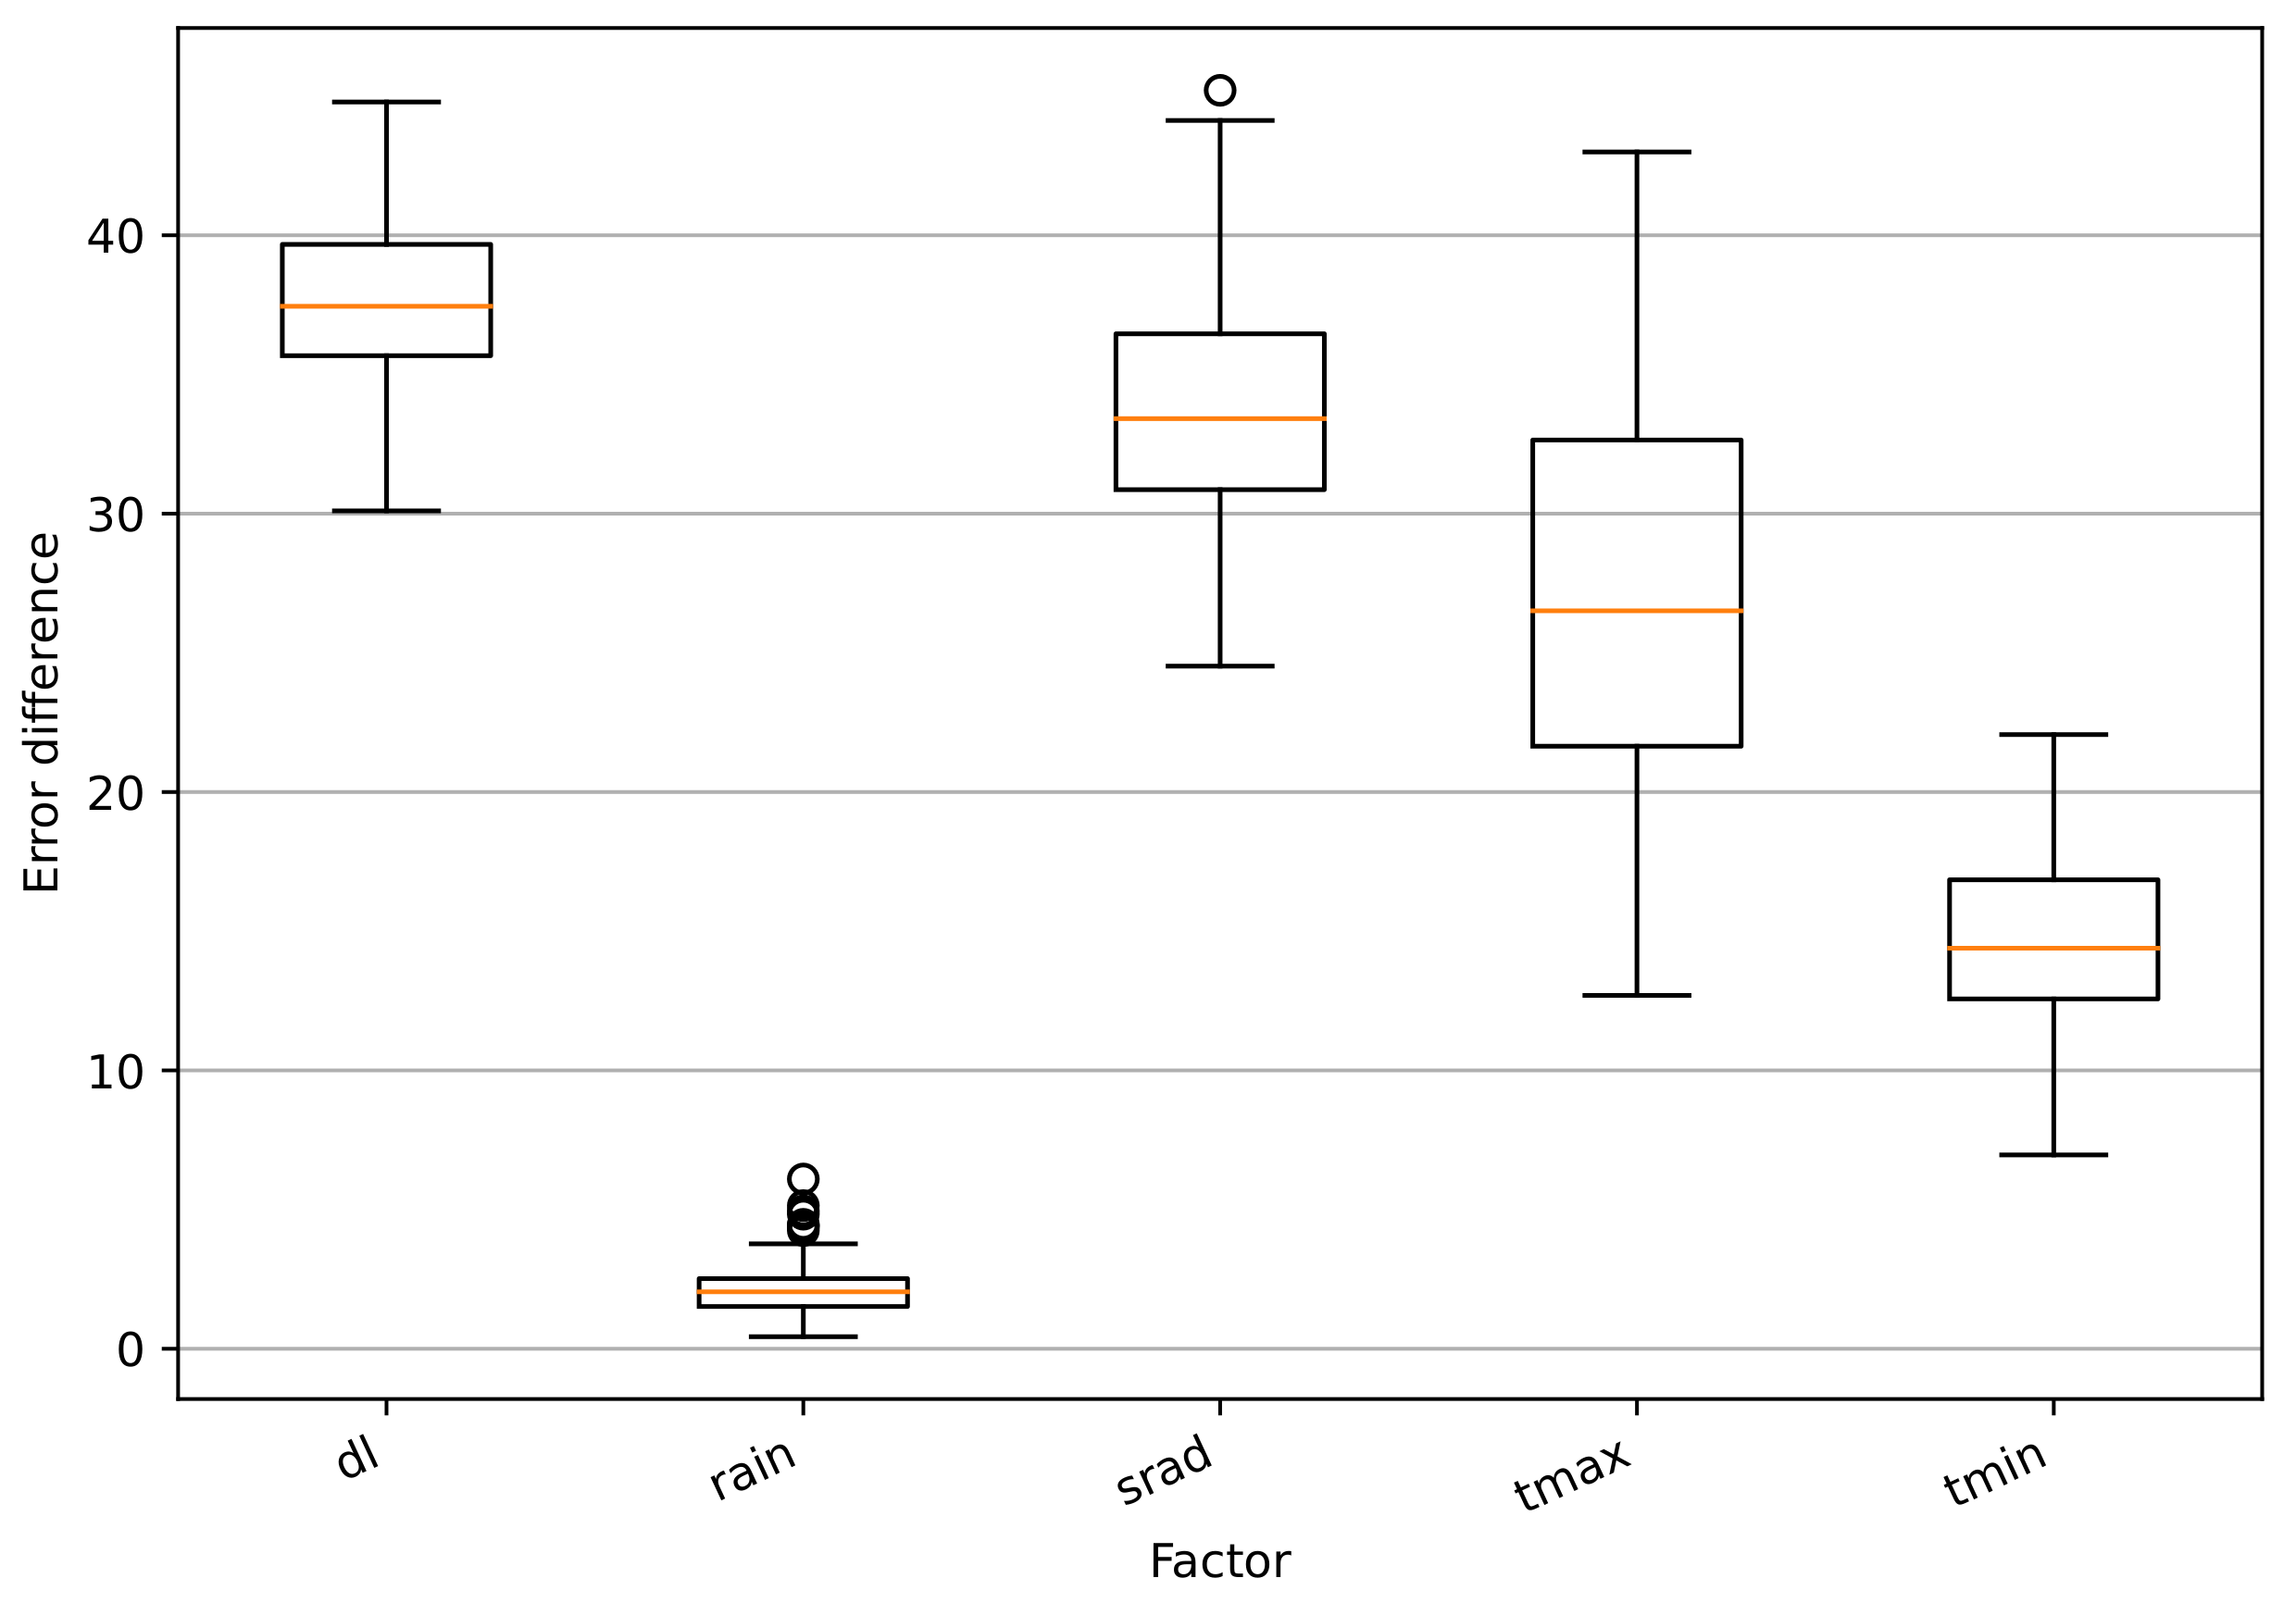
The day length and solar radiation have the maximal impact on the model, the impact of maximal temperature has the maximal variation between permutations (see Figure 6). Maximal temperature impacts the model solution almost twice weaker than day length, while the impact of precipitation is the weakest one (see Figure 6).
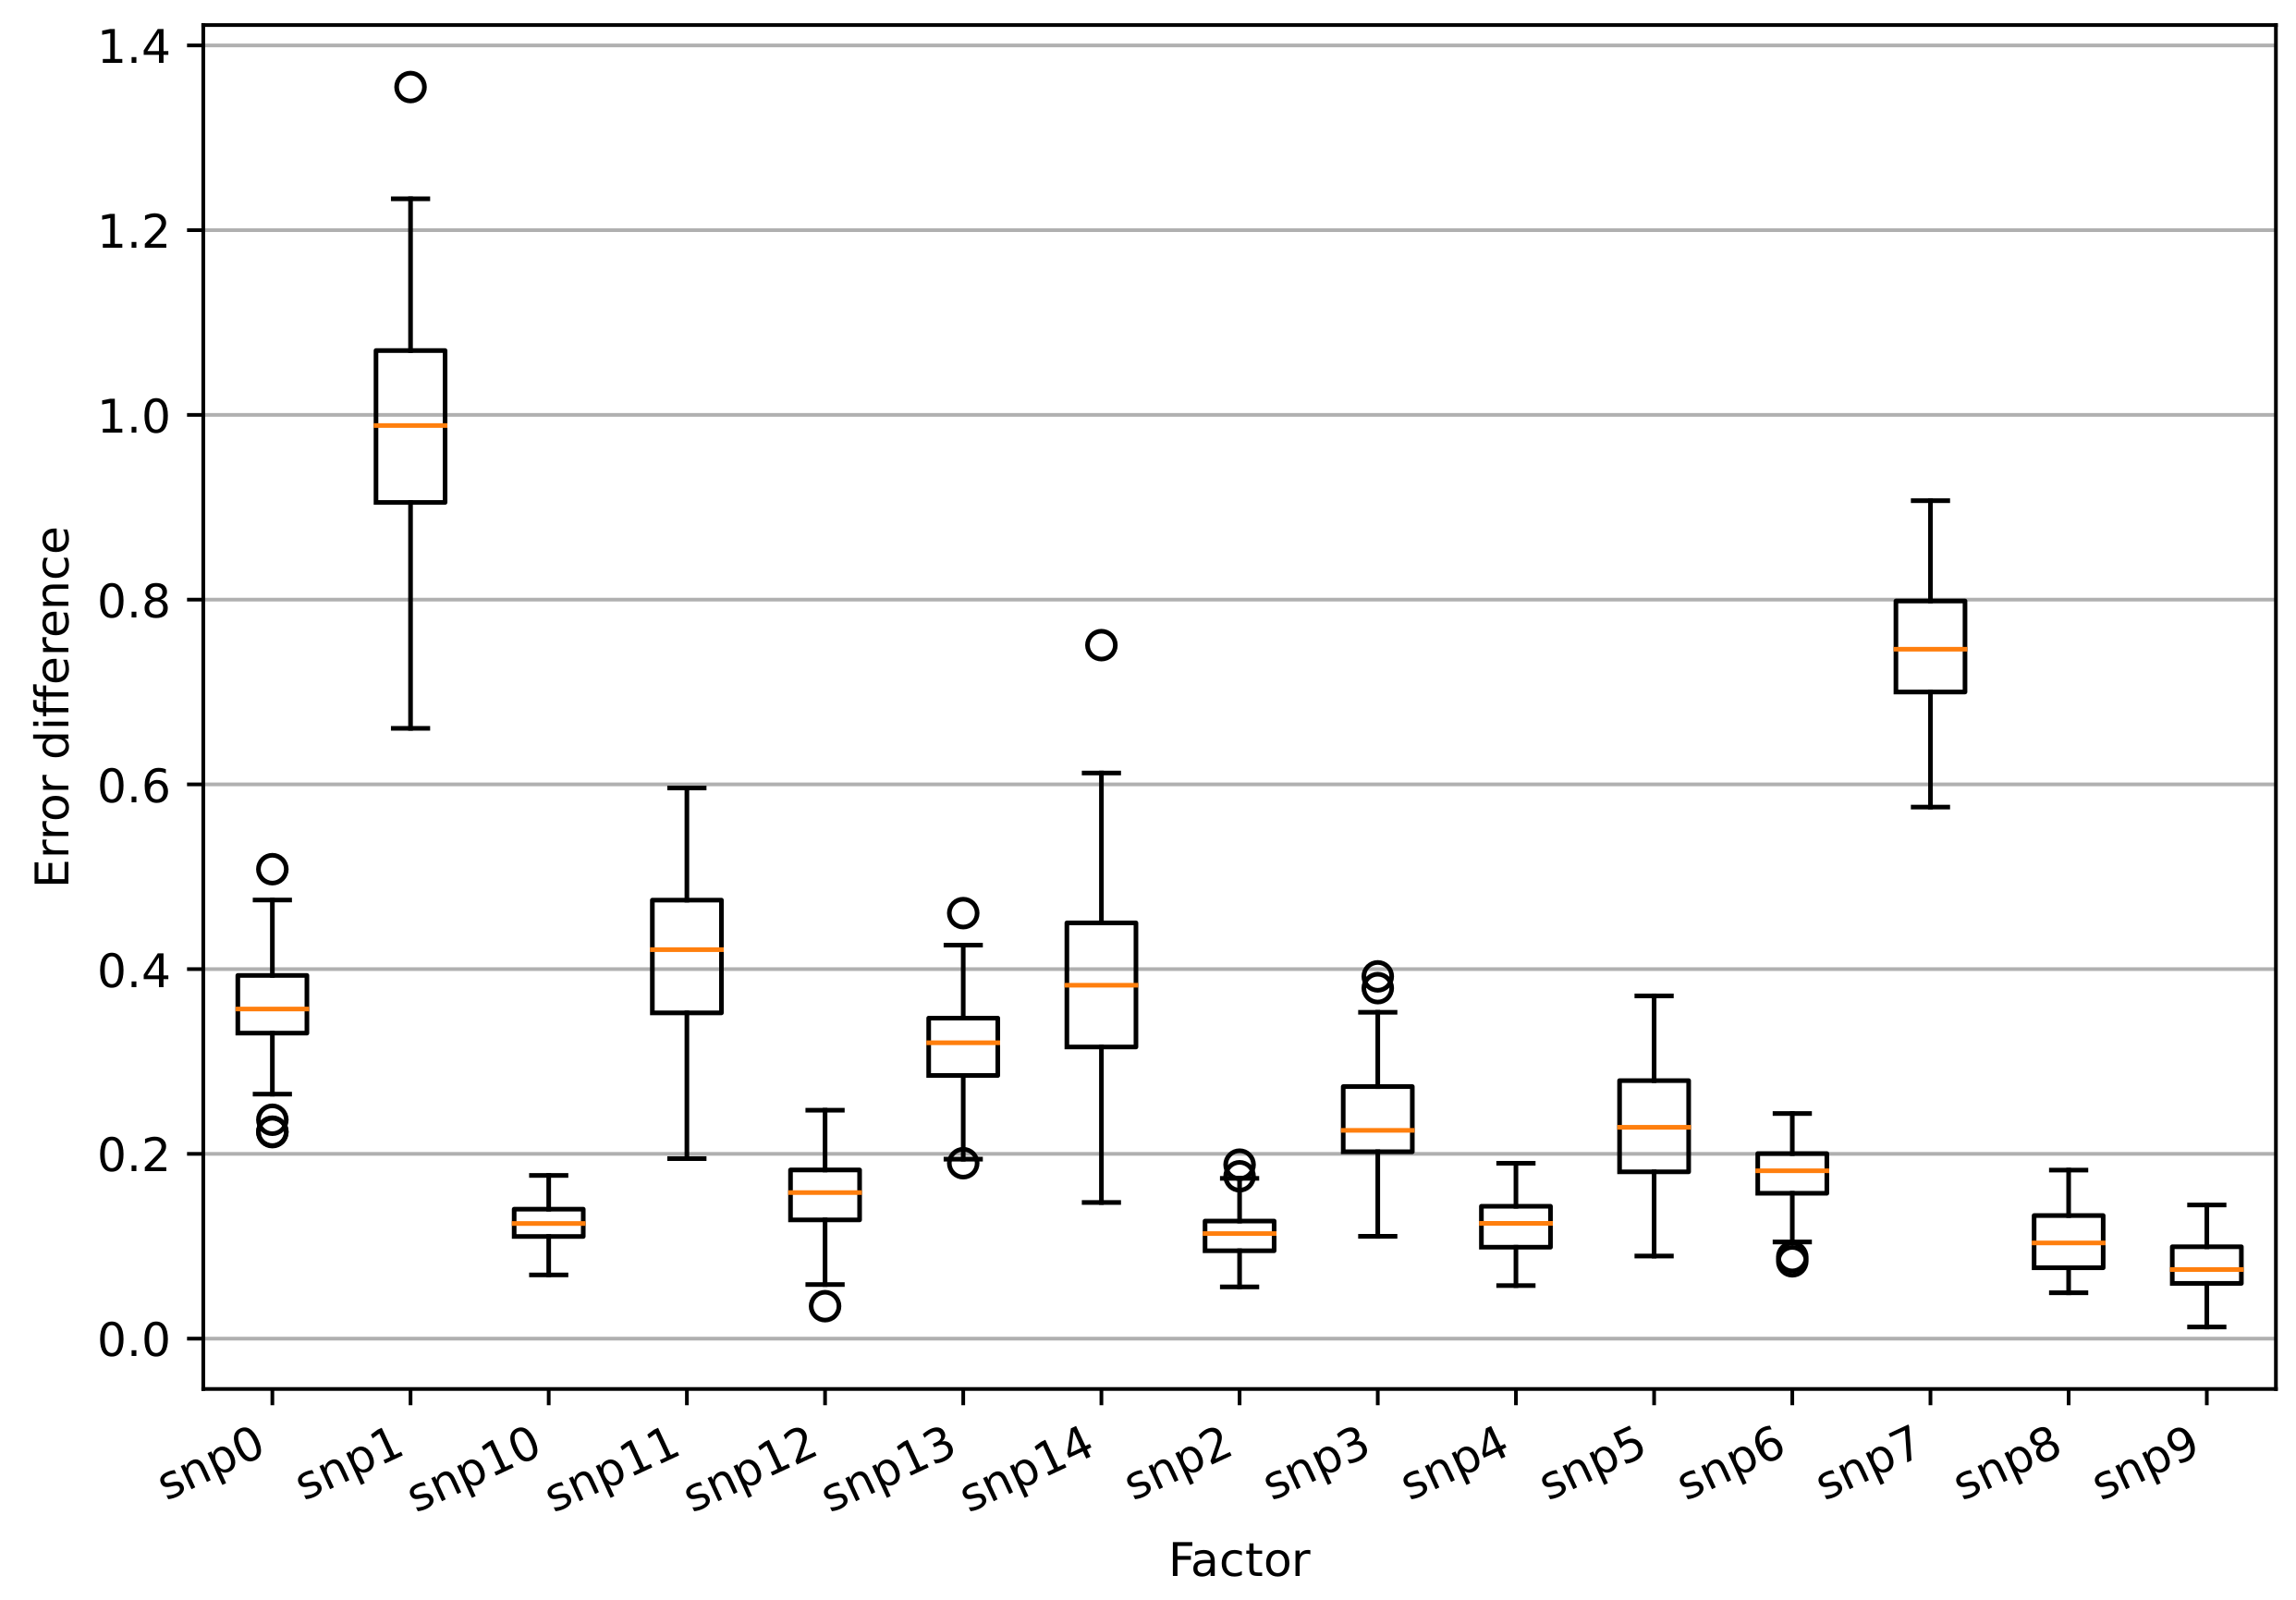
To assess the impact of genotype information, a test was performed 100 times in which the SNP values were permuted between accessions and the difference in root mean square error recorded (see Figure 7). The SNPs № 1 and № 7 have the largest effect to the model solution.

3.4. Simulation of Climate Warming

The pool was used to predict time to flowering of samples from the dataset for which the prediction error was less than 12 days in the scenario that simulates climate warming. The minimal temperature at each day was increased. Samples from the dataset exhibited different behaviors (see Figure 8). For one group of samples the time to flowering was approximately the same for increments up to 2.1 ° degrees and drops by approximately 5 days for further increments (see Figure 8A). For samples from another group the time to flowering fluctuates, but gradually increases by approximately 5 days for 6 ° increment (Figure 8B). Two other groups include samples with variation of time to flowering less than 5 and greater or equal 5 days and less or equal 10 days, respectively (Figure 8C,D).
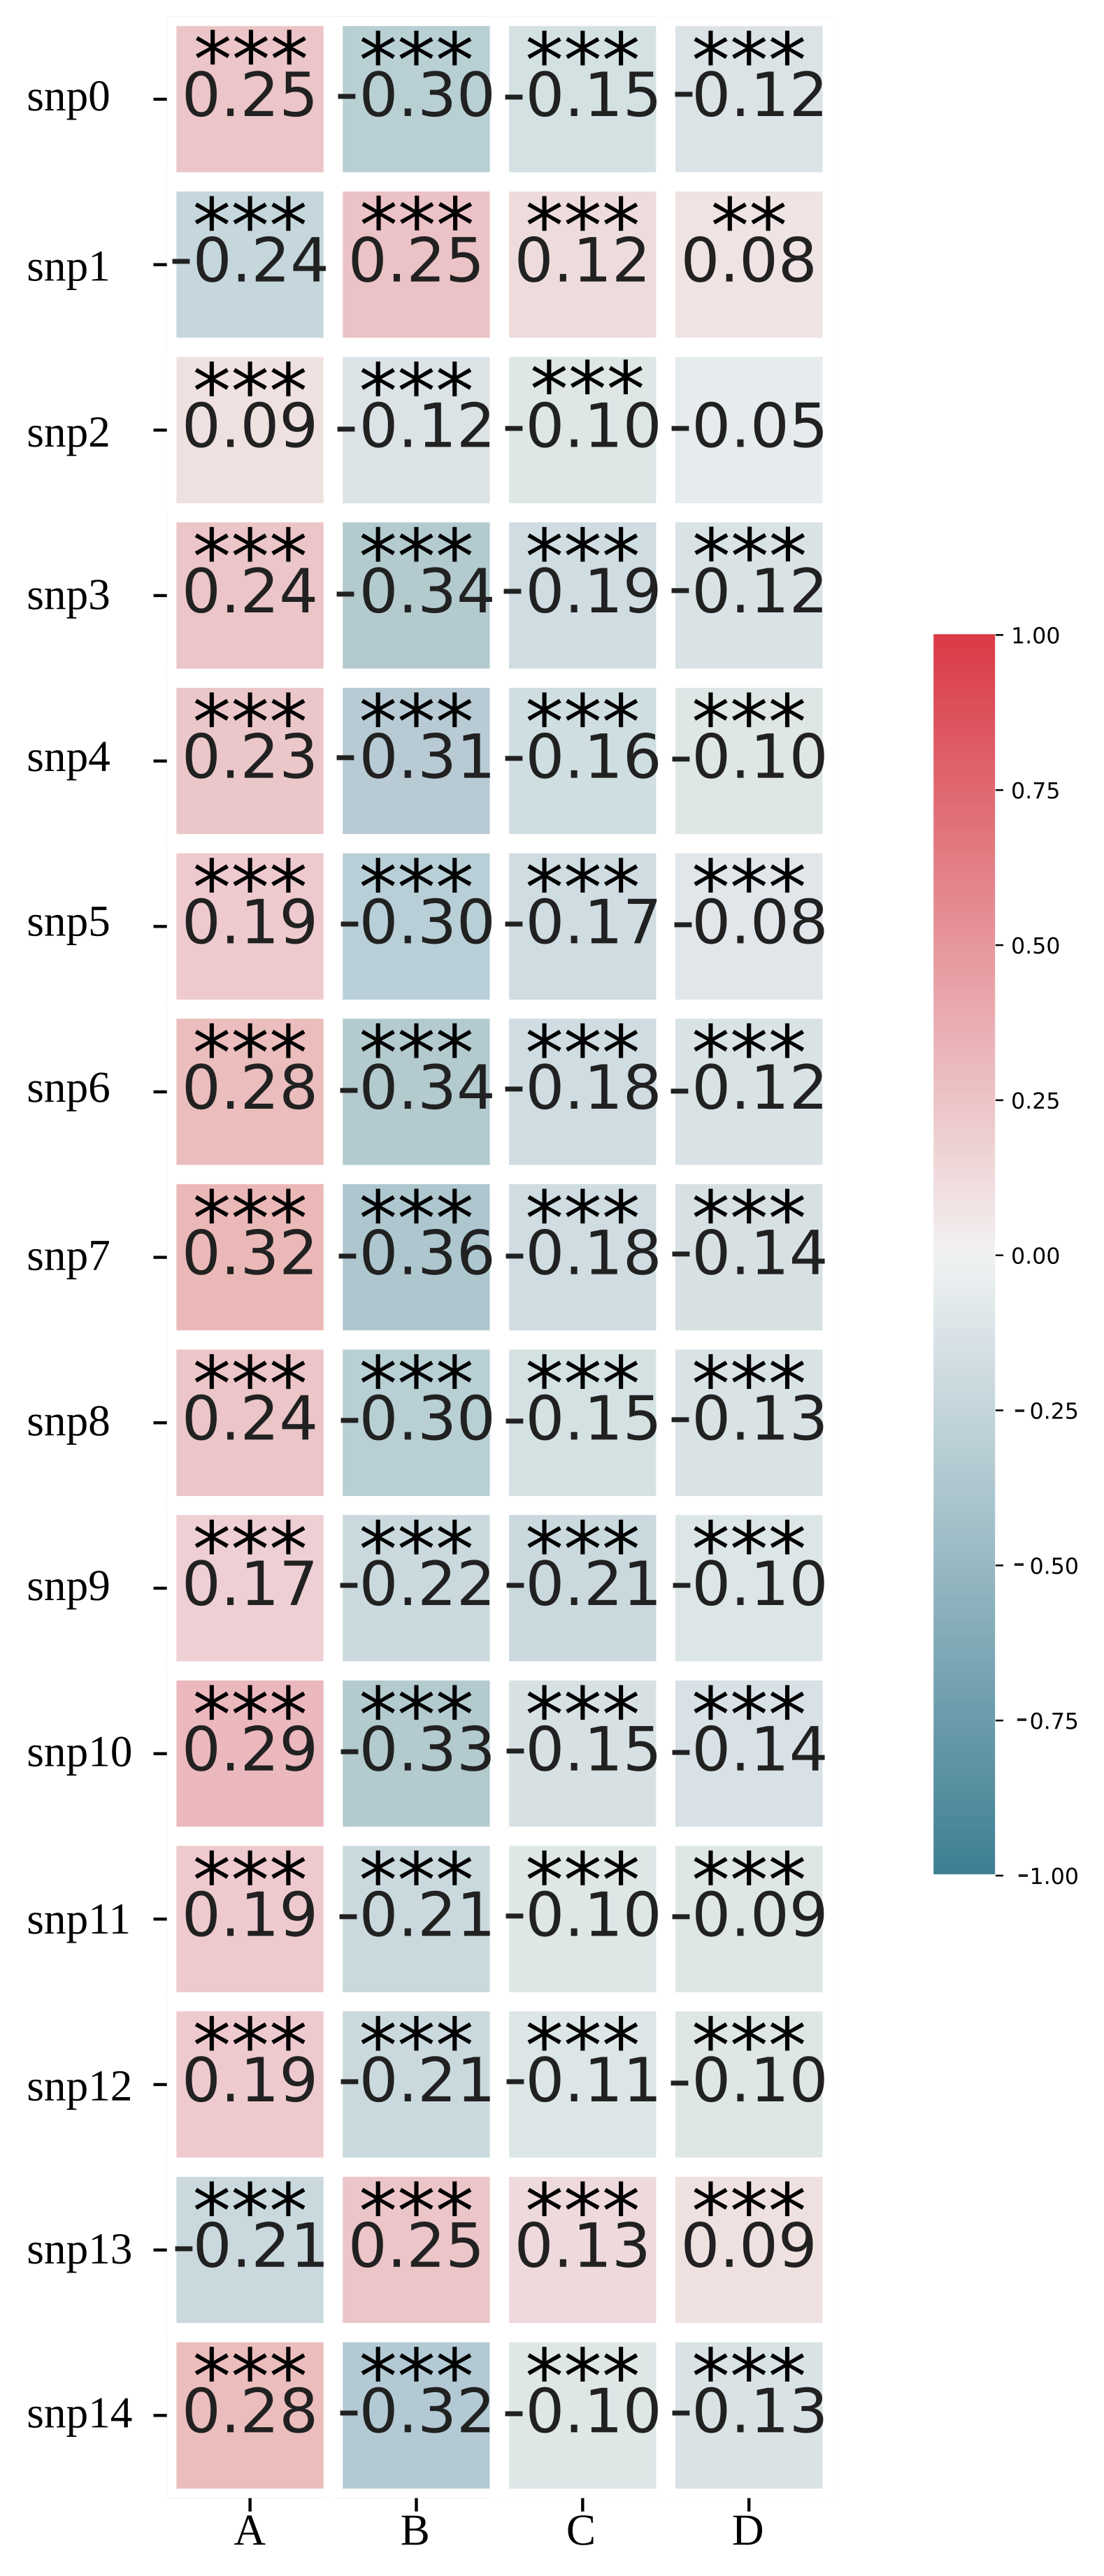
To characterize the relation between SNPs and the behavior of samples under increased temperature the Pearson correlation coefficient between SNPs and the difference between time to flowering for normal and temperature increased on 6 ° C was calculated (Figure 8A). No strong relationships were found as all coefficients were < 0.5 . The highest positive value of 0.32 (p-value < 10 16 ) suggests a weak correlation for snp7 that had a biggest impact to the model in permutation test (see Figure 7).
The weak correlation was obtained between SNP value and the maximum slope of the dependence of time to flowering on temperature increment for snp7 that had the lowest negative Pearson correlation coefficient −0.36 (p-value < 10 16 ) (Figure 8B). The same low dependence can be found for snp0, snp3, snp4, snp5, snp6, snp8, snp10, snp14 with coefficients above 0.3 in absolute value.
The correlation between SNPs and maximum rate of change of the slope of time to flowering dependence and standard deviation of time to flowering was almost negligible (< 0.2 ) for all SNPs (see Figure 9C,D).

4. Discussion

Mungbean (Vigna radiata (L.) Wilczek) is used in several traditional cuisines across Asia as a rich source of proteins and micronutrients. It has been an orphan tropical crop for a long time but could fulfill a role in a range of agroecologies. It fits into crop rotations due to a short duration cycle. One setting where mungbean fits well is in rotation with winter wheat, which is often harvested late in spring, leaving only a short summer season for mungbean; short duration is particularly critical to set seed before cool weather begins in this role [43]. Development of new varieties adapted to different conditions is necessary to meet the needs of growing global demand. The WorldVeg collection is a valuable resource for mungbean breeding [52]. The adaptation of adaptive traits like flowering time to specific environments is blueprinted in genomes [53,54] so that different genotypes responds to local conditions in different ways.
Here we proposed a new modeling approach with a pool of models to predict flowering time in mungbean based on daily values of maximal and minimal temperature, precipitation, day length and solar radiation as climatic factors. The genotype information in the form of SNPs identified by the vGWAS method is used to include genotype-by-environment interactions. A pool of models is built using Approximate Bayesian Computation technique [45,55] that uses Differential Evolution and Grammatical Evolution to obtain parameters of models that include analytic form of functional dependence of phenotype on different factors. ABC makes it possible to obtain not only one solution, but a sample from posterior distribution of unknown parameters.
We performed model parameterization on a dataset of 1596 accessions phenotyped in 6 different environments. Analysis of association revealed 15 SNPs associated with flowering time. To increase the reliability of model predictions, we constructed a pool of 22 models trained on the dataset of 1438 samples and tested on 158. The advantages of our model are the automatically constructed analytic form of functional dependence and the presence of the genotype-to-climatic factors interactions. In comparison to dynamical models developed earlier [43], the formulae (6) is more complex. That is because the data on accessions with long time to flowering was included into the dataset.
Though the amount of accumulated data is constantly growing the understanding of the role of temperature and day length in adaptation to different agroecological conditions is still incomplete [56]. According to the permutation test day length, solar radiation and temperature had a large impact to the model, while the impact of precipitation was comparatively small.
We used the constructed model pool to forecast the time to flowering in case of climate warming. The temperature was increased by 0.05 6.00 ° . Several types of behavior of samples were observed in which the time to flowering decreased or increased. The Pearson correlation coefficient between SNP value and the change in time to flowering revealed a weak but significant association of SNP7 with behavior of the accessions in warming climate conditions. The same SNP was found to have a considerable influence on model prediction in the permutation test. SNP1 was important according to permutation test and has a correlation with the change in time to flowering less than 0.30 .
The impact of climate change has been studied mostly for major cereal crops like wheat, maize, barley, etc. [57], but also cowpea (Vigna unguiculata [L.] Walp.) [58,59] and grass species [60]. The considerable variation in crop responses to future climate was described for chickpea in previous studies for South Asia and East Africa [61]. Earlier crop flowering and maturity have been observed and documented in recent decades, and these are often associated with warmer (spring) temperatures [62].

5. Conclusions

The model pool developed in this work illustrates the approach based on Approximate Bayesian Computation with Differential and Grammatical Evolution for construction of dependencies of plant phenotype on climatic factors and genotype-by-environment interactions. Due to extensive cross-validation the obtained pool of models provide high accuracy on available dataset.
The models in the constructed pool consist of more complex function dependencies in comparison to previous studies due to more diverse dataset. The results of permutation tests showed that the impacts of all climatic factors except precipitation are important to the model solution. The day length has the maximal impact and the impact of maximal temperature has the maximal variation.
Our results confirm the diversity of behaviors of genotypes. The time to flowering is reduced in constructed forecasts for climate warming conditions for some but not all accessions. The SNP № 7 was found to be weakly but significantly correlated with model response to climate change and model accuracy in the permutation test. This genotypic and phenotypic diversity can be used in breeding programs to produce varieties with desired flowering times.

Author Contributions

Conceptualization, E.B.-v.W., S.V.N., M.S. and K.K.; methodology, M.S. and K.K.; software, A.A. and K.K.; validation, A.A., M.S. and K.K.; formal analysis, investigation, A.A. and K.K.; resources, data curation, R.S., C.-R.L., C.-T.T.; writing—original draft preparation, review and editing, A.A., E.B.-v.W., S.V.N., M.S. and K.K.; visualization, A.A.; supervision, M.S.; project administration, S.V.N.; funding acquisition, M.S. All authors have read and agreed to the published version of the manuscript.

Funding

The research was funded by the Ministry of Science and Higher Education of the Russian Federation as part of World-class Research Center program: Advanced Digital Technologies (contract No. 075-15-2020-934 dated 17 November 2020).

Institutional Review Board Statement

Not applicable.

Informed Consent Statement

Not applicable.

Data Availability Statement

The data analyzed in this study are available in Zenodo at 10.5281/zenodo.5702897.

Acknowledgments

We thank Vitaly Gursky, Svetlana Surkova, Michail Bankin and Alena Sokolkova. Calculations were performed in Supercomputer center of Peter the Great St.Peterburg Polytechnic University.

Conflicts of Interest

The authors declare no conflict of interest.

References

  1. Chivenge, P.; Mabhaudhi, T.; Modi, A.; Mafongoya, P. The Potential Role of Neglected and Underutilised Crop Species as Future Crops under Water Scarce Conditions in Sub-Saharan Africa. Int. J. Environ. Res. Public Health 2015, 12, 5685–5711. [Google Scholar] [CrossRef] [PubMed] [Green Version]
  2. Vara-Ubol, S.; Chambers, E.; Chambers, D.H. Sensory characteristics of chemical compounds potentially associated with beany aroma in foods. J. Sens. Stud. 2004, 19, 15–26. [Google Scholar] [CrossRef]
  3. Vishnyakova, M.A.; Burlyaeva, M.O.; Samsonova, M.G. Green gram and black gram: Prospects of cultivation and breeding in Russian Federation. Vavilov J. Genet. Breed. 2018, 22, 957–966. [Google Scholar] [CrossRef]
  4. Burlyaeva, M.; Vishnyakova, M.; Gurkina, M.; Kozlov, K.; Lee, C.R.; Ting, C.T.; Schafleitner, R.; Nuzhdin, S.; Samsonova, M.; von Wettberg, E. Collections of Mungbean [Vigna radiata (L.) R. Wilczek] and Urdbean [V. mungo (L.) Hepper] in Vavilov Institute (VIR): Traits Diversity and Trends in the Breeding Process over the Last 100 Years. Genet. Resour. Crop. Evol. 2019, 66, 767–781. [Google Scholar] [CrossRef]
  5. Schafleitner, R.; Nair, R.M.; Rathore, A.; Wang, Y.w.; Lin, C.y.; Chu, S.h.; Lin, P.y.; Chang, J.C.; Ebert, A.W. The AVRDC—The World Vegetable Center Mungbean (Vigna radiata) Core and Mini Core Collections. BMC Genom. 2015, 16, 344. [Google Scholar] [CrossRef] [PubMed] [Green Version]
  6. Mondal, M.M.A.; Puteh, A.B.; Malek, M.A.; Ismail, M.R.; Rafii, M.Y.; Latif, M.A. Seed Yield of Mungbean (Vigna radiata (L.) Wilczek) in Relation to Growth and Developmental Aspects. Sci. World J. 2012, 2012, 1–7. [Google Scholar] [CrossRef] [PubMed] [Green Version]
  7. Imrie, B.C.; Drake, D.W.; Delacy, I.H.; Byth, D.E. Analysis of Genotypic and Environmental Variation in International Mungbean Trials. Euphytica 1981, 30, 301–311. [Google Scholar] [CrossRef]
  8. Swindell, R.; Poehlman, J.M. Inheritance of photoperiod response (Vigna radiata [L.] wilczek). Euphytica 1978, 27, 325–333. [Google Scholar] [CrossRef]
  9. Ellis, R.H.; Lawn, R.J.; Summerfield, R.J.; Qi, A.; Roberts, E.H.; Chay, P.M.; Brouwer, J.B.; Rose, J.L.; Yeates, S.J.; Sandover, S. Towards the Reliable Prediction of Time to Flowering in Six Annual Crops. IV. Cultivated and Wild Mung Bean. Exp. Agric. 1994, 30, 31–43. [Google Scholar] [CrossRef]
  10. Nath, D.; Dasgupta, T. Genotype × Environment Interaction and Stability Analysis in Mungbean. IOSR J. Agric. Vet. Sci. 2013, 5, 62–70. [Google Scholar] [CrossRef]
  11. Godwin, I.D.; Rutkoski, J.; Varshney, R.K.; Hickey, L.T. Technological Perspectives for Plant Breeding. Theor. Appl. Genet. 2019, 132, 555–557. [Google Scholar] [CrossRef] [PubMed] [Green Version]
  12. Singh, V.; Yadav, N.R.; Singh, J. Role of Genomic Tools for Mungbean [Vigna radiata (L.) Wilczek] Improvement. Legume Res. Int. J. 2017, 40, 601–608. [Google Scholar] [CrossRef] [Green Version]
  13. Kang, Y.J.; Kim, S.K.; Kim, M.Y.; Lestari, P.; Kim, K.H.; Ha, B.K.; Jun, T.H.; Hwang, W.J.; Lee, T.; Lee, J.; et al. Genome Sequence of Mungbean and Insights into Evolution within Vigna Species. Nat. Commun. 2014, 5, 5443. [Google Scholar] [CrossRef] [PubMed] [Green Version]
  14. Kim, S.K.; Nair, R.M.; Lee, J.; Lee, S.H. Genomic Resources in Mungbean for Future Breeding Programs. Front. Plant Sci. 2015, 6, 626. [Google Scholar] [CrossRef] [Green Version]
  15. Piekutowska, M.; Niedbała, G.; Piskier, T.; Lenartowicz, T.; Pilarski, K.; Wojciechowski, T.; Pilarska, A.A.; Czechowska-Kosacka, A. The Application of Multiple Linear Regression and Artificial Neural Network Models for Yield Prediction of Very Early Potato Cultivars before Harvest. Agronomy 2021, 11, 885. [Google Scholar] [CrossRef]
  16. Boote, K.J.; Jones, J.; Pickering, N. Potential Uses and Limitations of Crop Models. Agron. J. 1996, 88, 704–716. [Google Scholar] [CrossRef]
  17. Williams, J.R.; Jones, C.A.; Kiniry, J.R.; Spanel, D.A. The EPIC Crop Growth Model. Trans. ASAE 1989, 32, 497–511. [Google Scholar] [CrossRef]
  18. Sousa-Ortega, C.; Royo-Esnal, A.; Urbano, J.M. Predicting Seedling Emergence of Three Canarygrass (Phalaris) Species under Semi-Arid Conditions Using Parametric and Non-Parametric Models. Agronomy 2021, 11, 893. [Google Scholar] [CrossRef]
  19. Vadez, V.; Soltani, A.; Sinclair, T. Crop Simulation Analysis of Phenological Adaptation of Chickpea to Different Latitudes of India. Field Crop. Res. 2013, 146, 1–9. [Google Scholar] [CrossRef] [Green Version]
  20. Jones, J.W.; Antle, J.M.; Basso, B.; Boote, K.J.; Conant, R.T.; Foster, I.; Godfray, H.C.J.; Herrero, M.; Howitt, R.E.; Janssen, S.; et al. Toward a New Generation of Agricultural System Data, Models, and Knowledge Products: State of Agricultural Systems Science. Agric. Syst. 2017, 155, 269–288. [Google Scholar] [CrossRef]
  21. Jones, J.W.; Antle, J.M.; Basso, B.; Boote, K.J.; Conant, R.T.; Foster, I.; Godfray, H.C.J.; Herrero, M.; Howitt, R.E.; Janssen, S.; et al. Brief History of Agricultural Systems Modeling. Agric. Syst. 2016, 155, 240–254. [Google Scholar] [CrossRef]
  22. Jones, J.; Hoogenboom, G.; Porter, C.; Boote, K.; Batchelor, W.; Hunt, L.; Wilkens, P.; Singh, U.; Gijsman, A.; Ritchie, J. The DSSAT Cropping System Model. Eur. J. Agron. 2003, 18, 235–265. [Google Scholar] [CrossRef]
  23. Boote, K.J.; Jones, J.W.; White, J.W.; Asseng, S.; Lizaso, J.I. Putting Mechanisms into Crop Production Models. Plant Cell Environ. 2013, 36, 1658–1672. [Google Scholar] [CrossRef]
  24. Wilkerson, G.; Jones, J.; Boote, K.; Ingram, K.; Mishoe, J. Modeling Soybean Growth for Crop Management. Trans. Am. Soc. Agric. Eng. 1983, 26, 63–73. [Google Scholar] [CrossRef]
  25. Roorkiwal, M.; Rathore, A.; Das, R.R.; Singh, M.K.; Jain, A.; Srinivasan, S.; Gaur, P.M.; Chellapilla, B.; Tripathi, S.; Li, Y.; et al. Genome-Enabled Prediction Models for Yield Related Traits in Chickpea. Front. Plant Sci. 2016, 7, 1666. [Google Scholar] [CrossRef] [PubMed] [Green Version]
  26. Hoogenboom, G.; White, J.; Jones, J.; Boote, K. BEANGRO: A Process-Oriented Dry Bean Model with a Versatile User Interface. Agon. J. 1994, 86, 186–190. [Google Scholar] [CrossRef]
  27. Jones, J.; Keating, B.; Porter, C. Approaches to Modular Model Development. Agric. Syst. 2001, 70, 421–443. [Google Scholar] [CrossRef]
  28. Wajid, A.; Rahman, M.H.U.; Ahmad, A.; Khaliq, T.; Mahmood, N.; Rasul, F.; Bashir, M.U.; Awais, M.; Hussain, J.; Hoogeboom, G. Simulating the Interactive Impact of Nitrogen and Promising Cultivars on Yield of Lentil (Lens culinaris) Using CROPGRO-Legume Model. Int. J. Agric. Biol. 2013, 15, 1331–1336. [Google Scholar]
  29. Ilkaee, M.N.; Paknejad, F.; Golzardi, F.; Tookalloo, M.R.; Habibi, D.; Tohidloo, G.; Pazoki, A.; Agayari, F.; Rezaee, M.; Rika, Z.F. Simulation of Some of Important Traits in Chickpea Cultivars under Different Sowing Date Using CROPGRO-Pea Model. Int. J. Biosci. 2014, 4, 84–92. [Google Scholar]
  30. Mabhaudhi, T.; Chibarabada, T.P.; Chimonyo, V.G.P.; Modi, A.T. Modelling Climate Change Impact: A Case of Bambara Groundnut (Vigna subterranea). Phys. Chem. Earth Parts A/B/C 2018, 105, 25–31. [Google Scholar] [CrossRef]
  31. Chapman, S.C.; Cooper, M.; Hammer, G.L.; Butler, D.G. Genotype by Environment Interactions Affecting Grain Sorghum. II. Frequencies of Different Seasonal Patterns of Drought Stress Are Related to Location Effects on Hybrid Yields. Aust. J. Agric. Res. 2000, 51, 209. [Google Scholar] [CrossRef]
  32. Chauhan, Y.S.; Douglas, C.; Rachaputi, R.C.N.; Agius, P.; Martin, W.; Skerman, A. Physiology of Mungbean and Development of the Mungbean Crop Model. In Proceedings of the 1st Australian Summer Grains Conference, Gold Coast, Australia, 21–24 June 2010; p. 11. [Google Scholar]
  33. Hwang, C.; Correll, M.; Gezan, S.; Zhang, L.; Bhakta, M.; Vallejos, C.; Boote, K.; Clavijo-Michelangeli, J.; Jones, J. Next Generation Crop Models: A Modular Approach to Model Early Vegetative and Reproductive Development of the Common Bean (Phaseolus vulgaris L.). Agric. Syst. 2017, 155, 225–239. [Google Scholar] [CrossRef] [PubMed]
  34. Hatfield, J.; Walthall, C. Meeting Global Food Needs: Realizing the Potential via Genetics x Environment x Management Interactions. Agron. J. 2015, 107, 1215–1226. [Google Scholar] [CrossRef] [Green Version]
  35. Tardieu, F.; Tuberosa, R. Dissection and Modelling of Abiotic Stress Tolerance in Plants. Curr. Opin. Plant Biol. 2010, 13, 206–212. [Google Scholar] [CrossRef]
  36. Zhang, X.; Cai, X. Climate Change Impacts on Global Agricultural Land Availability. Environ. Res. Lett. 2011, 6, 014014. [Google Scholar] [CrossRef]
  37. Foley, J.A.; Ramankutty, N.; Brauman, K.A.; Cassidy, E.S.; Gerber, J.S.; Johnston, M.; Mueller, N.D.; O’Connell, C.; Ray, D.K.; West, P.C.; et al. Solutions for a cultivated planet. Nature 2011, 478, 337–342. [Google Scholar] [CrossRef] [Green Version]
  38. Deb, P.; Shrestha, S.; Babel, M.S. Forecasting climate change impacts and evaluation of adaptation options for maize cropping in the hilly terrain of Himalayas: Sikkim, India. Theor. Appl. Climatol. 2015, 121, 649–667. [Google Scholar] [CrossRef]
  39. Shrestha, S.; Deb, P.; Bui, T.T.T. Adaptation strategies for rice cultivation under climate change in Central Vietnam. Mitig. Adapt. Strateg. Glob. Chang. 2016, 21, 15–37. [Google Scholar] [CrossRef]
  40. Ageev, A.; Aydogan, A.; Bishop-von Wettberg, E.; Nuzhdin, S.V.; Samsonova, M.; Kozlov, K. Simulation Model for Time to Flowering with Climatic and Genetic Inputs for Wild Chickpea. Agronomy 2021, 11, 1389. [Google Scholar] [CrossRef]
  41. Ageev, A.Y.; Bishop-von Wettberg, E.J.; Nuzhdin, S.V.; Samsonova, M.G.; Kozlov, K.N. Forecasting the Timing of Floral Initiation in Wild Chickpeas under Climate Change. Biophysics 2021, 66, 107–116. [Google Scholar] [CrossRef]
  42. Kozlov, K.; Singh, A.; Berger, J.; Wettberg, E.B.v.; Kahraman, A.; Aydogan, A.; Cook, D.; Nuzhdin, S.; Samsonova, M. Non-Linear Regression Models for Time to Flowering in Wild Chickpea Combine Genetic and Climatic Factors. BMC Plant Biol. 2019, 19, 94. [Google Scholar] [CrossRef] [PubMed]
  43. Kozlov, K.; Sokolkova, A.; Lee, C.R.; Ting, C.T.; Schafleitner, R.; Bishop-von Wettberg, E.; Nuzhdin, S.; Samsonova, M. Dynamical climatic model for time to flowering in Vigna radiata. BMC Plant Biol. 2020, 20, 202. [Google Scholar] [CrossRef] [PubMed]
  44. Turner, B.M.; Van Zandt, T. A Tutorial on Approximate Bayesian Computation. J. Math. Psychol. 2012, 56, 69–85. [Google Scholar] [CrossRef]
  45. Turner, B.M.; Sederberg, P.B. Approximate Bayesian Computation with Differential Evolution. J. Math. Psychol. 2012, 56, 375–385. [Google Scholar] [CrossRef]
  46. Shen, X.; Pettersson, M.; Rönnegård, L.; Carlborg, O. Inheritance Beyond Plain Heritability: Variance-Controlling Genes in Arabidopsis thaliana. PLoS Genet. 2012, 8, e1002839. [Google Scholar] [CrossRef] [Green Version]
  47. Stackhouse, P.W.; Perez, R.; Sengupta, M.; Knapp, K.; Mikovitz, J.C.; Schlemmer, J.; Scarino, B.; Zhang, T.; Cox, S.J. An Assessment of New Satellite Data Products for the Development of a Long-Term Global Solar Resource at 10–100 Km. In Proceedings of the Solar 2016 Conference, San Francisco, CA, USA, 10–14 July 2016; International Solar Energy Society: Freiburg, Germany, 2016; pp. 1–6. [Google Scholar]
  48. O’Neill, M.; Ryan, C. Grammatical Evolution. IEEE Trans. Evol. Comput. 2001, 5, 349–358. [Google Scholar] [CrossRef] [Green Version]
  49. Noorian, F.; de Silva, A.M.; Leong, P.H.W. gramEvol: Grammatical Evolution in R. J. Stat. Softw. 2016, 71, 1–26. [Google Scholar] [CrossRef] [Green Version]
  50. Kozlov, K.; Samsonov, A. DEEP—Differential Evolution Entirely Parallel Method for Gene Regulatory Networks. J. Supercomput. 2011, 57, 172–178. [Google Scholar] [CrossRef] [PubMed] [Green Version]
  51. Kozlov, K.; Samsonov, A.M.; Samsonova, M. A Software for Parameter Optimization with Differential Evolution Entirely Parallel Method. PeerJ Comput. Sci. 2016, 2, e74. [Google Scholar] [CrossRef] [Green Version]
  52. Sokolkova, A. Genome-wide association study in accessions of the mini-core collection of mungbean (Vigna radiata) from the World Vegetable Gene Bank (Taiwan). BMC Plant Biol. 2020, 20, 1–9. [Google Scholar] [CrossRef] [PubMed]
  53. Dell’Acqua, M.; Zuccolo, A.; Tuna, M.; Gianfranceschi, L.; Pè, M. Targeting Environmental Adaptation in the Monocot Model Brachypodium Distachyon: A Multi-Faceted Approach. BMC Genom. 2014, 15, 801. [Google Scholar] [CrossRef] [PubMed] [Green Version]
  54. Westengen, O.T.; Berg, P.R.; Kent, M.P.; Brysting, A.K. Spatial Structure and Climatic Adaptation in African Maize Revealed by Surveying SNP Diversity in Relation to Global Breeding and Landrace Panels. PLoS ONE 2012, 7, e47832. [Google Scholar] [CrossRef] [Green Version]
  55. Marjoram, P.; Zubair, A.; Nuzhdin, S.V. Post-GWAS: Where next? More Samples, More SNPs or More Biology? Heredity 2014, 112, 79–88. [Google Scholar] [CrossRef] [Green Version]
  56. Vadez, V.; Berger, J.D.; Warkentin, T.; Asseng, S.; Ratnakumar, P.; Rao, K.P.C.; Gaur, P.M.; Munier-Jolain, N.; Larmure, A.; Voisin, A.S.; et al. Adaptation of grain legumes to climate change: A review. Agron. Sustain. Dev. 2012, 32, 31–44. [Google Scholar] [CrossRef]
  57. Fatima, Z.; Ahmed, M.; Hussain, M.; Abbas, G.; Ul-Allah, S.; Ahmad, S.; Ahmed, N.; Ali, M.A.; Sarwar, G.; Haque, E.u.; et al. The fingerprints of climate warming on cereal crops phenology and adaptation options. Sci. Rep. 2020, 10, 18013. [Google Scholar] [CrossRef]
  58. Paudel, D.; Dareus, R.; Rosenwald, J.; Muñoz-Amatriaín, M.; Rios, E.F. Genome-Wide Association Study Reveals Candidate Genes for Flowering Time in Cowpea (Vigna unguiculata [L.] Walp.). Front. Genet. 2021, 12, 667038. [Google Scholar] [CrossRef] [PubMed]
  59. Angelotti, F.; Barbosa, L.G.; Barros, J.R.A.; Santos, C.A.F.d. Cowpea development under different temperatures and carbon dioxide concentrations. Pesqui. Agropecuária Trop. 2020, 50, e59377. [Google Scholar] [CrossRef]
  60. Li, Q.; Xu, L.; Pan, X.; Zhang, L.; Li, C.; Yang, N.; Qi, J. Modeling Phenological Responses of Inner Mongolia Grassland Species to Regional Climate Change. Environ. Res. Lett. 2016, 11, 015002. [Google Scholar] [CrossRef]
  61. Singh, P.; Nedumaran, S.; Boote, K.; Gaur, P.; Srinivas, K.; Bantilan, M. Climate change impacts and potential benefits of drought and heat tolerance in chickpea in South Asia and East Africa. Eur. J. Agron. 2014, 52, 123–137. [Google Scholar] [CrossRef] [Green Version]
  62. Craufurd, P.Q.; Wheeler, T.R. Climate change and the flowering time of annual crops. J. Exp. Bot. 2009, 60, 2529–2539. [Google Scholar] [CrossRef] [Green Version]
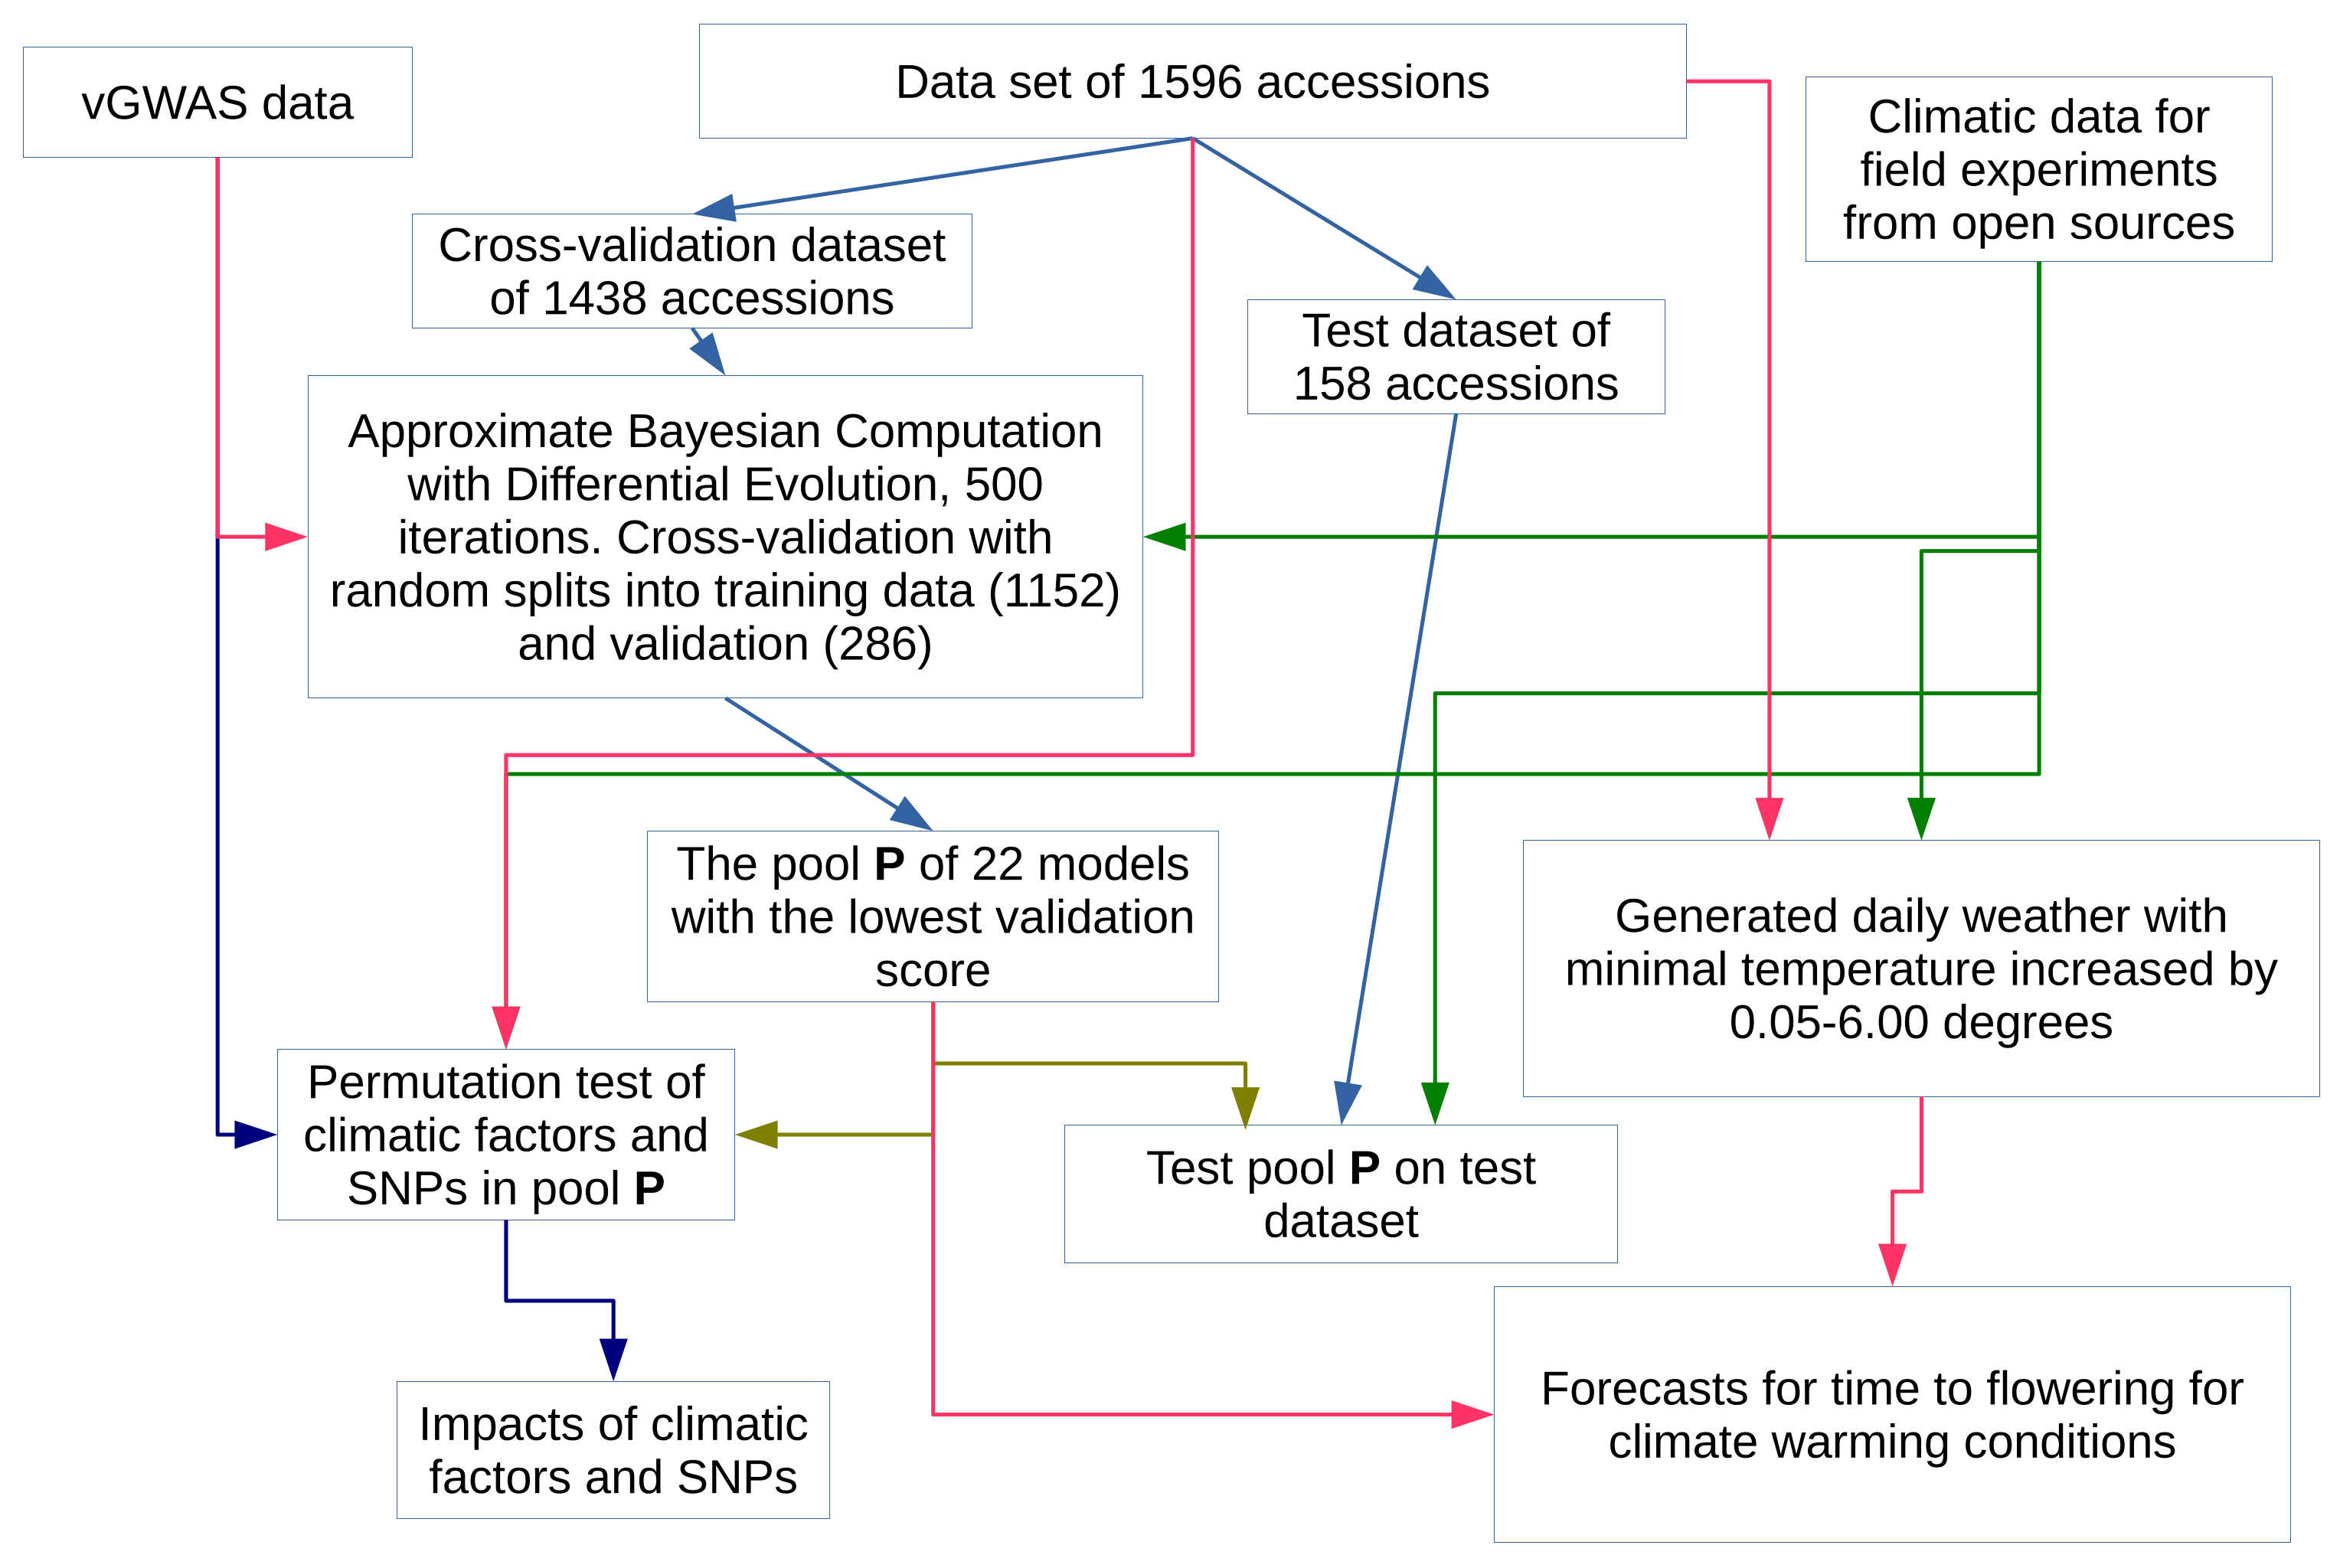
Figure 1. The overview of the research. The datasets, performed numerical experiments and results are shown as boxes on the diagram while the arrows represent the data flow.
Agronomy 11 02317 g001
Figure 2. Histogram of time to flowering for dataset.
Agronomy 11 02317 g002
Figure 3. The Pool P of individual models M k , k = 0 , , K 1 that includes control functions F n , n = 0 , , N 1 represented as trees with nodes 1, 2, 3, 6, 7 and leaves 4, 5, 8, 9. Nodes contain arithmetic operations and expressions, climatic factors day length D and minimal temperature T n are in leaves 4 and 8, respectively. Leaves 5 and 9 hold base constants for corresponding factors. For simplicity not all nodes are shown and thus some edges from 2 and 6 are unconnected. Triples of dots represent the sequences of the similar objects.
Agronomy 11 02317 g003
Figure 4. The histograms of root mean sum of squared differences between model solution and data in terms of the number of days from sowing to flowering for training and validation sets. Vertical lines correspond to the medians.
Agronomy 11 02317 g004
Figure 5. Comparison of the model solutions with data of the cross-validation dataset and the model predictions with the data of the control dataset. The slope of diagonal line is 1.
Agronomy 11 02317 g005
Figure 6. Impact of climatic factors to the model solution calculated by permutation test. The boxplots show the difference in root mean squared score in respect to days from planting to flowering.
Agronomy 11 02317 g006
Figure 7. Impact of SNPs to the model solution calculated by permutation test. The boxplots show the difference in root mean squared score in respect to days from planting to flowering.
Agronomy 11 02317 g007
Figure 8. Prediction of time to flowering for samples with an error less then 12 days with increased temperature. The difference between pool prediction and data is plotted against the temperature increment. Lines of different color represent different samples. (A) Samples with decreasing time to flowering. (B) Samples with increasing time to flowering. (C) Samples with variation of time to flowering less than 5. (D) Samples with variation of time to flowering greater or equal 5 days and less or equal 10 days.
Agronomy 11 02317 g008
Figure 9. Pearson correlation coefficient between SNP value and the change in time to flowering (A); maximum slope (B); maximum rate of change of the slope (C); standard deviation of time to flowering (D). The significance is marked with asterisk; 0.001 p_value < 0.01 : **; p_value < 0.001 : ***.
Agronomy 11 02317 g009
Table 1. Information on field experiments.
Date of SowingDate of HarvestGeographical Coordinates
28/08/198424/10/1984N 23 ° 6 50 E 120 ° 17 55
17/09/198503/10/1985N 23 ° 6 50 E 120 ° 17 55
16/06/201622/08 to mid-SeptemberN 17 ° 30 28 E 78 ° 16 10
21/09/2018from 24–28 December 2018N 23 ° 6 50 E 120 ° 17 55
03/05/2018from mid-JulyN 45 ° 18 E 40 ° 52
12/05/2018from mid-JulyN 46 ° 14 E 48 ° 01
Table 2. Selected 15 SNPs.
NumChrPosMajorMinor
0NC_028351.110609109TC
1NC_028352.11756685AT
2NC_028353.14083774AT
3NC_028353.17715763TC
4NC_028354.119007443TC
5NC_028354.119193706AT
6NC_028356.15599756CA
7NC_028356.118228698CT
8NC_028357.136154036GT
9NC_028357.151548743TC
10NC_028358.142385899GT
11NC_028358.143289540TC
12NC_028358.143289553GA
13NC_028361.110688905AC
14NW_014541837.11074368CT
Table 3. Error estimates for 22 selected models for cross-validation (CR) and test sets (TE). Pearson correlation coefficient (PCC), median (MED) and root mean square (RMS) difference in the number of day to flowering between model solution and data.
CR PCCCR MEDCR RMSTE PCCTE MEDTE RMS
00.97711.910.98812.19
10.97611.550.98711.75
20.97712.090.98712.71
30.97812.600.97812.20
40.97612.260.97712.44
50.97712.650.97713.90
60.97712.730.97813.46
70.97612.320.94719.19
80.97612.000.98712.14
90.97611.230.98711.64
100.97712.670.98713.54
110.97812.930.96914.62
120.97712.300.98711.84
130.97812.480.97912.96
140.97812.770.97812.78
150.97813.130.97913.06
160.96613.600.96715.79
170.971013.110.961014.66
180.97813.350.97913.62
190.971013.190.971012.66
200.97713.470.98712.74
210.961114.510.971114.33
Publisher’s Note: MDPI stays neutral with regard to jurisdictional claims in published maps and institutional affiliations.