Article

Methodological Advances in the Design of Photovoltaic Irrigation

by
Martín Calero-Lara
1,*,
Rafael López-Luque
2 and
Francisco José Casares
1
1
Department of Electrical Engineering and Automatic Control, Campus of Rabanales, University of Córdoba, 14071 Córdoba, Spain
2
Department of Applied Physics, Campus of Rabanales, University of Córdoba, 14071 Córdoba, Spain
*
Author to whom correspondence should be addressed.
Agronomy 2021, 11(11), 2313; https://doi.org/10.3390/agronomy11112313
Submission received: 1 October 2021 / Revised: 3 November 2021 / Accepted: 9 November 2021 / Published: 16 November 2021

Abstract

:
In this study, an algorithm has been developed that manages photovoltaic solar energy in such a manner that all generated power is delivered to the system formed by a pump and irrigation network with compensated emitters. The algorithm is based on the daily work matrix that is updated daily by considering water and energy balances. The algorithm determines an irrigation priority for the sectors of irrigation of the farm based on programmed irrigation time and water deficits in the soil and synchronises the energy produced with the energy requirement of the hydraulic system according to the priority set for each day, obtaining the combinations of irrigation sectors appropriate to the photovoltaic power available. It takes into account the increment/decrease in the pressure of the water distribution network in response to increases/decreases in photovoltaic energy by increasing/decreasing the rotational speed of the pump, thus increasing/decreasing the power transferred to the system. The application to a real case of a 10-hectare farm divided into four sectors implies an efficient use of the energy of 26.15% per year and savings in CO2 emissions of 6.29 tonnes per year.

1. Introduction

The transformation of irrigation systems on farms, using pressurised irrigation networks, has resulted in better water efficiency, but large amounts of energy are also required for the extraction, transport and distribution of irrigation water [1]. In general, irrigation networks use electrical energy from the electrical system. In isolated areas that the electricity grid does not reach, the main source of energy comes from a diesel engine. The notable increase in the use of these energy sources has resulted in a notable increase in CO2 emissions.
Solar energy for pumping irrigation water is a promising alternative to conventional pumping systems that use diesel and electric power sources [2,3]. It consists of converting solar energy into electrical energy, which is used to move the water pump that raises the water to a reservoir or places pressure on the irrigation network. Photovoltaic pumping technology is considered a sustainable and economical solution for providing water for irrigation. The proper design and operation depend significantly on available solar irradiance, the water demand of the crop, water resources and the profit corresponding to the sale of the crop [4]. In addition, it is a sustainable solution that reduces greenhouse gas (GHG) emissions.
The price of the flat solar panel has fallen in the last decade by 85% [5] reaching EUR 0.5/Wp, and the rapid evolutions of electronic solutions that allow the conversion of direct current into alternating current, at increasingly competitive prices, have been some of the factors that have made it possible for photovoltaic irrigation systems to be more profitable [6].
One of the main problems faced by irrigation systems based on renewable energy is the seasonal pattern of demand for crops [7] and the variability of renewable energy production. The photovoltaic solar water pumping system is one of the best technologies using solar energy to pump water from deep well underground sources and provides drinking water [8].
Many researchers have studied water pumping systems using photovoltaic solar energy as an energy source with and without storage systems in a battery and/or water storage in a tank in order to match the demand to the supply of energy.
Battery coupling allows the storage of electrical energy that photovoltaic panels convert from solar energy during the day. Batteries supply electrical power to the water lift pump when required. The use of batteries ensures the pumping of water when radiation is low, such as on cloudy days or even at night [9,10]. However, the use of batteries has several disadvantages such as increased investment costs of the system, the space required to store the batteries and environmental concerns related to their disposal [11].
Another possibility is to combine the production of renewable energy with the demand for the irrigation of crops, storing pumped water in an elevated tank. The water is distributed to the plants by gravity [12,13,14]. However, in many cases there is no place with enough elevation to build a reservoir to take advantage of gravitational energy to distribute irrigation water. In this case, a booster station is required to supply water with the pressure required to be discharged through the emitters. In other cases, the elevated locations may be relatively far away and the cost of building these elevated reservoirs may be unaffordable.
Other authors, in order to guarantee the supply of electrical energy in a continuous and stable manner, use hybrid systems that combine photovoltaic energy and other energy sources such as wind or the electrical distribution network or diesel generator, even with energy storage [15,16,17,18,19,20,21,22].
In order to avoid the disadvantages of energy storage, mentioned before, other authors [11,23,24,25,26,27,28,29] proposed an independent direct pumping photovoltaic irrigation system, which pumps water directly to the irrigation distribution network instead of elevating it to an elevated reservoir. The system can only pump water when solar energy is sufficient to drive the pump. It is a simple and low-cost system compared to energy storage.
Regarding modelling and the management of energy and the irrigation system [30,31,32], Cuadros et al. [33] proposed a procedure for estimating the size of a photovoltaic installation to feed a pumping system for drip irrigation of an olive grove in Southwestern Spain. They affirm that the main stages are as follows: determine the irrigation requirements of the specific farm, according to the characteristics of its soil type and the local climate; hydraulic analysis of the pumping system according to the depth of the aquifer and the height necessary to stabilize the pressure in the water distribution network; and determine the maximum photovoltaic power required for the farm, taking into account the overall performance of the photovoltaic-irrigation pump system.
Glasnovic and Margeta [25] analysed all the relevant elements of the system and their characteristics of the photovoltaic water pumping system, the local climate, the well, the cultivation and the irrigation method. With this, they defined the objective function, including all the components of the system during the entire period in which the system was operating (irrigation season).
Campana et al. [26] developed a dynamic modeling tool for the design of a photovoltaic water pumping system by combining the models of water demand, photovoltaic solar energy and the pumping system, verifying the balance between the water requirements of the crop and the water obtained from the photovoltaic water pumping system. They evaluated the demand for water for irrigation and solar energy in order to optimise the size of the system. In [34], they proposed that the control unit has to interact between water demand and water supply in order to pump only the amount required by the crop. This method is based on the availability and response of water resources. It aims to save water and optimise energy use.
López-Luque et al. [11] proposed an autonomous direct pumping photovoltaic irrigation system for the irrigation of olive trees. They developed a simulation system in order to obtain an economically optimal design. The model is made up of different sub-models. It simulates the balance of water and energy in the photovoltaic irrigation system, which applies water by using non-compensated emitters; thus, the amount of water applied to irrigation is variable and depends on the energy provided by the photovoltaic panels. For this, a variable speed water pump was used depending on the power generated.
Reca et al. [28] developed a simulation system to analyse the viability of an autonomous direct pumping photovoltaic system for irrigation in greenhouses. The model followed is based on the of López-Luque et al. Reca et al. added the analysis of the effect of the number of irrigation sectors with two management strategies: irrigate a single irrigation sector simultaneously or irrigate with a variable number of sectors depending on the power provided by the photovoltaic panels. They claim that the first option provides optimal operation as it does not result in an increase in the investment in more pumps.
Mérida et al. [35] developed a model of a manager to synchronise the availability of photovoltaic energy and the energy necessary to pump the water necessary for irrigation of different irrigation sectors in which the farm has been divided. They integrated the main management variables of the photovoltaic system, the irrigation system, including the daily irrigation needs, the hydraulic behaviour of the irrigation network, the production of instantaneous photovoltaic energy and the daily water balance of the soil into the calculation modules. The lack of photovoltaic energy during the hours of any day of the irrigation season is balanced by the water stored in the soil or the duration of irrigation is prolonged in the following days when necessary. The authors defined the photovoltaic threshold required to irrigate each sector and proposed prioritising the irrigation of the sector with the lowest requirement to the one with the highest power requirement. Every time the photovoltaic energy generated by the photovoltaic panels exceeds the energy needs of that sector, irrigation can be applied. Once the sector has satisfied its irrigation needs, the algorithm selects the sector with the next highest requirements, repeating the process.
Zavala et al. [36] proposed a new model aimed at optimising the operation of a multisectorial direct pumping photovoltaic irrigation system. The model considers the possibility of operating a variable number of irrigation sectors simultaneously and provides an optimal irrigation operation that maximises the efficiency of the energy use of the system. The proposed system consists of a photovoltaic matrix that provides electricity, a frequency converter that changes the speed of an electric motor, a pump to raise the water and to give pressure to the irrigation network and a set of solenoid valves that control irrigation relative to the different sectors. The computer program developed enables the simulation of the performance of photovoltaic irrigation with the mathematical models of each of the components. In their conclusions, they affirm that the operation strategies affect the hydraulic and agronomic design of the irrigation system.
After a review of the literature, the authors found that there is a lack of a model that allows the integration of all the subsystems, and it can even be implemented in an electronic device. Within this scope, the study presented in this paper proposes a new management model for the photovoltaic energy generated, which is aimed at optimising the operation of a multisectoral direct-pumped photovoltaic irrigation system. The model considers all the intervening submodels, namely the following: the demand for crop water, according to the agronomic study throughout the irrigation season; the local climate; the irrigation water distribution network; the pump for lifting and loading the network, which varies markedly depending on the number of sectors that are irrigated simultaneously; the induction electric motor, considering the variation of its performance according to the load regime; the variable speed drive, affected by its performance; and the electrical power generated by the photovoltaic array at each simulation time instant. The drip irrigation water emitters have been considered compensated, since the land is uneven on real farms. The operation of the system is known as constant flow and pressure. The novelty of the management model lies in the use of a daily work matrix for which its data varies throughout the day and collects information on the amount of irrigation water applied and the amount remaining, the precipitation produced, the evapotranspiration of the crop and the priority of irrigation of the sectors according to the criteria considered. These data are used to make the algorithm’s decision on the order of irrigation of the sectors, taking into account the water deficit of each sector, at the beginning of the day. The model has been applied to an olive grove farm with drip irrigation, but we consider that it can be applied to other types of crops.

2. Materials and Methods

2.1. General Description of the Photovoltaic Irrigation System

The photovoltaic irrigation system proposed in this work is known as independent direct pumping in which the water is pumped directly to the irrigation distribution network instead of raising it to a reservoir. The proposed system consists of a photovoltaic generator that provides electrical energy to power a hydraulic pump at variable speed. The water is applied to the crop through the distribution network and through compensated emitters that keep the discharge flow constant within a range of working pressures. In this manner, the flow of water pumped through the system is constant.
Since the power supplied by the photovoltaic generator is variable throughout the day depending on the incident radiation, the power consumed by the pump can be modified by varying the angular speed of the pump to match the power generated. Thus, the irradiance variations in the PV generator are transmitted to the hydraulic system, producing pressure variations in the network in the same direction, through the variation of the pump speed.
In addition, to make better use of the energy generated by the photovoltaic system, the irrigation network is divided into sectors. In this manner, multiple sectors can be irrigated depending on the balance between the power generated by the photovoltaic system and the power demanded by the multisectoral irrigation system. A scheme of the proposed system is illustrated in Figure 1 and is applied to an olive grove farm.
A set of computer tools has been developed that allow the simulation and analysis of a photovoltaic irrigation system with the characteristics described. The simulation uses mathematical models of the components of the system: photovoltaic generator, frequency converter, electric motor, pump and irrigation network. These models are described in Appendix A and Appendix B.

2.2. Crop Water Requirements

It is important to know the water requirements of the crop in order to carry out the irrigation scheduling of the farm.
The FAO method is used to calculate crop water requirements [37]. According to this methodology, the evapotranspiration of the crop, ETc, is calculated with Equation (1):
E T c = K c   E T o
where Kc is a specific coefficient for the crop, which is the ratio between the evapotranspiration of a specific crop to the evapotranspiration of the reference crop and depends on various factors and the crop cycle [38,39]. ETo is the reference evapotranspiration, which has been calculated by using the Penman–Monteith–FAO equation.
The rooting zone of the plant is considered as a reservoir that has water inlets and outlets. The water inputs to the reservoir are the effective precipitation, Pef, defined as a part of the rainwater that is effectively filtered and stored in the soil [40]. The net irrigation, Rn, which is calculated by applying an irrigation efficiency factor to the gross value of the applied irrigation and possibly by capillary ascent from deeper layers, is considered negligible. The water leaks from the tank are due to the evapotranspiration of the crop, ETc and to water seepage to deeper layers, which are considered negligible.
Applying the principle of the conservation of mass, the difference between the water inlets and outlets must be equal to the variation in the amount of water stored in the soil. If this water balance is applied in periods of time of one day, j, it is expressed by the equation of the soil water balance by Equation (2) [37].
D j = D j 1 + E T c , j P e f , j R n , j
The soil, in the root zone, has an upper limit of water storage called field capacity, FC, which is the amount of water that the soil can retain against gravity after being abundantly wet and after allowing it to drain. The lower limit is called the permanent wilting point, PWP, which is the amount of water left in the soil when the plant permanently wilts because it can no longer extract water from the soil. The amount of total water available in the soil is stored between these two limits and is called the Available Moisture Interval, TAW. In irrigation practice, only a percentage of the TAW is allowed to deplete, since the plant begins to experience water stress. This percentage is called the allowable depletion level, RAW [11,25].
Irrigation scheduling has been based on the assessment of water balance (Equation (2)) applied to each month of the calendar year and obtaining a weekly irrigation schedule for the irrigation campaign.

2.3. Supply and Demand Management: Daily Work Matrix

The number of possible combinations of sectors that are being irrigated, C, corresponds to the sum of the combinations without repetition of the s sectors into which the irrigation network has been divided, taken into groups of 1, 2, 3, … and s sectors. Formula (3) enables the calculation of the total number of combinations.
C = C 1 s + C 2 s + C 3 s + + C s s = ( s 1 ) + ( s 2 ) + ( s 3 ) + + ( s s ) = 2 s 1
If each combination is assigned a natural number from the set {1, 2, …, C}, the binary number of each element represents the sectors that are in irrigation in each combination. The number of bits matches the number of sectors, s.
For a farm, in which the irrigation network has been divided into s sectors, the pressure and flow in the irrigation head and the power in the necessary pump axis are determined so that the most unfavourable emitter maintains the minimum working pressure in each of the possible combinations. For those pump shaft powers, Ps, a generated electrical power, PG, is needed according to Equation (4). The calculated power steps determine the minimum generated power levels necessary to maintain the considered combination of sectors in irrigation (see Figure 2).
P G = P s η V F D η m o t o r
These operating points correspond to the boundary values used by the management algorithm to order irrigation to a greater or lesser number of sectors. Table 1 shows the power demand matrix for s sectors.
In Table 1, Q1s and H1s are the necessary flow and pressure in the irrigation head for when a single sector is irrigated, which will be the one with the highest irrigation priority; PG1s is the electrical power required in the photovoltaic generator for the above conditions. Similarly, Q2s and H2s are the necessary flow and pressure in the irrigation head for the combination of the two sectors that present the highest irrigation priorities. Moreover, the electrical power required to supply two irrigation sectors is PG2s (column 4 of Table 1).
Once the effective power supply of the photovoltaic generator, PG, and also the demand powers of the variator-motor-pump-irrigation network system (PG1s, PG2s, PG3s, …) are known, both powers are compared in order to perform the simulation of the irrigation system and to comprehend the minutes of irrigation of each sector and the evolution of the water deficit in the soil (D) in a period of time (in general the simulation is annual or per irrigation campaign).
The distribution of supply power, PG, to each combination of sectors, at each moment considered, is carried out according to the real irrigation needs presented by the soil, which depends on the irrigation schedule carried out a priori, and the balance of water on the ground.
In order to achieve this objective, a matrix of values is used called the daily work matrix, which contains the relevant data for decision making in the sector or sectors with the greatest irrigation needs and which, therefore, the power offered by the generation system is destined to these sectors. In this matrix, other data of the system are written and vary throughout the day, and it is interesting to note its evolution in the study period (applied irrigation, D, …) or to note what is necessary for making watering decisions the next day.
Row 1 (Table 2) of the daily work matrix contains the order numbers of the sectors. Row 2 stores the irrigation demand programmed for day ‘j’, the value of which is taken from the irrigation calendar carried out for the study period. Watering scheduling is typically performed in minutes. For this study, the programming has been conducted in multiples of 15 min. In row 3, the pending irrigation time (not performed) of the previous day ‘j−1’ is copied. Row 4 records the irrigation time pending execution. At the beginning of day ‘j’, it is the sum of rows 2 and 3, but as the day progresses, the irrigation times of each sector are subtracted. Row 5 contains the soil water deficit (D) values at the beginning of day ‘j’, which is taken from daily work matrix of the previous day (row 7). Row 6 records the risks that are applied to each sector in each time interval of the supply matrix, expressed in mm of water. Row 7 contains the updated D values (row 5–row 6). At the end of the day, the rainfall and evapotranspiration update for that day is carried out. Row 8 contains the irrigation order of each sector determined according to the water needs of the sector. Row 9 reflects the combination of sectors for multisectoral irrigation, according to the priority set in row 8. Row 10 contains the data of electrical power required by the irrigation network to cover the irrigation needs of programs for that day, ‘j’, according to the combination of sectors set in row 9. These data are updated as the programmed irrigation times of each sector become completed. The data in this row ordered by the priority of the sectors (priority 1 to priority s) provide the power demand curve or vector of the irrigation network. Row 11 reflects the sectors that are in irrigation at each of the instants of the time intervals of the supply matrix. It is indicated with a 0 if the sector is not in irrigation and with 1 if the sector is receiving irrigation. When any sector reaches zero value in row 4, this means that the sector has completed the programmed amount of irrigation, and the power demand curve is updated.
The determination of the irrigation priority of a sector is carried out at the beginning of each day and based on two criteria: (a) it gives a priority of one (first to irrigate) to the sector with the longest programmed irrigation time. This time is the sum of the time programmed for day ‘j’ and the pending irrigation time of the previous day, which corresponds to row 4 of the daily work matrix for day ‘j−1’. The other priority criterion (b) gives irrigation preference to the sector that presents a greater deficit of water in the soil, registered in row 5, at the beginning of the day. The total priority is the sum of the two priorities. The priority remains for the entire day. In the event of a tie, the sector that requires the longest watering time has priority.
If rainfall results in an overflow of the soil’s field capacity, the scheduled irrigation is canceled.
For each day of the simulation period, at the beginning of this, the daily work matrix described above is constructed (Table 3). For each instant in time of the photovoltaic generator power supply matrix corresponding to day ‘j’, the demand vector is taken from row 10 of the daily work matrix. This demand vector contains the necessary power steps to achieve multisectoral irrigation according to the set combination of sectors.
Each datum of the supply matrix (PG) is compared with the demand vector ordered from lowest to highest. If there is no need for irrigation in any sector (row 9 = 0 of daily work matrix) or the supply power is less than the lower step of the demand vector, obviously, no sector will enter into irrigation, and the solenoid valves will remain closed (state = 0). In the opposite case, if the supply power is greater than the highest step of the demand vector, all sectors that have irrigation assigned and, therefore, possess an order of priority other than zero (row 8 ≠ 0) open the corresponding solenoid valve (state = 1). For the next steps of the demand vector, with a power supply (PG) greater than or equal to the first element of the demand vector and less than the second element, the sectors that open the solenoid valves are those with assigned irrigation, and the irrigation priority order is less than two, which corresponds to the first step of power with a single sector in irrigation; in the next step, they irrigate the sectors that have assigned irrigation and their priority is less than three, and so on until reaching the last step (Table 4).
In order to update the daily work matrix for the next instant of time, to each active sector, in row 4 the irrigation time is subtracted (time difference with the previous data) from row 6, which is the net irrigation carried out during that time, and in row 7 the net irrigation is subtracted, thus updating the water deficit in the soil.
If any of the sectors reaches the end of the irrigation time, that sector is subtracted from the rest of the sectors so that the priority of that sector is ‘0’, and the rest of the lower priorities diminishes by one unit. This sector is assigned a combination (row 9) of value ‘0’ and a demand power of value ‘0’. Lower priority multi-sector irrigation combinations are reduced by the decimal value of the sector that has finished its irrigation time (see Table 1).
At the end of day ‘j’, the water balance in the soil is made by subtracting in each sector, in row 7, the value of the effective precipitation (Pef) and adding the evapotranspiration of the crop for that day (ETc) (Equation (2)). Data on daily precipitation and evapotranspiration of the daily crop are available. The programmed irrigation time is obtained from the agronomic study of the farm.
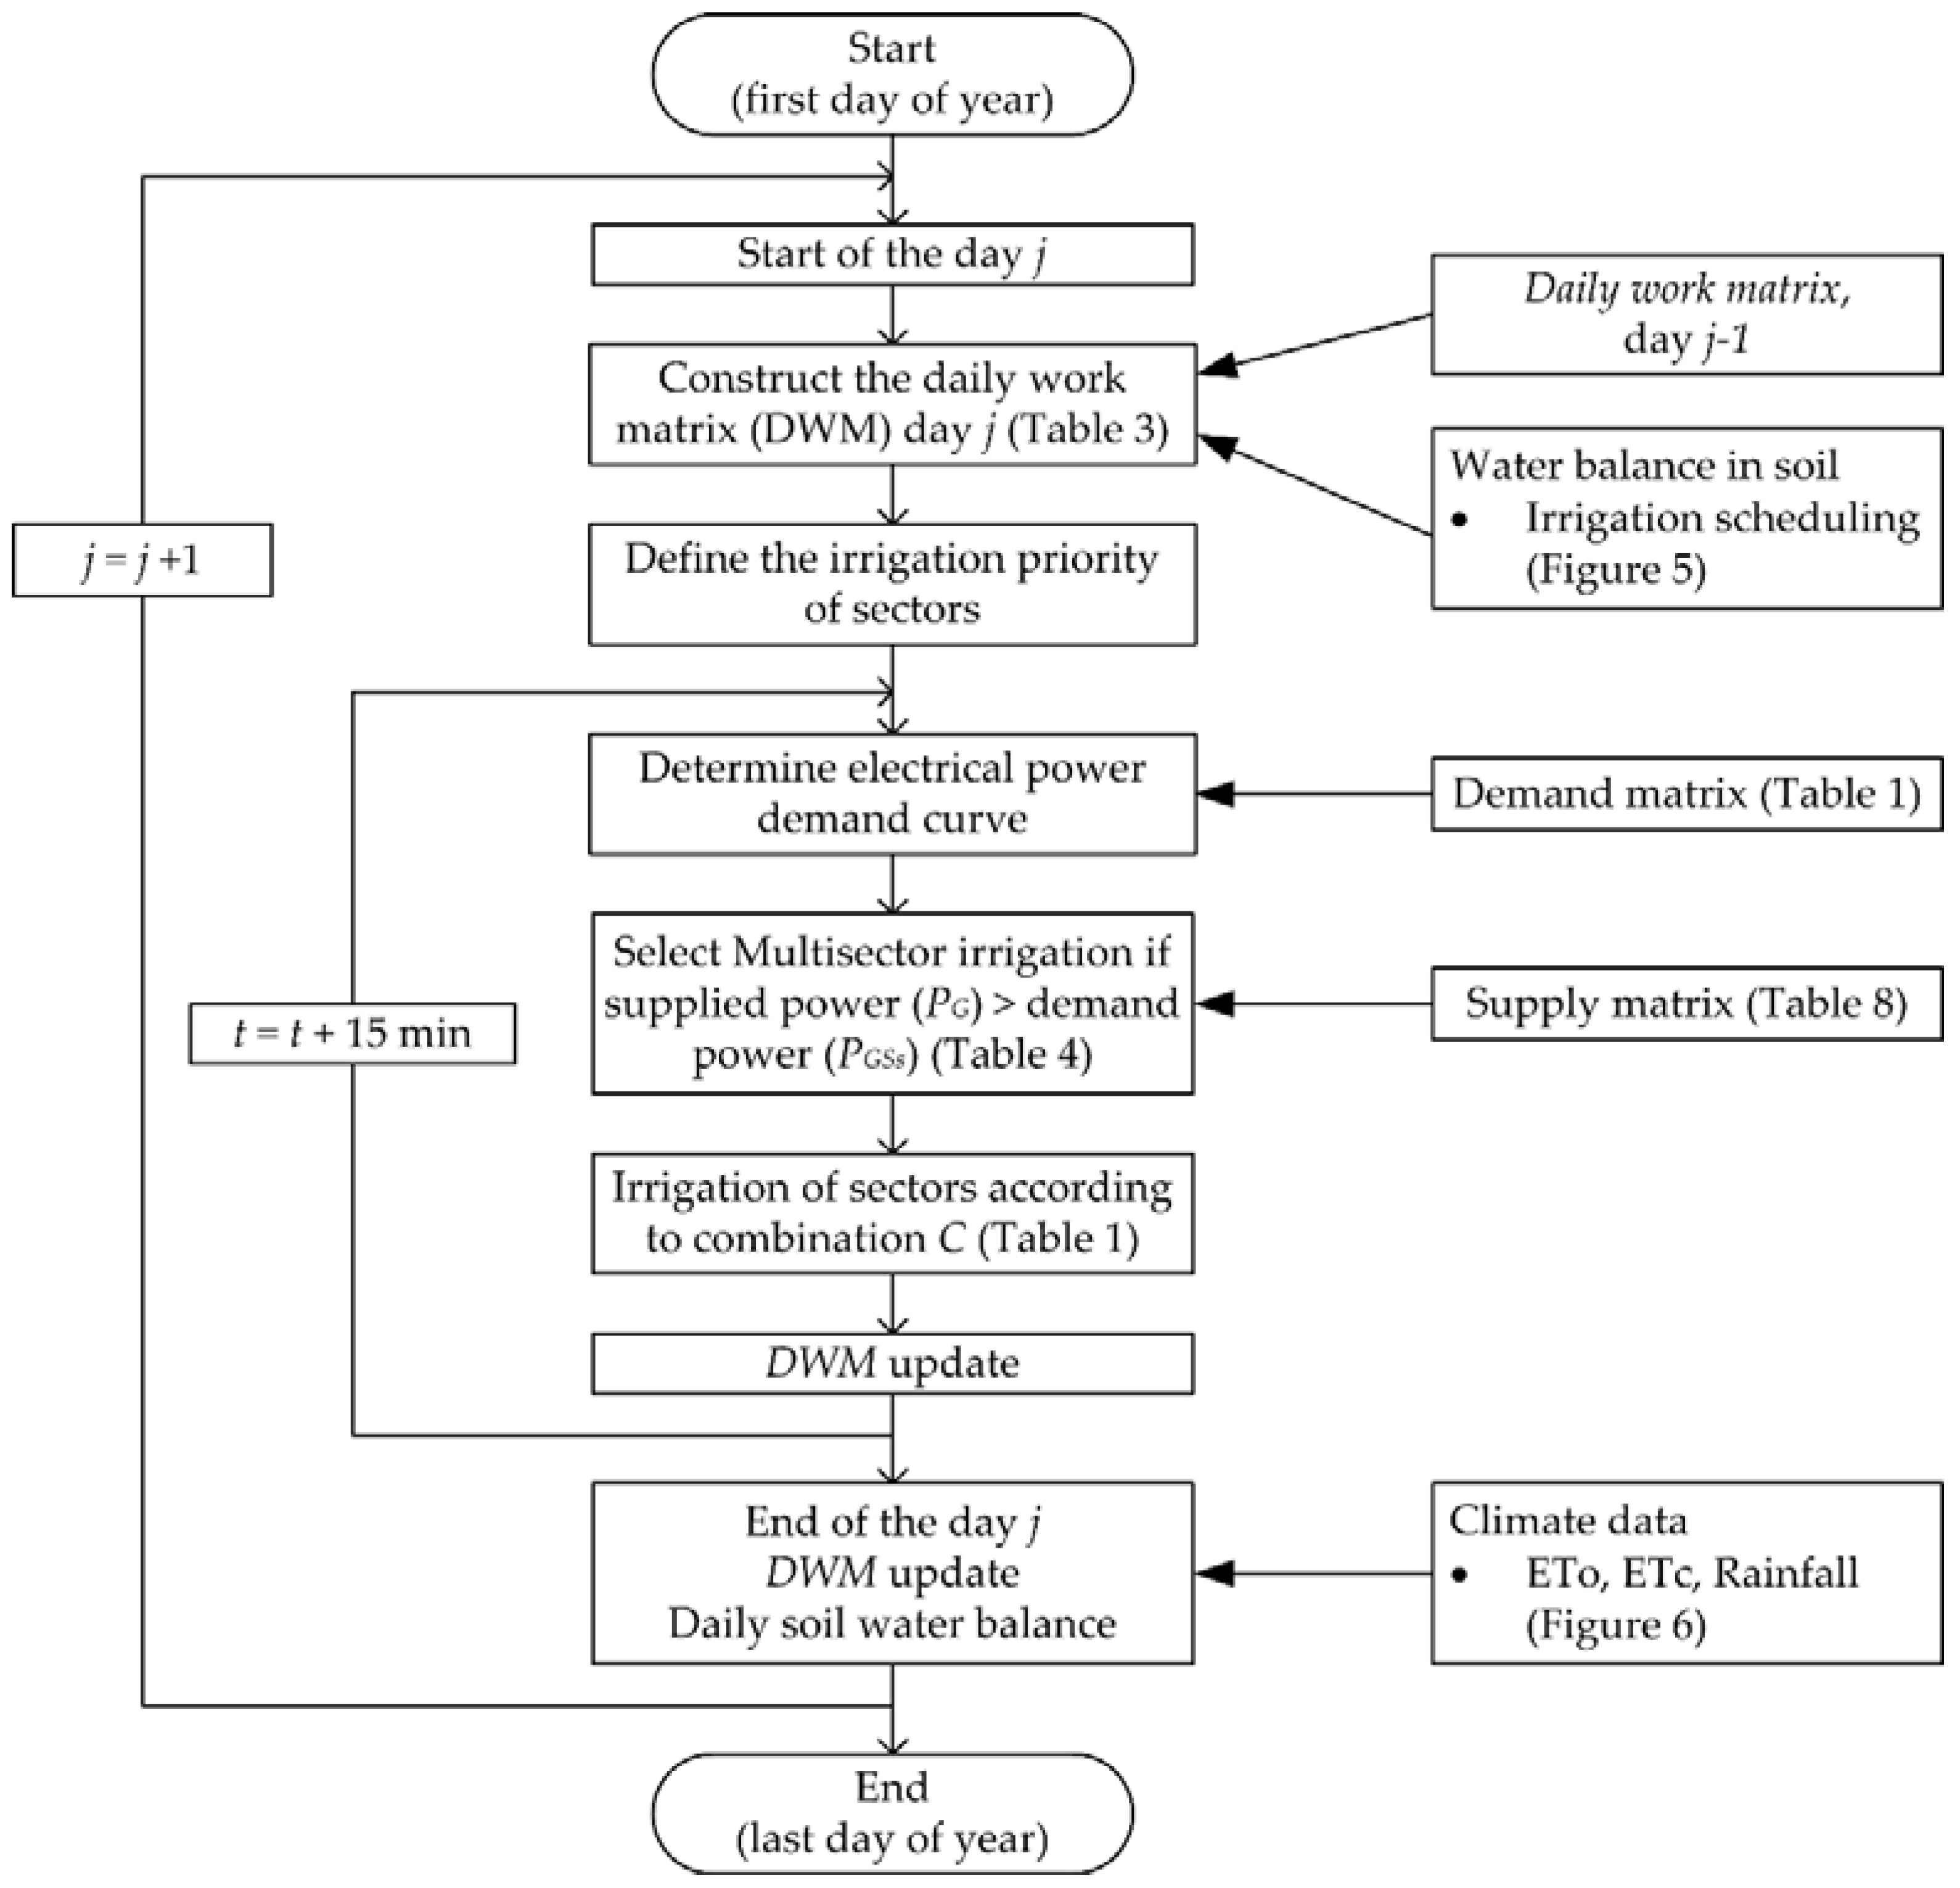
Figure 3 shows a flowchart that summarises the developed methodology.

3. Case Study

In order to test the methodology developed, a simulated case has been proposed on a real estate of intensive olive groves (Olea Europea, var. Arbequina), with plants of 10 years of age.
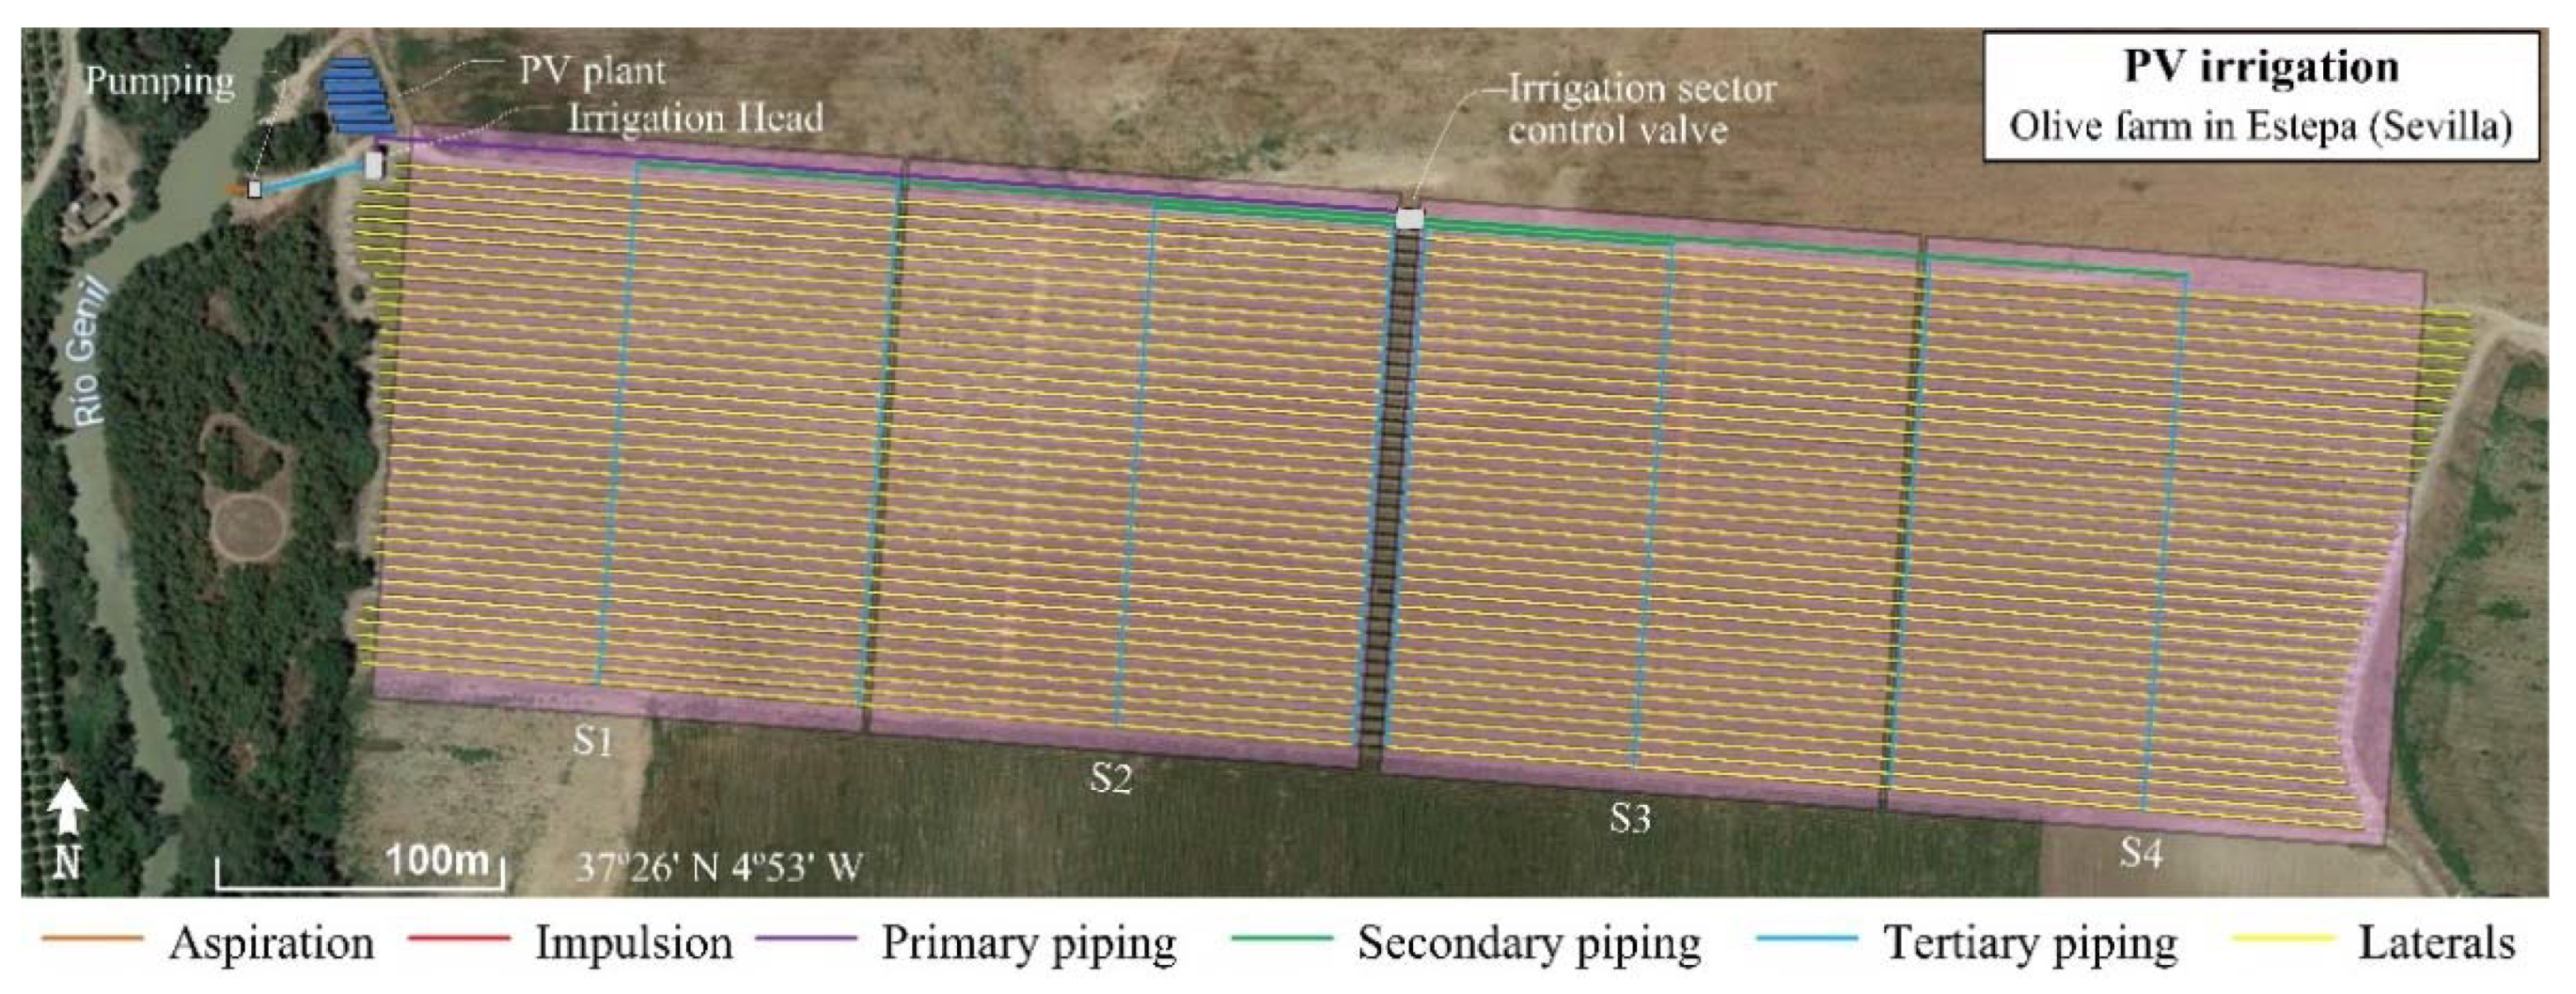
The farm on which this simulation has been carried out is located in the municipality of Estepa, in the Sierra Sur region of Sevilla, located at 37°26′ N, 4°52′ W and 157 m above sea level, in the Southern Spain (Figure 4). It has a subtropical Mediterranean climate in which high summer temperatures and low rainfall prevail and are more abundant in autumn and spring. The annual average temperature oscillates between 14 °C and 19 °C, with the average temperature in the coldest month between 6 °C and 10 °C, and the average temperature in the warmest month is between 21 °C and 30 °C. The months with the lowest temperatures are December, January and February, coinciding with relatively high rainfall mainly in November. In July and August, it reaches 36 °C.
The agronomic characteristics are indicated in Table 5.
The soil of the farm is a loamy-clay type soil, and its characteristics are shown in Table 6.
Irrigation water needs were determined from real climatic data taken from the Santaella agroclimatic station, which belongs to the network of agroclimatic stations of Junta de Andalucía, which is close to the location of the farm. The station is located at 37°31′ N and 4°53′ W and at 196 m above sea level. Average values have been taken from the years 2004 to 2018.
The generator configuration is made up of 8 strings of 20 panels in series, inclined 15° and oriented to the south according to the previous study carried out, occupying an area of approximately 364 m2. The support structure of the solar panels is on the ground. The technical characteristics of the panels are presented in Table 7.
The irrigation system of this farm is divided into four sectors and eight irrigation units. The compensated emitters are of constant 2.2 L/h, with working pressures between 1 and 3.5 bar. The side pipes are made of 16 mm diameter LDPE and incorporate an integrated emitter every 0.5 m. The tertiary pipes are 75 mm LDPE. The secondary distribution pipe network is made of PVC with diameters 110 mm and 90 mm. The main pipe is PVC of 160 mm in diameter. The discharge and suction pipes are made of ductile iron with a diameter of 125 mm.
Irrigation scheduling has been carried out with progressive depletion of the soil water reserve (D) [42]. The crop evapotranspiration (ETc) values have been determined by applying the crop coefficients (Kc) provided in [43] to the monthly mean ETo values obtained from the Santaella meteorological station.
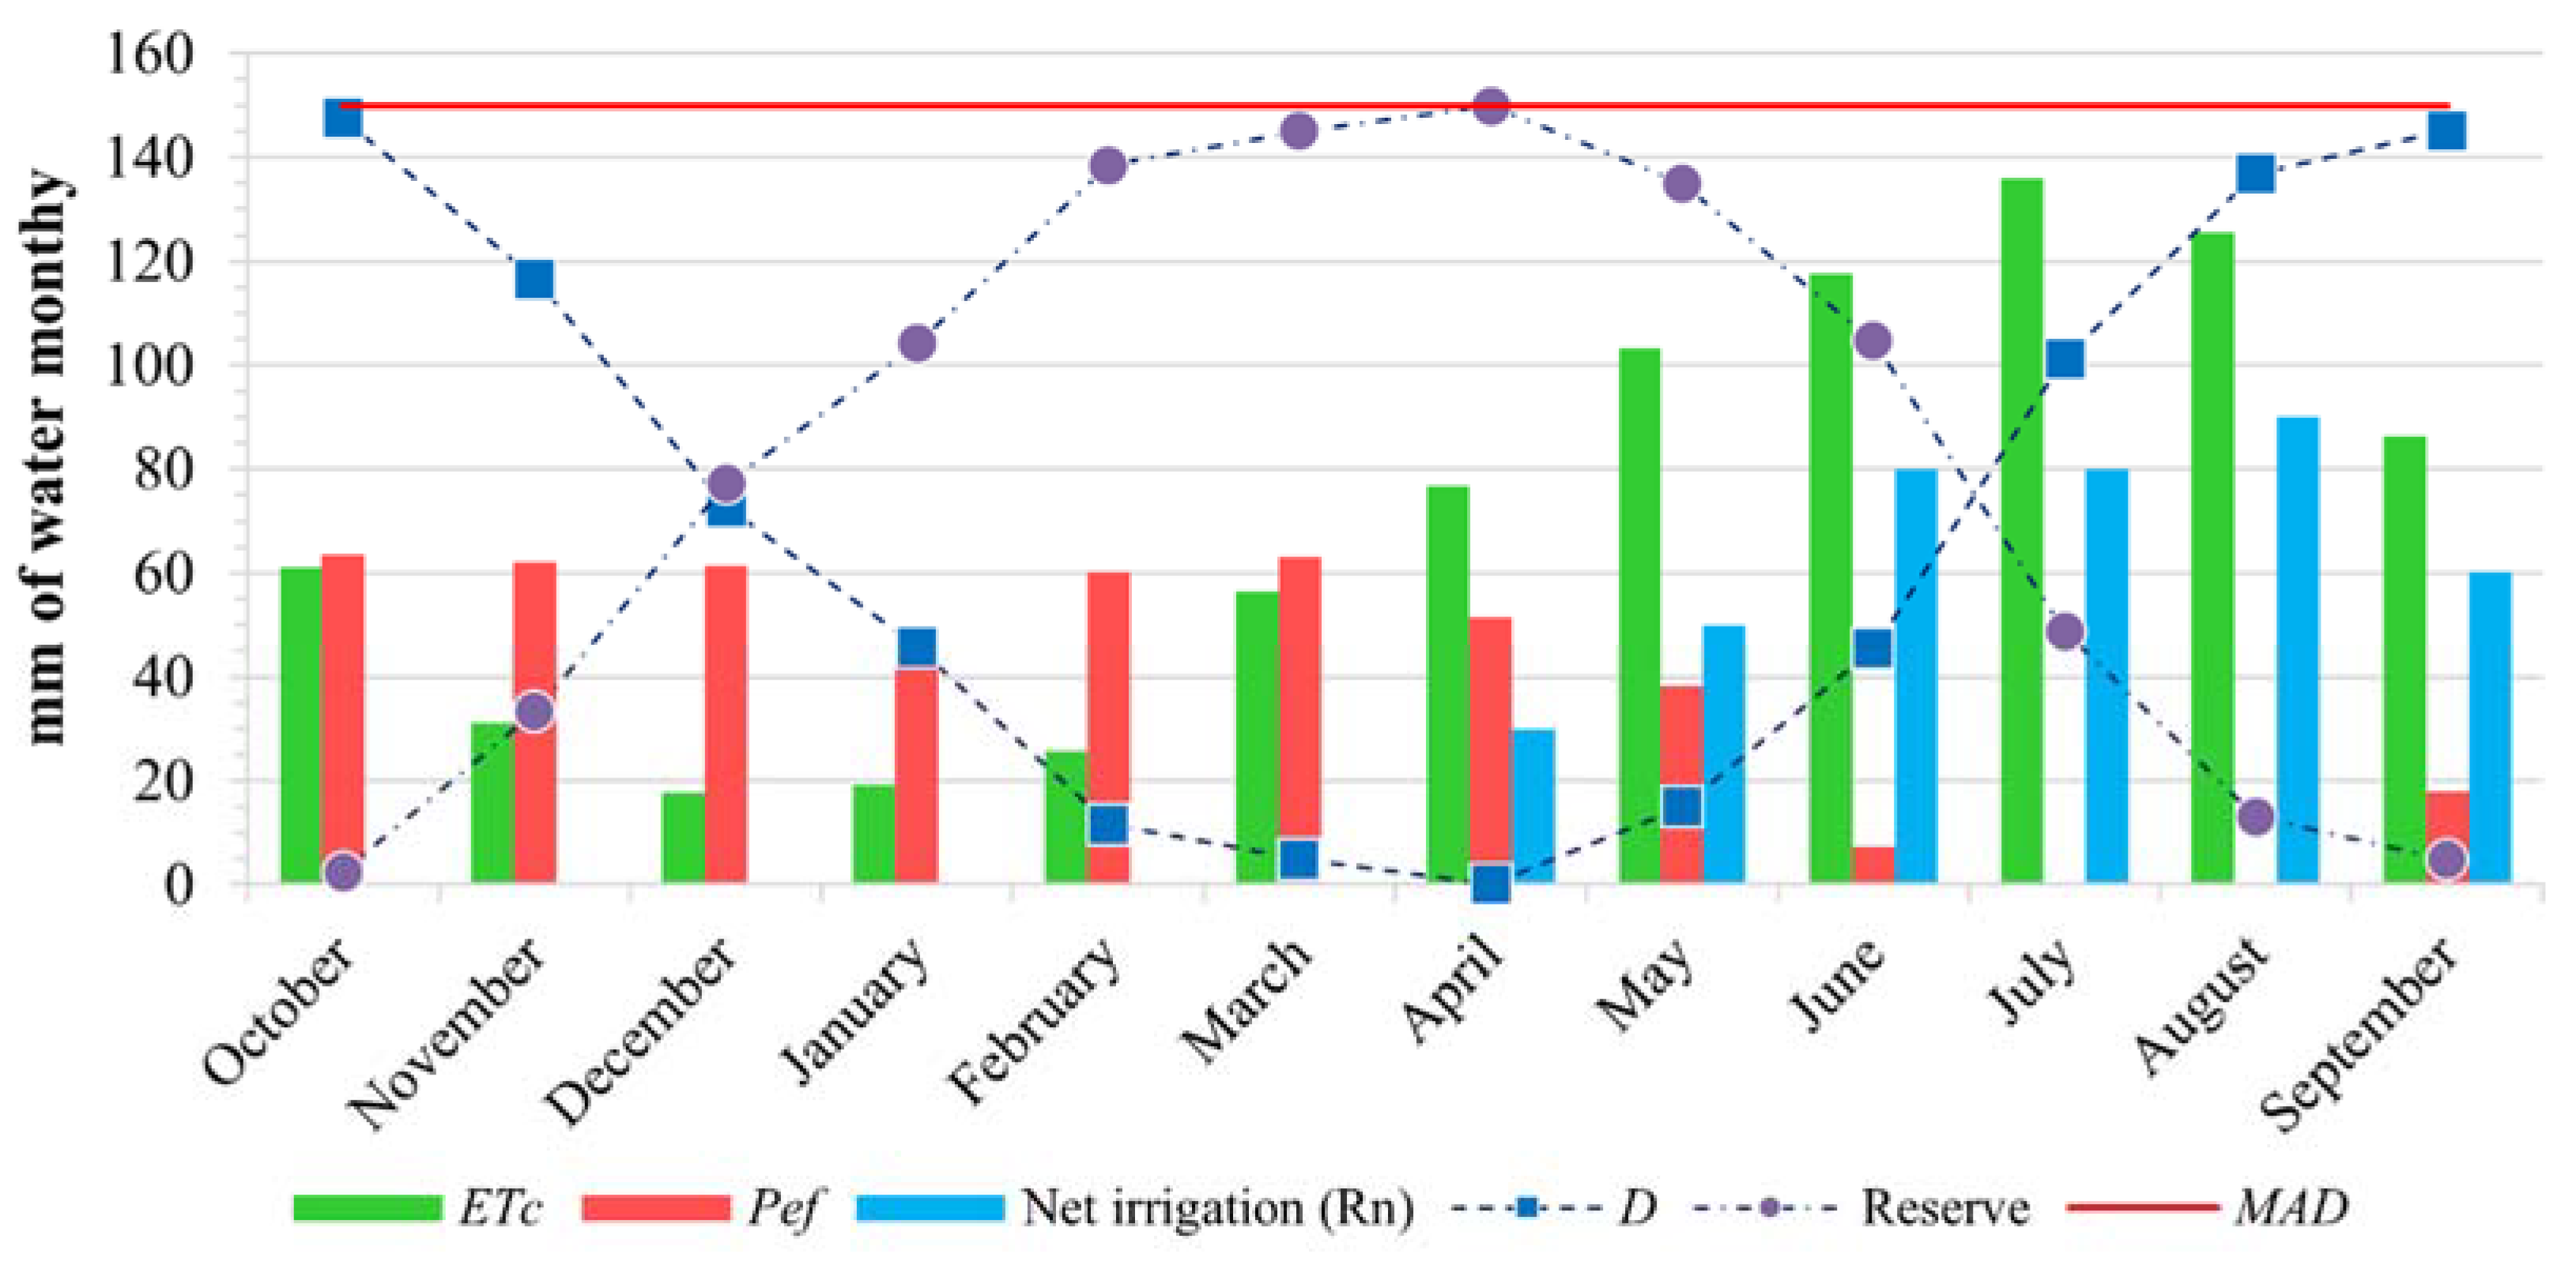
Figure 5 shows the annual evolution of the water reserve in the soil and the amounts of irrigation water that have to be supplied during each month, according to the schedule indicated above.
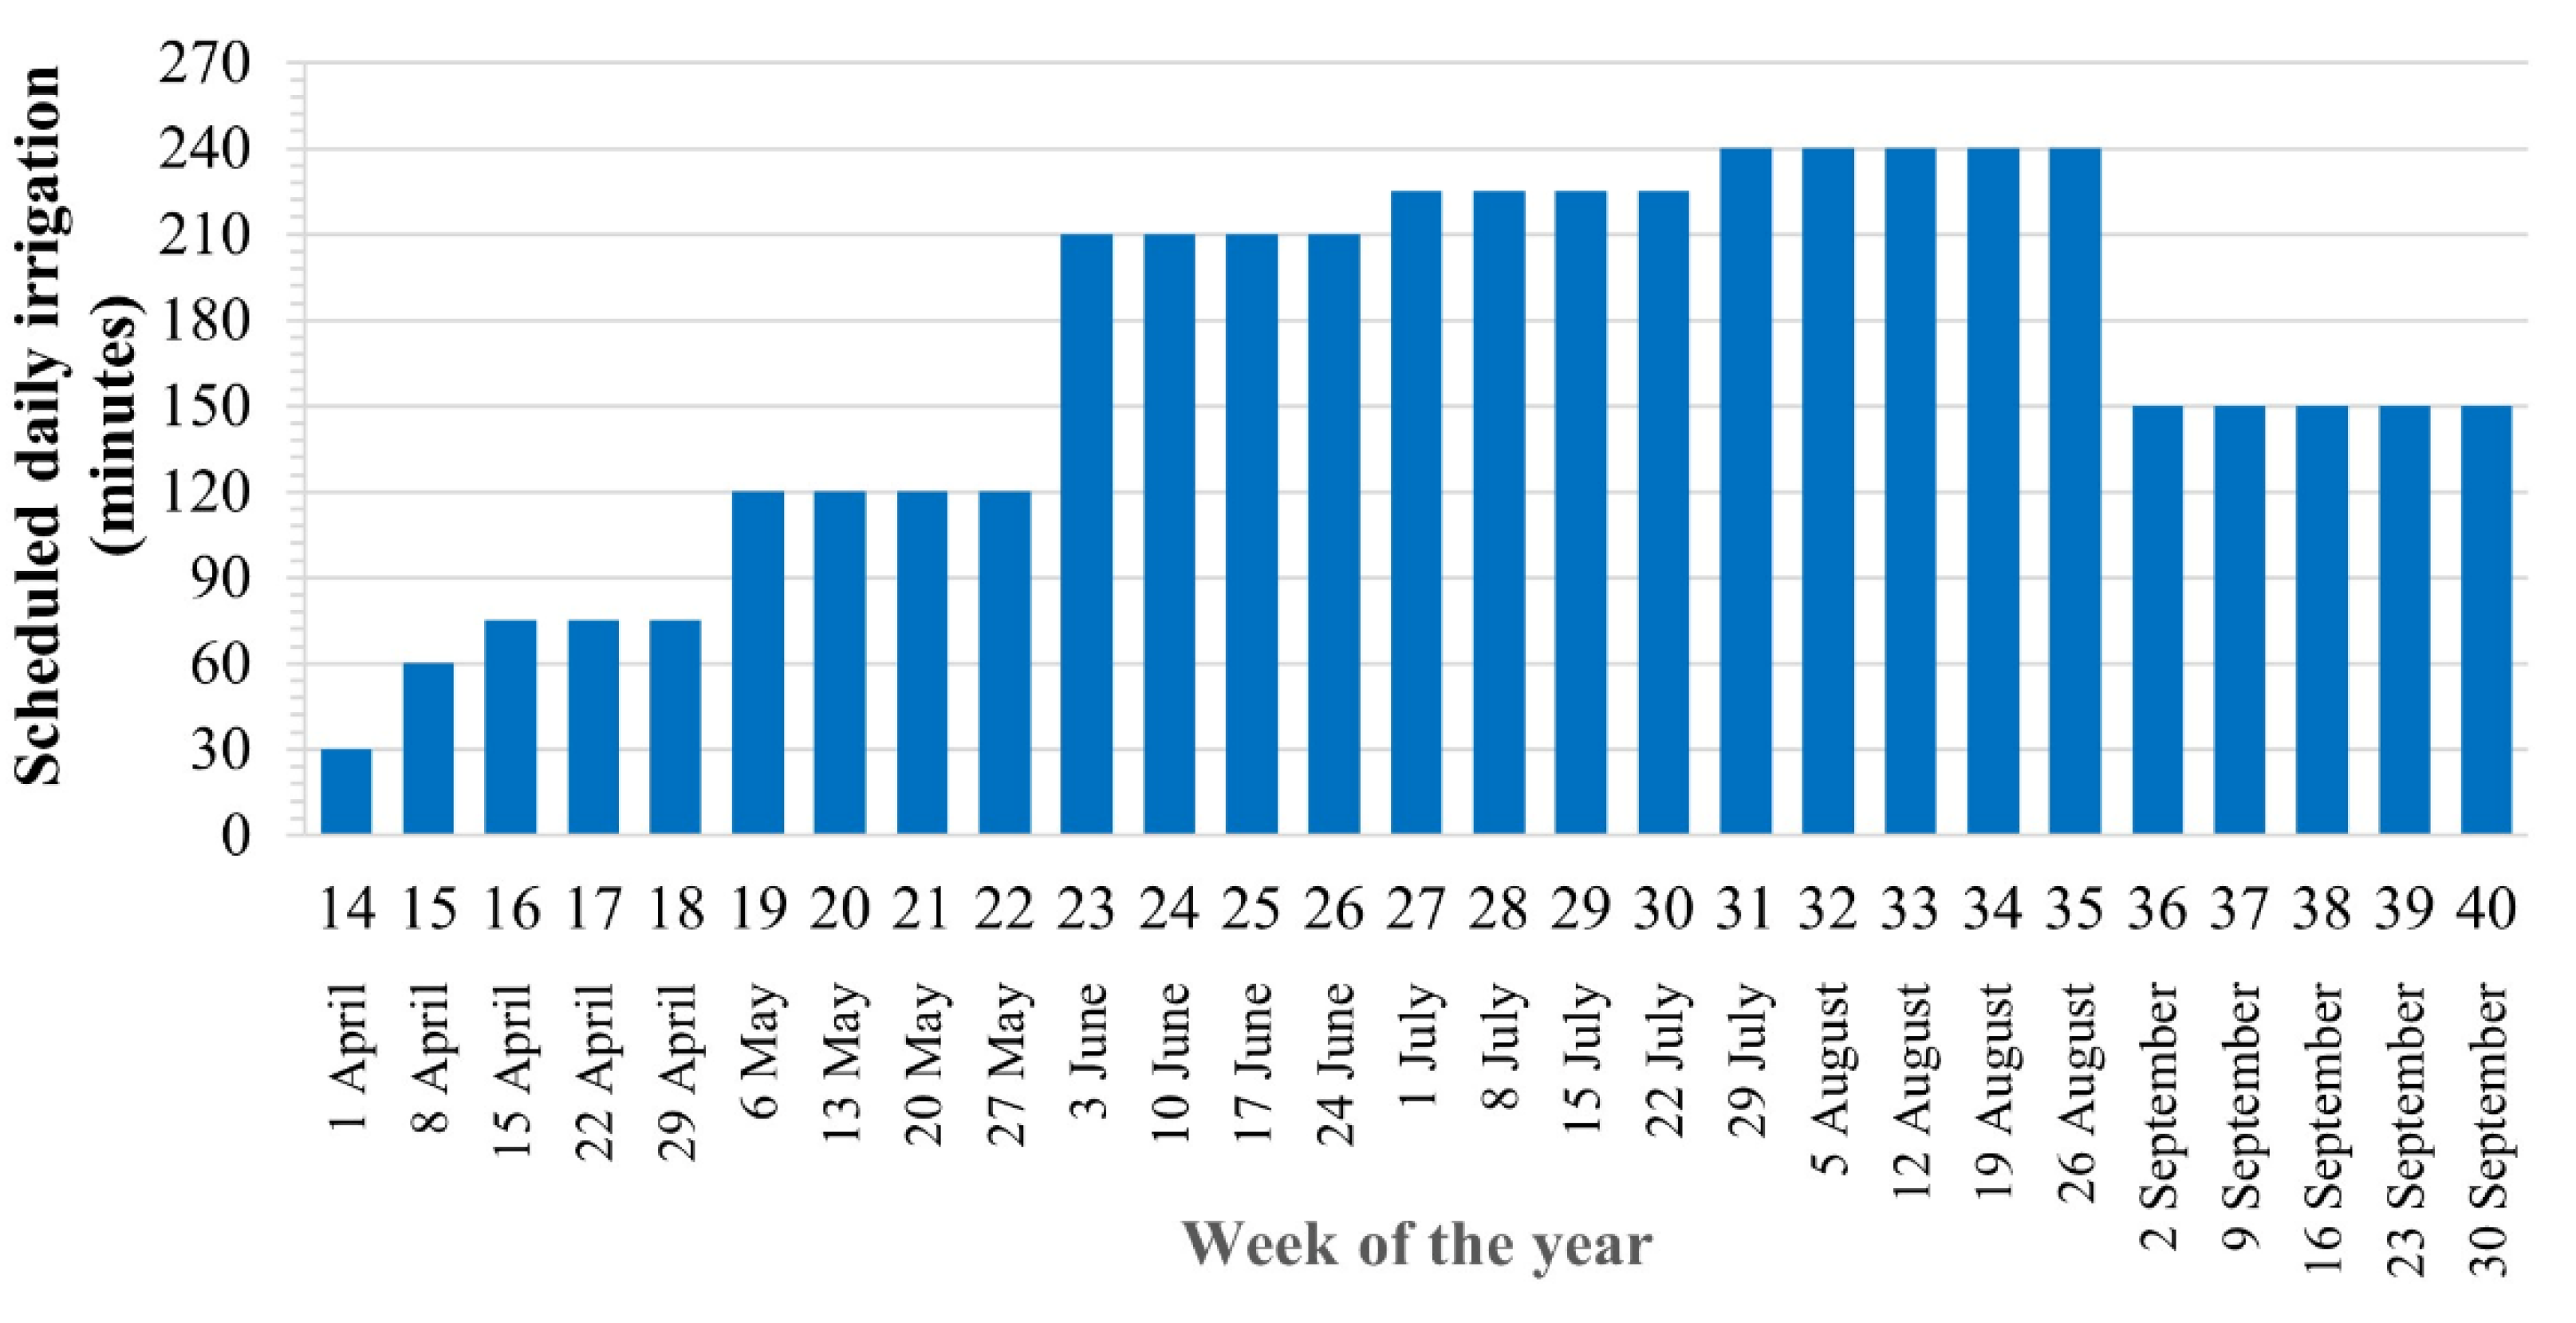
From the monthly irrigation schedule, it has passed to the daily gross irrigation schedule applied each week (Figure 6) during the irrigation season. Daily watering has been set in multiples of 15 min to match the simulation intervals for the entire system.
Irrigation water is taken directly from the river Genil by pumping it directly into the irrigation network. The pump is a monoblock horizontal centrifugal from the NB [44] series, model 65–250, with an impeller diameter of 251 mm.
The pump is driven by an asynchronous electric motor with a nominal power of 45 kW. For the study of this work, a standard motor with an efficiency of class IE3 has been considered. The performance curve has been obtained from the manufacturer’s data [45].
The motor is driven at variable speed and is carried out with a frequency inverter powered by the DC bus from the photovoltaic panel system. The drive is a 62.3 kVA nominal power SD700SP series [46].

4. Results

The stochastic nature of solar energy and weather means that simulations must be carried out with data from a wide period of years or that the simulations must use the typical meteorological year. Figure 7 shows the evolution of the daily mean values of the maximum and minimum temperature, radiation, precipitation and calculated reference evapotranspiration, ETo, in the study area of this investigation obtained from the network agroclimatic stations of Junta de Andalucía over a period of 15 years. These values have been used to carry out the agronomic study of the farm and are also used to update the daily work matrix in which the water balance in the soil is involved.
The power supply matrix, in the case under study, has been obtained from the simulation of equations and with the irradiance values obtained, in 15 min intervals, from the data of the typical meteorological year of the solar radiation map of the Andalusian Energy Agency [47]. Table 8 shows some of the 35,040 records in the PV generator supply matrix.
The demand matrix is obtained by considering the performances of the pump, the electric motor and the frequency converter in the different operating regimes for the combinations of sectors. The simulation of the model yields the data in Table 9. The last column contains the values of the minimum electrical power required from the photovoltaic generator for the corresponding combination of sectors. The height, H, corresponds to the pressure values in the irrigation head. Q is the flow required by the sector or combination of sectors considered. Ph is the hydraulic power driven by the pump to the irrigation water. The efficiency of the pump, ηpump, has been obtained by suitably applying the laws of similarity of the pumps and by comprehending the working point (H−Q) of the pump (see Figure A1 in Appendix A).
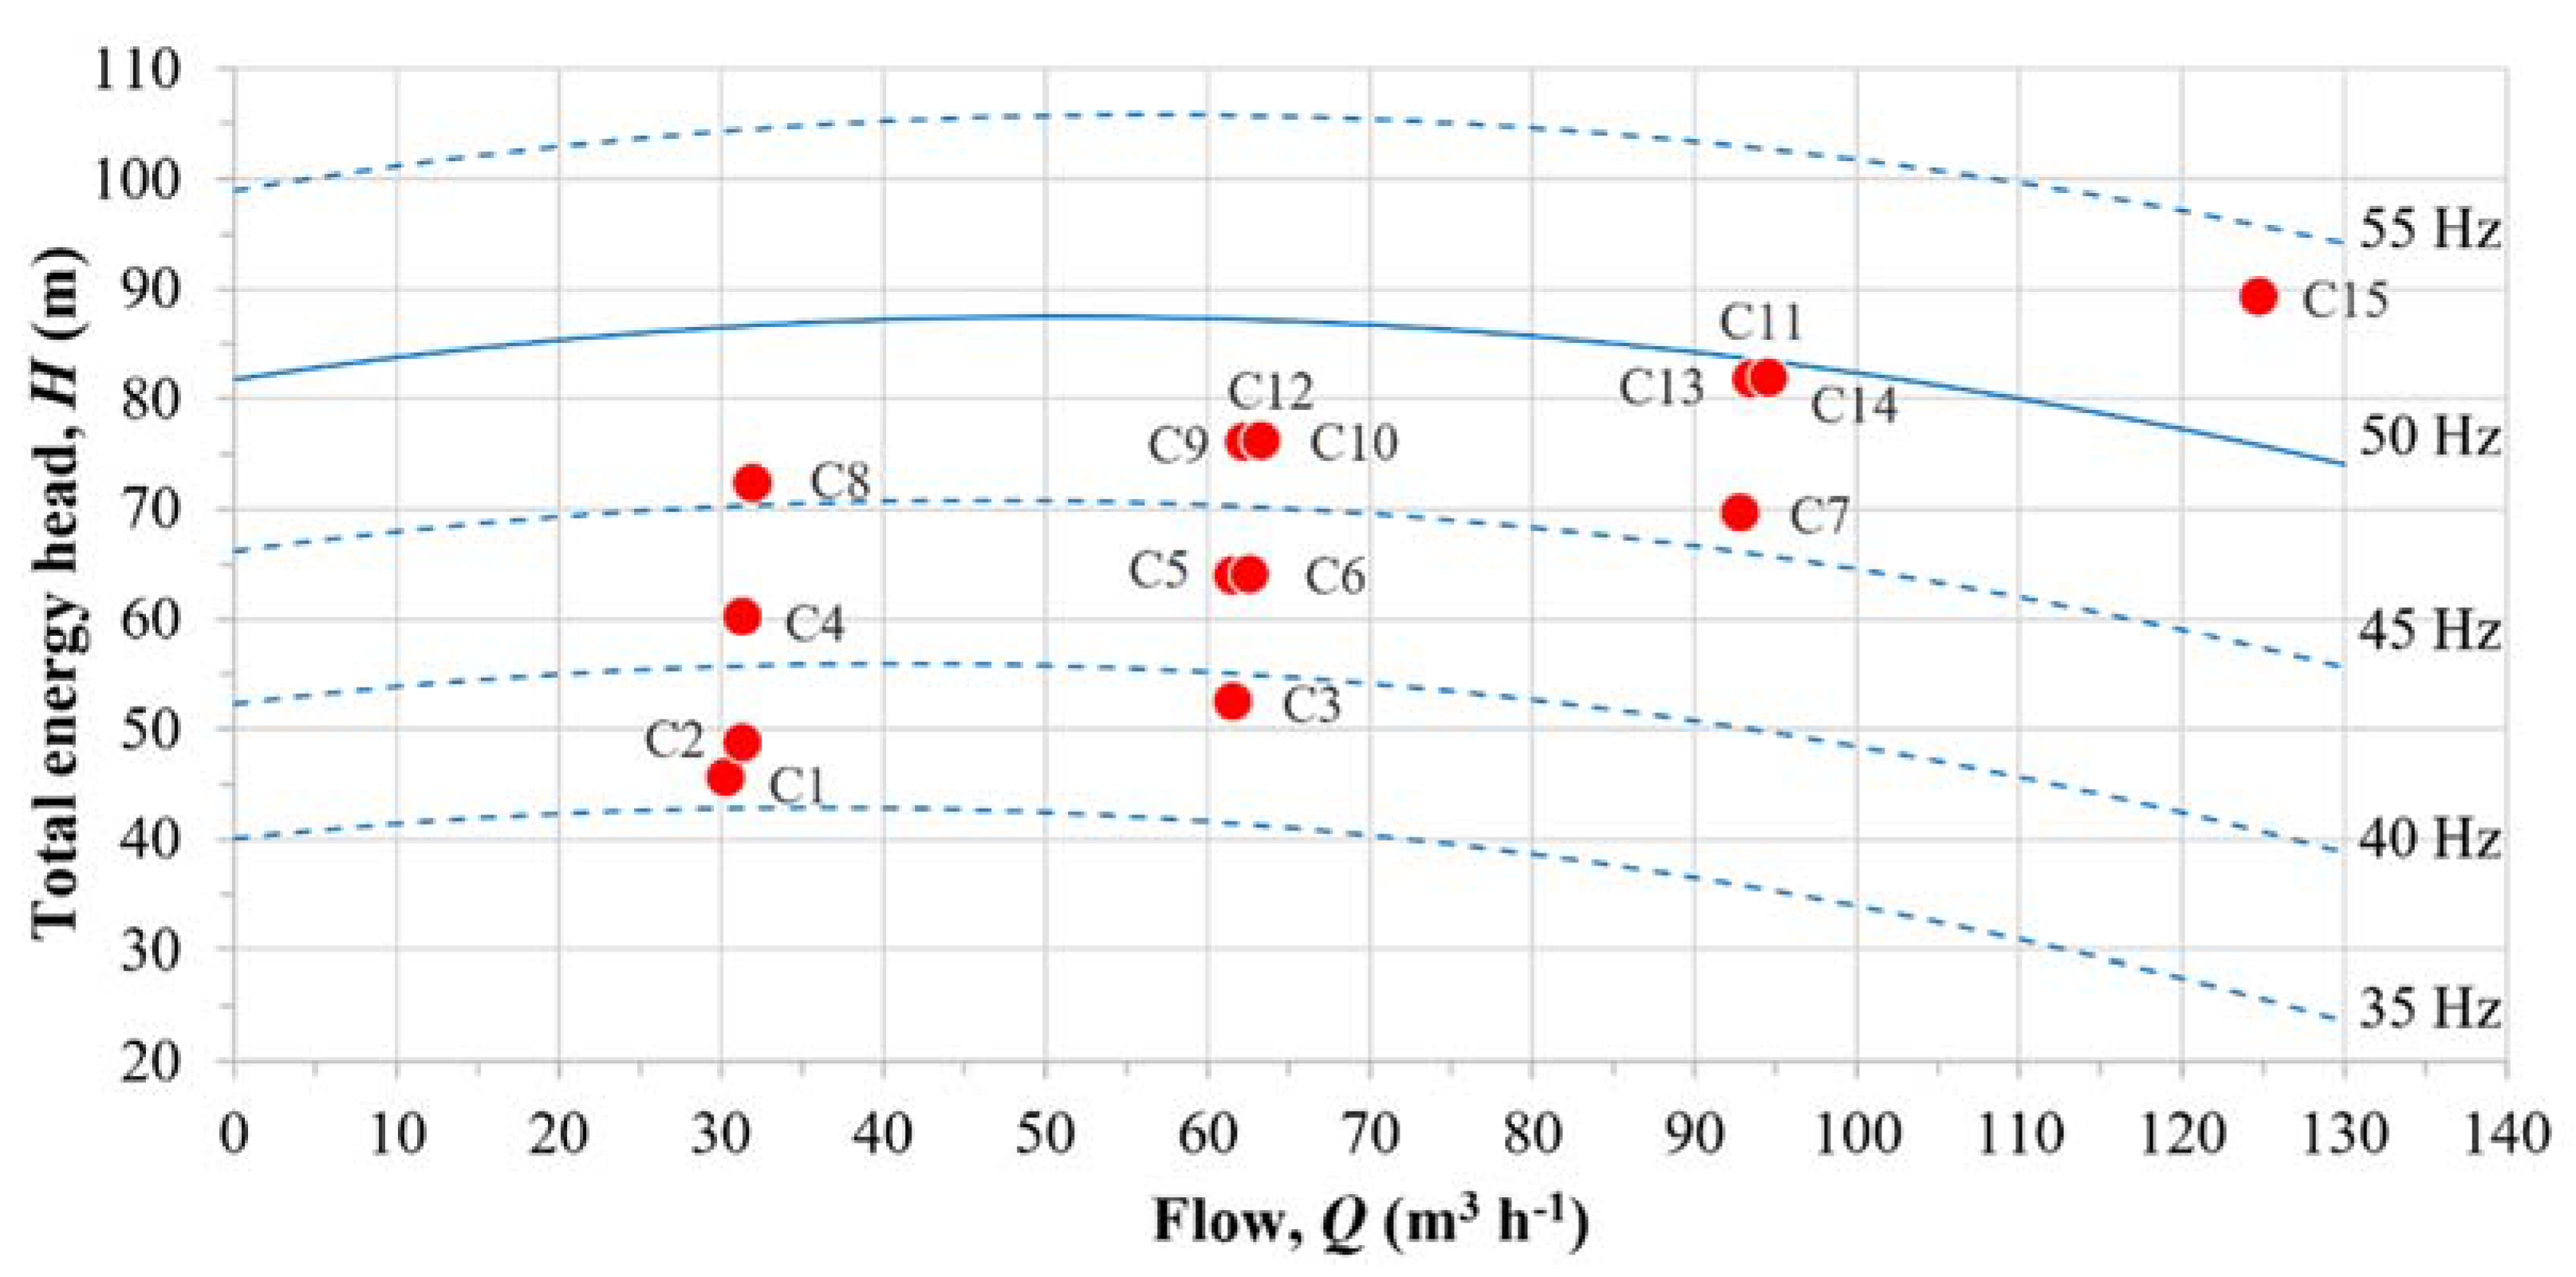
By using the polynomial function of the characteristic curves H−Q and Ps−Q of the centrifugal pump and equations, the curves for different working frequencies of the variable speed drive are obtained (Figure 8 and Figure 9). The points marked C1 to C15 correspond to the pump operating points according to Table 9.
The algorithm developed compares, for each moment considered, the supply matrix and the demand matrix, and taking into account the power distribution conditions set in Table 4, the distribution of the generated power is determined relative to the combination of sectors that the matrix daily work sets (Table 3).
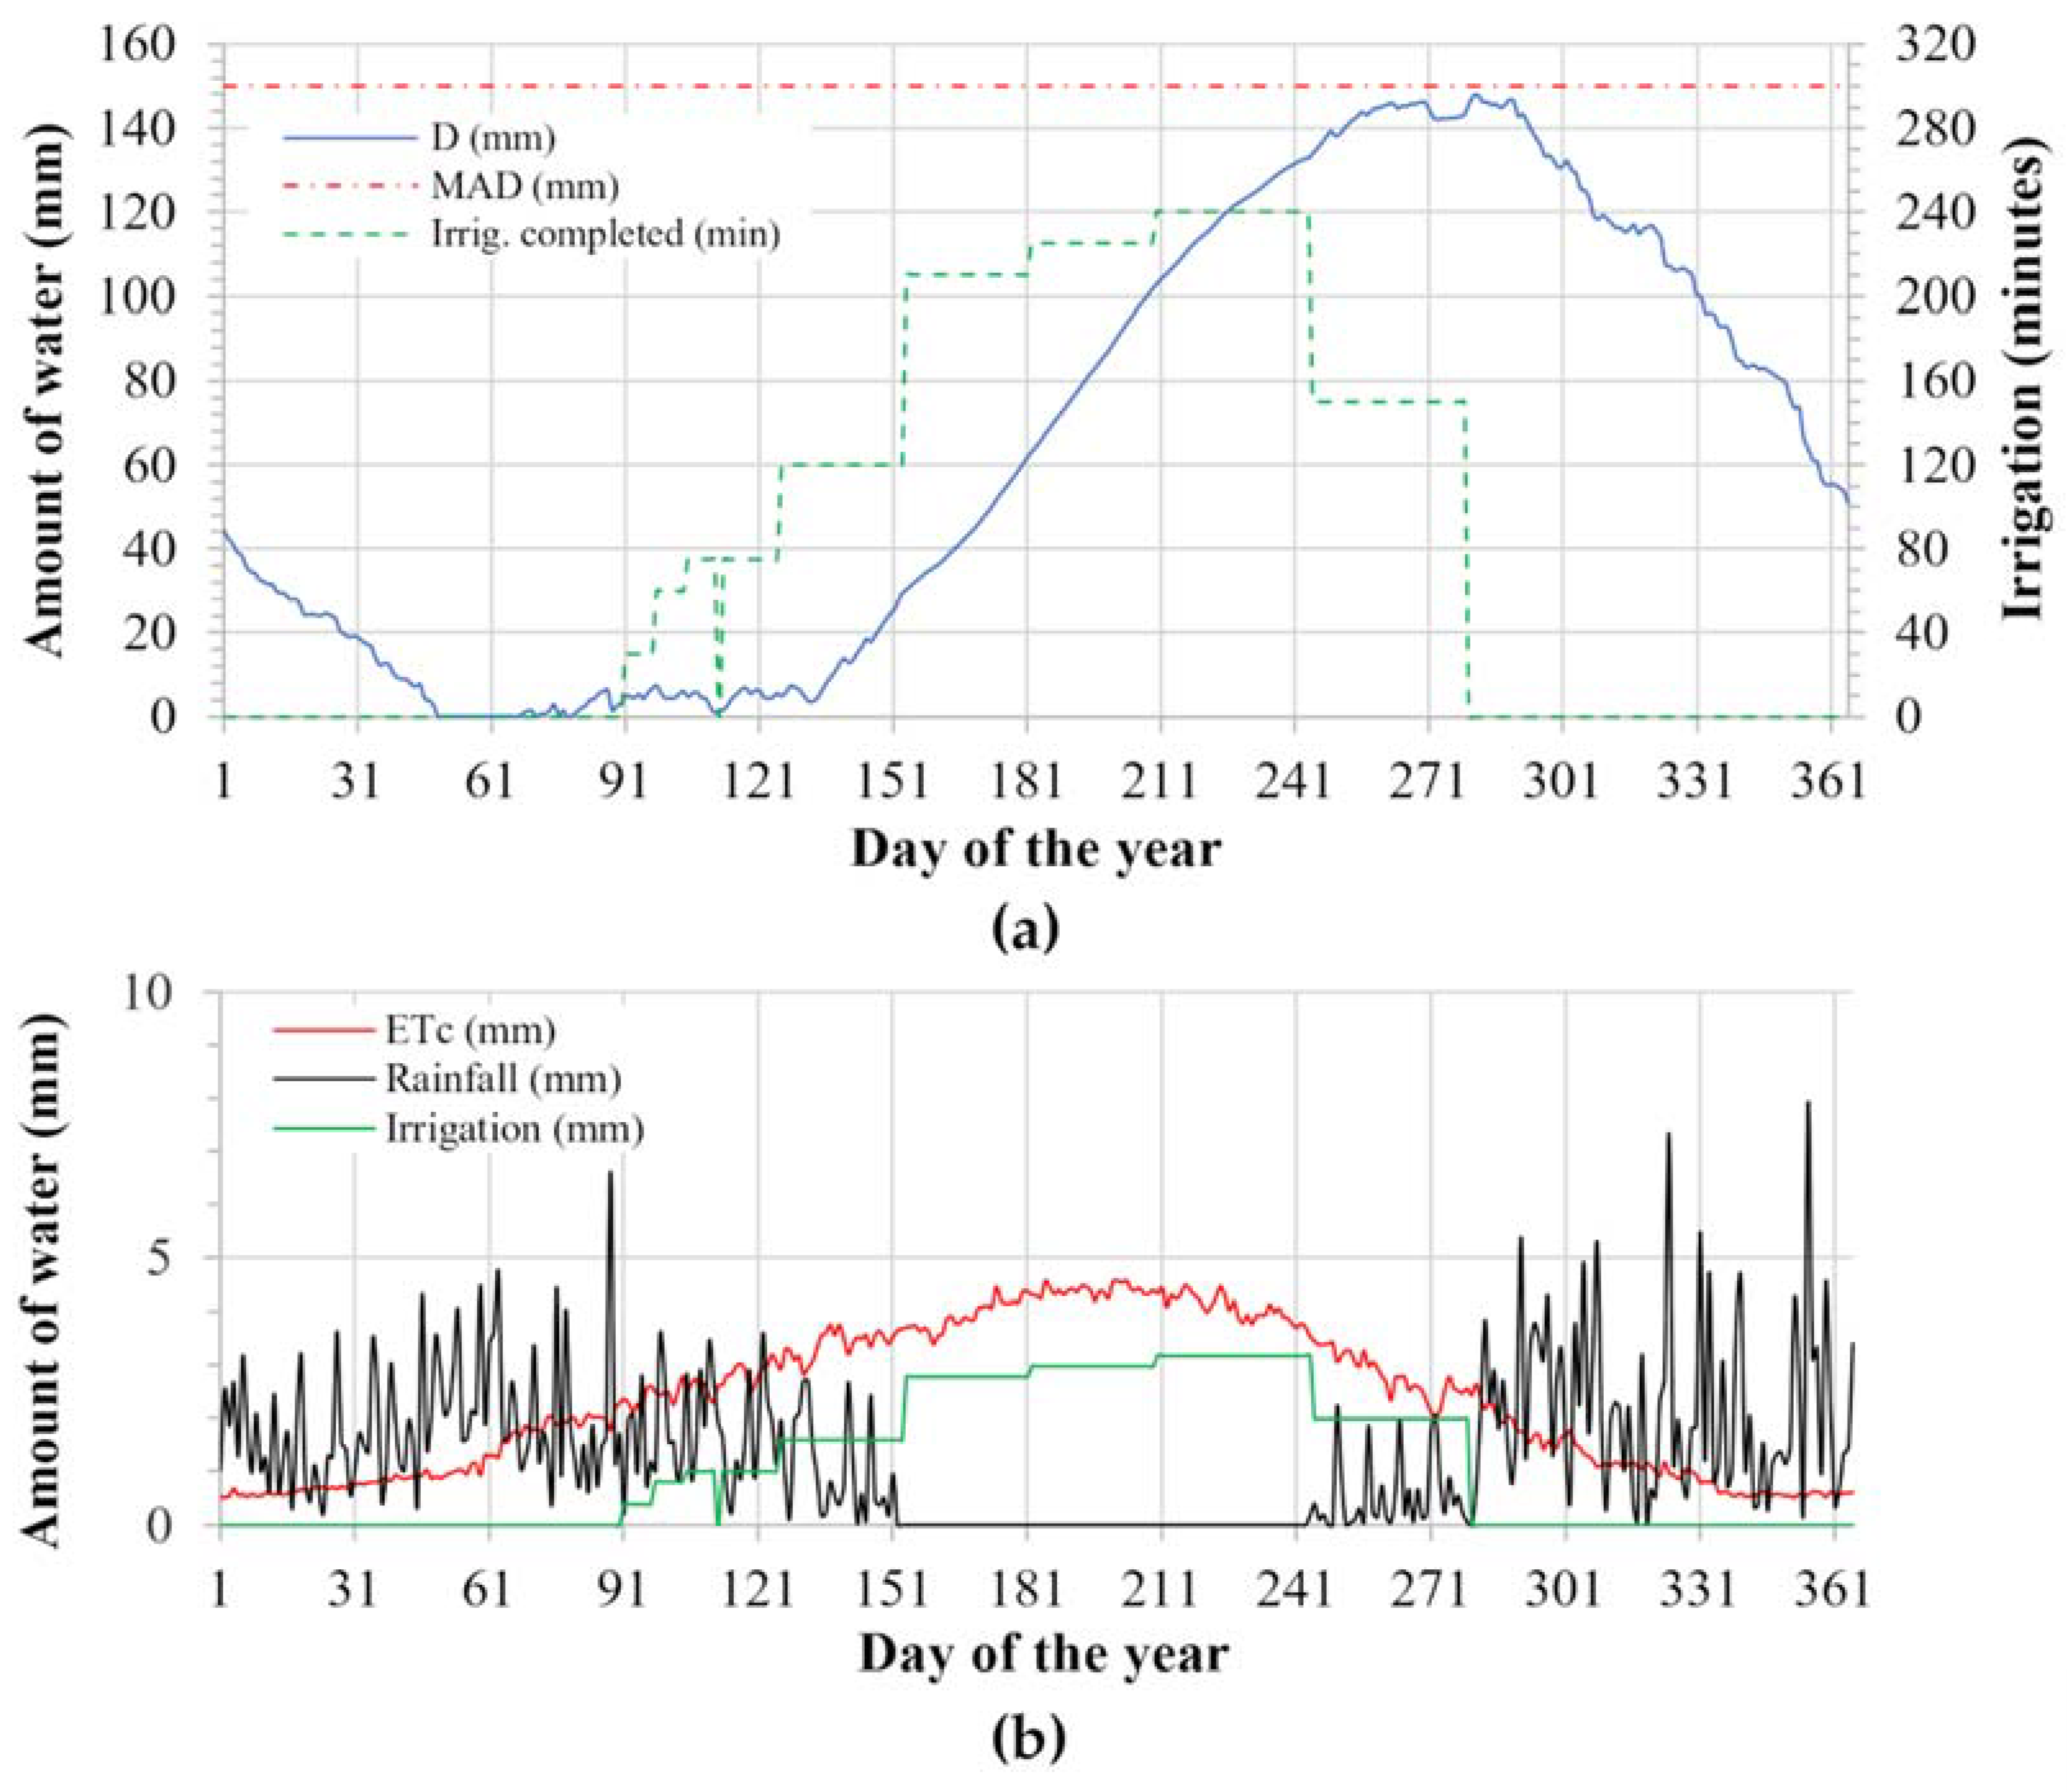
Figure 10 represents the evolution of the soil water deficit (D) throughout the year, not reaching the management allowable depletion (MAD); thus, the irrigation objective is met. In addition, the assigned irrigation is completed each day according to the agronomic study of the farm (see Figure 5).
Table 10 shows the evolution of the daily work matrix for the 160th day of the year (9 June) within the irrigation campaign.
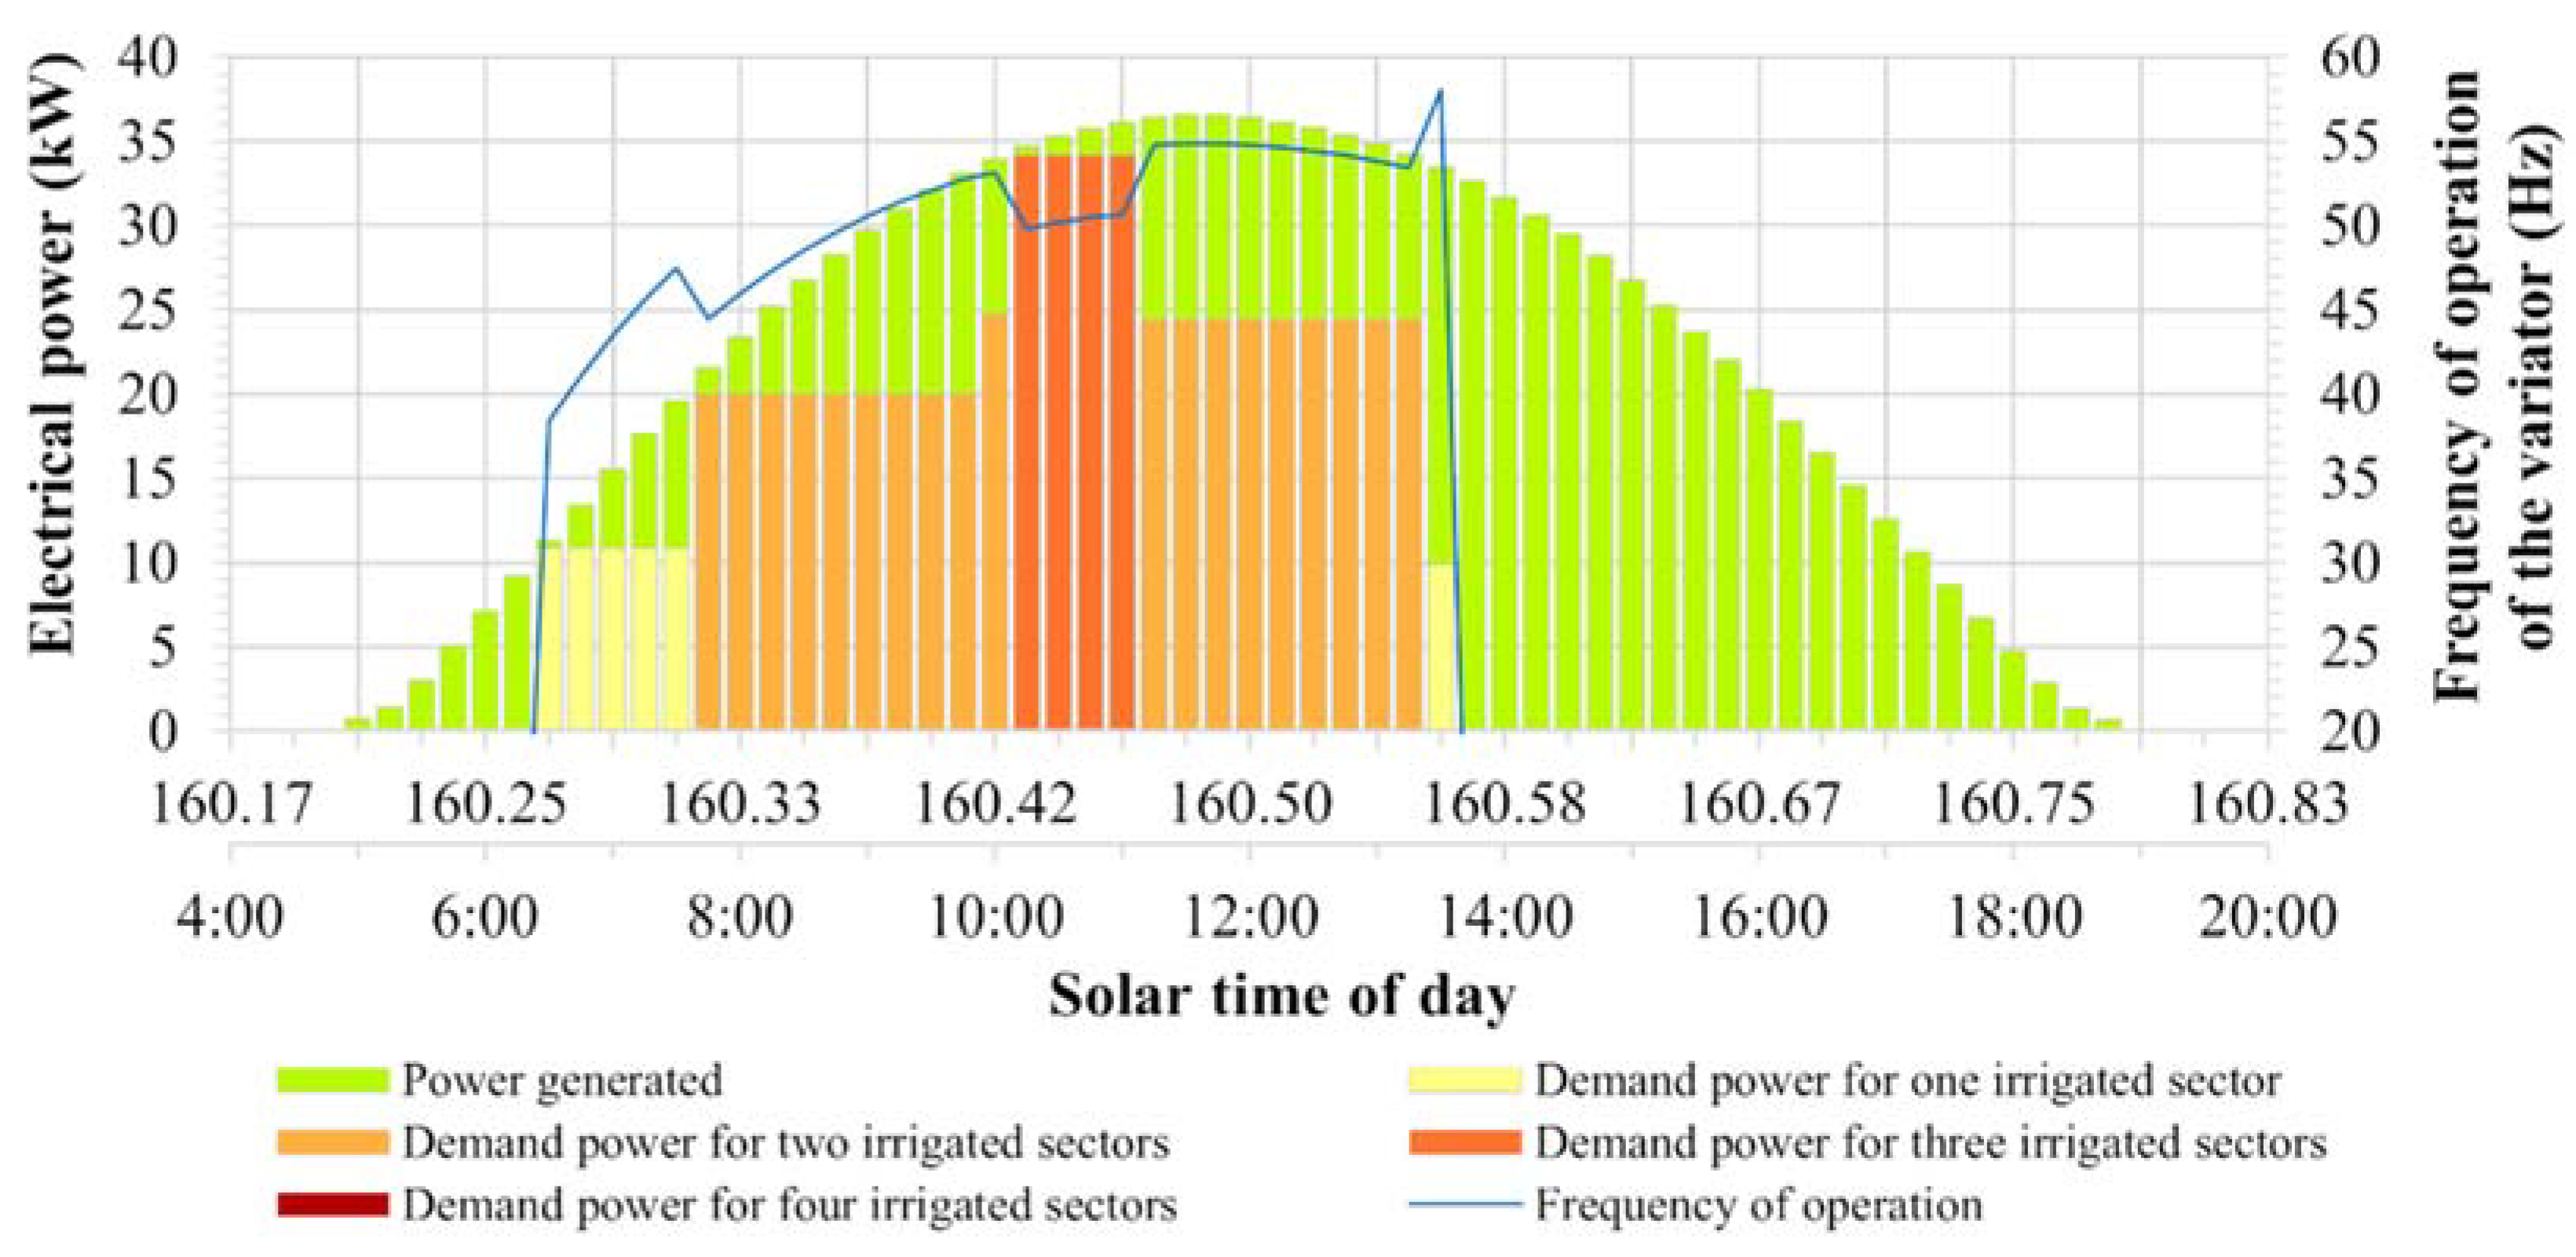
The application has been developed in MATLAB. MATLAB is a programming software with its own language very suitable for simulation problems [48]. It allows knowing the speed or frequency of operation of the variator of the electric motor of the pump in order to transmit all the power generated to the hydraulic system. The graph in Figure 11 represents the power generated at each instant of the study and the minimum demand power necessary to start watering the combination of sectors, according to the daily work matrix, for the same day, 160. The difference in these powers is delivered to the irrigation network by increasing the rotation speed of the pump and increasing the pressure in the network.
In order to represent the different irrigation combinations (C1 to C15), Figure 12 is presented in which the length of the bars represents the number of hours irrigated with each combination. The red line represents the relative frequency of each combination, and the blue line represents the cumulative frequency. It can be observed that 83.6% of the irrigation time is used in the combinations of sectors from 1 to 10 with a power of less than 25 kW in the generator. All combinations are of one or two sectors, except the C7 combination which is of three sectors, that only represents 2%. Sixteen point four percent of the time is used in combinations that exceed 30 kW (see graph in Figure 12).
Figure 12 shows that 65.6% of the combinations are formed by two sectors (sum of the relative frequencies of the combinations of sectors 3, 5, 6, 9, 10 and 12); 22.9% by a single sector (sum of the relative frequencies of the combinations of sectors 1, 2, 4 and 8); and 11.5% of the combination is made up of three sectors (sum of the relative frequencies of the combinations of sectors 7, 11, 13 and 14). Irrigation to various sectors accounts for 77.1% of the total, that is, 77.1% of the irrigation time is carried out in a multisectoral manner. The combinations that require more power are irrigated in the central hours of the day, while those that require less power (a single sector) are irrigated at the beginning of the day and at the end of the irrigation day (see Figure 11).
In order to evaluate the efficiency of photovoltaic energy use, the energy use efficiency index (EuE) is used, which considers the energy losses in the system including losses in the frequency inverter, the motor, the pump and the water distribution network. It is defined as the ratio between the maximum potential energy that the PV plant could provide depending on the incoming solar radiation and the energy really supplied to the sectors. Low EuE values indicate that the potential PV energy is mainly wasted, while high EuE values indicate an efficient use of energy. This index allows comparing different PV irrigation systems [28,36].
The efficiency of the use of the generated energy, in monthly values, is represented in the graph of Figure 13. EuE annual is 26.15%.
The use of photovoltaic energy in irrigation eliminates electricity costs and also reduces CO2 emissions. The photovoltaic installation studied here with the irrigation network considered in four sectors saved emissions of up to 6.29 tonnes of CO2 with respect to the atmosphere for the simulated irrigation campaign. It has been considered that each kWh of conventional electrical energy emits 0.27 kg of CO2 equivalent.

5. Conclusions

The use of solar energy to pump water for farm irrigation is an interesting alternative from the point of view of reducing GHG emissions. It is not only interesting in places far from the electricity distribution networks but also in areas where the electricity network is present since the prices of electricity are increasing. The connection to the grid is of interest for delivering the surplus energy generated that is not used by the farm’s irrigation system and outside the irrigation campaign to the electrical system.
The direct pumped photovoltaic irrigation system is cheaper than those that use batteries to accumulate electrical energy or those that require a water storage tank. The division of the farm into irrigation sectors reduces the peak power required from the photovoltaic generator.
The aim will always be to carry out an optimal design of the photovoltaic panels and the irrigation water network, which minimises investment. The algorithm developed allows analysis of the technical, economic and environmental feasibility of using a direct photovoltaic irrigation system on a farm with the irrigation network divided into sectors. It performs a simulation of the subsystems that makes up the photovoltaic irrigation system, even in already designed systems. It is an essential tool for the optimal design of the assembly.
This algorithm can be applied to farms with irrigation systems for crops with different water needs, since energy management is independent for each sector. In addition, it allows managing the energy generated by the photovoltaic panels in such a manner that all electrical power is delivered to the system formed by the pump and the irrigation network, increasing the pressure of the water distribution network by increasing the rotation speed of the pump and, thus, increasing the power transferred to the system.
Daily data on the local climate, crop, flow, pressure and losses in the irrigation network and the water balance of the soil are taken into account. The performance of all the components of the system has been considered, with special attention given to the performance of the pump, which varies notably according to the load regime that corresponds to the combination of sectors under irrigation.
The management model developed has been able to distribute the electrical energy generated to the different irrigation sectors, meeting the programmed water requirements for the entire irrigation campaign. It has proven to be effective, since in the applied study case the efficiency of energy use reached 26.15% per year, with CO2 emission savings of 6.29 tonnes per year.
It is observed that the photovoltaic energy management strategy affects the design of the irrigation network and the number of sectors into which the farm is divided.
The authors consider that the developed algorithm is valid for technical, economic and environmental analysis for direct PV irrigation systems. Prior to the technical project, it was possible to render a simulation of the complete system, including all the devices involved in the conversion of solar energy to hydraulic energy and considering the daily water balance in the soil by means of the daily work matrix. Different simulations can be carried out by varying the number of photovoltaic panels, pump size, pumps in parallel or different configurations of the farm’s irrigation network. For all these reasons, we consider these findings to be advances in the methodology of photovoltaic irrigation design.

Author Contributions

Conceptualization, R.L.-L. and F.J.C.; methodology, R.L.-L. and F.J.C.; software, M.C.-L.; validation, R.L.-L.; formal analysis, F.J.C.; investigation, M.C.-L.; resources, F.J.C.; data curation, R.L.-L.; writing—original draft preparation, M.C.-L.; writing—review and editing, R.L.-L. and F.J.C.; visualization, F.J.C.; supervision, R.L.-L. and F.J.C.; project administration, F.J.C. All authors have read and agreed to the published version of the manuscript.

Funding

This research received no external funding.

Institutional Review Board Statement

Not applicable.

Informed Consent Statement

Not applicable.

Data Availability Statement

Not applicable.

Conflicts of Interest

The authors declare no conflict of interest.

Appendix A. Mathematical Models of Components of the System

Mathematical models of the components of the photovoltaic irrigation system used in this work.

Appendix A.1. Photovoltaic Generator Subsystem

Appendix A.1.1. The Solar Resource

The extraterrestrial radiation that reaches the Earth depends essentially on the Earth–Sun distance [49]. This radiation is modified when passing through the atmosphere by the interaction with the different components of the atmosphere. The result is that the solar radiation that falls on a receiver located on the Earth’s surface is divided into three well differentiated components: direct radiation, diffuse radiation and albedo radiation.
In this work, the global irradiance, I(t), is estimated as a function of time given by Equation (A1). An isotropic distribution of the diffuse radiation is considered [49].
I ( t ) = cos θ cos θ z   I b ( t ) + 1 + cos φ 2   I d ( t ) + ε   1 + cos φ 2   [ I b ( t ) + I d ( t ) ]  
The direct and diffuse irradiance values are obtained from the model proposed by Collares-Pereira and Rabl [50]. The values of the daily global radiation are taken from the solar radiation map of the Andalusian Energy Agency [47].

Appendix A.1.2. The Photovoltaic Generator

In this work, it is considered that the photovoltaic modules work at the point of maximum power; thus, the power generated by the set of modules that make up the photovoltaic generator, PPV, can be expressed by Equation (A2).
P P V = P m p p   I ( t ) I S T C   [ 1 γ ( T c e l l T S T C ) ]
The cell temperature can be estimated by applying Equation (A3).
T c e l l = T a + N O C T 20 800   I ( t )
The effective power generated by the generator, PG, is given by the following expression (A4):
P G = P P V   F p
where Fp is the loss factor of the PV generator, which includes the losses due to spectral variations, dispersion losses and losses in the cabling. It is considered constant and has a value of 0.86.

Appendix A.2. Frequency Variator Subsystem

The regulation of the speed of induction motors by voltage and frequency control is based on applying a certain voltage/frequency ratio to the motor by using various transformations that include a rectifier, a filter and an inverter with Pulse Width Modulation (PWM), which are called variable frequency drives (VFD) [51]. Today, there are variable speed drives that allow power supply through the DC bus and incorporate algorithms for monitoring the maximum power point of the photovoltaic generator [46].
The energy losses that occur in a frequency inverter are, mainly, those coming from the inverter conduction and commutation losses, rectifier conduction losses, input inductance losses and cooling losses. Most manufacturers of these devices provide limited information on the efficiency of the unit in addition to the maximum losses. The efficiency varies little with the load rate and can be considered constant. In the UNE-EN 50598-2 [52] standard, the losses are described by eight frequency-current points, obliging the device manufacturer to provide in the documentation the losses of at least eight operating points. In this study, the efficiency of the VFD, ηVFD, is obtained by interpolation or two-dimensional linear extrapolation with the loss points neighbouring the operating point under study.

Appendix A.3. Variable Speed Induction Motor Subsystem

The efficiency of the induction motor varies depending on the mechanical load delivered to the shaft; however, the characteristics plate shows the value at full load. In general, manufacturers provide performances in three or four load regimes for supply at rated voltage and frequency. Many authors consider as constant the nominal efficiency for different load and engine speed regimes [28]. However, some losses increase at low speed ranges, and the efficiency is not constant either. Following the work of Alonso Abella and others [53,54], in order to determine the performance of the motor, a corrected shaft power, Pe,corr, is considered, since the motor output power is proportional to the frequency of the electric current feeds the motor stator. Equation (A5) determines motor efficiency, ηmotor:
η m o t o r = P s , c o r r P e l e c
where Ps,corr is (A6) defined as follows:
P s , c o r r = P s   f n f o
with fn being the nominal frequency (generally 50 Hz).
Therefore, the electrical power, Pelec, necessary to move the pump at a given speed (operating frequency, fo) is given by the following (A7).
P e l e c = P s η m o t o r f n f o
The efficiency of the motor at the operating point is obtained by interpolating the points provided by the manufacturer of the motor.

Appendix A.4. Pumping Subsystem

Appendix A.4.1. Irrigation Network

The manometric height that the pump must supply is the sum of the elevation difference of the farmland, which only depends on the topography of the land; head losses in the irrigation network, which depends on the design of the installed pipe network; and the working pressure necessary for the emitters to work.
Head losses, hf, in a piping system depend on several factors and can be calculated, for a given design (type of pipe, diameter and length), as a function of flow, Q [55]. Applying the Darcy–Weisbach, Blasius and Hazen-Williams equations for turbulent regimes, it can be considered that it responds to Equation (A8).
h f = R f   Q β
Rf collects the friction coefficient of the pipeline and its accessories (elbows, valves, …) and all the constant parameters of the distribution system, including the correction coefficients for pipes with multiple outlets [56].
The flow–pressure relationship of the emitters is characterised by Equation (A9) [57].
q e = k e   h e x
The compensated emitters have a value of x = 0. The discharge flow for an irrigation sector, Qsi, is defined as follows (A10):
Q s i = n e , s i   q e
where ne,si is the total number of emitters of the irrigation sector i.
The flow, Q, of the main section of the distribution network is the sum of the flows of the sectors it supplies, which can be expressed by Equation (A11), considering only the sectors that are under irrigation.
Q = i = 1 i = s Q s i
The relationship between the pressure in the irrigation head, H, that the pump must provide to supply the necessary flow through the irrigation sectors, Q, depends on the pressure necessary for each irrigation sector or its combination and the pressure drop in the main pipe of the irrigation network (A12).
H = Δ z p + R f p [ i = 1 i = s Q s i ] β + max ( H s 1 ,   H s 2 , H s i ) H s 1 = Δ z s 1 + R f s 1   Q s 1 β + h e H s 2 = Δ z s 2 + R f s 2   Q s 2 β + h e H s i = Δ z s i + R f s i   Q s i β + h e
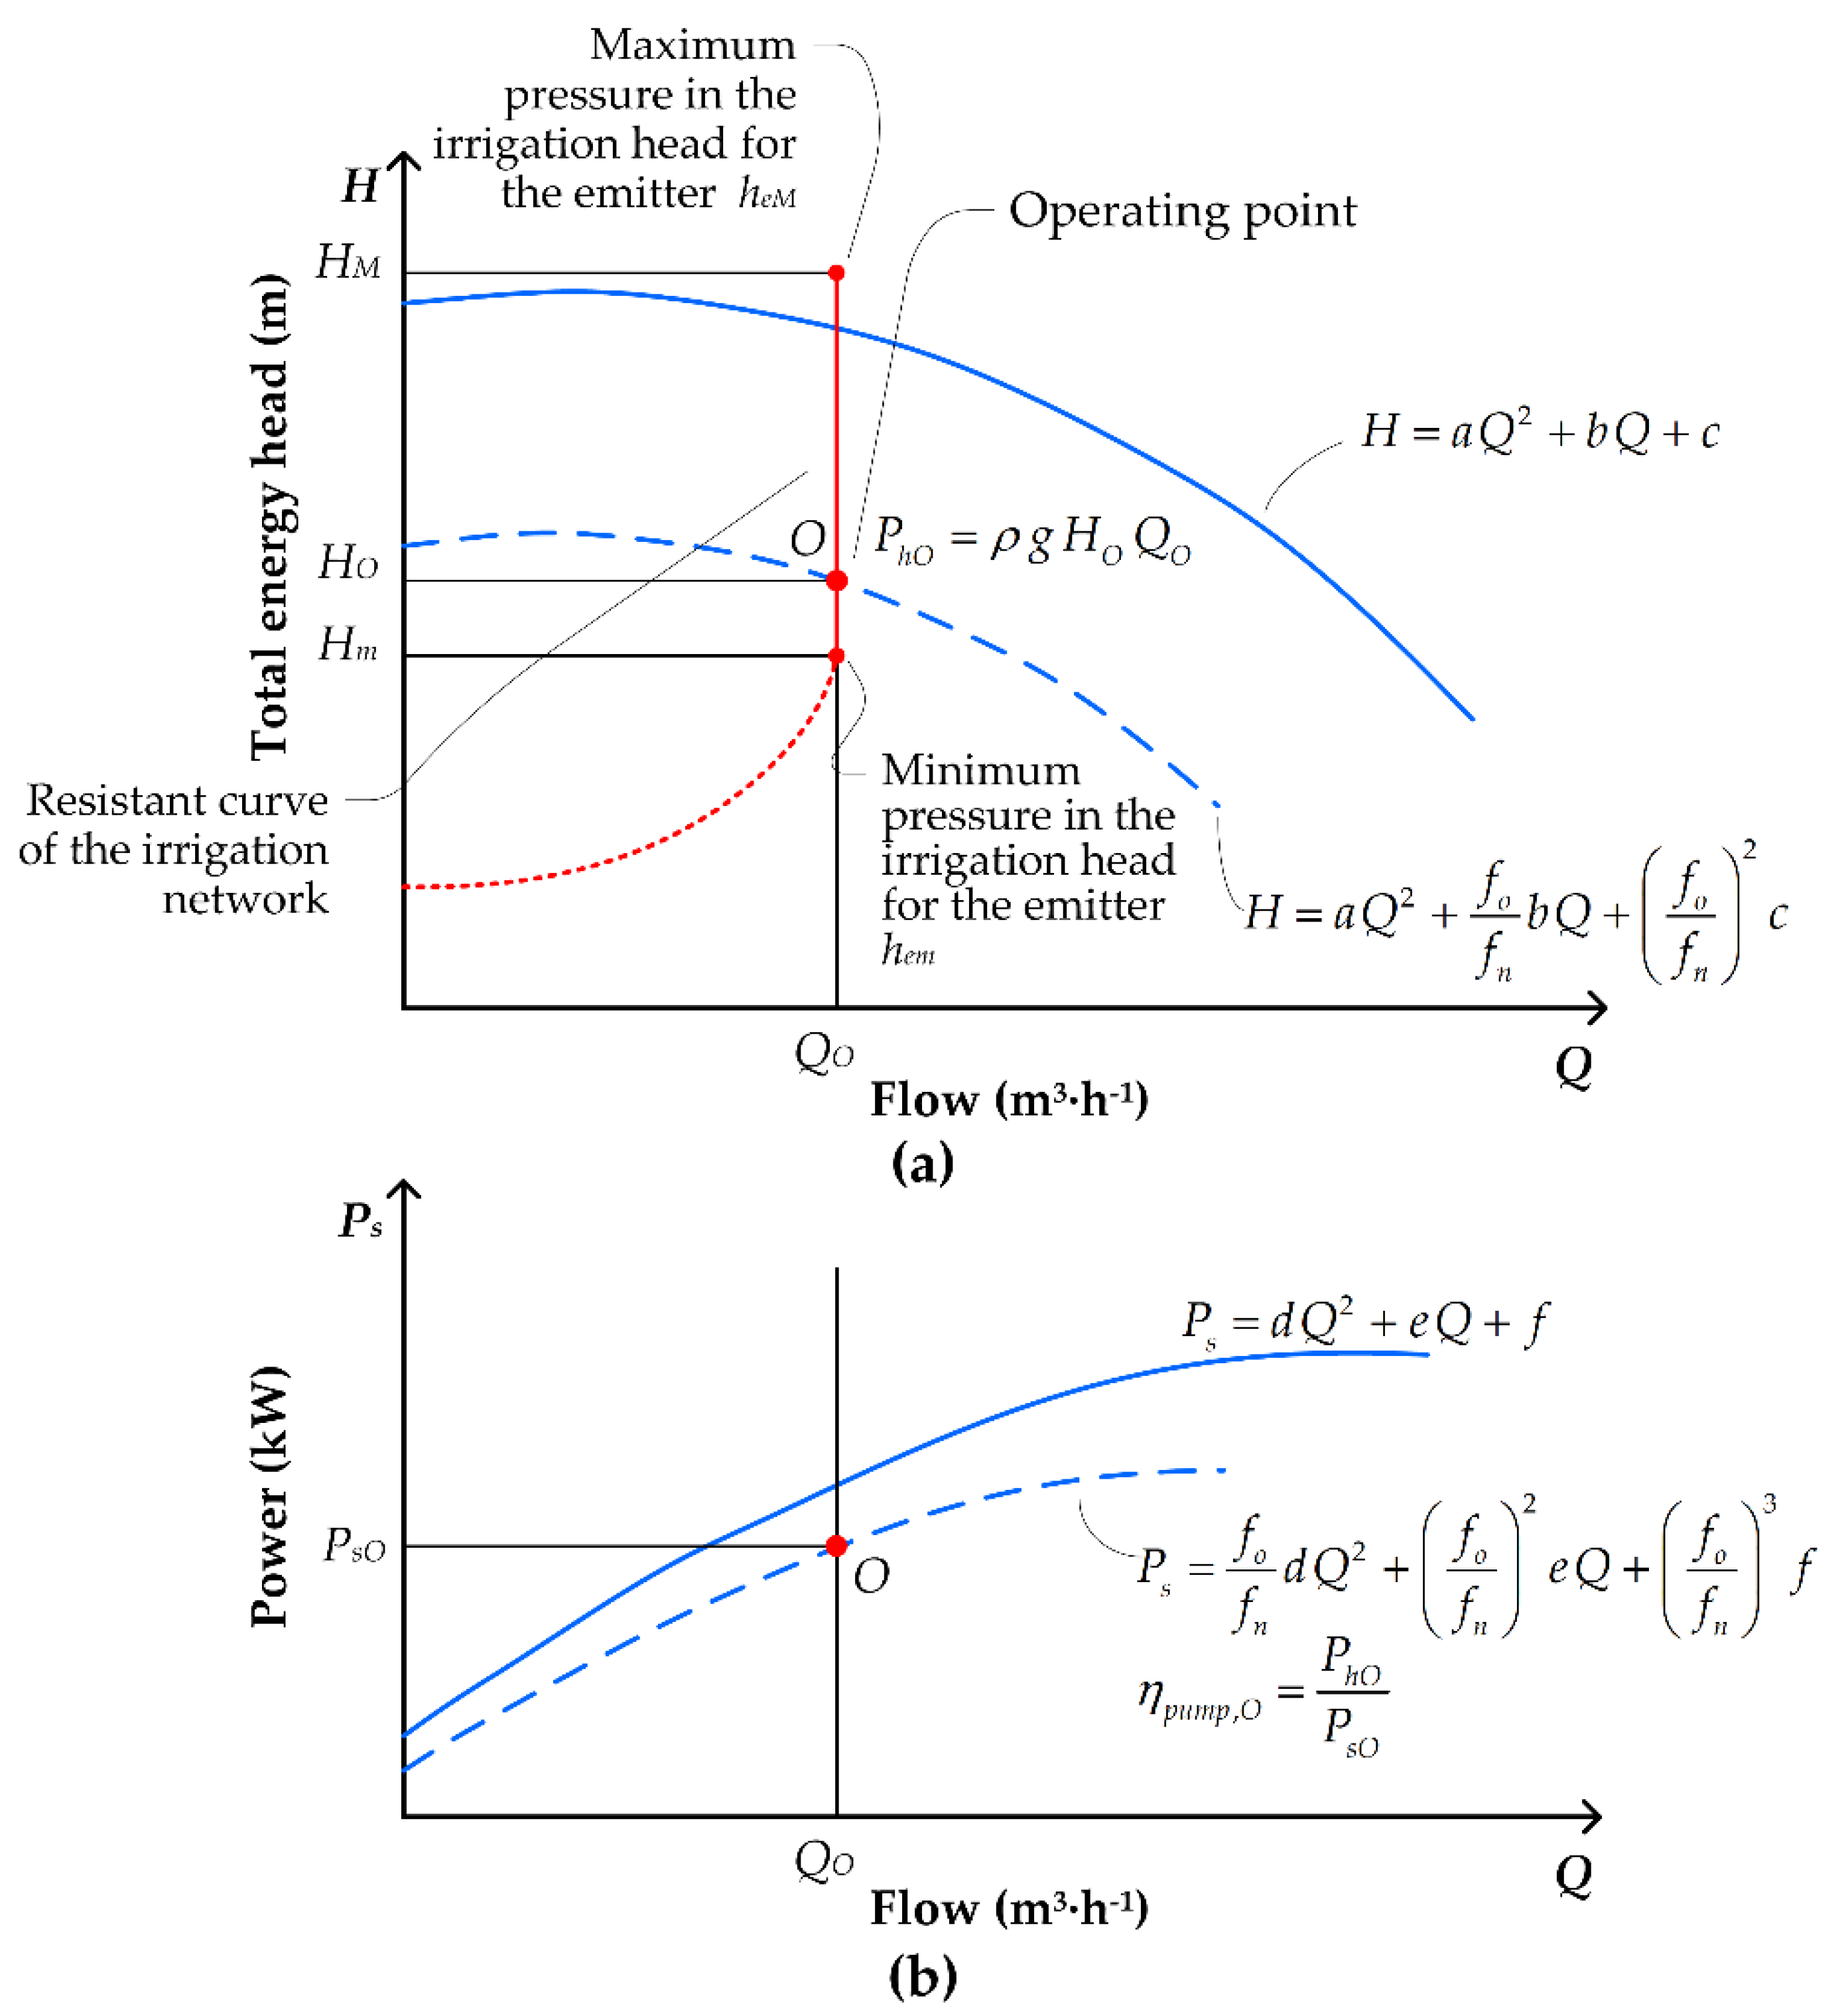
The H−Q load curve of the distribution network can be considered to be a vertical segment for which its extremes correspond to the minimum (hem) and maximum working pressure (heM) of the compensated emitters (see Figure A1).

Appendix A.4.2. Pumping System

The operating point of the pump, O, varies throughout the day and is the one corresponding to the intersection of its curve H = f(Q) and the resistant curve of the irrigation network (see Figure A1).
Figure A1. Application of the laws of similarity to the characteristic curves of the centrifugal pump. Operating point O. (a) H−Q diagram. In blue: continuous line H−Q at nominal conditions and dashed line H−Q at operating point. In red: H−Q load curve. (b) Ps−Q diagram. In blue: continuous line Ps−Q at nominal conditions and dashed line Ps−Q at operating point.
Agronomy 11 02313 g0a1
The laws of similarity for the same variable speed pump (point 1: Q1, H1, Ps1 and n1; point 2: Q2, H2, Ps2 and n2) can be written as follows (A13).
Q 2 Q 1 = n 2 n 1                 H 2 H 1 = ( n 2 n 1 ) 2                 P s 2 P s 1 = ( n 2 n 1 ) 3  
Taking into account that the angular speed of the electric motor is proportional to the frequency of its supply voltage and considering that the operation in point 1 corresponds to the curve provided by the pump manufacturer at the nominal rotational speed and powers the electric motor with an AC source of fn (in Europe 50 Hz) and that point 2 is the operating point in the new speed conditions at the operating frequency, fo, of the frequency converter, the following relationships (A14) can be set.
Q 2 Q 1 = f o f n                 H 2 H 1 = ( f o f n ) 2                 P s 2 P s 1 = ( f o f n ) 3
The mathematical model of the pump curves approximates a quadratic curve quite well, as described as follows (A15) and (A16):
H = a Q 2 + b Q + c
P s = d Q 2 + e Q + f
where a, b, c, d, e and f are the curve fit coefficients.
By applying the similarity laws of Equation (A14) to curves (A15) and (A16), we have the following curves H = f(Q) (Equation (A17)) and Ps = f(Q) (Equation (A18)) for other operating frequencies, fo, that are different from the nominal, fn (see Figure A1).
H = a Q 2 + f o f n b Q + ( f o f n ) 2 c
P s = f o f n d Q 2 + ( f o f n ) 2 e Q + ( f o f n ) 3 f

Appendix B. Abbreviations, Terms and Its Description

CNumber of possible combinations of sectors under irrigation
DSoil water deficit over a period of time (mm)
DWMDaily work matrix
ETcCrop evapotranspiration over a period of time (mm)
EToReference crop evapotranspiration (mm)
EuEEfficiency of the use of Energy
FCSoil field capacity (mm)
fnElectric motor rated frequency (50 Hz)
foElectric motor operating frequency, inverter frequency (Hz)
FpGenerator loss factor (p.u.)
gGravity acceleration (m·s−2)
GHGGreenhouse gas
HWater flow energy, manometric head, supplied pressure (m.c.a.)
heEmitter working pressure (m.c.a.)
heMCompensated emitter maximum working pressure (bar)
hemCompensated emitter minimum working pressure (bar)
hfPressure loss due to friction in the water pipe (m)
HMMaximum pressure in the irrigation head so that heM is not exceeded (m.c.a.)
HmMinimum pressure in the irrigation head so that the most unfavourable emitter has hem (m.c.a.)
HOPressure required at the point of operation (m.c.a.)
HsiNecessary pressure at the origin of sector i to compensate for the pressure drop, the height difference and to maintain emitter working pressure (m.c.a.)
HSsPressure required in the irrigation head by the combination of sectors Ss (m.c.a.)
I(t)Global irradiance as a function of time t (W·m−2)
Ib(t)Direct solar irradiance as a function of time t (W·m−2)
Id(t)Diffuse solar irradiance as a function of time t (W·m−2)
INFDeep infiltration into the soil
Ir(t)Albedo solar irradiance as a function of time t (W·m−2)
ISCTIrradiance under standard conditions (1000 W·m−2)
jJulian day
KcCrop coefficient, variable with the vegetative period
keCharacteristic factor of the emitter
MADManagement allowable depletion
nRotational speed of the rotor of the electric motor or pump (rpm)
ne,siTotal number of emitters of the irrigation sector i
NOCTCell nominal operating temperature (°C)
PefEffective precipitation over a period of time (mm)
PelecElectric power input to motor (W)
PGEffective generator power (W)
PGSsEffective generator power required by the combination of sectors Ss (W)
PhHydraulic power (W)
PhOHydraulic power at operating point (W)
PmppPeak power of the photovoltaic generator under standard conditions (W)
PPVPhotovoltaic generator power (W)
PsMechanical power on the motor/pump shaft (W)
Ps,corrMechanical power on the motor shaft corrected to the operating frequency, fo (W)
PsOPump shaft power at operating point (W)
PWPPermanent wilting point (mm)
QWater flow rate (m3·h−1)
qeEmitter flow (L·h−1)
QOWater flow rate at operating point (m3·h−1)
QsiFlow required by the irrigation sector i (m3·h−1)
QSsFlow required by the combination of sectors Ss (m3·h−1)
RAWPermissible depletion level (p.u.)
RfCoefficient of friction of the pipe and its accessories
RfpCoefficient of friction of the pipe and its accessories of the suction and discharge pipe of the main section
RfsiCoefficient of friction of the pipeline and its pipe accessories and correction coefficients of the sector network i
RnEffective irrigation carried out in a period of time (mm)
sNumber of sectors in which the farm has been divided
STCStandard measurement conditions
tTime
TaAmbient temperature (°C)
TAWRange of available moisture in the soil (mm)
TcellPhotovoltaic module cell temperature (°C)
TSTCCell temperature under standard conditions (25 °C)
βExponent of the flow, Q, in the head loss of a pipe
ΔzElevation difference between water storage and the point of use (m)
ΔzpElevation difference between the water storage and the irrigation distributor (m)
ΔzsiElevation difference in the pipe network of each sector, i (m)
εSoil reflectivity (albedo)
γCoefficient of variation of cell performance due to cell temperature
ηmotorMotor performance (p.u.)
ηpumpPump performance (p.u.)
ηpump,OPump performance at operating point (p.u.)
ηVFDFrequency inverter efficiency (p.u.)
φAngle of inclination of the photovoltaic modules
θAngle of incidence of direct solar radiation on the inclined plane of the solar panel
θzAngle of incidence of direct solar radiation on the horizontal plane
ρWater density (kg·m−3)

References

  1. Corominas, J. Agua y energía en el riego, en la época de la sostenibilidad. Ing. Del Agua 2010, 17, 219–233. [Google Scholar] [CrossRef] [Green Version]
  2. Senthil Kumar, S.; Bibin, C.; Akash, K.; Aravindan, K.; Kishore, M.; Magesh, G. Solar powered water pumping systems for irrigation: A comprehensive review on developments and prospects towards a green energy approach. Mater. Today Proc. 2020, 33, 303–307. [Google Scholar] [CrossRef]
  3. Hussin, F.; Issabayeva, G.; Aroua, M.K. Solar photovoltaic applications: Opportunities and challenges. Rev. Chem. Eng. 2018, 34, 503–528. [Google Scholar] [CrossRef]
  4. Campana, P.E.; Li, H.; Zhang, J.; Zhang, R.; Liu, J.; Yan, J. Economic optimization of photovoltaic water pumping systems for irrigation. Energy Convers. Manag. 2015, 95, 32–41. [Google Scholar] [CrossRef] [Green Version]
  5. Instituto de Energía Solar (UPM) Gráficos Significativos Energía Solar Fotovoltaica. 2018, p. 61. Available online: https://www.ies.upm.es/sfs/IES/IES-UPM/Portada/2018_PV_Espa%c3%b1a.pdf (accessed on 9 August 2021).
  6. Bouzidi, B. New sizing method of PV water pumping systems. Sustain. Energy Technol. Assess. 2013, 4, 1–10. [Google Scholar] [CrossRef]
  7. Posadillo, R.; López Luque, R. A sizing method for stand-alone PV installations with variable demand. Renew. Energy 2008, 33, 1049–1055. [Google Scholar] [CrossRef]
  8. Reca-Cardeña, J.; López-Luque, R. Design Principles of Photovoltaic Irrigation Systems. Adv. Renew. Energies Power Technol. 2018, 1, 295–333. [Google Scholar]
  9. Sontake, V.C.; Kalamkar, V.R. Solar photovoltaic water pumping system—A comprehensive review. Renew. Sustain. Energy Rev. 2016, 59, 1038–1067. [Google Scholar] [CrossRef]
  10. Orts-Grau, S.; Gonzalez-Altozano, P.; Gimeno-Sales, F.J.; Balbastre-Peralta, I.; Marquez, C.I.M.; Gasque, M.; Segui-Chilet, S. Photovoltaic Water Pumping: Comparison between Direct and Lithium Battery Solutions. IEEE Access 2021, 9, 101147–101163. [Google Scholar] [CrossRef]
  11. López-Luque, R.; Reca, J.; Martínez, J. Optimal design of a standalone direct pumping photovoltaic system for deficit irrigation of olive orchards. Appl. Energy 2015, 149, 13–23. [Google Scholar] [CrossRef]
  12. Hamidat, A.; Benyoucef, B. Systematic procedures for sizing photovoltaic pumping system, using water tank storage. Energy Policy 2009, 37, 1489–1501. [Google Scholar] [CrossRef]
  13. Hamidat, A.; Benyoucef, B.; Hartani, T. Small-scale irrigation with photovoltaic water pumping system in Sahara regions. Renew. Energy 2003, 28, 1081–1096. [Google Scholar] [CrossRef]
  14. Meah, K.; Fletcher, S.; Ula, S. Solar photovoltaic water pumping for remote locations. Renew. Sustain. Energy Rev. 2008, 12, 472–487. [Google Scholar] [CrossRef]
  15. Yang, H.; Lu, L.; Zhou, W. A novel optimization sizing model for hybrid solar-wind power generation system. Sol. Energy 2007, 81, 76–84. [Google Scholar] [CrossRef]
  16. Zhou, W.; Lou, C.; Li, Z.; Lu, L.; Yang, H. Current status of research on optimum sizing of stand-alone hybrid solar-wind power generation systems. Appl. Energy 2010, 87, 380–389. [Google Scholar] [CrossRef]
  17. Kamel, S.; Dahl, C. The economics of hybrid power systems for sustainable desert agriculture in Egypt. Energy 2005, 30, 1271–1281. [Google Scholar] [CrossRef]
  18. Carroquino, J.; Dufo-López, R.; Bernal-Agustín, J.L. Sizing of off-grid renewable energy systems for drip irrigation in Mediterranean crops. Renew. Energy 2015, 76, 566–574. [Google Scholar] [CrossRef]
  19. Dufo-López, R.; Bernal-Agustín, J.L.; Yusta-Loyo, J.M.; Domínguez-Navarro, J.A.; Ramírez-Rosado, I.J.; Lujano, J.; Aso, I. Multi-objective optimization minimizing cost and life cycle emissions of stand-alone PV–wind–diesel systems with batteries storage. Appl. Energy 2011, 88, 4033–4041. [Google Scholar] [CrossRef]
  20. Muhsen, D.H.; Khatib, T.; Abdulabbas, T.E. Sizing of a standalone photovoltaic water pumping system using hybrid multi-criteria decision making methods. Sol. Energy 2018, 159, 1003–1015. [Google Scholar] [CrossRef]
  21. Ramli, M.A.M.; Bouchekara, H.R.E.H.; Alghamdi, A.S. Optimal sizing of PV/wind/diesel hybrid microgrid system using multi-objective self-adaptive differential evolution algorithm. Renew. Energy 2018, 121, 400–411. [Google Scholar] [CrossRef]
  22. Haffaf, A.; Lakdja, F.; Meziane, R.; Abdeslam, D.O. Study of economic and sustainable energy supply for water irrigation system (WIS). Sustain. Energy Grids Netw. 2021, 25, 100412. [Google Scholar] [CrossRef]
  23. Benlarbi, K.; Mokrani, L.; Nait-Said, M.S. A fuzzy global efficiency optimization of a photovoltaic water pumping system. Sol. Energy 2004, 77, 203–216. [Google Scholar] [CrossRef]
  24. Ghoneim, A.A. Design optimization of photovoltaic powered water pumping systems. Energy Convers. Manag. 2006, 47, 1449–1463. [Google Scholar] [CrossRef]
  25. Glasnovic, Z.; Margeta, J. A model for optimal sizing of photovoltaic irrigation water pumping systems. Sol. Energy 2007, 81, 904–916. [Google Scholar] [CrossRef]
  26. Campana, P.E.; Li, H.; Yan, J. Dynamic modelling of a PV pumping system with special consideration on water demand. Appl. Energy 2013, 112, 635–645. [Google Scholar] [CrossRef] [Green Version]
  27. Gao, X.; Liu, J.; Zhang, J.; Yan, J.; Bao, S.; Xu, H.; Qin, T. Feasibility evaluation of solar photovoltaic pumping irrigation system based on analysis of dynamic variation of groundwater table. Appl. Energy 2013, 105, 182–193. [Google Scholar] [CrossRef]
  28. Reca, J.; Torrente, C.; López-Luque, R.; Martínez, J. Feasibility analysis of a standalone direct pumping photovoltaic system for irrigation in Mediterranean greenhouses. Renew. Energy 2016, 85, 1143–1154. [Google Scholar] [CrossRef] [Green Version]
  29. Gualteros, S.; Rousse, D.R. Solar water pumping systems: A tool to assist in sizing and optimization. Sol. Energy 2021, 225, 382–398. [Google Scholar] [CrossRef]
  30. Allouhi, A.; Buker, M.S.; El-houari, H.; Boharb, A.; Benzakour Amine, M.; Kousksou, T.; Jamil, A. PV water pumping systems for domestic uses in remote areas: Sizing process, simulation and economic evaluation. Renew. Energy 2019, 132, 798–812. [Google Scholar] [CrossRef]
  31. Mana, A.; Allouhi, A.; Ouazzani, K.; Jamil, A. Toward a Sustainable Agriculture in Morocco Based on Standalone PV Pumping Systems: A Comprehensive Approach. Green Energy Technol. 2021, 399–433. [Google Scholar] [CrossRef]
  32. Ehrmann, S.; Fickert, L.; Nolz, R. Optimizing the setup of a photovoltaic pumping system for irrigation considering different crop water requirements. JPE 2019, 9, 043104. [Google Scholar] [CrossRef]
  33. Cuadros, F.; López-Rodríguez, F.; Marcos, A.; Coello, J. A procedure to size solar-powered irrigation (photoirrigation) schemes. Sol. Energy 2004, 76, 465–473. [Google Scholar] [CrossRef]
  34. Campana, P.E.; Zhu, Y.; Brugiati, E.; Li, H.; Yan, J. PV water pumping for irrigation equipped with a novel control system for water savings. Energy Procedia 2014, 61, 949–952. [Google Scholar] [CrossRef] [Green Version]
  35. Mérida García, A.; Fernández García, I.; Camacho Poyato, E.; Montesinos Barrios, P.; Rodríguez Díaz, J.A. Coupling irrigation scheduling with solar energy production in a smart irrigation management system. J. Clean. Prod. 2018, 175, 670–682. [Google Scholar] [CrossRef]
  36. Zavala, V.; López-Luque, R.; Reca, J.; Martínez, J.; Lao, M.T. Optimal management of a multisector standalone direct pumping photovoltaic irrigation system. Appl. Energy 2020, 260, 114261. [Google Scholar] [CrossRef]
  37. Doorenbos, J.; Pruitt, W.O. Crop Water Requirements. FAO Irrig. Drain. 1977, 24, 144. [Google Scholar]
  38. Allen, R.G.; Food and Agriculture Organization of the United Nations. Crop Evapotranspiration: Guidelines for Computing Crop Water Requirements; Food and Agriculture Organization of the United Nations: Rome, Italy, 1998; ISBN 9251042195. [Google Scholar]
  39. Villalobos, F.J.; Mateos, L.; Ogaz, F.; Fereres, E. Fitotecnia: Bases y Tecnologías de la Producción Agrícola; Mundi-Prensa: Madrid, Spain, 2009; ISBN 9788484765288. [Google Scholar]
  40. Dastane, N.G.; Food and Agriculture Organization of the United Nations. Effective Rainfall in Irrigated Agriculture; Food and Agriculture Organization of the United Nations: Rome, Italy, 1974; ISBN 925100272X. [Google Scholar]
  41. Línea ULTRA-Módulos Fotovoltaicos-Productos y Servicios-Atersa. Available online: https://atersa.com/es/productos-servicios/modulos-fotovoltaicos/linea-ultra/ (accessed on 21 August 2021).
  42. Orgaz, F.; Fereres, E.; Testi, L. Riego. In El Cultivo del Olivo; Barranco, D., Fernández-Escobar, R., Rallo, L., Eds.; Ediciones Mundi-Prensa: Madrid, Spain, 2017; pp. 461–490. ISBN 978-84-8476-714-5. [Google Scholar]
  43. Pastor Muñoz-Cobo, M. Olivicultura y elaiotecnia. In Programació de Riegos en Olivar; Junta de Andalucía, Consejería de Agricultura y Pesca: Sevilla, Spain, 2001; ISBN 8484740323. [Google Scholar]
  44. NB|Grundfos. Available online: https://product-selection.grundfos.com/es/products/nb-nbe-nbe-series-2000/nb?tab=models (accessed on 21 August 2021).
  45. ABB Low Voltage. General Performance Motors. Catalog; ABB: Zurich, Switzerland, 2018. [Google Scholar]
  46. SD700|Power Electronics. Available online: https://power-electronics.com/es/productos/productos-industrial/sd700/ (accessed on 21 August 2021).
  47. Agencia Andaluza de la Energía. Consejería de Innovación, C. y E. Mapa de Radiación Solar. Available online: https://www.agenciaandaluzadelaenergia.es/Radiacion/radiacion1.php (accessed on 19 July 2020).
  48. MATLAB-El Lenguaje del Cálculo Técnico-MATLAB & Simulink. Available online: https://es.mathworks.com/products/matlab.html (accessed on 20 October 2021).
  49. Duffie, J.A.; Beckman, W.A. Solar Radiation, 4th ed.; Wiley Online Books: New York, NY, USA, 2013; ISBN 9781118671603. [Google Scholar]
  50. Collares-Pereira, M.; Rabl, A. The average distribution of solar radiation-correlations between diffuse and hemispherical and between daily and hourly insolation values. Sol. Energy 1979, 22, 155–164. [Google Scholar] [CrossRef]
  51. Fraile Mora, J.; Fraile Ardanuy, J. Accionamientos Eléctricos, 1st ed.; Ibergarceta: Madrid, Spain, 2016; ISBN 9788416228492. [Google Scholar]
  52. AENOR. Ecodesign for Power Drive Systems, Motor Starters, Power Electronics & Their Driven Applications—Part 2: Energy Efficiency Indicators for Power Drive Systems and Motor Starters, UNE-EN 50598-2; AENOR: Madrid, Spain, 2015. [Google Scholar]
  53. Abella, M.A.; Lorenzo, E.; Chenlo, F. PV water pumping systems based on standard frequency converters. Prog. Photovolt. Res. Appl. 2003, 11, 179–191. [Google Scholar] [CrossRef]
  54. Alonso-Abella, M.; Lorenzo, E.; Chenlo, F. Sistemas de bombeo fotovoltaico. Optimización del uso de convertidores de frecuencia con bombas centrífugas y motores trifásicos. In Era Solar: Energías Renovables, No 106; SAPT Publicaciones Técnicas S.L.: Madrid, Spain, 2002; pp. 14–35. [Google Scholar]
  55. Bhave, P.R. Analysis of Flow in Water Distribution Networks; Technomic Publishing: Lancaster, UK, 1991. [Google Scholar]
  56. Ángeles Montiel, V.; Arteaga Ramírez, R.; Vázquez Peña, M.A.; Carrillo García, M.; Ibáñez Castillo, L.A. Factores de ajuste para la pérdida de carga por fricción en tuberías con salidas múltiples telescópicas o con servicio mixto. Ing. Del Agua 2007, 14, 293–305. [Google Scholar] [CrossRef] [Green Version]
  57. Pereira, L.; de Juan Valero, J.; Raquel Picornell Buendia, M.; Tarjuelo Martin-Benito, J. El Riego y sus Tecnologías; CREA-UCLM: Albacete, Spain, 2010; ISBN 13-978-84-692-9979-1. [Google Scholar]
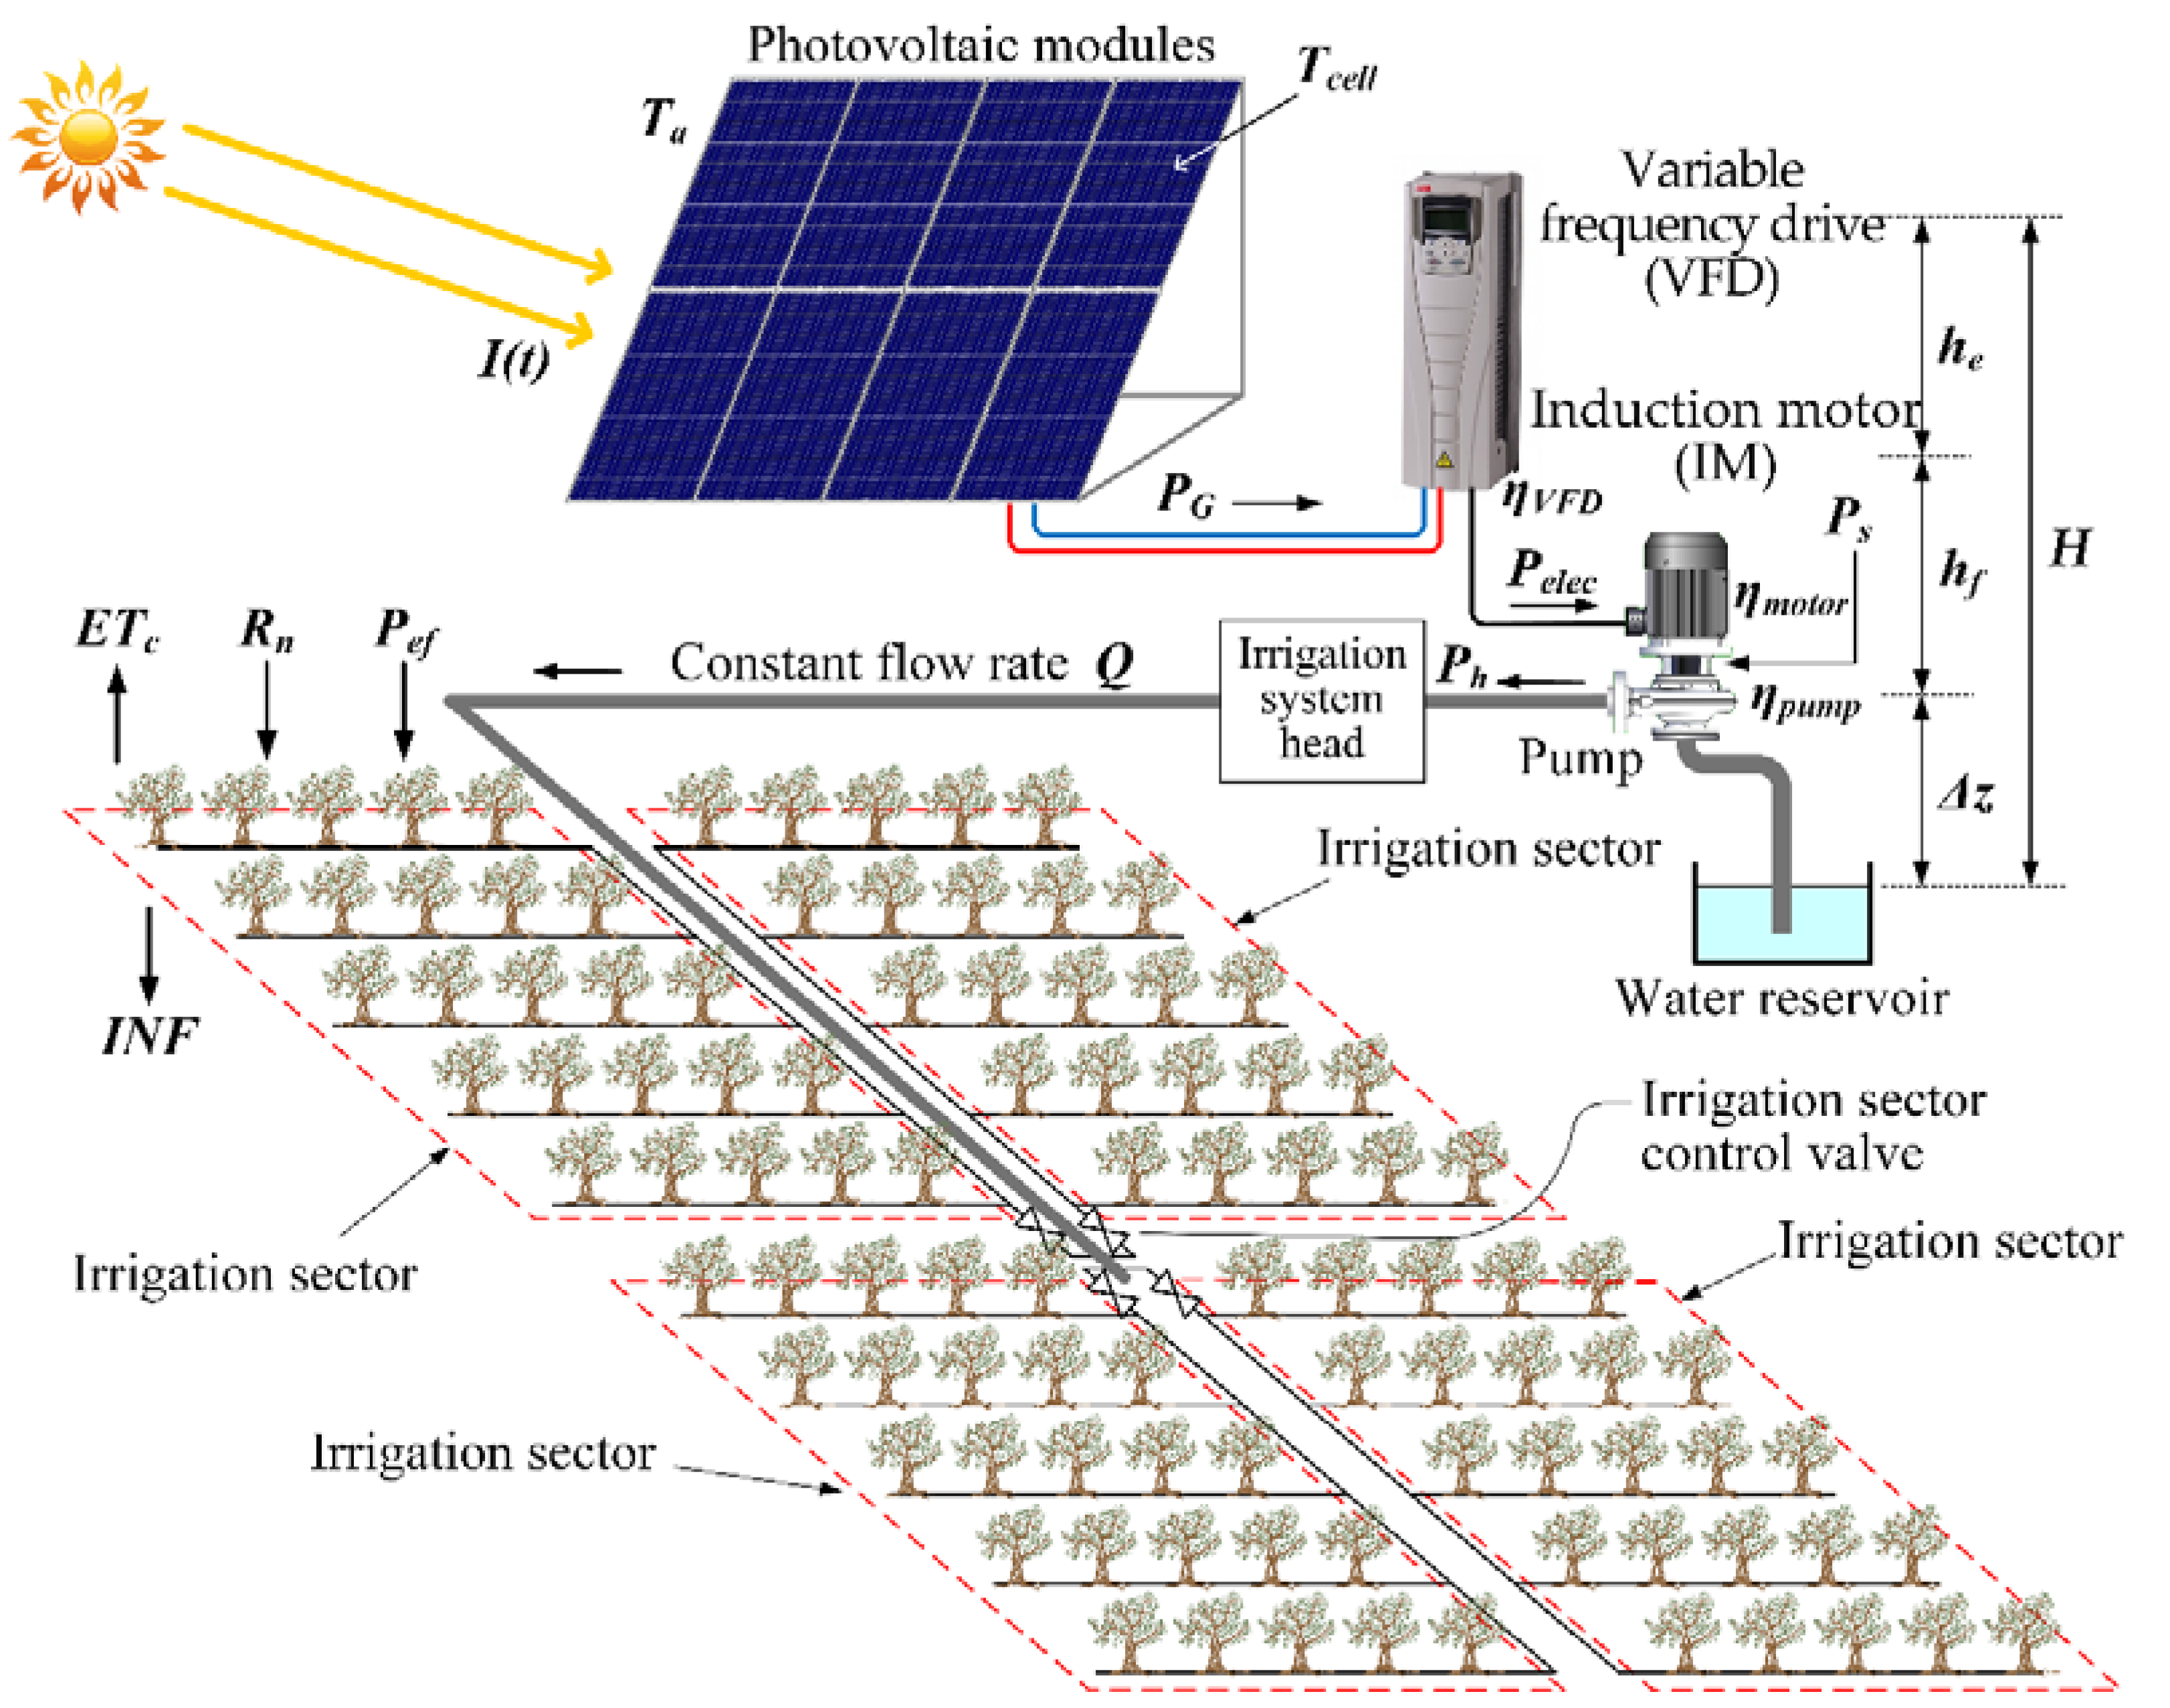
Figure 1. Scheme of the direct photovoltaic irrigation system.
Agronomy 11 02313 g001
Figure 2. Scheme of the elements that make up the system under study in this work.
Agronomy 11 02313 g002
Figure 3. Flowchart of the methodology.
Agronomy 11 02313 g003
Figure 4. Olive grove farm and photovoltaic irrigation system.
Agronomy 11 02313 g004
Figure 5. Monthly values of crop evapotranspiration (ETc), effective precipitation (Pef) and net irrigation scheduling. Irrigation has been programmed so that in the May–September period the reserve is gradually depleted in order to reach management allowable depletion soil water (MAD) at the end of September.
Agronomy 11 02313 g005
Figure 6. Weekly programming of gross daily irrigation, in minutes, for the irrigation season between April and September.
Agronomy 11 02313 g006
Figure 7. Average values of the evolution of the daily maximum and minimum temperature, radiation, precipitation and ETo in the study area (2004–2018).
Agronomy 11 02313 g007
Figure 8. Characteristic curves of the centrifugal pump at different rotational speeds and the 15 operating points corresponding to the minimum values of pressure supplied to the irrigation network for each combination of irrigation sectors C1 to C15 (Table 9).
Agronomy 11 02313 g008
Figure 9. Power curves on the centrifugal pump shaft at different operating frequencies and 15 operating points corresponding to the minimum power values on the pump shaft for each combination of irrigation sectors C1 to C15 (Table 9).
Agronomy 11 02313 g009
Figure 10. Evolution of the amount of water in the soil for the farm’s irrigation sector 1. Configuration of the photovoltaic system with 8 strings of 20 panels A-315M. In the other three sectors, the evolution is the same. (a) Results of the simulation of the evolution of the amount of water in the soil. It looks similar to curve D in Figure 5. (b) Soil water inputs and outputs used for the water balance.
Agronomy 11 02313 g010
Figure 11. Graph of the minimum power of supply and demand for the combination of sectors established in the daily work matrix of the corresponding day. Moreover, the working frequency of the converter for transmitting the generated power to the hydraulic system is demonstrated.
Agronomy 11 02313 g011
Figure 12. Frequency distribution of the combination of sectors of the daily work matrix simulation results for a configuration of 8 strings of 20 photovoltaic panels. Absolute frequency in hours. Combination of sectors C1 to C15 ordered from lowest to highest power required for operation. Green bars: operating hours for each combination of sectors. Label on bar: minimum electrical power required for the operation of the combination of sectors.
Agronomy 11 02313 g012
Figure 13. Monthly evolution of the efficiency of the use of energy and the saving of CO2 emissions throughout the year. Generator made up of 8 strings of 20 panels A-315M.
Agronomy 11 02313 g013
Table 1. Power demand matrix of the irrigation system for s sectors.
1234
DecimalBinaryFlow
Q
Height
H
Power
PG
SsS4S3S2S1
0100001Q1sH1sPG1s
0200010Q1sH1sPG1s
0300011Q2sH2sPG2s
0400100Q1sH1sPG1s
0500101Q2sH2sPG2s
0600110Q2sH2sPG2s
0700111Q3sH3sPG3s
0801000Q1sH1sPG1s
0901001Q2sH2sPG2s
1001010Q2sH2sPG2s
1101011Q3sH3sPG3s
1201100Q2sH2sPG2s
1301101Q3sH3sPG3s
1401110Q3sH3sPG3s
1501111Q4sH4sPG4s
C11111QSsHSsPGSs
Table 2. Daily work matrix for day ‘j’. Both columns and sectors. The shaded rows have fixed values for the entire day.
Row.
1Number of the sector
2Irrigation demand for day ‘j’
3Irrigation deficit from the previous day
4Total deficit, updated throughout the day
5D, at the start of day ‘j’
6Irrigation applied during day ‘j’
7D updated
8Priority of sectors for irrigation
9Combination of sectors for multisectoral irrigation, according to the priority fixed for row 8.
10Power of demand for the priority of fixed sector
11Sectors in irrigation (0 = without irrigation, 1 = irrigating)
Table 3. Data from the daily work matrix for power management. Rprg,j,s = Irrigation scheduled for day j and sector s, in minutes. ΣRj,s = Sum of irrigation carried out on day j and sector s, in minutes. ΣRnj,s = Sum of the net irrigation carried out on day j in sector s, in mm. Rtotal,j,s = Rprg,j,s + Rprg,j−1,sΣRj−1,s. C(s,i) = Combination of the s sectors taken in groups of i sectors according to the order of row 8. PGSs = Minimum demand power for the combination C(s,i), in W. The shaded rows have fixed values for the entire day.
Row 1sNumber of sector, s
Row 2Rprg,j,sIrrigation programmed for day j and sector s (in min)
Row 3Rprg,j−1,s − ΣRj−1,sIrrigation pending the previous day j−1
Row 4Rprg,j,s +(Rprg,j−1,s − ΣRj−1,s) − ΣRj,sUpdated value of irrigation pending on day j, as f(t)
Row 5Dj−1,sD value that ended on day j−1
(in mm)
Row 6ΣRnj,sUpdated value of irrigation of day j
(in mm)
Row 7Dj,s = Dj−1,s − ΣRnj,sUpdated value of D for day j
Row 8Dj−1 = {Dj−1,1, Dj−1,2, …}
Rtotal,j = {Rtotal,j,1, Rtotal,j,2, …}
(Dj−1, ≥) ∪ (Rtotal,j, ≥)
Set of sectors ordered from highest to lowest D and irrigation time
Row 9{C(s,i)}Set of combinations of sectors ordered according to row 8
Row 10{PGSsC(s,i)}Set of the powers PGSs required for each combination of row 9
Row 11{0, 1}Irrigation status values for sector s
(0 = not irrigating, 1 = irrigating)
Table 4. Distribution conditions of generated power to demand power. PG is the effective power of the generator (supply matrix). PG1s, PG2s, PG3s and PG4s are the electrical powers demanded by the variator–motor pump–irrigation network system (column 4 of Table 1).
ConditionSectors in Irrigation
If P G < P G 1 s No sector
If P G 1 s P G < P G 2 s One sector, the of major priority
If P G 2 s P G < P G 3 s Two sectors, both of major priority
If P G 3 s P G < P G 4 s Three sectors, all 3 of major priority
If P G 4 s P G < P G 5 s Four sectors, all 4 of major priority
If
If P G S s P G s’ sectors (all the sectors)
Table 5. Agronomic characteristics of the olive plantation.
VariableValue
Distance between trees1.5 m
Distance between rows5 m
Tree density 1333 trees·ha−1
Volume of treetop3.75 m3
Volume of treetop by area0.5 m3/m2
Table 6. Characteristics of the soil of the farm under study.
VariableValue
Depth of rooting plants1 m
Soil field capacity, FC0.37 m3/m3
Permanent wilting point, PWP0.17 m3/m3
Permissible depletion level, RAW0.75 p.u.
Available humidity range TAW0.2 m3/m3
Management allowable depletion, MAD150 mm
Table 7. Technical characteristics photovoltaic panel A-315M. Data from [41].
VariableValue
Peak power315 Wp
Maximum power point current Impp8.45 A
Maximum power point voltage Vmpp37.3 V
Temperature coefficient of P (γ)−0.43%/°C
Nominal operating temperature NOCT47 °C
Table 8. Supply matrix for a generator configuration of 20 series panels and 8 strings.
Date and HourTa
(°C)
Ib(t)
(W·m−2)
Id(t)
(W·m−2)
Ir(t)
(W·m−2)
I(t)
(W·m−2)
PPV
(W)
PG
(kW)
18-Aug 8:45 A.M.24.44466.290200.6331.977668.89930,865.3826.54
18-Aug 9:00 A.M.25.14506.923212.0252.125721.07332,657.9028.09
18-Aug 9:15 A.M.25.85546.188222.6952.268771.15134,288.4629.49
18-Aug 9:30 A.M.26.56583.673232.5972.403818.67335,752.0730.75
18-Aug 9:45 A.M.27.29618.977241.6882.530863.19537,046.4931.86
18-Aug 10:00 A.M.28.01651.716249.9312.648904.29438,172.0132.83
18-Aug 10:15 A.M.28.72681.531257.2892.754941.57339,131.0033.65
Table 9. Demand matrix of the irrigation network for the combinations of 4 sectors.
12345678910
Combination of Sectors in Irrigation
(Decimal)
Sectors in Irrigation (Binary)Q
(m3·h−1)
H
(m.c.a.)
Ph
(kW)
ηpump
(p.u.)
Ps
(kW)
fo
(Hz)
ηmotor
(p.u.)
Pelec
(kW)
ηVFD
(p.u.)
PG
(kW)
S4S3S2S1
1000130.28145.6263.7620.4338.68036.1520.8979.6770.9769.915
2001031.25848.7964.1540.4339.59537.3880.90510.6070.97610.866
4010031.25860.2805.1310.40212.75241.6060.92313.8220.97614.155
8100031.99072.3286.3010.38316.44145.6180.93517.5910.97718.002
3001161.53852.4848.7950.61514.29639.0950.92815.3980.97615.772
5010161.53863.96710.7200.59018.15442.9770.93819.3460.97719.809
9100162.27176.06212.8990.57022.61846.7600.94523.9310.97824.481
6011062.51564.11710.9160.59418.36743.0500.93919.5640.97720.032
10101063.24876.21313.1270.57422.85746.8240.94524.1770.97824.733
12110063.24876.21313.1270.57422.85746.8240.94524.1770.97824.733
7011192.79669.64717.6000.66426.48846.0340.94927.9230.97728.572
11101193.52981.78420.8310.65431.82849.5030.95133.4540.97934.184
13110193.52981.78420.8310.65431.82849.5030.95133.4540.97934.184
14111094.50581.99221.1020.65632.17349.6100.95233.8120.97934.548
151111124.78689.25730.3320.67644.89753.4260.95347.1110.98148.037
Table 10. Evolution of the daily work matrix for the 160th day of the year (in the irrigation season). The shaded rows have fixed values for the entire day.
At Start of DayAt 9:00 h SolarAt End of Day
Day
160
1234 1234 1234
112341123411234
221021021021022102102102102210210210210
300003000030000
421021021021042104512021040000
534.8034.8034.8034.80534.8034.8034.8034.80534.8034.8034.8034.80
60.000.000.000.0060.002.181.190.0062.772.772.772.77
734.8034.8034.8034.80734.8032.6233.6134.80735.4235.4235.4235.42
841238412380000
9152614915261490000
1048.0410.8720.0334.551048.0410.8720.0334.55100.000.000.000.00
110000110110110000
Publisher’s Note: MDPI stays neutral with regard to jurisdictional claims in published maps and institutional affiliations.