Article

Deciphering Codon Usage Patterns in Genome of Cucumis sativus in Comparison with Nine Species of Cucurbitaceae

1
College of Horticulture, Gansu Agricultural University, Lanzhou 730070, China
2
Lanzhou Agro-Technical Research and Popularization Center, Lanzhou 730010, China
*
Author to whom correspondence should be addressed.
Agronomy 2021, 11(11), 2289; https://doi.org/10.3390/agronomy11112289
Submission received: 27 September 2021 / Revised: 9 November 2021 / Accepted: 10 November 2021 / Published: 12 November 2021
(This article belongs to the Special Issue Breeding, Genetics, and Genomic of the Genus Cucumis)

Abstract

:
Cucumber is the most important vegetable crop in the Cucurbitaceae family. Condon usage bias (CUB) is a valuable character of species evolution. However, there is little research on the CUB of cucumber. Thus, this study analyzes the codon usage patterns of cucumber and its relatives within Cucurbitaceae on the genomic level. The analysis of fundamental indicators of codon characteristics shows that it was slightly GC poor, and there was weak codon usage bias in cucumber. We conduct the analysis of neutrality plot, ENC plot, P2 index, and COA indicates that the nucleotide composition, mutation pressure, and translational selection might play roles in CUB in cucumber and its relatives. Among these factors, nucleotide composition might play the most critical role. Based on these analyses, 30 optimal codons were identified in cucumber, most of them ending with U or A. Meanwhile, based on the RSCU values of species, a cluster tree was constructed, in which the situation of cucumber is consistent with the current taxonomic and evolutionary studies in Cucurbitaceae. This study systematically compared the CUB patterns and shaping factors of cucumber and its relatives, laying a foundation for future research on genetic engineering and evolutionary mechanisms in Cucurbitaceae.

1. Introduction

Cucumber (Cucumis sativus L.), having high-quality genome information, was the first vegetable crop to be sequenced, and it is widely cultivated worldwide as one of the most economically important vegetable crop species [1]. The research on cucumber involves many fields, including breeding [2,3], protected cultivation [4,5], disease control [6,7], biotic and abiotic stresses [8,9], and metabolic regulation [10,11]. With the rapid development of sequencing and omics technology, the released genomic information of cucumber and its related species is growing abundantly, which speeds up the research progress in these fields [12,13,14].
Melon (Cucumis melo L.), with a larger genome than cucumber, is the second crop sequenced in Cucurbitaceae. It has 27,427 annotated protein-coding genes, and it was believed that transposon amplification is the reason for its genome enlargement [15]. Subsequently, the genomes of watermelon (Citrullus lanatus L.) [16], bitter gourd (Momordica charantia L.) [17], and bottle gourd (Lagenaria siceraria L.) [18] were sequenced. The genomic information of four species of Cucurbita (Cucurbita maxima L., Cucurbita moschata L., Cucurbita pepo L., and Cucurbita argyrosperma L.) has also been released one after another [19,20,21]. Not long ago, the genome sequences of snake gourd (Trichosanthes anguina L.) [22] and chayote (Sechium edule L.) [23] were released by Chinese scholars. Due to the rapid development of sequencing technology and bioinformatics analysis methods, the newly released genomes have reached the assembly level of chromosome level. Comparative genomic analysis is growing in-depth, showing the evolutionary process between species, including detection of paleoploidization (whole genome duplication (WGD)) events. The disclosure of such information provides basic materials for a deep understanding of the structure and function of the plant genome at the whole genome level. It provides an opportunity to improve the characteristics of Cucurbitaceae crops at the molecular level.
Condon usage bias (CUB) is an important phenomenon that can reflect the evolutionary relationship of species to some extent [24,25,26]. Among the 20 amino acids making up the organisms, except methionine and tryptophan, the other 18 amino acids are encoded by two to six codons. The synonymous codons usage frequency is often different in gene translation into protein. In different organisms, there is also a difference in the preferences for synonymous codons. Such preference for the use of synonymous codons is called CUB. The evaluation indicators of CUB usually include relative synonymous codon usage (RSCU) [27], codon adaptation index (CAI) [28,29], effective number of codons (ENC) [30], frequency of optimal codons (FOP) [31], and codon bias index (CBI) [32]. It is considered that the formation of CUB is affected by various factors, including GC contents, mutation pressure, natural selection, expression level, and protein length [31,33,34]. Species with close genetic relationships often have similar CUB characteristics due to bearing comparable evolutionary pressure [25,26].
The acquisition of genome sequence coding data may be an effective way to speculate on gene products, gene functions, and species evolution. With the publication of genome-wide sequences of more and more species, including prokaryotes and eukaryotes, there are more possibilities to explore the characteristics of CUB at the genome-wide level, such as in rice, maize, and apples [35,36,37]. However, in addition to the codon usage table obtained from the study of melon transcriptome data, the study on the CUB characteristics of Cucurbitaceae crops represented by cucumber has few relevant reports [38].
In this study, the CUB characteristics of cucumber and the other nine Cucurbitaceae crops at the genomic level were analyzed through multivariate mathematics, and the causes of their formation were also explored. At the same time, we identified the optimal codons of each species and carried out species clustering based on synonymous codon usage patterns. This work might help us better understand the patterns of codon bias in Cucurbitaceae and provide help for future research on genetic engineering and molecular evolution of these species.

2. Materials and Methods

2.1. Sequences Acquisition

The complete coding sequences (CDSs) of B. hispida, C. lanatus, C. maxima, C. melo, C. moschata, C. pepo, C. sativus, L. siceraria, S. edule and T. anguina were firstly downloaded from the website of CuGenDB (http://cucurbitgenomics.org (accessed on 16 May 2021)). Then, they were selected by a homemade Perl script according to the following rules: (1) each sequence begins with ATG and ends with TAA, TAG, or TGA; (2) the length of each sequence is greater than 300 bp and can be divided by three; and (3) there was no intermediate stop codon in each sequence. Finally, a new sequence set was made for downstream analyses. A total of 20,274 CDS of the whole genome in Cucumis sativus were selected, including 8,136,638 codons. Meanwhile, a total of 208,519 CDS were selected from the other nine sequenced species to carry out comparative analysis in Cucurbitaceae. The information about sequence sources and the numbers before and after selection of each species are recorded in Table 1.

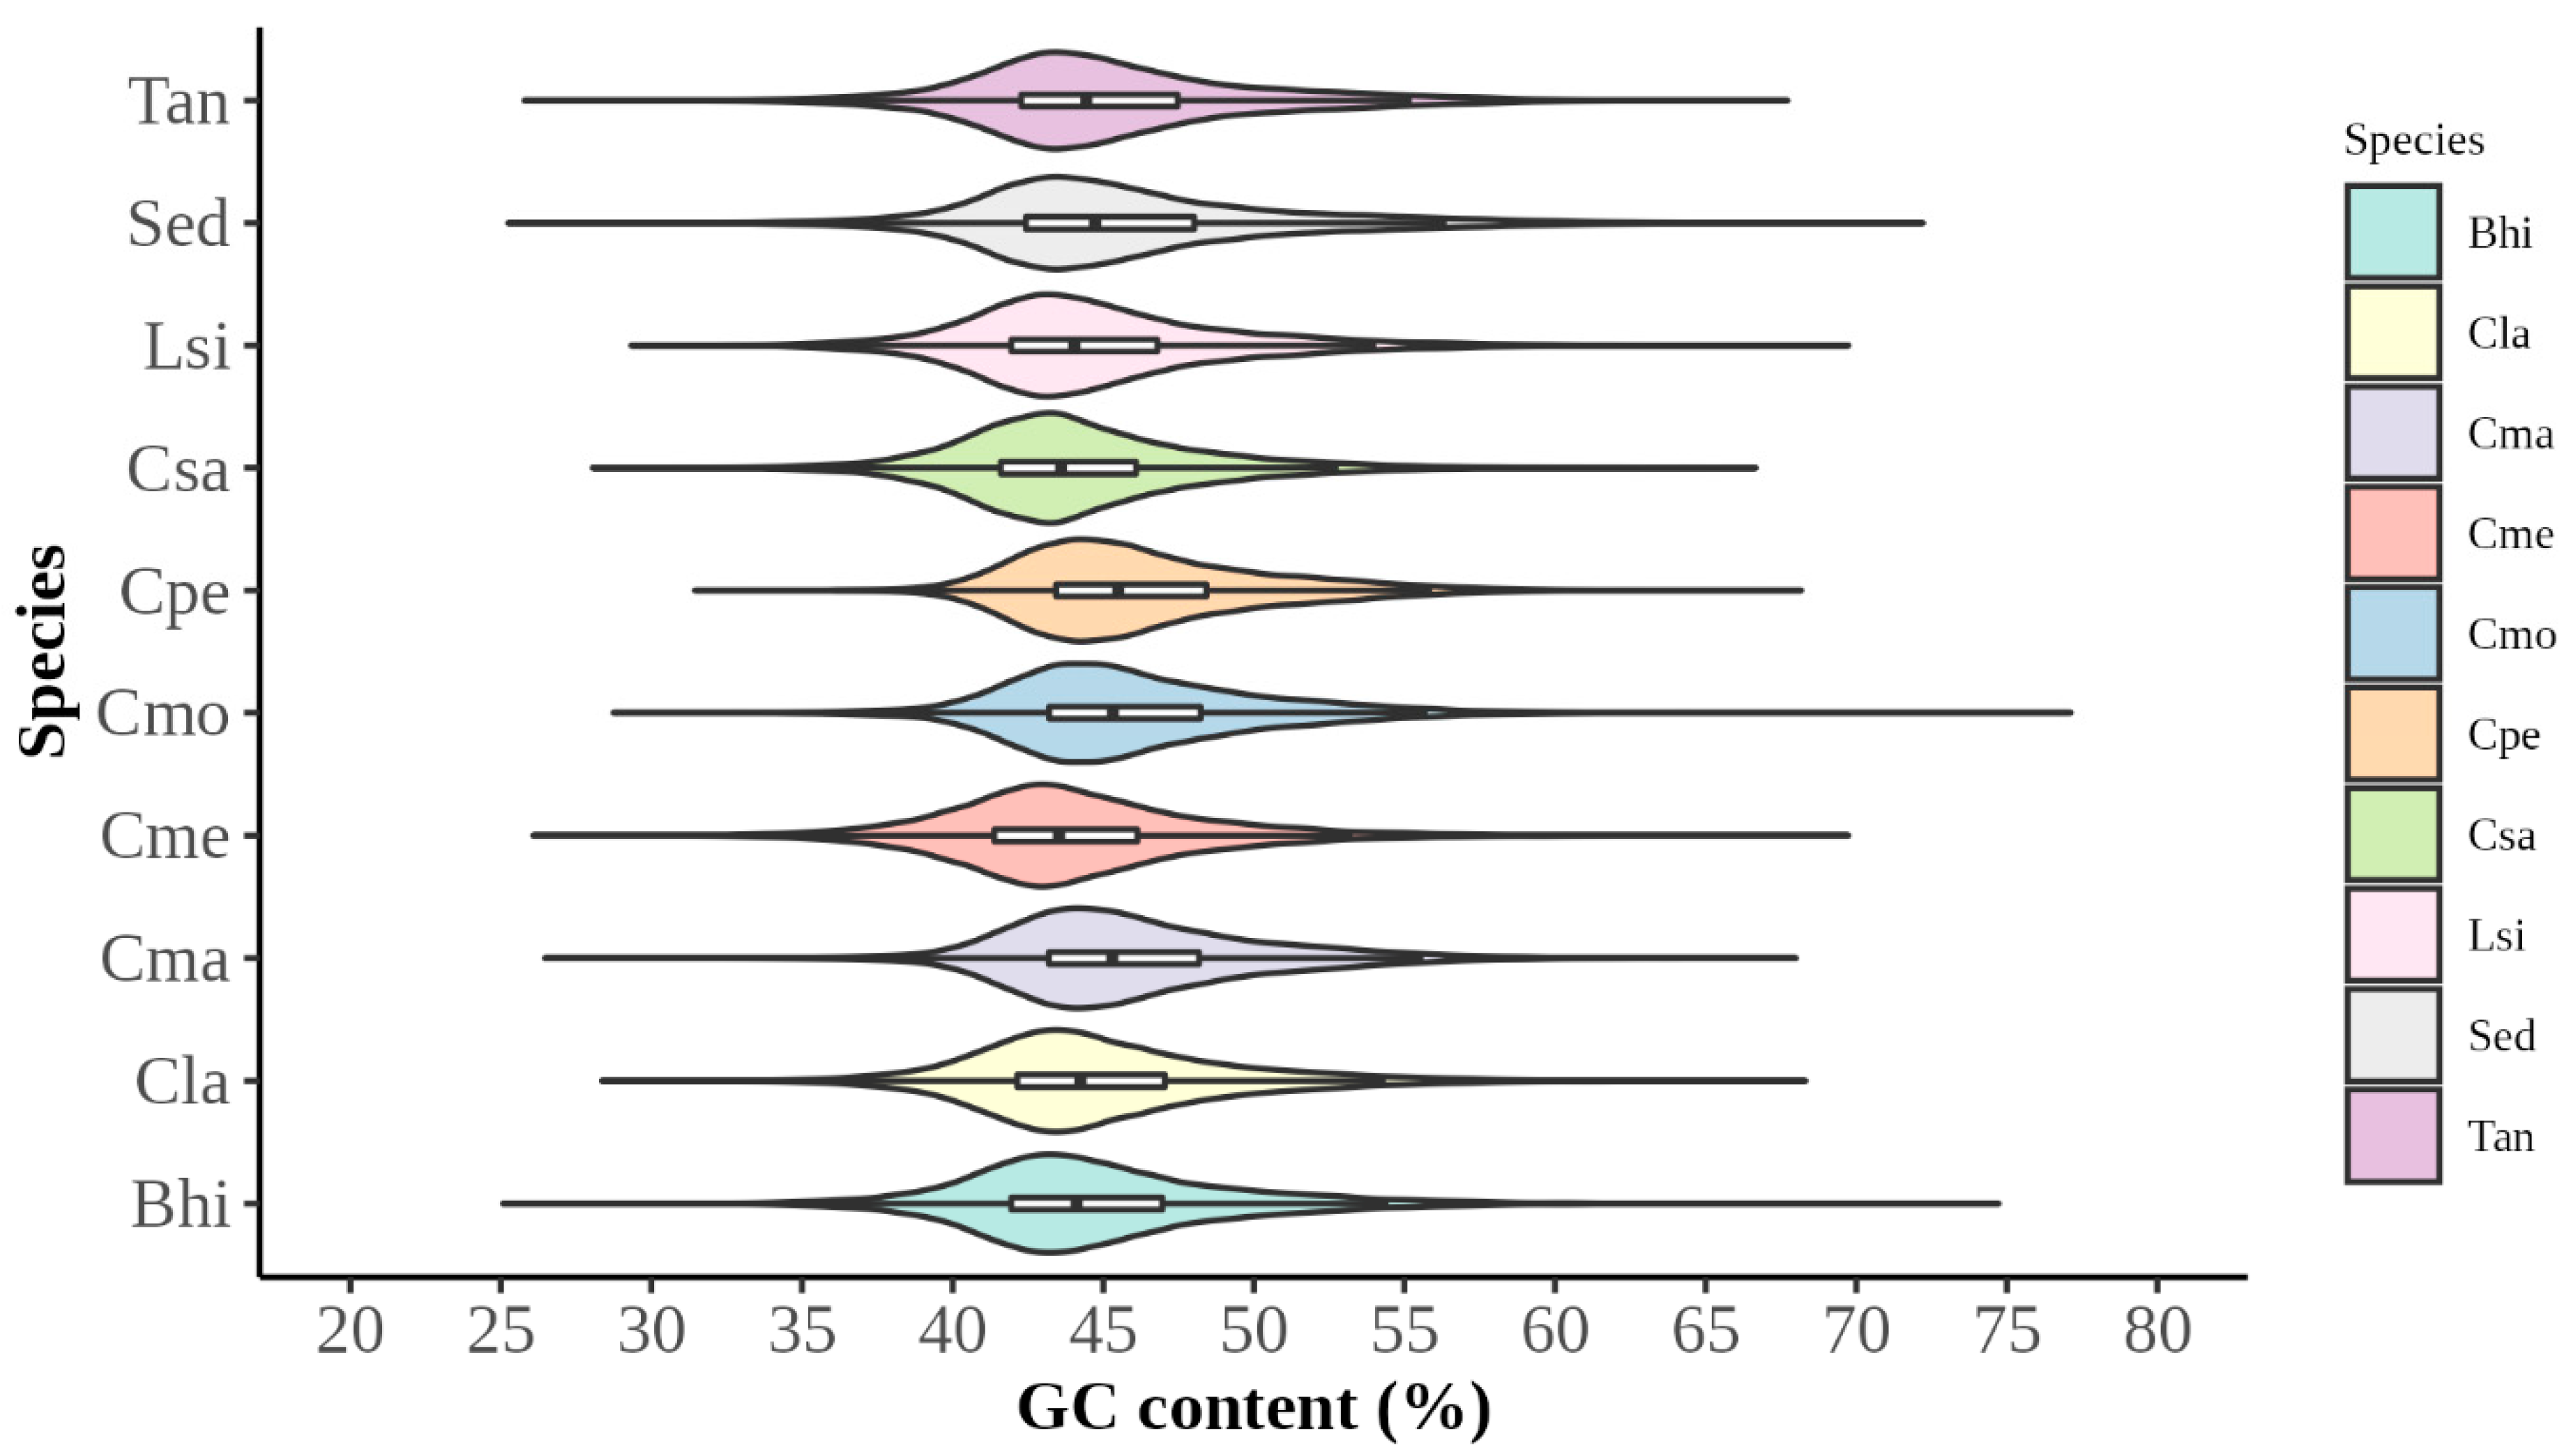
2.2. Nucleotide Composition Analysis

GC contents of the triplet codon at different positions (GC1, GC2, and GC3) and as a whole (GCall) of each sequence were calculated by Perl scripts (downloaded from the website: https://github.com/hxiang1019/calc_GC_content.git (accessed on 5 September 2021)). The frequency of the synonymous codon at the third position of adenine, thymine, guanine, and cytosine (A3s, T3s, G3s, and T3s) and total frequency of guanine and cytosine (GC3s) were calculated by CodonW software (http://codonw.sourceforge.net/, version: 1.4.2 (accessed on 5 September 2021)) with default parameters [39].

2.3. Indicators of Codon Usage

The effective number of codons (ENC), codon adaption index (CAI), and relative synonymous codon usage (RSCU) for each sequence and the whole genome were calculated by CodonW software with default parameters.
ENC represents the capacity for codons to encode amino acids. The value range of ENC is 20 (when only one codon is used for each amino acid) to 61 (when each codon is used equally). The smaller value of ENC represents the greater bias [30,40].
CAI is a quantitative index, which calculates the similarity of synonymous codon usage compared with the reference set. It is usually used to measure the relative expression of genes. CAI value is between 0 and 1. The higher value of CAI represents the more robust adaptability, namely the higher relative expression level [28].
RSCU is used to measure the overall CUB among genes. It is defined as the ratio between the number of times a synonymous codon is used and the number of times it is expected to appear. The expected number of occurrences is the average number of uses of all codons of the amino acid encoded by the codon. The following formula calculates it: RSCU = x i j j n i x i j n i , xij represents the frequency of codon j encoding for the ith amino acid, ni represents the number of synonymous codons encoding the i th amino acid.
For 59 codons, when the calculated RSCU value of a codon is greater than 1, it indicates that this codon has a high frequency of use among all synonymous codons [41,42]. To illustrate the distribution of RSCU values at different positions of codons, a heatmap was drawn by TBtools software [43], with the first two nucleotides of triplet codons as ordinate and the third one as abscissa.

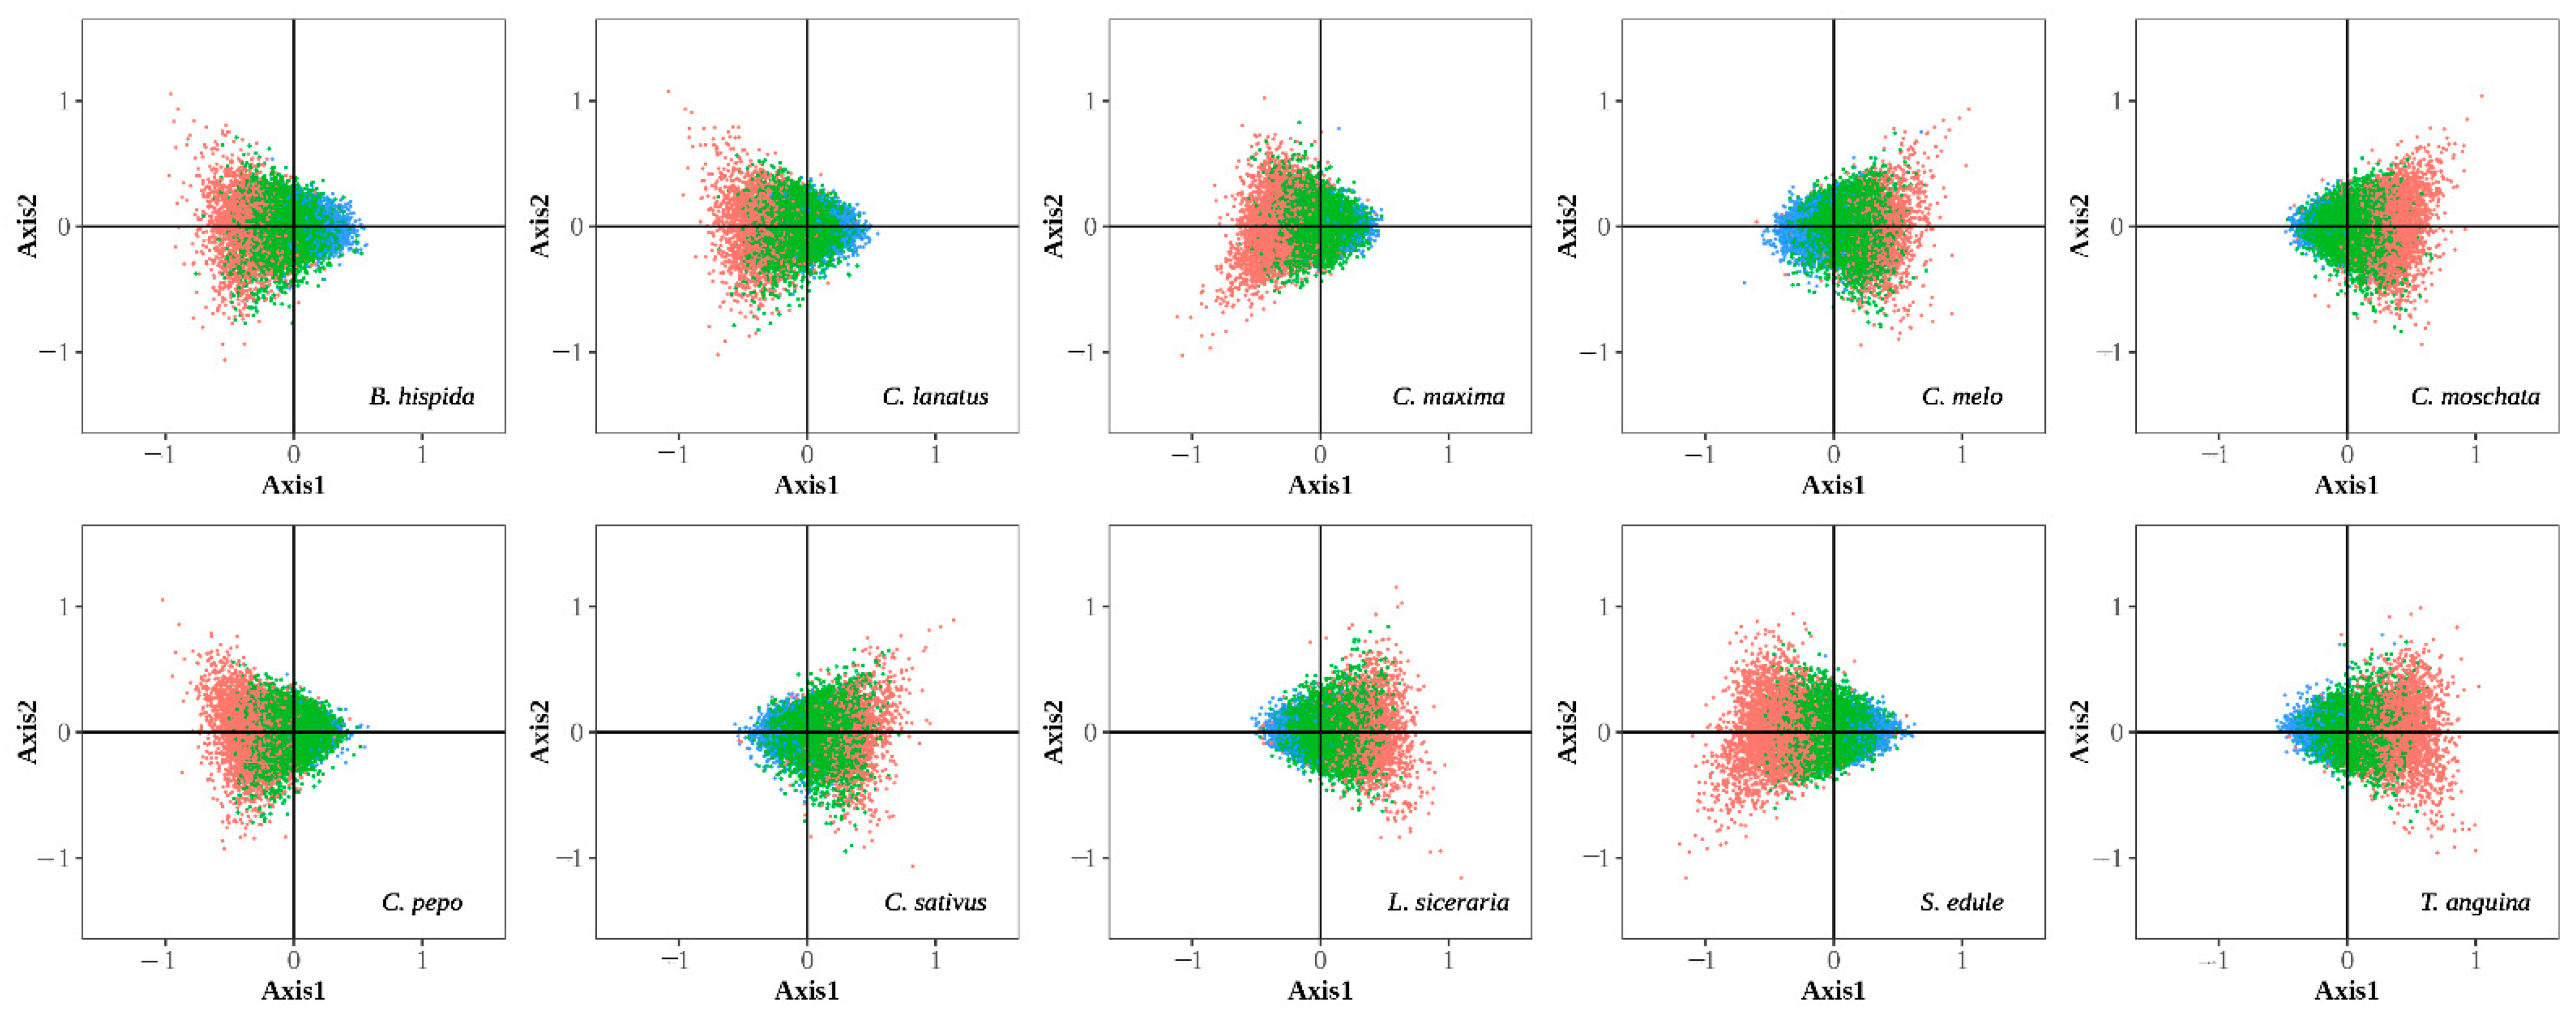
2.4. Correspondence Analysis and Correlation Analysis

Correspondence analysis (COA) was also conducted by CodonW software based on RSCU values. The variation of skewness between sequences is decomposed into 59 axes in the super dimensional quadrant. The correlation between the axis and codon usage characteristics decreases with the order of axis; namely, the primary axes explain the maximum changes in codon usage [44]. The distribution of different sequences or different codons on the plane composed of the first two axes was drawn in the form of a scatter plot.
Correlation analysis is used to determine the main factors affecting codon bias. The correlation coefficient between them was calculated by the R language package to explain the contribution of different influence factors to codon usage bias (CUB).

2.5. The Analysis of the Source of CUB

The effect of mutation pressure on CUB was analyzed by neutrality plot, with GC3 as abscissa and GC12 as ordinate. GC12 is the average of GC1 and GC2. If the correlation coefficient between two axes is close to 1, all points are close to the diagonal, indicating that mutation pressure, rather than natural selection, determines the CUB [45,46].
To analyze the effects of nucleotide composition and natural selection, an ENC plot was drawn with GC3s as abscissa and ENC as ordinate. The standard curve represents the expected value of ENC, which was calculated as following formula: ENCexp = 2 + GC3s + 29/(GC3s2 + (1 − GC3s)2) [47]. If the points fall on or close to the curve, GC3s is the only determinant of CUB. If the points fall below the curve, natural selection is the determining factor [30,48].
To identify the effect of gene expression level or protein length on CUB, a scatter plot was drawn with CAI or protein length as abscissa and ENC as ordinate. The relationship between purine (A and G) and pyrimidine (T and C) in codon composition could also be indicated by the indicator of translation option (P2), which can be used to measure the efficiency of codon–anticodon interactions and to evaluate the translation efficiency. The value of P2 can be calculated according to the following equation: P2 = W W C + S S U W W Y + S S Y ., where W = A or U, S = C or G, Y = C or U. If the value of P2 is greater than 0.5, it indicates that the bias of codon use is affected by translation selection [49,50].

2.6. Identification of Optimal Codons

When the gene expression level changes, the frequency of the same codon will also change. If the frequency of the same codon in the gene set at a high expression level is significantly higher than that at a low expression level, the codon will be identified as the optimal codon [28]. To determine optimal codons that contribute to the major trend changes of codon usage, we selected two datasets of genes (5%) taken from each extreme of the principle trend, namely Axis 1, using the ENC index. Then, we compared the codon usage in these two bias sets and tested for significant differences. Here, optimal codons in each species were calculated by CodonW software through a chi-square test with default parameters.

2.7. RSCU-Based Cluster Analysis

Together with the other nine species, cucumber was clustered according to their genomic RSCU values with horizontal clustering method by ggdendro package based on the R language. Each species was used as an object, and the relative values of RSCU were taken as variables.

2.8. Statistical Analysis and Graph Drawing

Microsoft Excel and R language programs were used to analyze the correlation based on Spearman’s rank correlation. The graphs shown in this paper were drawn with ggplot2 based on the R language program, except where noted.

3. Results

3.1. Analysis of Codon Usage Patterns

3.1.1. Analysis of Codon Usage Indicators

GC content is one of the essential indicators reflecting genome characteristics. In cucumber, the GC content of individual genes ranged from 28% to 67.3%, with an average value of 44.2% and 81.13% genes ranged at 40–50% with a unimodal distribution pattern which was consisted with studies in the dicot plant genome. In ten species of Cucurbitaceae, the average GC contents were from 44% (in C. melo) to 46.2% (in C. pepo), indicating that they were all slightly GC poor. Among them, three species of Cucurbita had values of more than 46% with similar distribution, and snake gourd and chayote were only slightly higher than 45%. The other four species had values of around 44% and a similar GC content distribution with cucumber (Figure 1).
In cucumber, the GC contents in three codons’ positions (GC1, GC2, and GC3) were 50%, 40.8%, and 41.5%, respectively. The second position had the lowest GC content, and the first position had the highest. The other nine species had the same characteristics, with GC1 around 50% and GC2 around 40%. In all codon positions, two species in Cucumis had the lowest GC contents, and three species in Cucurbita had the highest ones.
The effective number of codons (ENC) value represents the capacity for codons to encode amino acids, ranging from 20 (which means only one codon is used for each amino acid) to 61 (which means each codon is used equally). A value below 35 represents the high bias of codon usage and above 50 represents the weak bias. In cucumber, the ENC values ranged from 26 to 61, with an average value of 52.4. According to the statistics, only 22 genes (0.11%) had ENC values less than 35 with higher bias, while 75.54% of genes had values more than 50 with weaker bias. Together with cucumber, melon also had about 74.98% genes with a weaker bias, which was the lowest proportion among these ten species.
Compared with two Cucumis species, three Cucurbita species had the most significant proportion of genes with a weaker bias, reaching more than 85%. The other five species had this proportion from 76% to 80%. In each species, the proportion of genes with an ENC value less than 35 was tiny, about no more than 0.3%, and the average value of ENC was around 53. These results indicate that the species in Cucurbitaceae all had a weak bias in codon usage; the Cucurbita genus had relatively lower biases, and the Cucumis genus had relatively higher ones.

3.1.2. RSCU Analysis

To further investigate features of codon usage patterns and intuitively display the preference of different codon positions for each type of base, we drew a heat map to show the variation characteristics of relative synonymous codon usage (RSCU) values for each species (Figure 2). In cucumber, 26 codons called preference codons had values of RSCU more than one, most of which ended with U, and none ended with C. Only one codon had an RSCU value of more than 1.8, namely AGA. In the other nine species, there was a similar distribution of RSCU on the different endings of codons. Only the number of preferred codons ending in A or G varies slightly among species. These results suggest that cucumber and the other nine species of Cucurbitaceae have similar preferences for codons ending in U.

3.2. Analysis of Factors for CUB

To determine which factors affect codon usage bias (CUB) in cucumber and its relative species, correspondence analysis (COA) was conducted by codonW, and a multivariate statistical method was used to calculate correlations between different indicators.

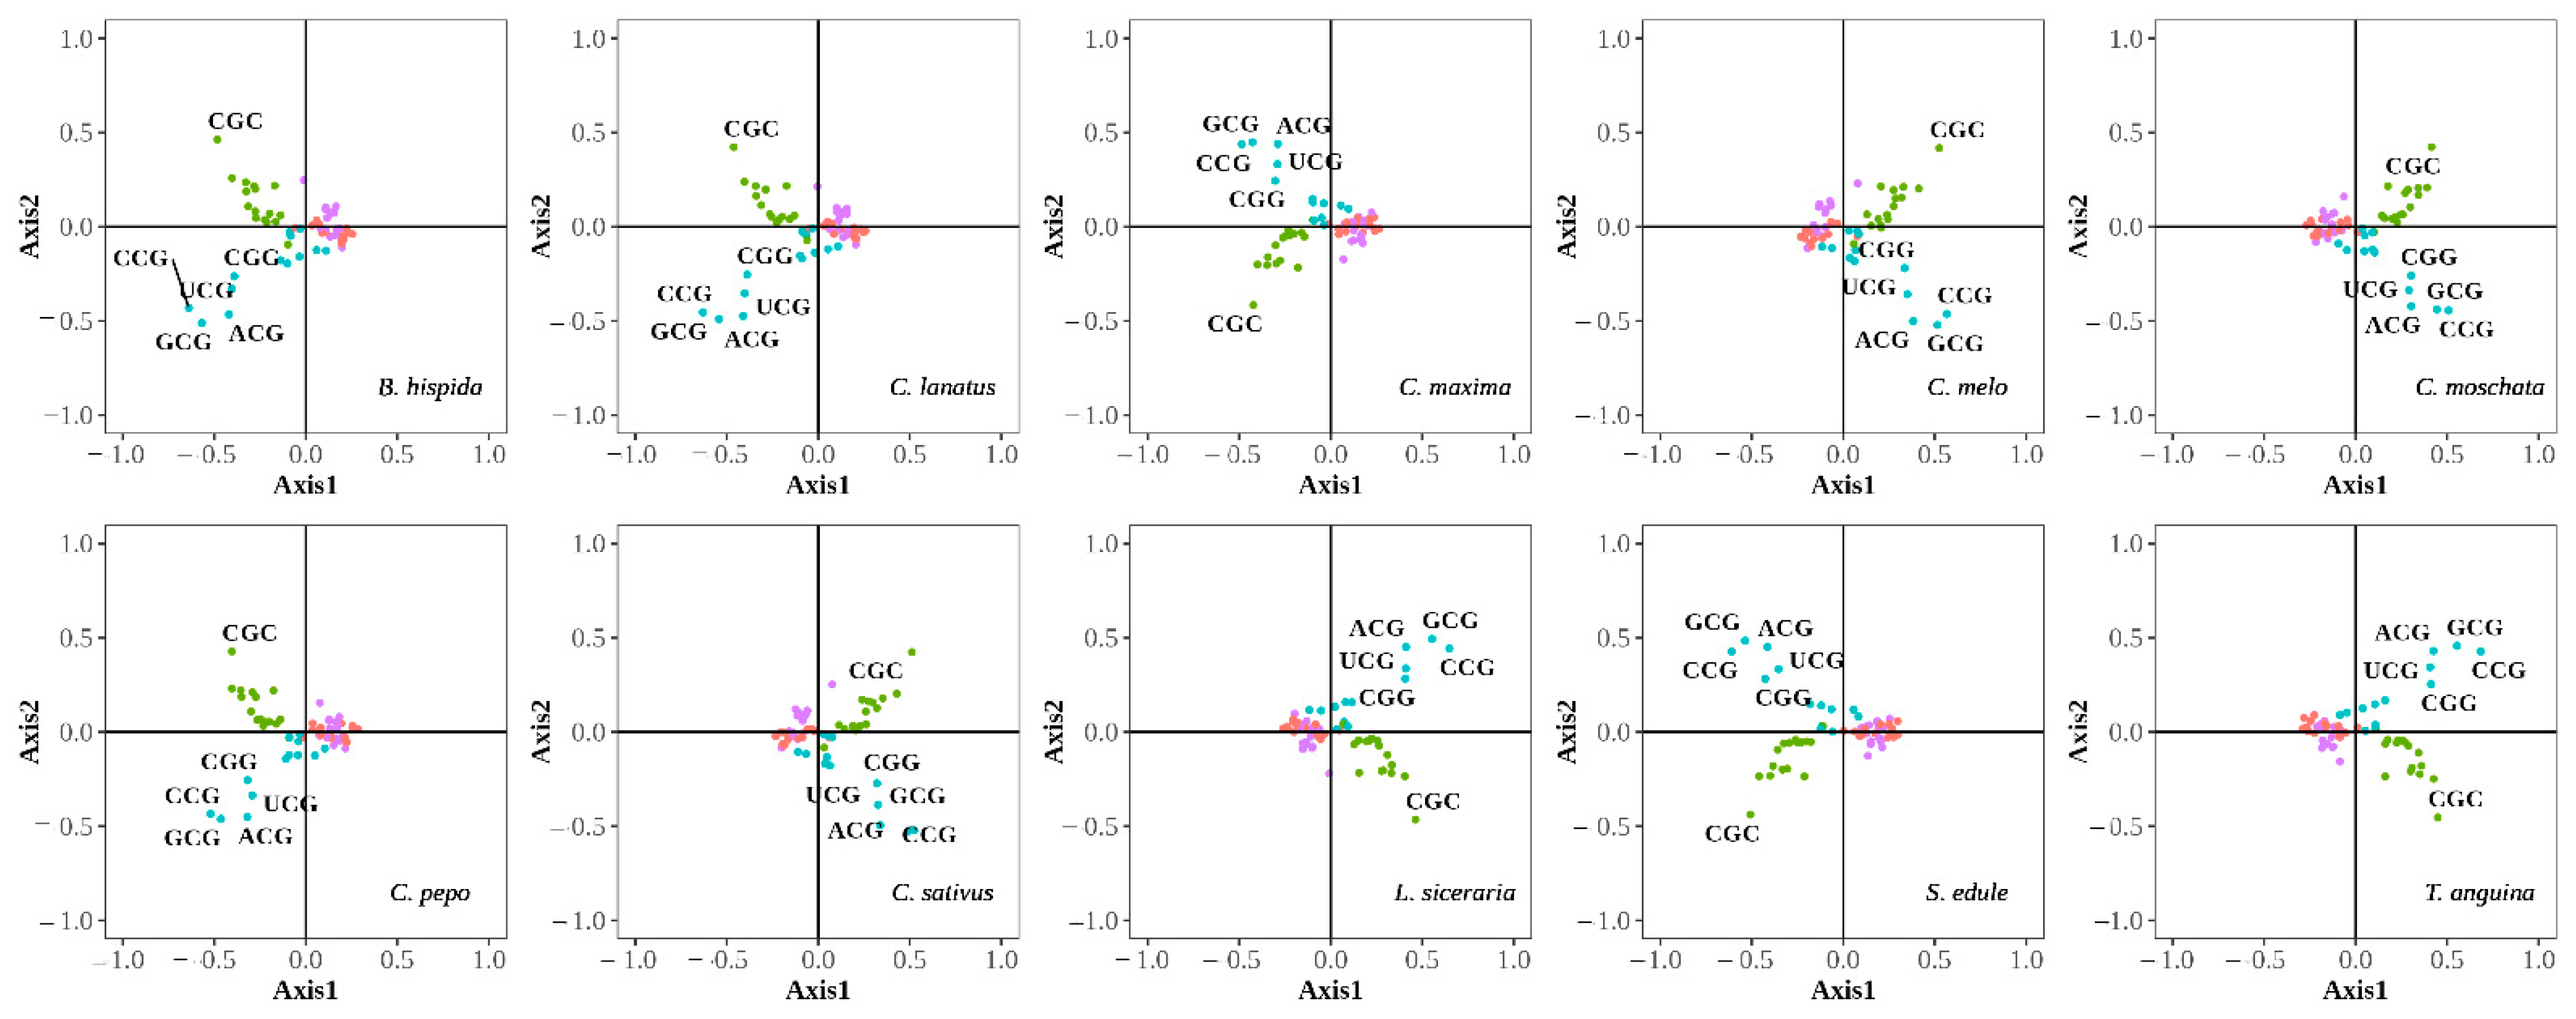
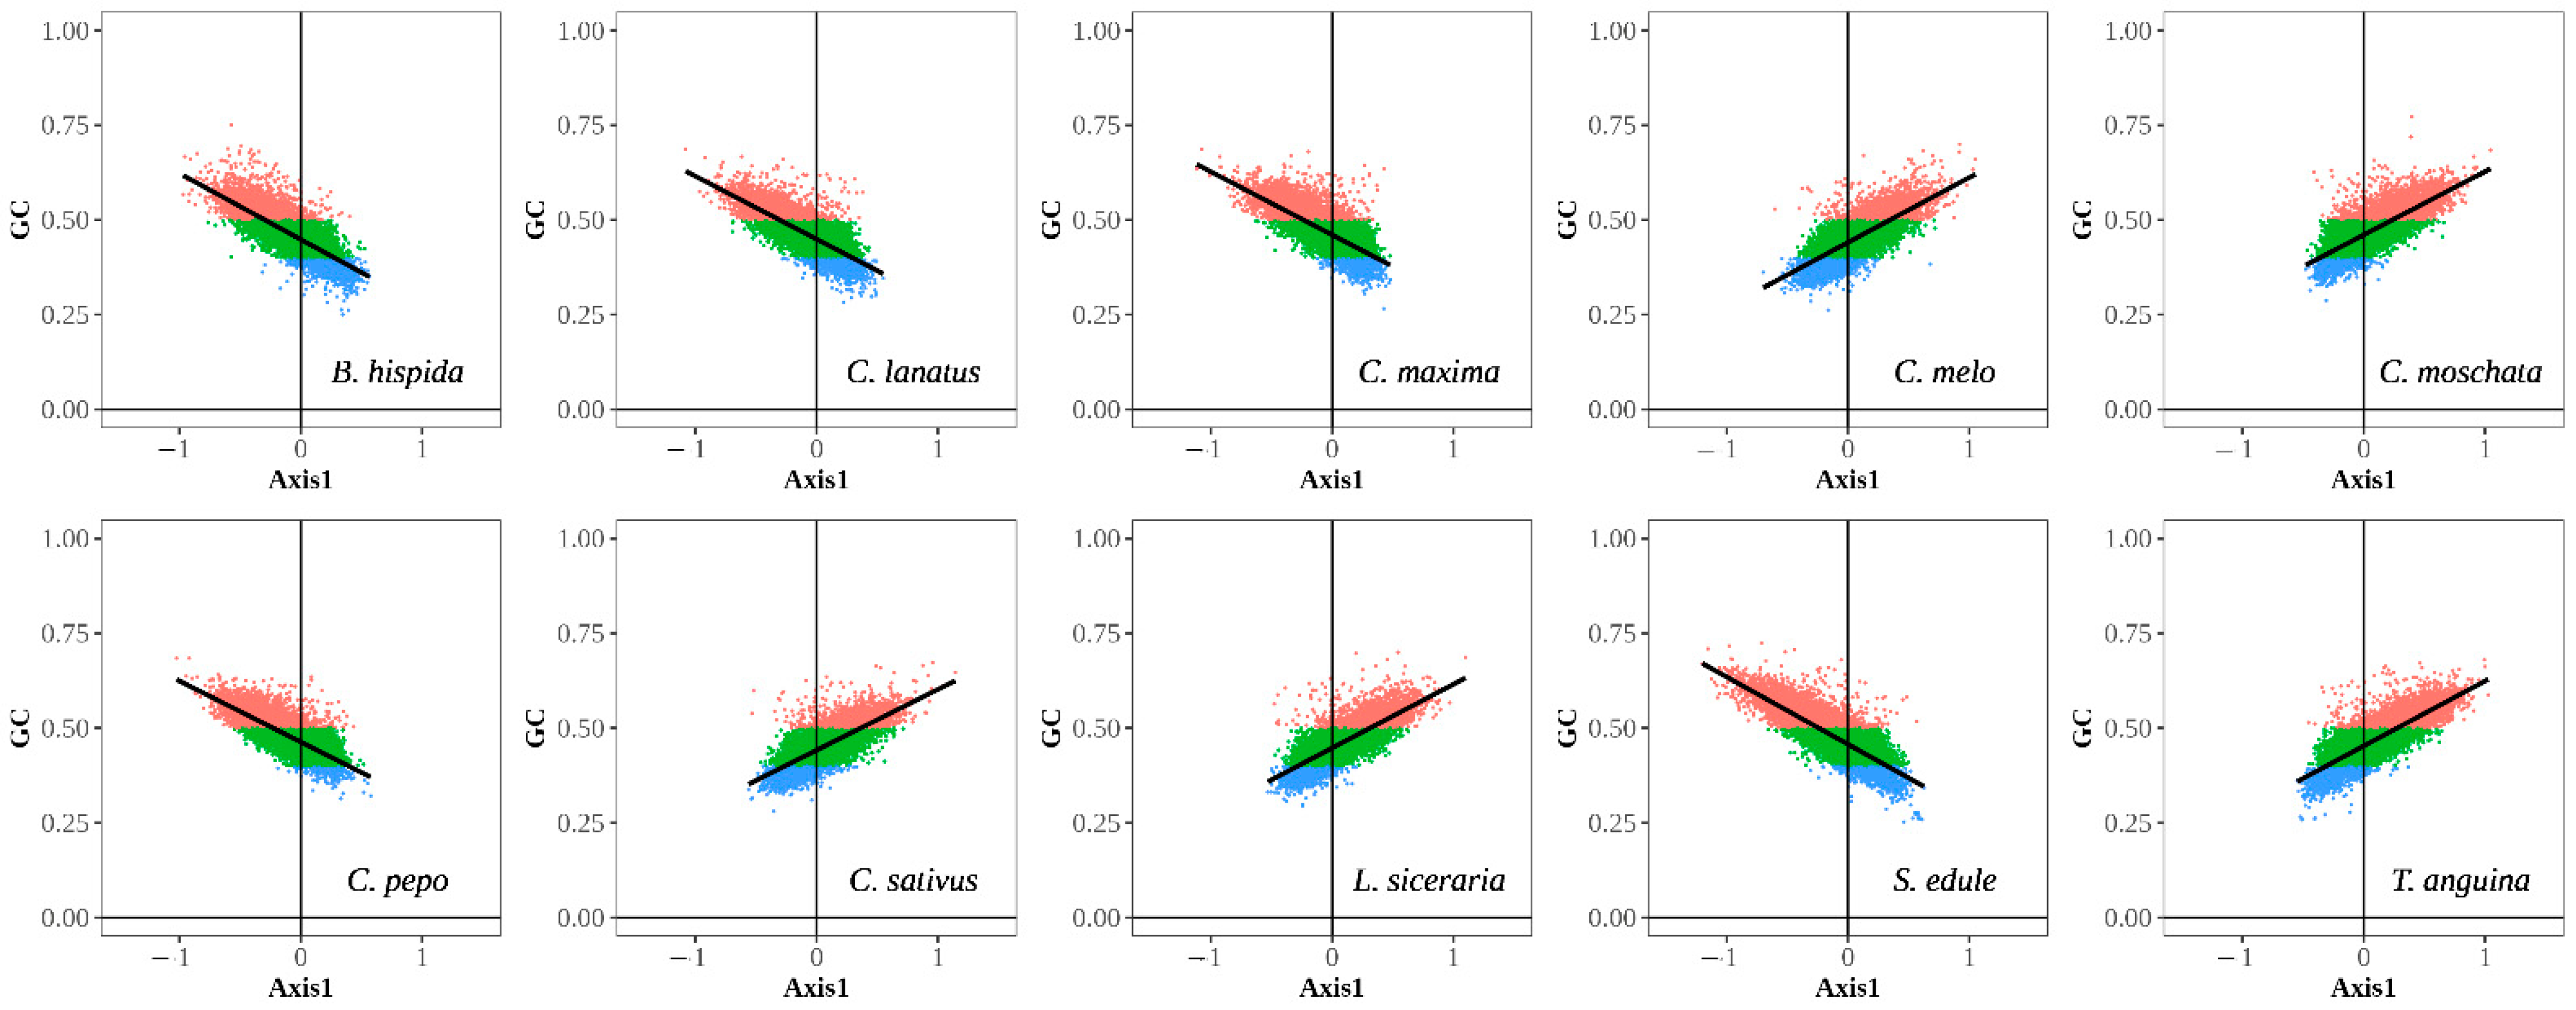
3.2.1. Correspondence Analysis

By COA analysis, all genes of each species were distributed in the space of 59 hyperdimensional axes, which could illustrate codon usage changes in different genes. The first axis explains the maximum changes in codon usage, and the interpretation rate of the other 58 axes decreases in turn. In cucumber, the first two axes contribute 18.66%. The coordinate of each gene or codon on the two principal axes (Axes 1 and 2) is shown in Figure 3 and Figure 4. The results showed that three types of genes with different GC contents can be distinguished by the first axis, and there are strong correlations between GC contents and the first axis in each species (Figure 3 and Figure A1). Moreover, AU-ending or GC-ending codons could be separated by the first axis. Figure 4 shows the almost complete separation of G-ending codons and C-ending codons along the second axis. The exception here is the AGC that encodes serines and GAC that encodes aspartic. It is worth noting that AGC and G-ending codons are in the same quadrant, which exists in all ten species studied here, while AGC and GAC are in the same quadrant with G-ending codons, which only exists in melon. These results suggest that as the first axis was the major contributor to codon usage changes in each species, nucleotide composition, especially in the third position of codons were closely related to the codon bias in cucumber and relative species.

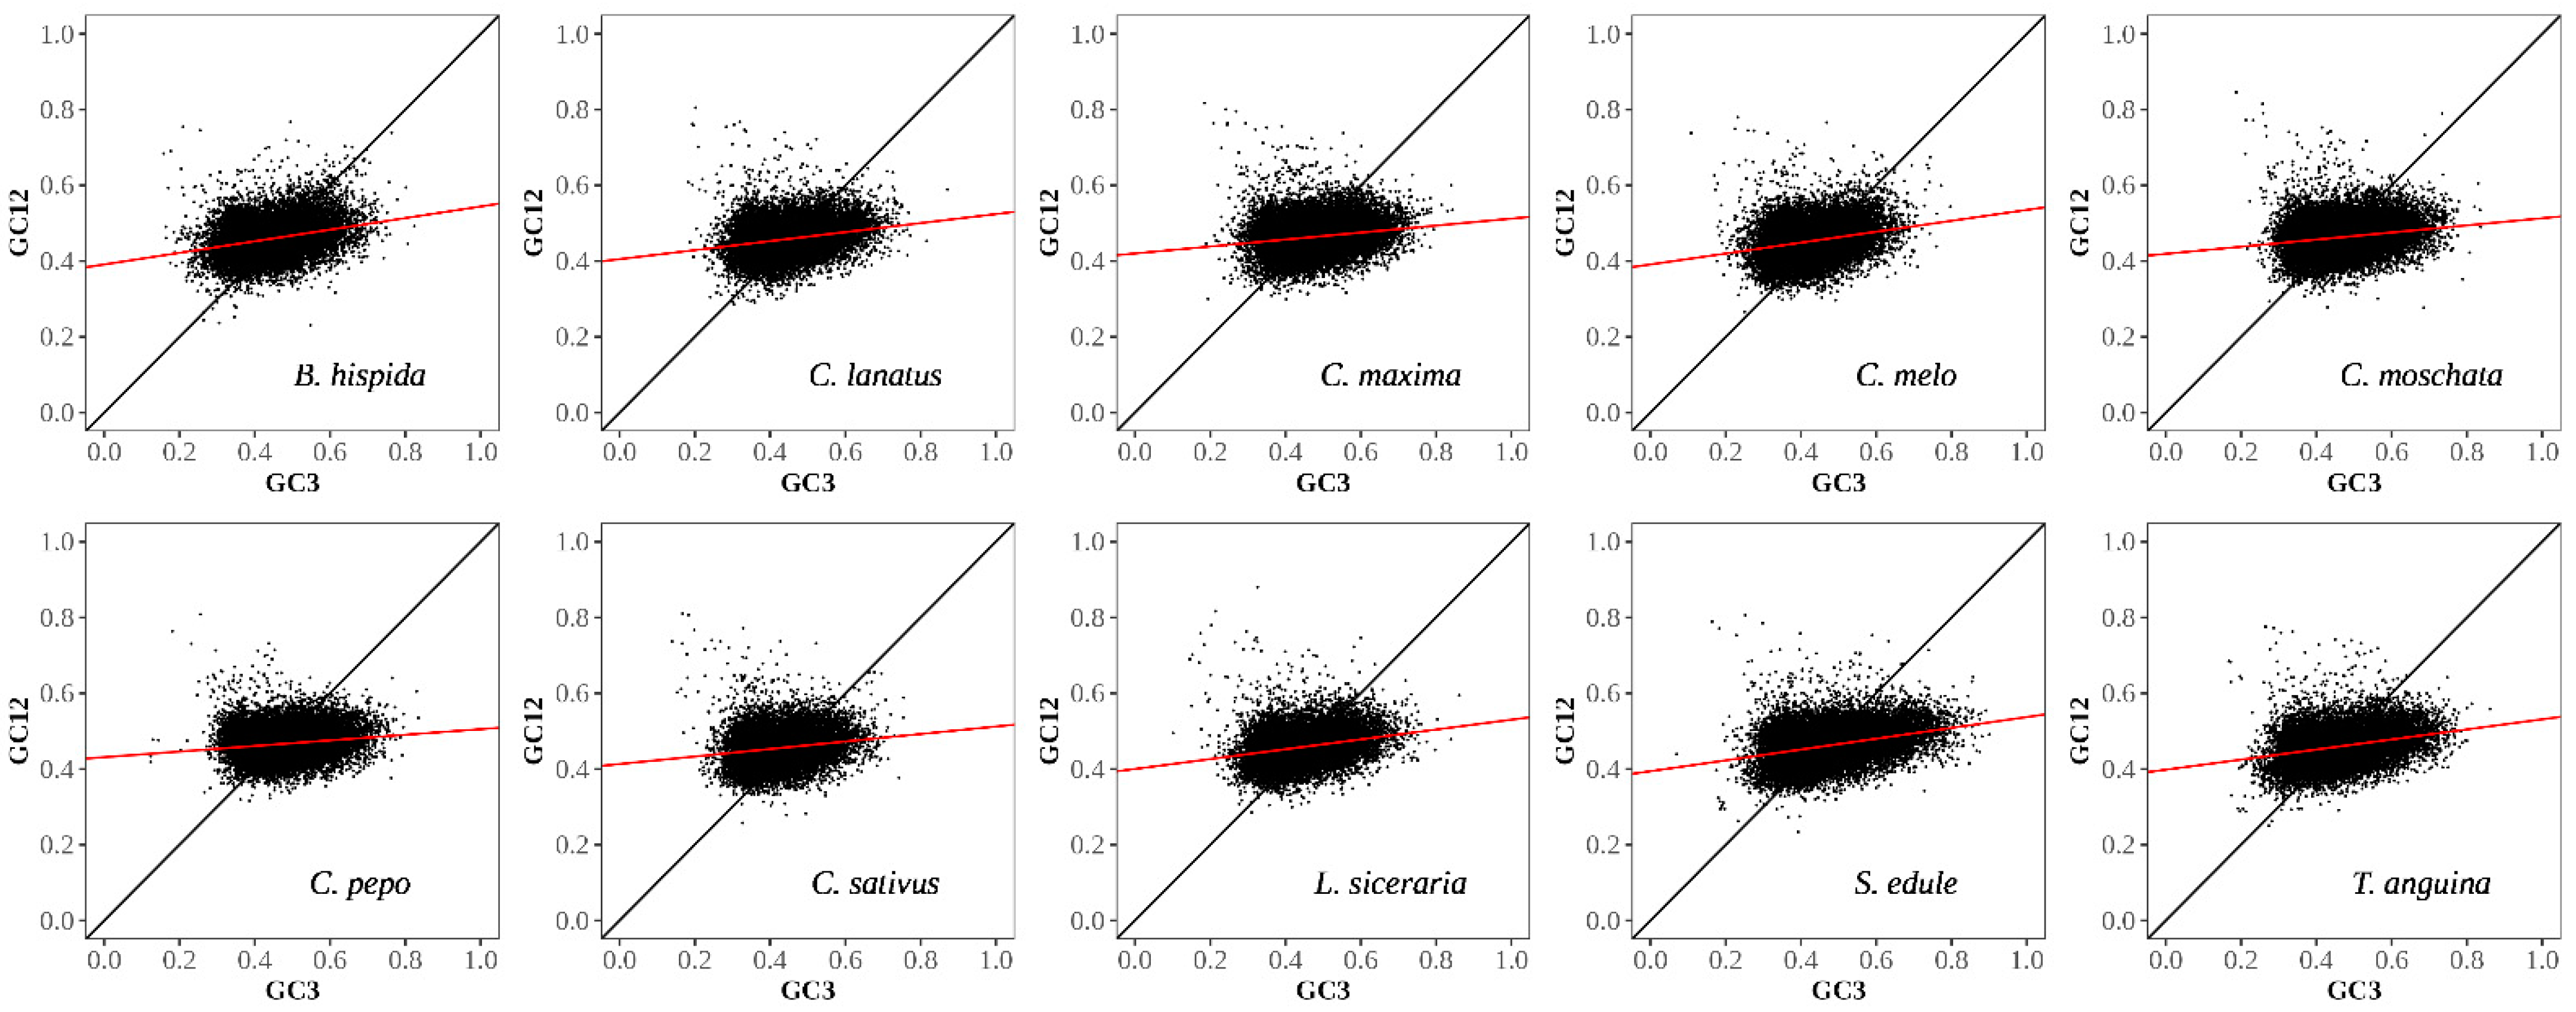
3.2.2. Neutral Plot Analysis

To explore the effect of mutation pressure on codon usage bias, the GC contents of each position of codons were calculated for each gene, and the distribution of all the genes on the scatter plot of GC3 and GC12 was observed (Figure 5). In cucumber, there was a significantly positive correlation between GC3 and GC12 (r = 0.173, p < 0.01), and the slope of the regression line was 0.099, illustrating the effect of mutation pressure on codon usage bias was about 9.9%. In the other nine species, there were also significant positive correlations between GC3 and GC12. The correlation coefficients ranged from 0.167 to 0.336, and the slope was ranged from 0.074 to 0.153. Thus, mutation pressure played a weak role in the codon usage bias of cucumber and relative species, and Cucurbita was less affected by mutation pressures than cucumbers.

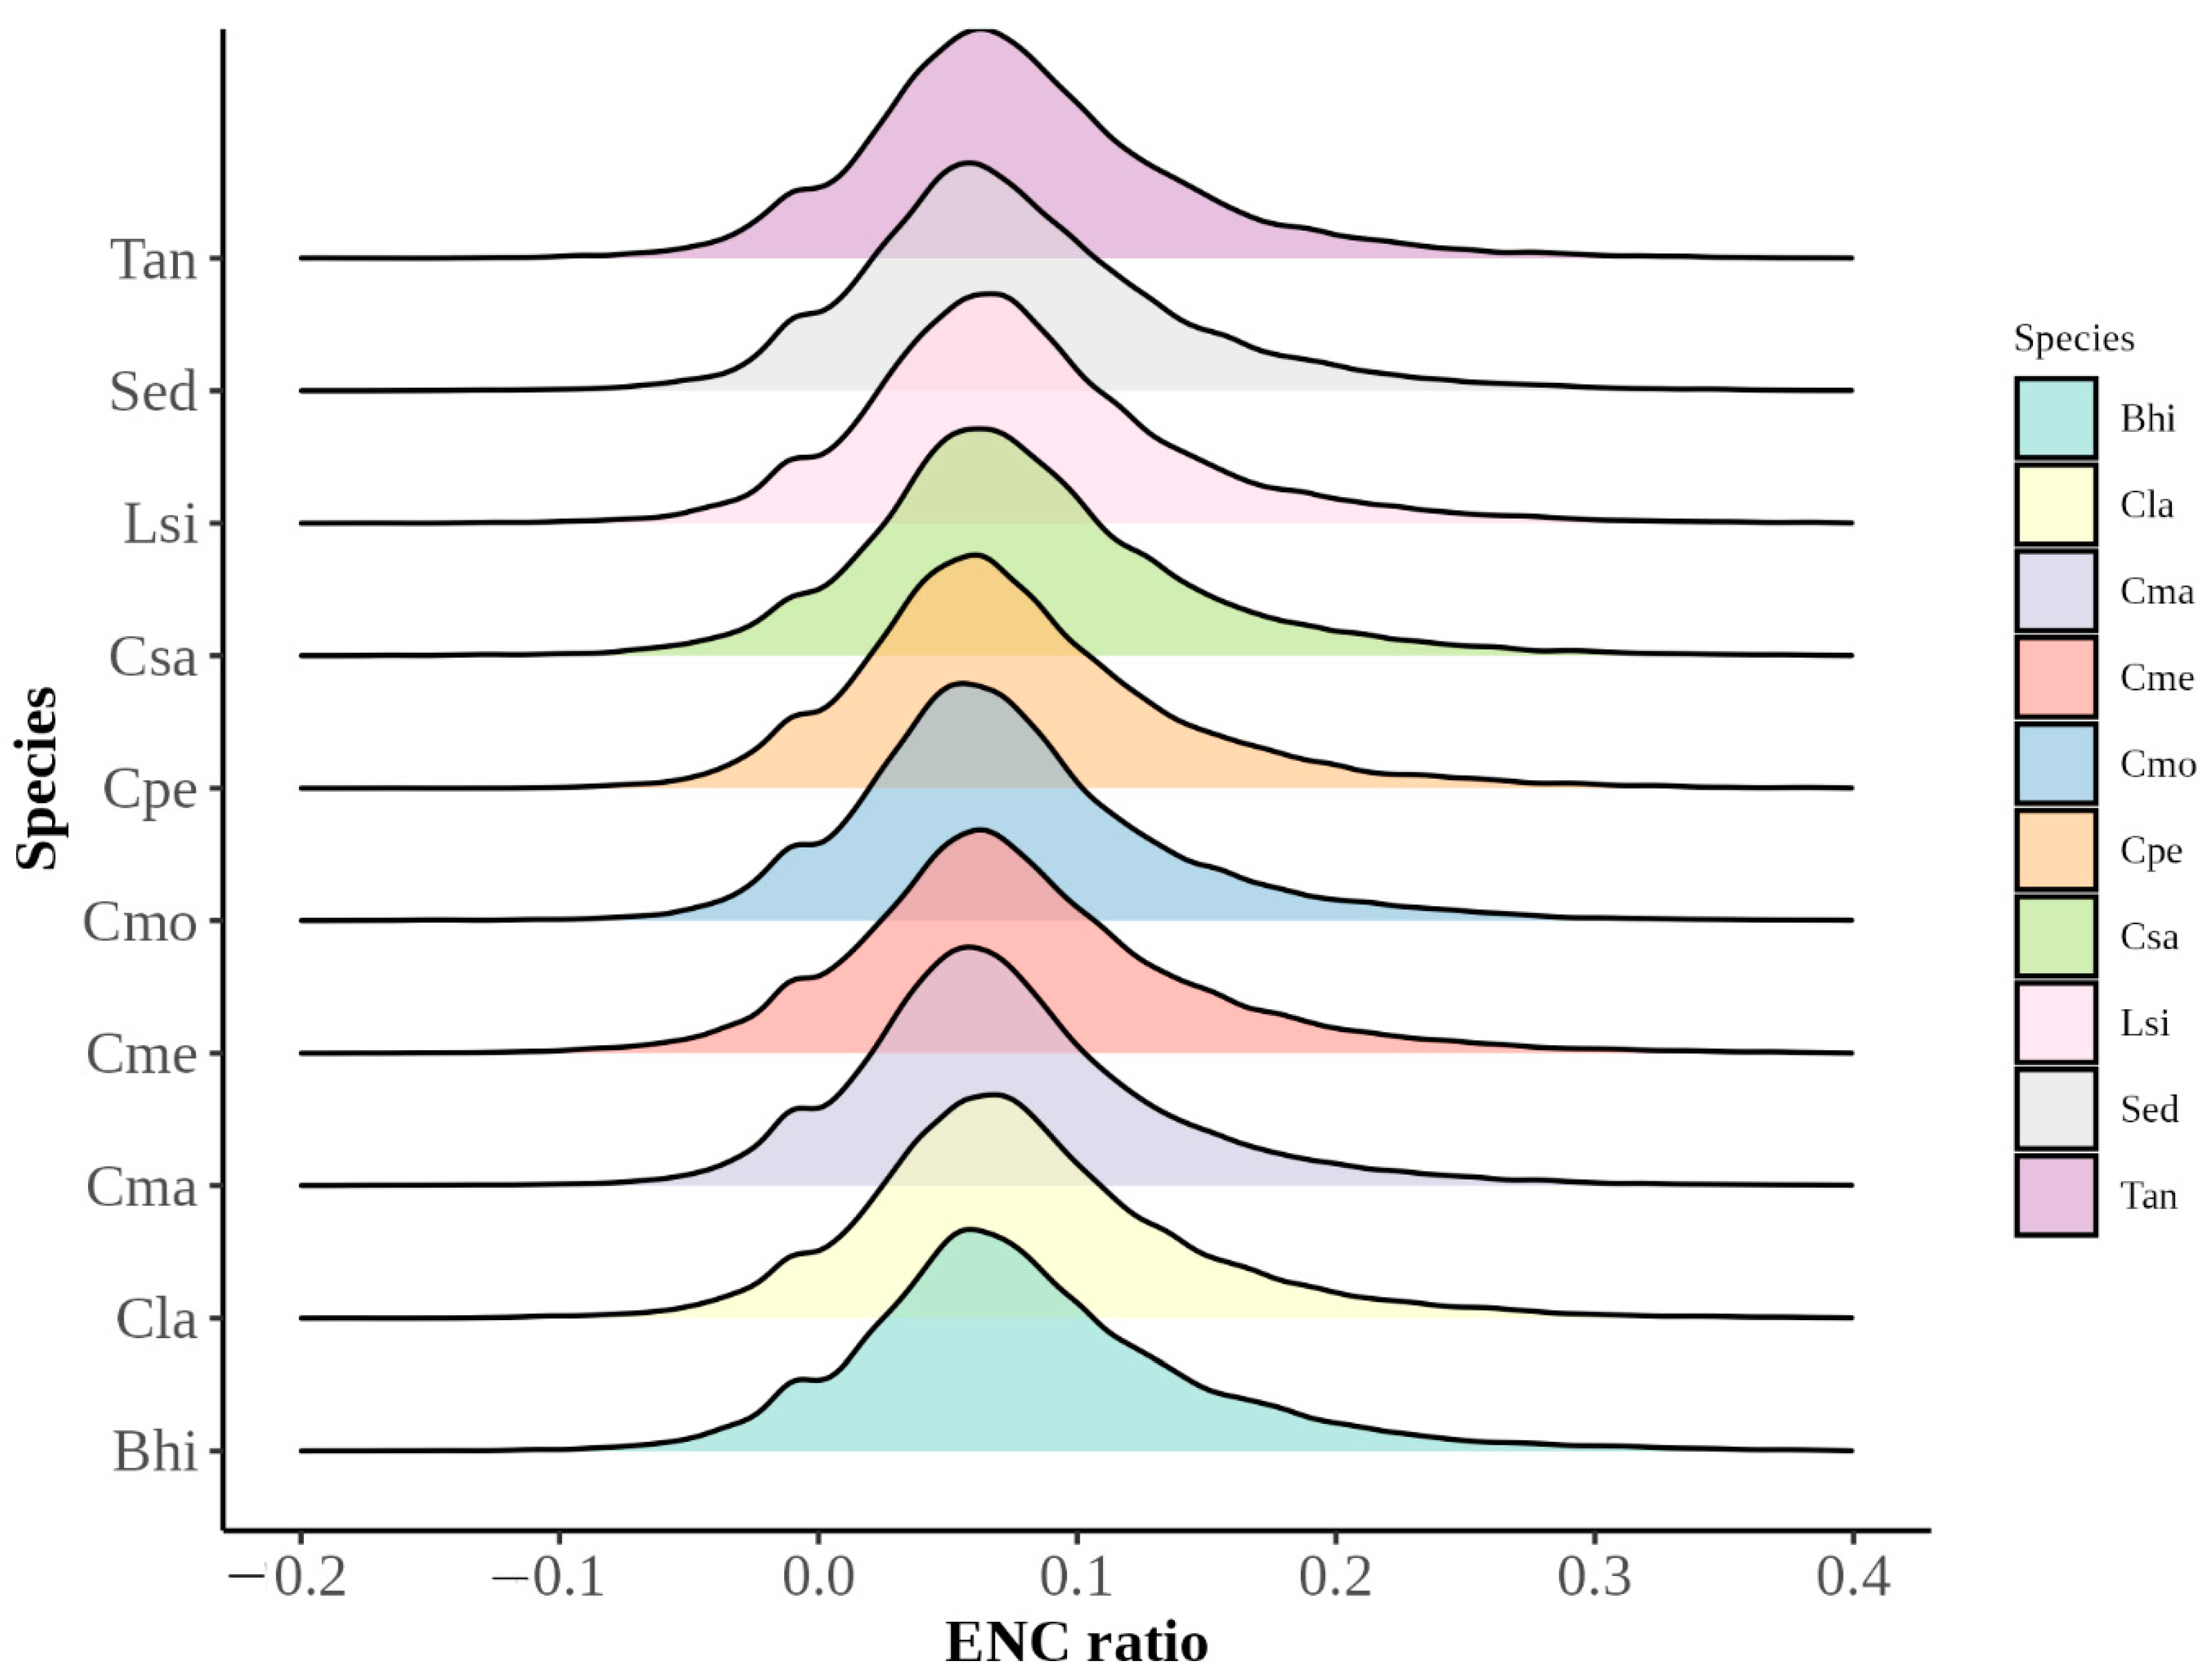
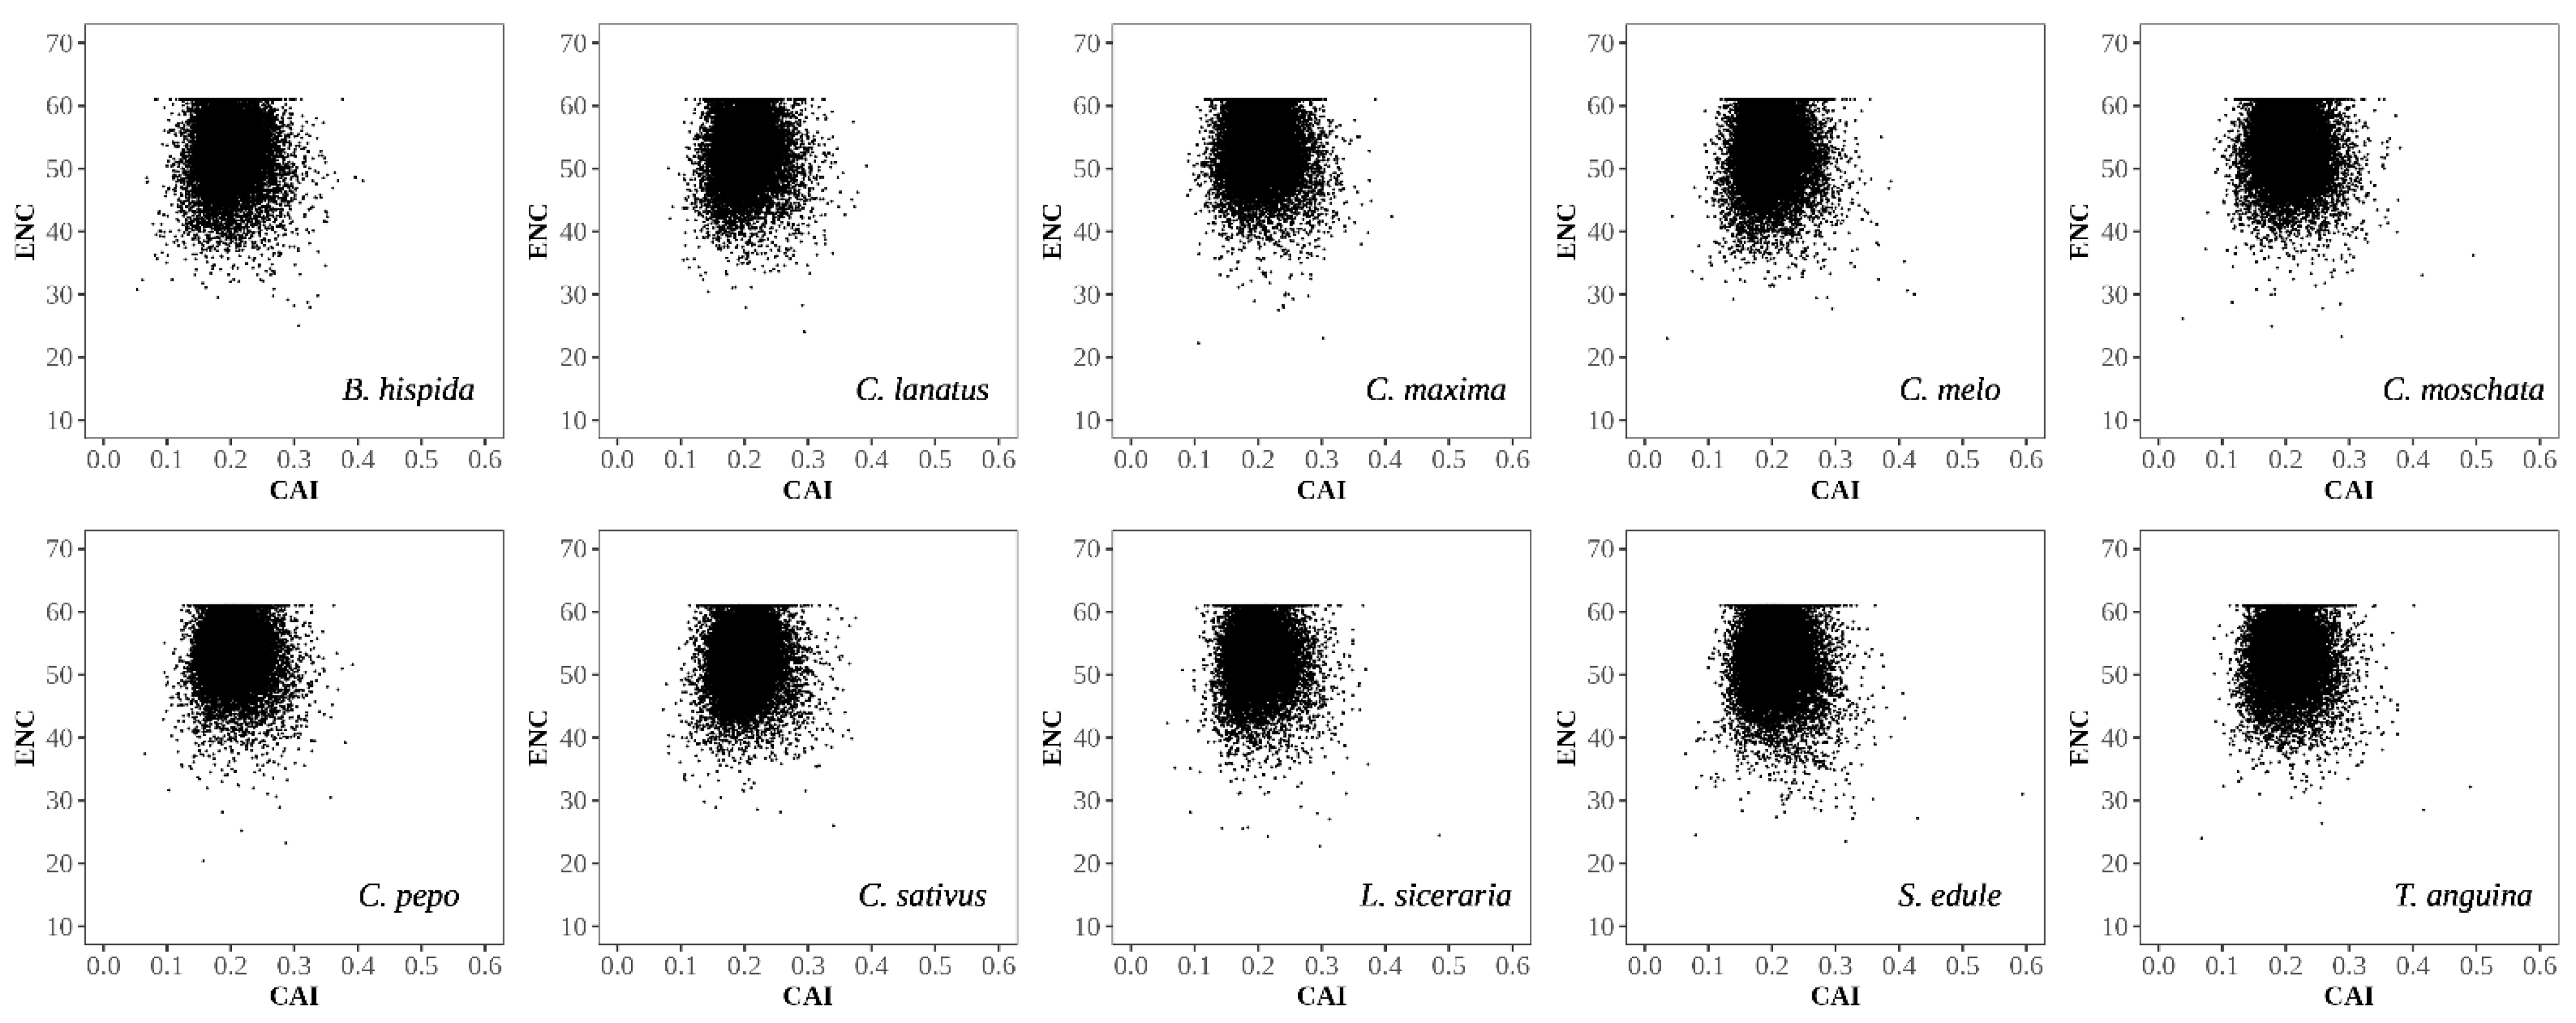
3.2.3. ENC Plot Analysis

The ENC plot is an effective method to illustrate the codon usage patterns, especially to detect the influence of GC3s on CUB. Here, it was conducted on genomes of cucumber and its close species (Figure 6). The results showed that there were similar patterns in the ENC plot. The distribution trends of genes were close to the expected curve. Among these species, most of the genes were under the standard curve, which means it can be inferred that natural selection might play a role in codon usage bias in cucumber and its close species.
To explore a more accurate relationship between observed and expected ENC values, the ENC ratio and its distribution were calculated and plotted (Figure 7). About 80% of the genes had ENC ratios ranging from 0 to 0.15 in each species, indicating that most of the genes had ENC values very close to expected ones based on the GC3s.

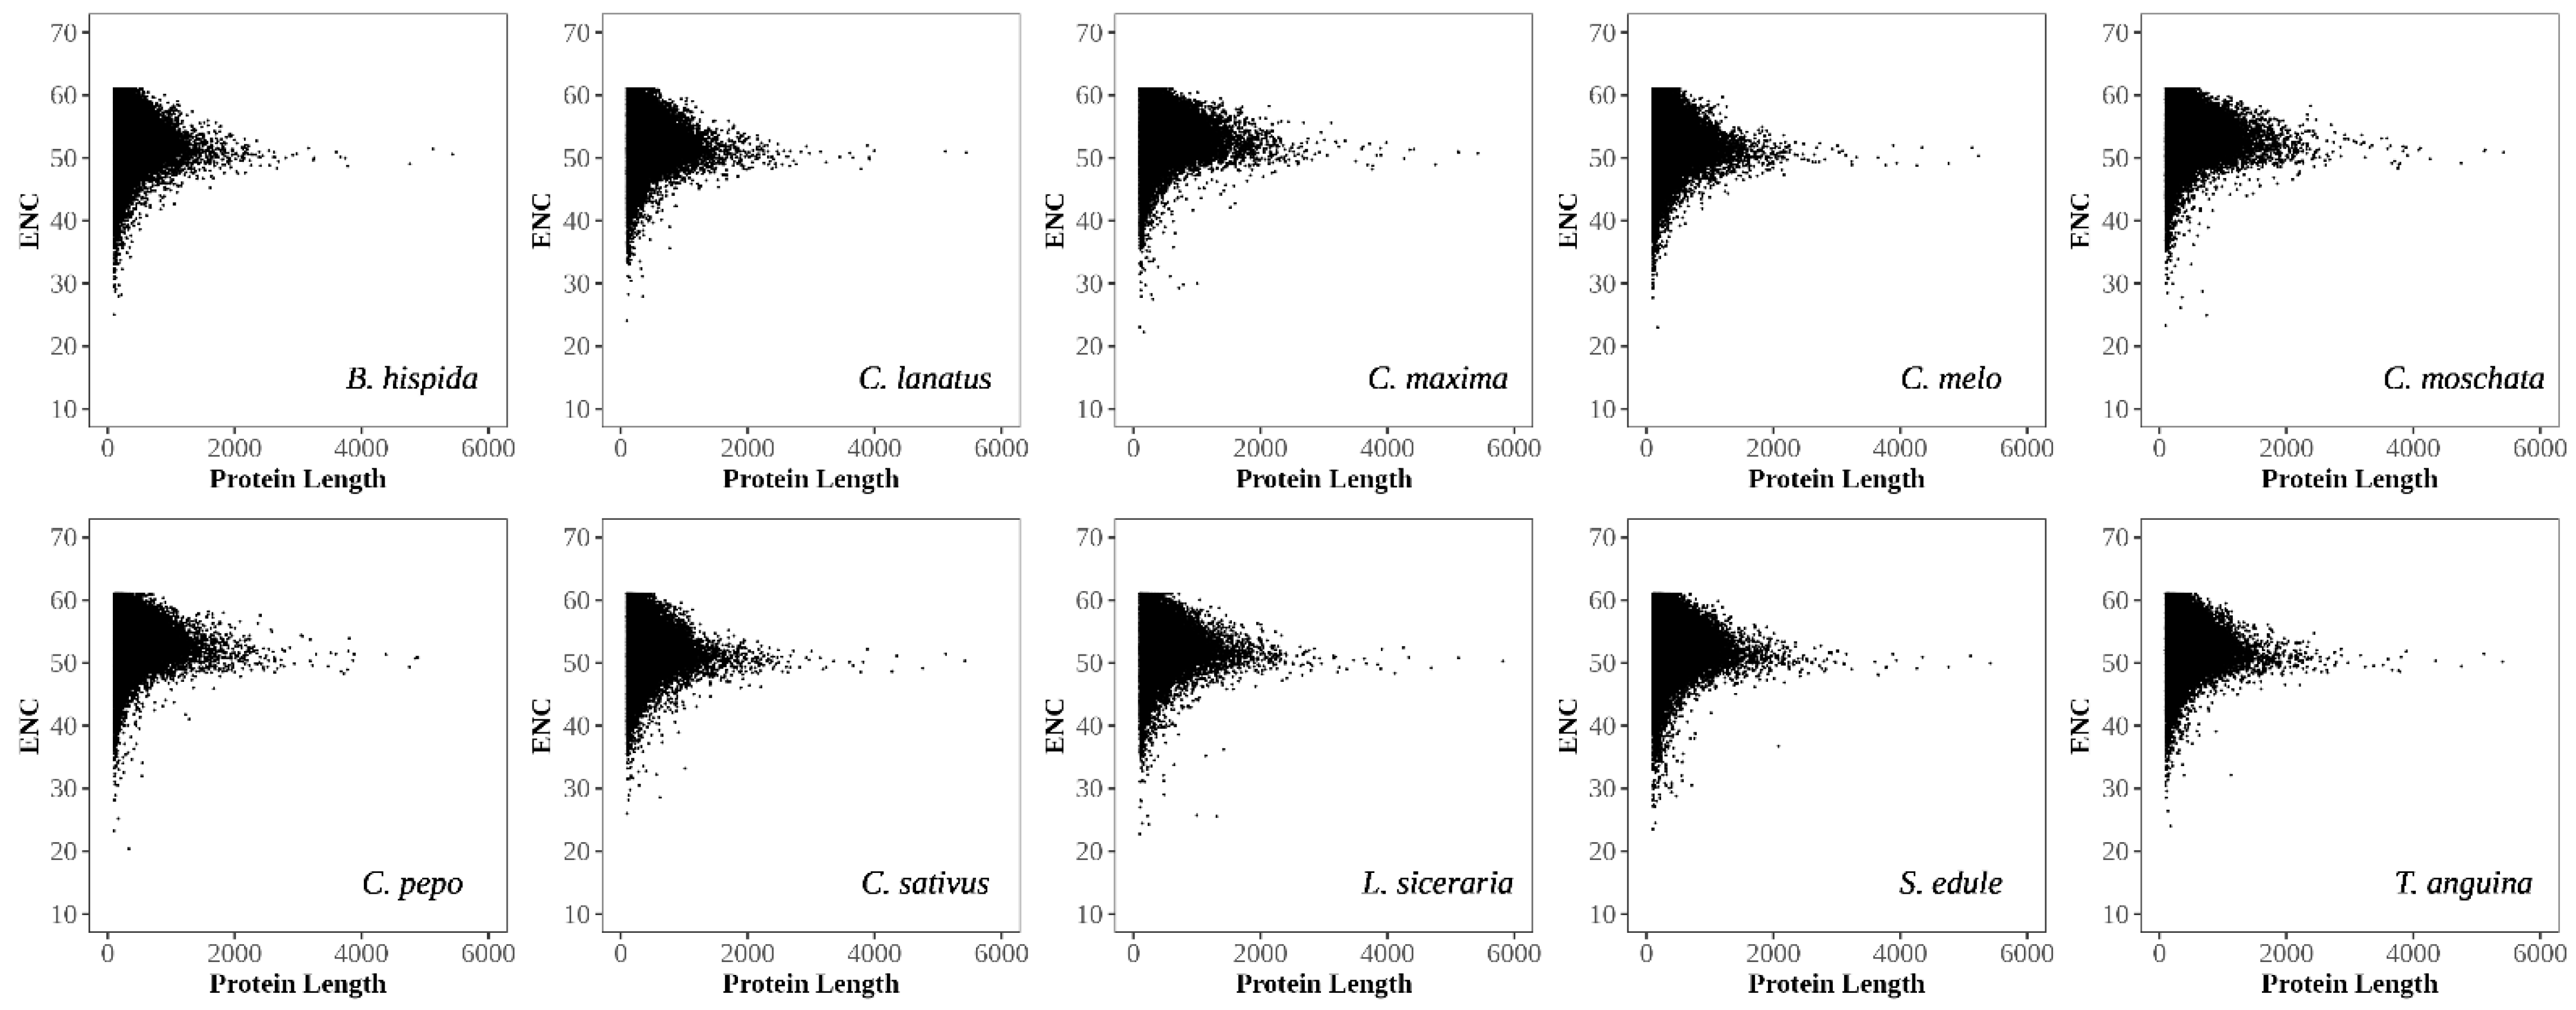
3.2.4. Analysis of Gene Expression Level, Protein Length, and Translational Selection

Codon adaption index (CAI) has been used to estimate the expressivity of genes. The correlation between CAI and ENC was calculated and plotted to evaluate the effect of gene expression on codon usage bias in cucumber and its relatives (Figure 8). The results show that the absolute value of the correlation coefficient was less than 0.05 in each species, although the correlation was significant except for in snake gourd. It can be inferred from these results that the gene expression level might have little effect on codon usage bias in species of Cucurbitaceae.
To evaluate the effect of protein length on codon usage bias in cucumber and its relatives, the correlation between protein length and ENC was calculated and plotted (Figure 9). In cucumber, there was a significantly negative correlation between ENC and protein length (r = −0.042, p < 0.01). In melon, the correlation was similar (r = −0.014, p < 0.01). In chayote and wax gourd, there were significant positive correlations between them, while in other species of Cucurbitaceae, there was no significant correlation. It can be inferred from these results that the protein length might have little effect on codon usage bias in cucumber, melon, chayote, and wax gourd, while in other relative species, there were no such effects.
Based on the RSCU values, the P2 indicators were calculated to investigate the effect of translational selection on codon usage bias (Table 2). Compared with other species, the values of SSU and WWU were higher, and the values of SSC and WWC were lower in cucumber and melon, indicating more preference for U in the third position of codons of them. In cucumber, the P2 was 0.5201, and in the other nine species, the values were all greater than 0.5, ranging from 0.5047 to 0.5216, suggesting that the translational selection might play a role in codon usage bias in each species.

3.2.5. Correlation Analysis

To reflect the relationship between different indicators of codon usage, especially between them and the two main axes, the correlation between them was calculated (Table S1). In cucumber, the first axis significantly correlated with GC3s, ENC, codon adaptation index (CAI), and protein length (r = 0.893, 0.357, 0.302, and −0.282, respectively, p < 0.01), indicating that nucleotide composition had a more important influence on CUB. So, the correlation between GC3s and others was further explored. There were also significant correlations existing in GC3s and ENC (r = 0.350, p < 0.01), GC3s and CAI (r = 0.230, p < 0.01), GC3s and protein length (r = −0.279, p < 0.01). Such correlations between indicators were like those in other species except for chayote. In the chayote, there were no significant correlations between the first axis and ENC (p > 0.05) and none between the GC3s and ENC (p > 0.05). Other significant correlations detected in cucumber also existed in chayote. These results inferred that the nucleotide composition had an important effect on the formation of codon usage bias in cucumber and relative species.

3.3. Application of CUB

Based on the analysis of codon usage patterns of cucumber and its close species, the optimal codons were further identified, helping to improve the efficiency of genetic transformation and analyzing the relationship between these ten species in Cucurbitaceae based on their respective RSCU values at the genomic level.

3.3.1. Identification of Optimal Codons

To identify optimal codons, we firstly chose two datasets comparing 5% of the total genes using the ENC index from the extreme right and left based on the principal trend, namely axis 1 (which represented major trend changes of codon usage). Then, we used the two-way chi-square test to identify codons with significant differences in two biased sets. The results show that there were 30 optimal codons for 18 amino acids identified in cucumber, including 16, 12, and 2 U, A, and G-ending codons (Table 3). Leucine has the largest number of optimal codons, i.e., four. The same results were identified in melon, wax gourd, bottle gourd, and watermelon. In three species of Cucurbita and snake gourd, there was one more optimal codon in each species, namely CGU for arginine, while in chayote, there were two more optimal codons, namely CGU and CGA for arginine. These results may provide helpful information for the genetic transformation of the gourd crop in the future.

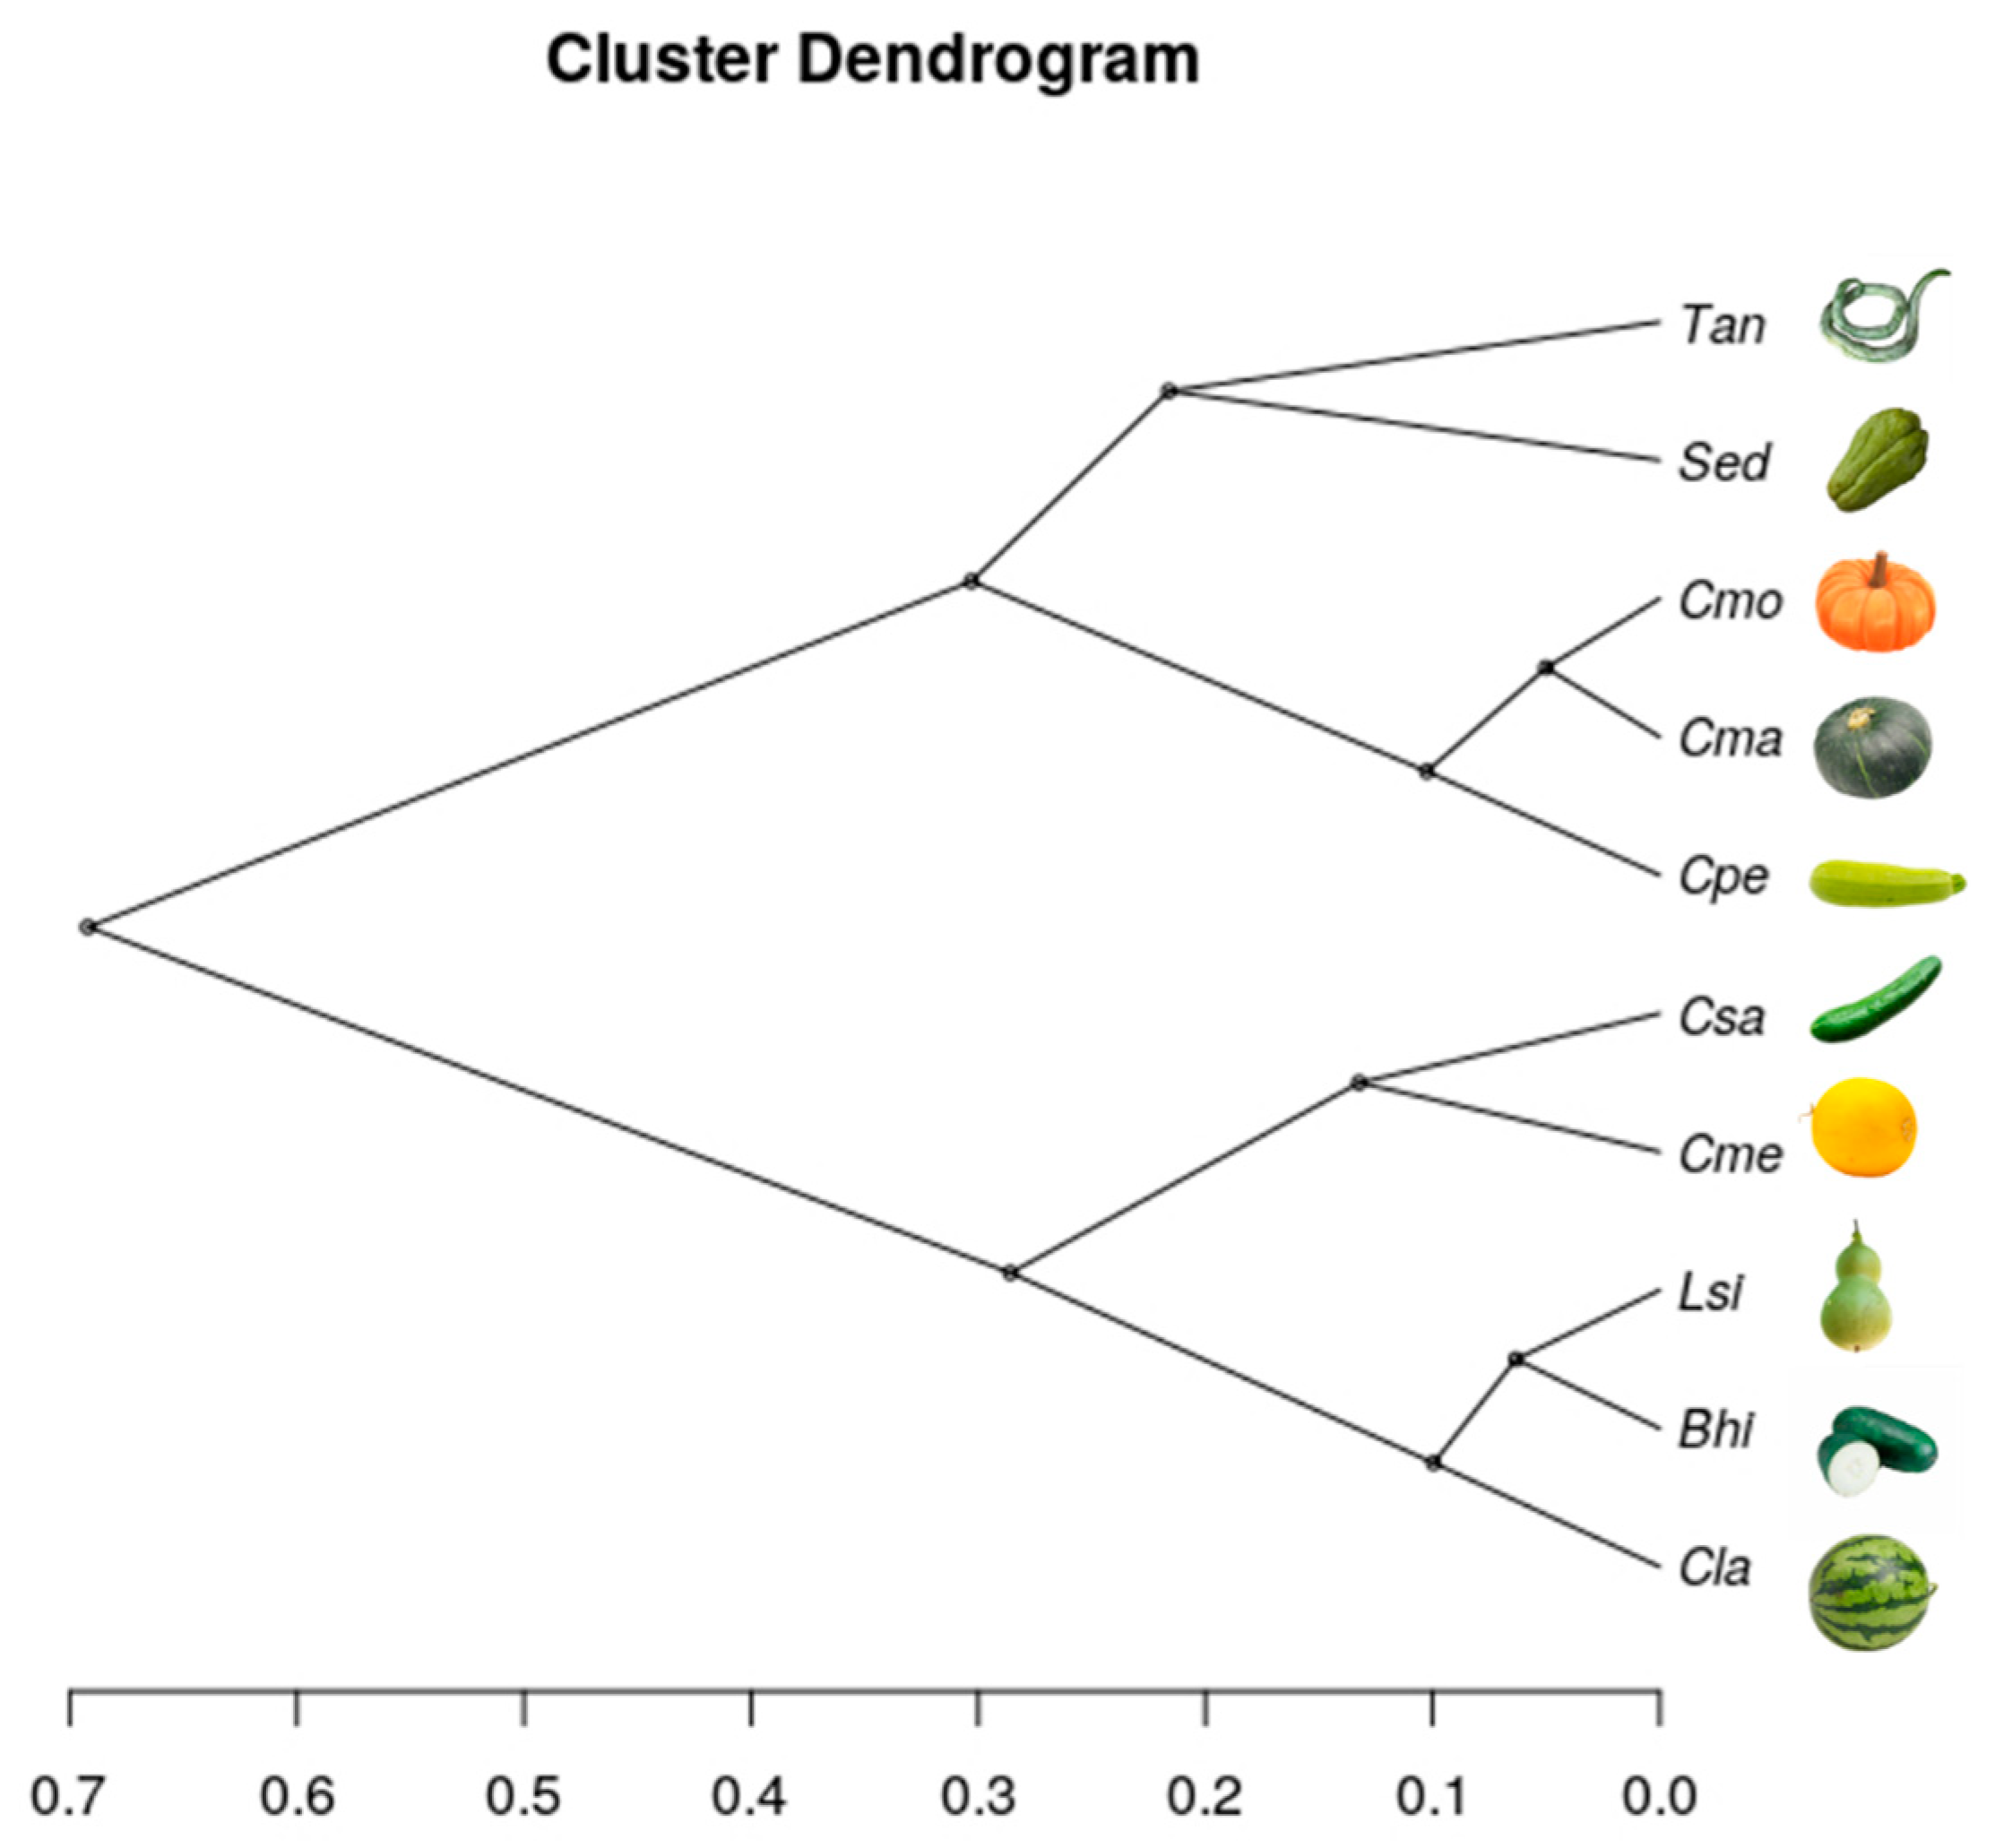
3.3.2. RSCU-Based Cluster Analysis

To reflect the relationship between cucumber and other plants in the same family, ten Cucurbitaceae species were clustered according to the RSCU values representing their respective CUB (Figure 10). The results show that ten species were clustered into four categories. Among them, cucumber, and melon of Cucumis, three species of Cucurbita were well classified into each category, respectively. Watermelon, wax gourd, and bottle gourd were clustered together, closing to Cucumis. Snake gourd and chayote were grouped, which are more closely related to Cucurbita. From the recent genome study of chayote, the evolutionary tree of Cucurbitaceae constructed by protein sequences showed that cucumber and melon had the closest evolutionary relationship, and snake gourd and chayote had the most intimate evolutionary relationship, which was consistent with our study. At the same time, there is still some difference in these two cluster methods about the classification location of Cucurbita [22,23]. These results indicated that species clustering based on RSCU values could provide a reference for their evolution and classification relationship.

4. Discussion

Codon usage bias (CUB), which plays a vital role in gene regulation and molecular evolution, widely exists in all kinds of organisms, both prokaryotes and eukaryotes [31,41]. However, the extent of preference for synonymous codons varies among species. At the genomic level, investigation on the characteristics of CUB and analysis of the evolutionary pressure that led to its formation are significant in studies of genome biology. In the present study, CUB and its source in cucumber were firstly genome-wide analyzed and compared within Cucurbitaceae.
The strength of CUB can usually be measured by the effective number of codons (ENC), showing the difference between the usage of synonymous codons with the same frequency and the statistical ones from codon usage data alone. When synonymous codons are equally used to coding the amino acid, meaning there is no CUB, the value of ENC is equal to sixty-one. In the case of extreme bias, namely, twenty amino acids being one-to-one relative to twenty codons, the value of ENC is equal to twenty [30,39]. In our study, the ENC values of about three-quarters of genes in cucumber and melon genomes were greater than 50, indicating that the CUB of most genes was relatively weak. While in the genome of Cucurbita, this proportion reached more than 85%, showing that the proportion of genes with weak bias was relatively larger. The results of comparative studies among species about the distribution of ENC values illustrated that the CUB of cucumber was relatively the strongest, although the CUB of Cucurbitaceae crops was generally weak.
A multivariate statistical method to carry out COA could be used to identify the sources of differences in synonymous codon use among genes. Studies on CUB in peony and lonicerae flos, in which the mutation is the most determinant factor, illustrated that the genes with different GC content could be separated along the first axis [51,52]. Similar features were observed in our study, and there is more evidence to support the importance of nucleotide composition. The absolute value of the correlation coefficient between the principal axis and GC3s was the highest. GC3s, representing nucleotide composition, also had extremely significant correlations with other indexes. The second axis also had significant correlation with these indexes. Although the absolute value of the correlation coefficient between the second axis and GC3 was only 0.14, the distinction between the second axis and the G or C nucleotide at the third position of the triplet codon could also be seen (Figure 4).
CUB feature and source analysis have essential applications in some respects. In producing antibodies and vaccines or transgenic crops, heterologous gene expression is usually implemented as biotechnology operations. Understanding host CUB characteristics would help improve the expression efficiency of foreign genes and further improve the yield of target products [53,54,55]. Therefore, the identification of the optimal codon and codon optimization of the foreign gene based on host CUB are of practical significance. In our study, 30 optimal codons for 18 amino acids were identified in the cucumber genome, which will contribute to creating transgenic cucumber with better characteristics.
The classification and evolutionary relationship of species were usually studied by traditional morphology, karyotype analysis, isozyme analysis, and molecular markers [53,54]. Clustering based on RSCU values, representing CUB characteristics for species, would also be used to explain the evolutionary relationship of species. Studies based on molecular and genomic sequences believe that a whole-genome duplication (WGD) event occurred in about 130–150 Mya of Cucurbitaceae after the divergence of monocotyledons and dicotyledons, and Cucurbita diverged from Cucumis occurred 27–25 Mya [22,23]. According to the evolutionary tree from the above research, Cucumis has closer relationships with watermelon and wax gourd than Cucurbita, consistent with our study based on CUB. Unlike our research, a study on CUB in four sequenced cotton species found that RSCU-based cluster analysis could not reflect the evolutionary relationship among cotton species [55]. For this contradiction, we speculate that RSCU-based cluster analysis is effective at the family and genus level, although it is not sensitive at the species level due to the high consistency of CUB.

5. Conclusions

In the present study, the genome-wide codon usage pattern and its shaping factors in C. sativus were analyzed and compared with nine species in Cucurbitaceae. The analysis of the distribution of GC content and ENC values throughout the genome showed that the genomic CUB of Cucurbitaceae plants studied were all weak, and cucumber was relatively high. These species have similar preferences on codons ending with U. The principal axis had significant correlations with GC3s, ENC, CAI, and protein length. Nucleotide composition might play a significant role in CUB, while mutation pressure, natural selection, together with effects of gene expression level, might play relatively weak roles in CUB. Using the analysis results of CUB, 30 optimal codons were identified in the cucumber genome, most of them ending with U or A. Meanwhile, a cluster tree was constructed based on the relative synonymous codon usage (RSCU) values of these ten species, showing that cucumber, together with melon, had closer relation with wax gourd, watermelon, and bottle gourd rather than Cucurbita. These findings may play essential roles in the studies of molecular evolution and genetic engineering in cucumber and species within Cucurbitaceae.

Supplementary Materials

The following are available online at https://www.mdpi.com/article/10.3390/agronomy11112289/s1, Table S1: Correlation analysis of codon usage index in genomes of ten Cucurbitaceae plant species.

Author Contributions

Y.N. and Y.L. drafted the main manuscript and performed the data analysis. Y.N. and C.W. were responsible for experimental design; C.W. and W.L. were responsible for guiding and manuscript revisions. All authors have read and agreed to the published version of the manuscript.

Funding

This research was funded by the National Natural Science Foundation of China (Nos. 32072559, 31860568, 31560563, and 31160398); the National Key Research and Development Program (2018YFD1000800); the Research Fund of Higher Education of Gansu, China (No. 2018C-14 and 2019B-082); the Natural Science Foundation of Gansu Province, China (Nos. 1606RJZA073 and 1606RJZA077); and the Science and Technology planning project of Gansu Province, China (No. 20YF8NA138).

Institutional Review Board Statement

Not applicable.

Informed Consent Statement

Not applicable.

Acknowledgments

We thank the Yuan Niu youth expert studio authorized by the talent work leading group of Lanzhou municipal Party Committee for its help and support.

Conflicts of Interest

The authors declare that they have no competing financial interest.

Appendix A

Figure A1. Correspondence analysis of genes in ten species of Cucurbitaceae: the distribution of genes is shown along the first axis and GC content. The vertical axis represents the GC content, and the horizontal axis represents the first Axis. Note: The red, green, and blue dots represent the genes with GC content higher than 60%, within 45–60%, and lower than 45%. Bold black line represents the linear regression line. Here, the regression equation and the correlation coefficients of GC12 and GC3 of each graph are as follows: Bhi: y = −0.174x + 0.448, r = −0.810, p < 0.01; Cla: y = −0.166x + 0.449, r = −0.810, p < 0.01; Cma: y = −0.167x + 0.46, r = −0.811, p < 0.01; Cme: y = 0.171x + 0.441, r = 0.784, p < 0.01; Cmo: y = 0.167x + 0.461, r = 0.812, p < 0.01; Cpe: y = −0.161x + 0.463, r = −0.824, p < 0.01; Csa: y = 0.160x + 0.441, r = 0.770, p < 0.01; Lsi: y = 0.168x + 0.447, r = 0.811, p < 0.01; Sed: y = −0.178x + 0.457, r = −0.865, p < 0.01; Tan: y = 0.171x + 0.453, r = 0.839, p < 0.01.
Agronomy 11 02289 g0a1

References

  1. Huang, S.; Li, R.; Zhang, Z.; Li, L.; Gu, X.; Fan, W.; Lucas, W.J.; Wang, X.; Xie, B.; Ni, P.; et al. The Genome of the Cucumber, Cucumis sativus L. Nat. Genet. 2009, 41, 1275–1281. [Google Scholar] [CrossRef] [Green Version]
  2. Feng, S.; Zhang, J.; Mu, Z.; Wang, Y.; Wen, C.; Wu, T.; Yu, C.; Li, Z.; Wang, H. Recent Progress on the Molecular Breeding of Cucumis sativus L. in China. Theor. Appl. Genet. 2020, 133, 1777–1790. [Google Scholar] [CrossRef]
  3. Pawełkowicz, M.; Zieliński, K.; Zielińska, D.; Pląder, W.; Yagi, K.; Wojcieszek, M.; Siedlecka, E.; Bartoszewski, G.; Skarzyńska, A.; Przybecki, Z. Next Generation Sequencing and Omics in Cucumber (Cucumis sativus L.) Breeding Directed Research. Plant Sci. 2016, 242, 77–88. [Google Scholar] [CrossRef]
  4. Geng, Y.; Jiang, L.; Zhang, Y.; He, Z.; Wang, L.; Peng, Y.; Wang, Y.; Liu, X.; Xu, Y. Assessment of the Dissipation, Pre-Harvest Interval and Dietary Risk of Carbosulfan, Dimethoate, and Their Relevant Metabolites in Greenhouse Cucumber (Cucumis sativus L.). Pest. Manag. Sci. 2018, 74, 1654–1663. [Google Scholar] [CrossRef]
  5. Tang, L.; Hamid, Y.; Chen, Z.; Lin, Q.; Shohag, M.J.I.; He, Z.; Yang, X. A Phytoremediation Coupled with Agro-Production Mode Suppresses Fusarium Wilt Disease and Alleviates Cadmium Phytotoxicity of Cucumber (Cucumis sativus L.) in Continuous Cropping Greenhouse Soil. Chemosphere 2021, 270, 128634. [Google Scholar] [CrossRef] [PubMed]
  6. Hashemi, L.; Golparvar, A.R.; Nasr-Esfahani, M.; Golabadi, M. Expression Analysis of Defense-Related Genes in Cucumber (Cucumis sativus L.) against Phytophthora Melonis. Mol. Biol. Rep. 2020, 47, 4933–4944. [Google Scholar] [CrossRef] [PubMed]
  7. Yu, G.; Chen, Q.; Wang, X.; Meng, X.; Yu, Y.; Fan, H.; Cui, N. Mildew Resistance Locus O Genes CsMLO1 and CsMLO2 Are Negative Modulators of the Cucumis sativus Defense Response to Corynespora Cassiicola. Int. J. Mol. Sci. 2019, 20, 4793. [Google Scholar] [CrossRef] [PubMed] [Green Version]
  8. He, X.; Guo, S.; Wang, Y.; Wang, L.; Shu, S.; Sun, J. Systematic Identification and Analysis of Heat-Stress-Responsive LncRNAs, CircRNAs and MiRNAs with Associated Co-Expression and CeRNA Networks in Cucumber (Cucumis sativus L.). Physiol. Plant 2020, 168, 736–754. [Google Scholar] [CrossRef] [PubMed]
  9. Shah, A.A.; Ahmed, S.; Ali, A.; Yasin, N.A. 2-Hydroxymelatonin Mitigates Cadmium Stress in Cucumis sativus Seedlings: Modulation of Antioxidant Enzymes and Polyamines. Chemosphere 2020, 243, 125308. [Google Scholar] [CrossRef] [PubMed]
  10. Borlotti, A.; Vigani, G.; Zocchi, G. Iron Deficiency Affects Nitrogen Metabolism in Cucumber (Cucumis sativus L.) Plants. BMC Plant Biol. 2012, 12, 189. [Google Scholar] [CrossRef] [Green Version]
  11. Hu, C.; Zhao, H.; Shi, J.; Li, J.; Nie, X.; Yang, G. Effects of 2,4-Dichlorophenoxyacetic Acid on Cucumber Fruit Development and Metabolism. Int. J. Mol. Sci. 2019, 20, 1126. [Google Scholar] [CrossRef] [Green Version]
  12. Li, Q.; Li, H.; Huang, W.; Xu, Y.; Zhou, Q.; Wang, S.; Ruan, J.; Huang, S.; Zhang, Z. A Chromosome-Scale Genome Assembly of Cucumber (Cucumis sativus L.). Gigascience 2019, 8, giz072. [Google Scholar] [CrossRef] [Green Version]
  13. Qin, X.; Zhang, Z.; Lou, Q.; Xia, L.; Li, J.; Li, M.; Zhou, J.; Zhao, X.; Xu, Y.; Li, Q.; et al. Chromosome-Scale Genome Assembly of Cucumis Hystrix-a Wild Species Interspecifically Cross-Compatible with Cultivated Cucumber. Hortic. Res. 2021, 8, 40. [Google Scholar] [CrossRef]
  14. Yu, X.; Wang, P.; Li, J.; Zhao, Q.; Ji, C.; Zhu, Z.; Zhai, Y.; Qin, X.; Zhou, J.; Yu, H.; et al. Whole-Genome Sequence of Synthesized Allopolyploids in Cucumis Reveals Insights into the Genome Evolution of Allopolyploidization. Adv. Sci. (Weinh) 2021, 8, 2004222. [Google Scholar] [CrossRef] [PubMed]
  15. Garcia-Mas, J.; Benjak, A.; Sanseverino, W.; Bourgeois, M.; González, V.; Henaff, E.; Camara, F.; Cozzuto, L.; Lowy, E.; Alioto, T.; et al. The Genome of Melon (Cucumis melo L.). Proc. Natl. Acad. Sci. USA 2012, 109, 11872–11877. [Google Scholar] [CrossRef] [PubMed] [Green Version]
  16. Guo, S.; Zhang, J.; Sun, H.; Salse, J.; Lucas, W.J.; Zhang, H.; Zheng, Y.; Mao, L.; Ren, Y.; Wang, Z.; et al. The Draft Genome of Watermelon (Citrullus lanatus) and Resequencing of 20 Diverse Accessions. Nat. Genet. 2013, 45, 51–58. [Google Scholar] [CrossRef] [Green Version]
  17. Urasaki, N.; Takagi, H.; Natsume, S.; Uemura, A.; Taniai, N.; Miyagi, N.; Fukushima, M.; Suzuki, S.; Tarora, K.; Tamaki, M.; et al. Draft Genome Sequence of Bitter Gourd (Momordica charantia), a Vegetable and Medicinal Plant in Tropical and Subtropical Regions. DNA Res. 2016, 24, 51–58. [Google Scholar] [CrossRef] [PubMed] [Green Version]
  18. Wu, S.; Shamimuzzaman, M.; Sun, H.; Salse, J.; Sui, X.; Wilder, A.; Wu, Z.; Levi, A.; Xu, Y.; Ling, K.; et al. The Bottle Gourd Genome Provides Insights into Cucurbitaceae Evolution and Facilitates Mapping of a Papaya Ring-spot Virus Resistance Locus. Plant J. 2017, 92, 963–975. [Google Scholar] [CrossRef] [Green Version]
  19. Sun, H.; Wu, S.; Zhang, G.; Jiao, C.; Guo, S.; Ren, Y.; Zhang, J.; Zhang, H.; Gong, G.; Jia, Z.; et al. Karyotype Stability and Unbiased Fractionation in the Paleo-Allotetraploid Cucurbita Genomes. Mol. Plant 2017, 10, 1293–1306. [Google Scholar] [CrossRef] [Green Version]
  20. Montero-Pau, J.; Blanca, J.; Bombarely, A.; Ziarsolo, P.; Esteras, C.; Martí-Gómez, C.; Ferriol, M.; Gómez, P.; Jamilena, M.; Mueller, L.; et al. De Novo Assembly of the Zucchini Genome Reveals a Whole-Genome Duplication Associated with the Origin of the Cucurbita Genus. Plant Biotechnol. J. 2018, 16, 1161–1171. [Google Scholar] [CrossRef] [PubMed] [Green Version]
  21. Barrera-Redondo, J.; Ibarra-Laclette, E.; Vázquez-Lobo, A.; Gutiérrez-Guerrero, Y.T.; Sánchez de la Vega, G.; Piñero, D.; Montes-Hernández, S.; Lira-Saade, R.; Eguiarte, L.E. The Genome of Cucurbita argyrosperma (Silver-Seed Gourd) Reveals Faster Rates of Protein-Coding Gene and Long Noncoding RNA Turnover and Neofunctionalization within Cucurbita. Mol. Plant 2019, 12, 506–520. [Google Scholar] [CrossRef] [Green Version]
  22. Ma, L.; Wang, Q.; Mu, J.; Fu, A.; Wen, C.; Zhao, X.; Gao, L.; Li, J.; Shi, K.; Wang, Y.; et al. The Genome and Transcriptome Analysis of Snake Gourd Provide Insights into Its Evolution and Fruit Development and Ripening. Hortic. Res. 2020, 7, 199. [Google Scholar] [CrossRef]
  23. Fu, A. Combined Genomic, Transcriptomic, and Metabolomic Analyses Provide Insights into Chayote (Sechium edule) Evolution and Fruit Development. Hortic. Res. 2021, 8, 1–15. [Google Scholar] [CrossRef]
  24. Camiolo, S.; Melito, S.; Porceddu, A. New Insights into the Interplay between Codon Bias Determinants in Plants. DNA Res. 2015, 22, 461–470. [Google Scholar] [CrossRef] [Green Version]
  25. Zenan, S.; Gan, Z.; Zhang, F.; Yi, X.; Zhang, J.; Wan, X. Analysis of Codon Usage Patterns in Citrus Based on Coding Sequence Data. BMC Genom. 2020, 21, 234. [Google Scholar] [CrossRef]
  26. Chenkang, Y.; Zhao, Q.; Wang, Y.; Zhao, J.; Qiao, L.; Wu, B.; Yan, S.; Zheng, J.; Zheng, X. Comparative Analysis of Genomic and Transcriptome Sequences Reveals Divergent Patterns of Codon Bias in Wheat and Its Ancestor Species. Front. Genet. 2021, 12, 732432. [Google Scholar] [CrossRef]
  27. Sharp, P.M.; Li, W.H. Codon Usage in Regulatory Genes in Escherichia Coli Does Not Reflect Selection for “rare” Codons. Nucleic. Acids. Res. 1986, 14, 7737–7749. [Google Scholar] [CrossRef] [Green Version]
  28. Sharp, P.M.; Li, W.H. The Codon Adaptation Index--a Measure of Directional Synonymous Codon Usage Bias, and Its Potential Applications. Nucleic. Acids. Res. 1987, 15, 1281–1295. [Google Scholar] [CrossRef] [Green Version]
  29. Carbone, A.; Zinovyev, A.; Képès, F. Codon Adaptation Index as a Measure of Dominating Codon Bias. Bioinformatics 2003, 19, 2005–2015. [Google Scholar] [CrossRef] [PubMed] [Green Version]
  30. Wright, F. The ‘Effective Number of Codons’ Used in a Gene. Gene 1990, 87, 23–29. [Google Scholar] [CrossRef]
  31. Ikemura, T. Codon Usage and TRNA Content in Unicellular and Multicellular Organisms. Mol. Biol. Evol. 1985, 2, 13–34. [Google Scholar] [CrossRef]
  32. Bennetzen, J.L.; Hall, B.D. Codon Selection in Yeast. J. Biol. Chem. 1982, 257, 3026–3031. [Google Scholar] [CrossRef]
  33. Hershberg, R.; Petrov, D.A. Selection on Codon Bias. Annu. Rev. Genet. 2008, 42, 287–299. [Google Scholar] [CrossRef] [PubMed] [Green Version]
  34. Bulmer, M. The Selection-Mutation-Drift Theory of Synonymous Codon Usage. Genetics 1991, 129, 897–907. [Google Scholar] [CrossRef]
  35. Wang, H.-C.; Hickey, D. Rapid Divergence of Codon Usage Patterns within the Rice Genome. BMC Evol. Biol. 2007, 7 (Suppl. S1), S6. [Google Scholar] [CrossRef] [Green Version]
  36. Liu, H.; He, R.; Zhang, H.; Huang, Y.; Tian, M.; Junjie, Z. Analysis of Synonymous Codon Usage in Zea Mays. Mol. Biol. Rep. 2009, 37, 677–684. [Google Scholar] [CrossRef]
  37. Li, N.; Sun, M.; Jiang, Z.; Shu, H.; Zhang, S. Genome-Wide Analysis of the Synonymous Codon Usage Patterns in Apple. J. Integr. Agric. 2016, 15, 983–991. [Google Scholar] [CrossRef]
  38. Clepet, C.; Joobeur, T.; Zheng, Y.; Jublot, D.; Huang, M.; Truniger, V.; Boualem, A.; Hernandez-Gonzalez, M.E.; Dolcet-Sanjuan, R.; Portnoy, V.; et al. Analysis of Expressed Sequence Tags Generated from Full-Length Enriched CDNA Libraries of Melon. BMC Genom. 2011, 12, 252. [Google Scholar] [CrossRef] [PubMed] [Green Version]
  39. Peden, J.F. Analysis of Codon Usage. Ph.D. Thesis, University of Nottingham, Nottingham, UK, 1999. [Google Scholar]
  40. Fuglsang, A. The “effective Number of Codons” Revisited. Biochem. Biophys. Res. Commun 2004, 317, 957–964. [Google Scholar] [CrossRef]
  41. Duret, L. TRNA Gene Number and Codon Usage in the C. Elegans Genome Are Co-Adapted for Optimal Translation of Highly Expressed Genes. Trends. Genet. 2000, 16, 287–289. [Google Scholar] [CrossRef]
  42. Sharp, P.M.; Li, W.-H. An Evolutionary Perspective on Synonymous Codon Usage in Unicellular Organisms. J. Mol. Evol. 1986, 24, 28–38. [Google Scholar] [CrossRef] [PubMed]
  43. Chen, C.; Chen, H.; Zhang, Y.; Thomas, H.R.; Frank, M.H.; He, Y.; Xia, R. TBtools: An Integrative Toolkit Developed for Interactive Analyses of Big Biological Data. Mol. Plant 2020, 13, 1194–1202. [Google Scholar] [CrossRef]
  44. McInerney, J.O. GCUA: General Codon Usage Analysis. Bioinformatics 1998, 14, 372–373. [Google Scholar] [CrossRef] [PubMed]
  45. Sueoka, N. Directional Mutation Pressure and Neutral Molecular Evolution. Proc. Natl. Acad. Sci. USA 1988, 85, 2653–2657. [Google Scholar] [CrossRef] [PubMed] [Green Version]
  46. Sueoka, N. Directional Mutation Pressure, Mutator Mutations, and Dynamics of Molecular Evolution. J. Mol. Evol. 1993, 37, 137–153. [Google Scholar] [CrossRef]
  47. Novembre, J.A. Accounting for Background Nucleotide Composition When Measuring Codon Usage Bias. Mol. Biol. Evol. 2002, 19, 1390–1394. [Google Scholar] [CrossRef] [Green Version]
  48. Wang, H.; Liu, S.; Zhang, B.; Wei, W. Analysis of Synonymous Codon Usage Bias of Zika Virus and Its Adaption to the Hosts. PLoS ONE 2016, 11, e0166260. [Google Scholar] [CrossRef] [PubMed]
  49. Mcewan, N.; Gatherer, D. Codon Indices as a Predictor of Gene Functionality in a Frankia Operon. Can. J. Bot. 2011, 77, 1287–1292. [Google Scholar] [CrossRef]
  50. Gatherer, D.; McEwan, N. Small Regions of Preferential Codon Usage and Their Effect on Overall Codon Bias—The Case of the Plp Gene. Tenn. Baptist. Mission. Board 1997, 43, 107–114. [Google Scholar] [CrossRef]
  51. Wu, Y.; Zhao, D.; Tao, J. Analysis of Codon Usage Patterns in Herbaceous Peony (Paeonia lactiflora Pall.) Based on Transcriptome Data. Genes 2015, 6, 1125–1139. [Google Scholar] [CrossRef] [Green Version]
  52. Liu, S.; Qiao, Z.; Wang, X.; Zeng, H.; Li, Y.; Cai, N.; Chen, Y. Analysis of Codon Usage Patterns in “Lonicerae Flos” (Lonicera macranthoides Hand. -Mazz.) Based on Transcriptome Data. Gene 2019, 705, 127–132. [Google Scholar] [CrossRef] [PubMed]
  53. Sánchez, D.; Terrazas, T.; Grego, D.; Arias, S. Phylogeny in Echinocereus (Cactaceae) Based on Combined Morphological and Molecular Evidence: Taxonomic Implications. Syst. Biodivers. 2017, 16, 28–44. [Google Scholar] [CrossRef]
  54. Horiike, T. An introduction to molecular phylogenetic analysis. Rev. Agric. Sci. 2016, 4, 36–45. [Google Scholar] [CrossRef] [Green Version]
  55. Wang, L.; Xing, H.; Yuan, Y.; Wang, X.; Saeed, M.; Tao, J.; Feng, W.; Zhang, G.; Song, X.; Sun, X. Genome-Wide Analysis of Codon Usage Bias in Four Sequenced Cotton Species. PLoS ONE 2018, 13, e0194372. [Google Scholar] [CrossRef] [Green Version]
Figure 1. Distribution of the GC contents of genes in ten species of Cucurbitaceae. Note: X-axis indicates the percentage of GC contents, and Y-axis indicates each species. Abbreviations are used for species names (refer to Table 1 for details).
Agronomy 11 02289 g001
Figure 2. Heat map of relative synonymous codon usage (RSCU) values of ten species of Cucurbitaceae. Note: The vertical axis represents the first two bases of the codons, and the horizontal axis represents the third-base corresponding to each species. Abbreviations are used for species names (refer to Table 1 for details). The digits under UAGC represent the number of codons ending with corresponding bases with the RSCU value greater than one. The digits underneath the abbreviation of the species name represent the number of codons with the RSCU value greater than one in the related species. Blue to red color indicates low to high RSCU values. The blank spaces indicate three stop codons (UAA, UAG, and UGA) and two nonsynonymous codons (AUG and UGG). The size of circles also indicates the relative values of RSCU. This figure is drawn by TBtools software.
Agronomy 11 02289 g002
Figure 3. Correspondence analysis of CUB of ten species of Cucurbitaceae: the distribution of genes is shown along the first and second axes. Note: The red, green, and blue dots represent the genes with GC content higher than 60%, within 45–60%, and lower than 45%.
Agronomy 11 02289 g003
Figure 4. Correspondence analysis of CUB of ten species of Cucurbitaceae: the distribution of codons is shown along the first and second axes. Note: The red, green, blue, and purple dots represent the codons ending with A, C, G, and U. The outlier points are marked with the names of the corresponding codons.
Agronomy 11 02289 g004
Figure 5. Neutrality plot analysis of genes in ten species of Cucurbitaceae. The vertical axis represents the GC content in the first two bases of the codon, and the horizontal axis represents the GC content in the third base. The points on the diagonal represent that the content of GC3 is equal to that of Gc12, indicating that codon usage bias is mainly affected by mutation. Otherwise, it was affected by natural selection. The red line represents the linear regression line. Here, the regression equation and the correlation coefficients of GC12 and GC3 of each graph are as follows: Bhi: y = 0.153x + 0.391, r = 0.286, p < 0.01; Cla: y = 0.119x + 0.405, r = 0.232, p < 0.01; Cma: y = 0.092x + 0.42, r = 0.194, p < 0.01; Cme: y = 0.144x + 0.391, r = 0.249, p < 0.01; Cmo: y = 0.094x + 0.419, r = 0.197, p < 0.01; Cpe: y = 0.074x + 0.431, r = 0.167, p < 0.01; Csa: y = 0.099x + 0.413, r = 0.173, p < 0.01; Lsi: y = 0.13x + 0.4, r = 0.252, p < 0.01; Sed: y = 0.143x + 0.394, r= 0.336, p < 0.01; Tan: y = 0.133x + 0.398, r = 0.289, p < 0.01.
Agronomy 11 02289 g005
Figure 6. Distribution of ENC and GC3s of genes in ten species of Cucurbitaceae. Note: the solid red curve indicates the expected ENC value. ENCexp = 2 + GC3s + 29/(GC3s2 + (1 − GC3s)2). The solid blue curve represents the fitting curve.
Agronomy 11 02289 g006
Figure 7. Distribution of ENC ratio in ten species of Cucurbitaceae. Note: the horizontal axis is the value of ENC ratio ((ENCexp−ENCobs)/ENCexp); the vertical axis indicates each species. Abbreviations are used for species names (refer to Table 1 for details).
Agronomy 11 02289 g007
Figure 8. The plot of ENC vs. gene expression level in ten species of Cucurbitaceae. Note: the horizontal axis is the value of CAI; the vertical axis is the value of ENC.
Agronomy 11 02289 g008
Figure 9. Plot of ENC vs. protein length in ten species of Cucurbitaceae. Note: the horizontal axis is the value of protein length, the vertical axis is the value of ENC.
Agronomy 11 02289 g009
Figure 10. Cluster tree based on the RSCU values of ten species of Cucurbitaceae. Note: the horizontal axis represents the height of horizontal clustering. The cluster tree is calculated and drawn by the ggdendro package based on the R language.
Agronomy 11 02289 g010
Table 1. Sequence information before and after selection in ten species of Cucurbitaceae.
SpeciesCommon NamesAbbreviationsCDS NumbersSequence Source
Before SelectionAfter Selection
Benincasa hispidaWax gourdBhi2746719865CuGenDB
Citrullus lanatusWatermelonCla2259619904CuGenDB
Cucurbita maximaRimuCma3207627769CuGenDB
Cucumis meloMelonCme2998021959CuGenDB
Cucurbita moschataRifuCmo3220528423CuGenDB
Cucurbita pepoZucchiniCpe2786822990CuGenDB
Cucumis sativusCucumberCsa2431720274CuGenDB
Lagenaria sicerariaBottle gourdLsi2247219307CuGenDB
Sechium eduleChayoteSed2823726761CuGenDB
Trichosanthes anguinaSnake gourdTan2287421541CuGenDB
Table 2. The P2 analysis of CUB in ten species of Cucurbitaceae.
SpeciesSSUWWUSSCWWCP2
B. hispida4.925.082.673.210.5120
C. lanatus4.905.062.713.240.5116
C. maxima4.814.852.833.460.5185
C. melo5.065.102.573.170.5176
C. moschata4.814.832.833.470.5194
C. pepo4.884.862.793.460.5216
C. sativus5.115.112.533.170.5201
L. siceraria4.925.082.703.210.5110
S. edule4.684.962.933.360.5047
T. anguina4.765.002.813.300.5079
Table 3. Optimal codons identified in ten species of Cucurbitaceae.
Amino AcidsOptimal Codons
U-EndingA-EndingG-Ending
AlaGCUGCA
Arg(CGU)AGA(CGA)AGG
AsnAAU
AspGAU
CysUGU
Gln CAA
Glu GAA
GlyGGUGGA
HisCAU
IleAUUAUA
LeuCUUUUACUAUUG
Lys AAA
PheUUU
ProCCUCCA
SerUCUAGUUCA
ThrACUACA
TyrUAU
ValGUUGUA
Note: the codons shown in bold in brackets are not common optimal codons in ten species.
Publisher’s Note: MDPI stays neutral with regard to jurisdictional claims in published maps and institutional affiliations.

