Article

Characterization of Gamma-Rays-Induced Spring Wheat Mutants for Morphological and Quality Traits through Multivariate and GT Bi-Plot Analysis

1
Plant Genomics and Molecular Breeding Laboratory, National Institute for Biotechnology and Genetic Engineering College, Pakistan Institute of Engineering and Applied Sciences (NIBGE-C, PIEAS), Faisalabad 38000, Punjab, Pakistan
2
School of Life Sciences, Guangzhou University, Guangzhou 510006, China
3
Siberian Federal Scientific Center of Agrobiotechnology, Russian Academy of Sciences, Krasnoobsk 630501, Novosibirsk Region, Russia
*
Author to whom correspondence should be addressed.
Agronomy 2021, 11(11), 2288; https://doi.org/10.3390/agronomy11112288
Submission received: 17 July 2021 / Revised: 3 September 2021 / Accepted: 3 September 2021 / Published: 12 November 2021

Abstract

:
Exploiting new genetic resources is an effective way to achieve sustainable wheat production. To this end, we exposed wheat seeds of the “Punjab-11” cultivar to gamma rays. A total of 32 stable mutants (M7) were developed, followed by characterization by conducting multilocation trials over two seasons. Principal component analysis (PCA) showed that the first six components accounted for 90.28% of the total variation among the plant height, tillers per plant, 1000-kernel weight, grain yield, and quality traits. All mutants were grouped into three clusters based on high yield index values. The genotype by trait (GT) bi-plot revealed significant associations between yield and its components among the mutants. Positive correlations were estimated for tillers per plant, plant height, 1000-kernel weight, and grain yield; however, yield components showed negative associations with protein, moisture, and gluten contents. The mutant lines Pb-M-59 waxy, Pb-M-1272 waxy, Pb-M-2260, Pb-M-1027 waxy, Pb-M-1323 waxy, and Pb-M-1854 exhibited maximum grain yield, 1000-grain weight, and tillers per plant values. Likewise, Pb-M-2725, Pb-M-2550, and Pb-M-2728 were found to be the best mutant lines in terms of grain quality; thus, the use of gamma radiation is effective in improving the desirable traits, including yield and grain quality. It is suggested that these traits can be improved beyond the performance of corresponding traits in their parent genotypes. The newly produced mutants can also be used to explore the genetic mechanisms of complex traits in the future.

1. Introduction

Spring wheat (Triticum aestivum L.), one of the major staple food crops, is grown worldwide over ~222 million hectares, with an annual production rate of 775.8 million tons [1]. Other than starch, it is a rich source of proteins, vitamins, and dietary fibers, which are required to maintain a healthy diet [2,3]. The present population growth rate demands sustained improvements in wheat production, particularly within the emerging context of climate change [4,5,6]; hence, there is a dire need to explore new genetic solutions for sustainable wheat production [7,8].
The existence of genetic variation within the germplasm ensures the development of improved wheat cultivars that can be grown under different agro-climatic conditions [9]. Morphological traits provide the basis for the classification of genetic wheat sources [10,11,12]. Genetic diversity can be estimated using morphological traits, as well as molecular assays, including DNA fingerprinting and whole-genome sequencing. Phenotypic characterization procedures can be used to differentiate wheat genotypes in the field [13]; therefore, the continuous development and availability of novel genetic resources are essential for improving wheat cultivars [14,15].
The primary goal of a plant breeder is to develop cultivars with stable high yields and of better quality. The stability of a cultivar is a very important criterion for wheat breeders and molecular geneticists when exploring the diversity present in complex traits, such as grain yield and quality traits [16,17]. Grain quality traits including protein contents are fundamental attributes of wheat quality. The variations in these traits are crucial for wheat improvement [18]. Protein contents are estimated from the composition of gluten molecules, which are conferred via storage proteins in wheat grain [19,20]. High protein and gluten contents are recognized as vital components in determining dough quality [21]. The dominant protein in flour is gluten, which contributes 80 to 85% of the total proteins [22]. Additionally, the grain moisture content plays an important role in determining wheat grain quality and is inversely related to dry matter loss [23]. Grain yield is a complex trait and the prime objective of plant breeders is understanding the basis of associations (both genetic and phenotypic) among grain yield and other traits, which helps breeders in enhancing wheat production.
Multivariate analysis helps in the identification of groups of genotypes, accessions, or varieties containing the desirable trait combinations that are useful in plant breeding programs. Principal component analysis (PCA) and cluster analysis can be used to summarize and explain the variations among wheat genotypes [24,25]. Principal component analysis can help in comprehending the variability present among the data by converting huge numbers of variables into smaller numbers, imparting sufficient information regarding genetic variation in the germplasm [26]. This tool has been used to characterize different traits in several crop species, including heat and drought tolerance in wheat [27,28,29,30], malting quality traits in barley [31], genotypic origin in coffee [32], drought tolerance in rice [33,34], agro-morphological traits in sugar beet [35], genetic diversity studies in sorghum [36], and morphological traits in maize [37]; therefore, the application of these statistical techniques will also be useful in delineating the variability in wheat genotypes and mutants.
A genotype by trait (GT) bi-plot assesses the GGE (main effect of a genotype, G) and its interaction with the environment (GE). The bi-plot technique has emerged as a potential tool that can be used to unravel the information about multiple traits simultaneously [38]. Compared with multivariate analyses, the GT bi-plot tool characterizes genotypes based on multiple traits and helps in the identification of superior genotypes possessing desirable combinations of variables, ultimately leading toward their utilization in crop breeding programs as commercial cultivars or even parents [39]. The GT bi-plot analysis can also be used to demonstrate the genetic associations among multiple traits [40,41]. Furthermore, valuable information about the efficient utilization of genotypes for production, for the identification of less desirable traits, and as the basis for indirect selection of target traits by identifying suitable features can be explored with this approach [42]. Since it was first reported by Gabriel [43], this approach has been applied to data from different crops to understand the effects of the genotype and environment on the relationships between agronomic, physiological, quality, and yield characteristics [44,45,46,47,48,49,50,51,52,53].
Knowledge of the genetic variability regarding morphological and quality traits is essential in achieving the goals of wheat breeding programs, including achieving high yield, wider adaptability, and desirable quality attributes [54]; therefore, we planned this experiment to study the mutagenic effects of gamma radiation on grain yield in terms of the performance, stability, and bread wheat quality of the “Punjab-11” variety. We also attempted to classify the bread wheat mutant lines into various groups, followed by the identification of genetically diverse mutants possessing desirable grain yield and yield components.
In the present study, 32 mutant lines and a wild type wheat cultivar “Punjab-11” were selected from the already developed M5 gamma-radiated mutant population. Variation patterns among wheat mutant lines were studied through PCA and GT bi-plot analyses. This study will provide insights into the genetic advances made in terms of the grain yield and quality of the selected mutants, and could be potential help in identifying mutant lines that can be utilized in future wheat breeding programs.

2. Materials and Methods

2.1. Mutant Population Development

Breeder seeds of Punjab-11 were treated with an optimized dose of gamma radiation (Cs 137 (250 k Gy)) for a duration of 25 min at ambient room temperature to induce mutagenesis. For surface sterilization, seeds were treated with sodium hypochlorite (5%) and ethanol (70%) followed by three to five washings with distilled water.
In total, ~7000 seeds of the wheat variety “Punjab-11” were treated with an optimum dose of gamma radiation. The M0 seeds of the parent Punjab-11 were grown at the field station at NIBGE, Pakistan, during 2012. We kept the rows 30 cm apart from each other, while the seeds were sown at 10 cm apart in each row. In total, 3700 M1 plants were germinated. Standard cultural practices were provided from sowing until harvesting. We bagged the spike of the main tiller of each plant to avoid cross pollination. The main spike from each M1 plant was then harvested and threshed separately followed by sowing of the M2 rows in 2013. In the next year (2014), the M3 row of each M2 plant was sown, followed by harvesting a single main spike from the first plant of each row. Then, M4 was sown in the off season for generation advancement. Next, a whole single plant containing 3–5 tillers was harvested separately and sown during 2015 to enable sowing of M5 rows. Again, the first single plant containing 3–5 tillers was harvested from each row. In 2016–2017, 3483 M6 families were planted in the field at NIBGE. At this stage, almost all mutant families exhibited homozygosity and uniformity. Out of these, a total of 32 stable mutant lines were selected based on their responses to rust diseases.

2.2. Experimental Design

The experiment was conducted at two locations, i.e., field stations of the National Institute for Biotechnology and Genetic Engineering (NIBGE) and Nuclear Institute for Agriculture and Biology (NIAB), during normal wheat growing seasons over the period 2018–2020. The field experiments were conducted by adopting a randomized complete block design (RCBD) using three replications for both the locations and years. Two-season testing was carried out to evaluate the genetic stability of the traits under field conditions. The distance between the rows and plants was kept to 30 cm and 10 cm, respectively. For each hill, only one plant was retained by removing the extra plants at the seedling stage. For collection of data, five plants were tagged in each row. Recommended fertilizers were applied, including urea (100 kg), phosphate (DAP) (100 kg), and potash (50 kg). Both potash and phosphate along with urea (50 kg) were applied at the time of sowing. In addition, the remaining urea was applied during the first and second irrigation stages (25:25 kg). Weeds were controlled by applying two sprays, namely Bromoxinal (300 mL/acre) after the first irrigation and Topik (100 g) after the second irrigation. The recommended agronomic practices were carried out from sowing until harvesting [55].

2.3. Data Collection

Data of different morphological traits such as plant height, number of tillers per plant, number of days to heading, spike length, number of spikelets per spike, 1000-kernel weight, and grain yield were recorded. The numbers of days to flowering were counted after the emergence of 50% heads. The plant height (cm) of each tagged plant was measured form the base of the plant to the tip of the spike using a meter stick. The spike length was also measured from the bottom to the spike tip without awns. Additionally, number of tillers per plant and number of spikelets per spike were counted at maturity. To measure the 1000-kernel weight, 1000 seeds of each mutant line were weighed using an electric balance (VWR® A-Series balances). The grain yield of each mutant line and wild type was also measured. Lastly, important seed quality attributes such as the protein, moisture, and gluten contents were estimated through OmegAnalyzer.

2.4. Statistical Analyses

Analysis of variance (ANOVA) [56] was performed for each trait for all generations to determine the extent of variation and significance among the mutant lines using SPSS16 software. The probability levels were kept to 1% and 5% to test the statistical levels of significance. Furthermore, minimum differences among the mean values were estimated via the least significant difference (LSD) test [57].
The PCA and cluster analyses were performed using NCSS 2020 software. Principal Component Analysis values were used to construct a dendrogram based on the Euclidean distance matrix. The mutant lines were grouped according to the Ward’s minimum variance method [58]. Additionally, GT bi-plot analysis was performed for estimation of the degrees of association among traits and mutant lines and for the identification of suitable mutant lines with desirable trait combinations using the GGE bi-plot tool [59].

3. Results

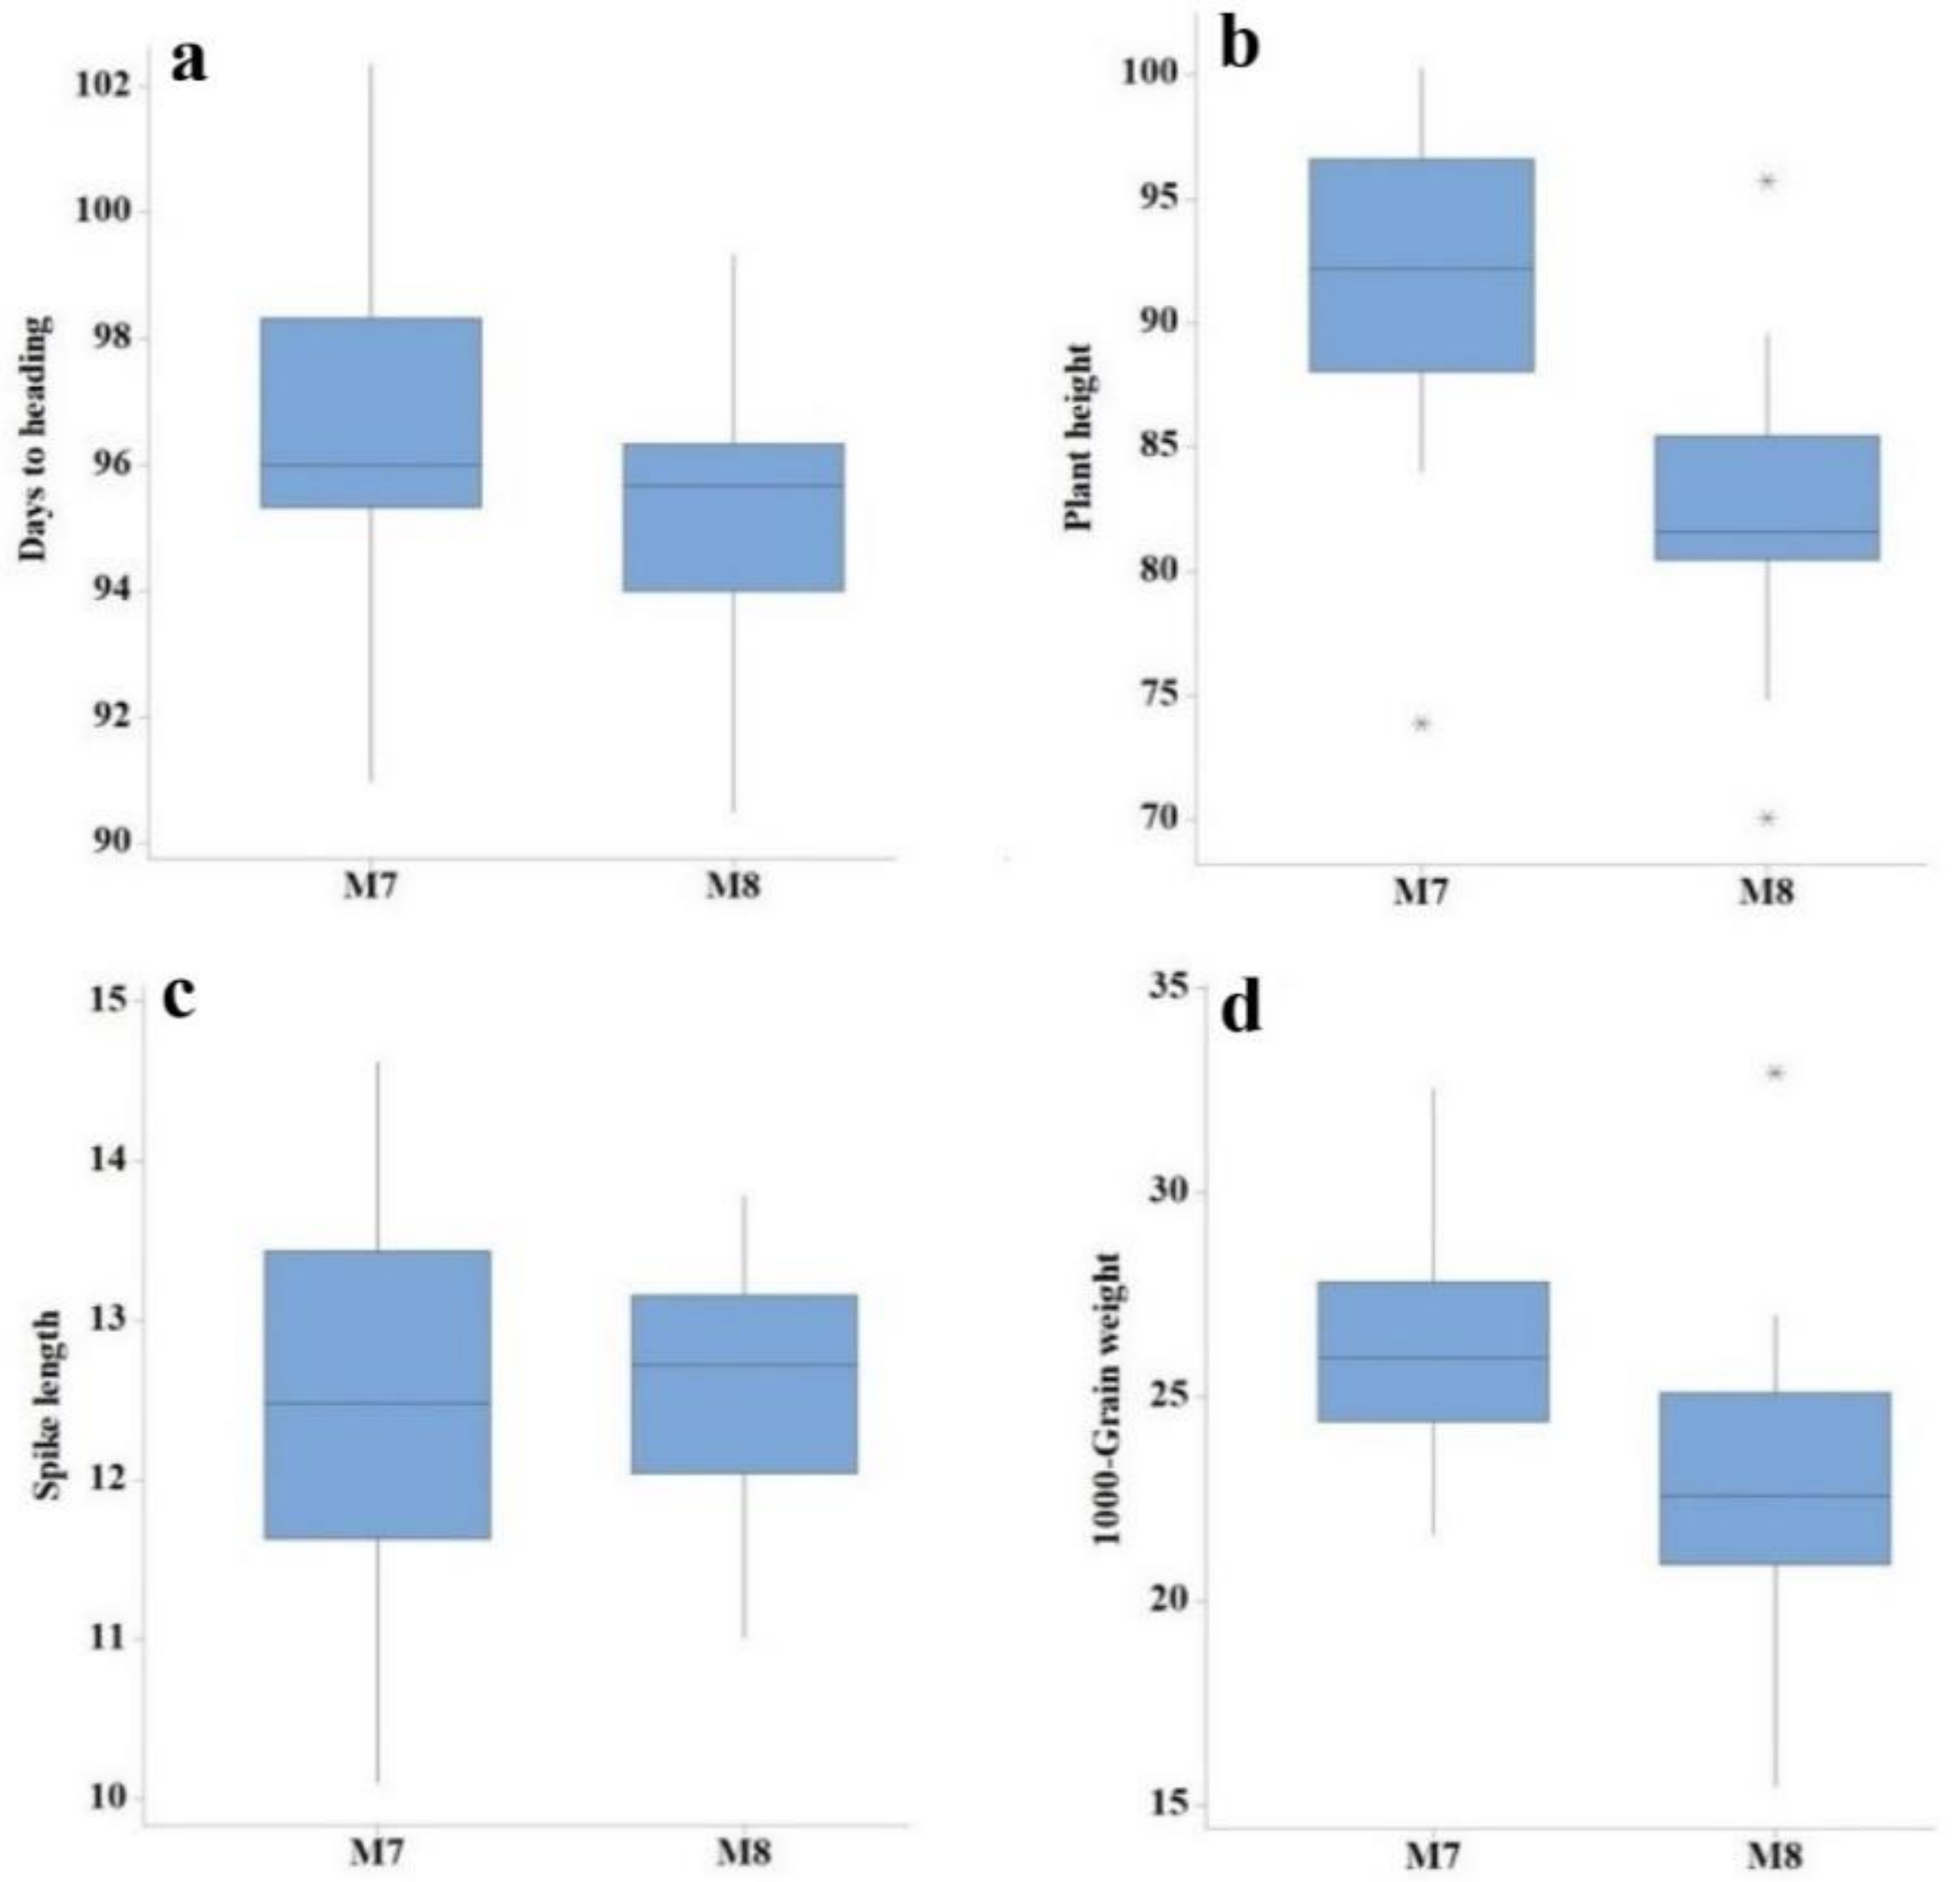
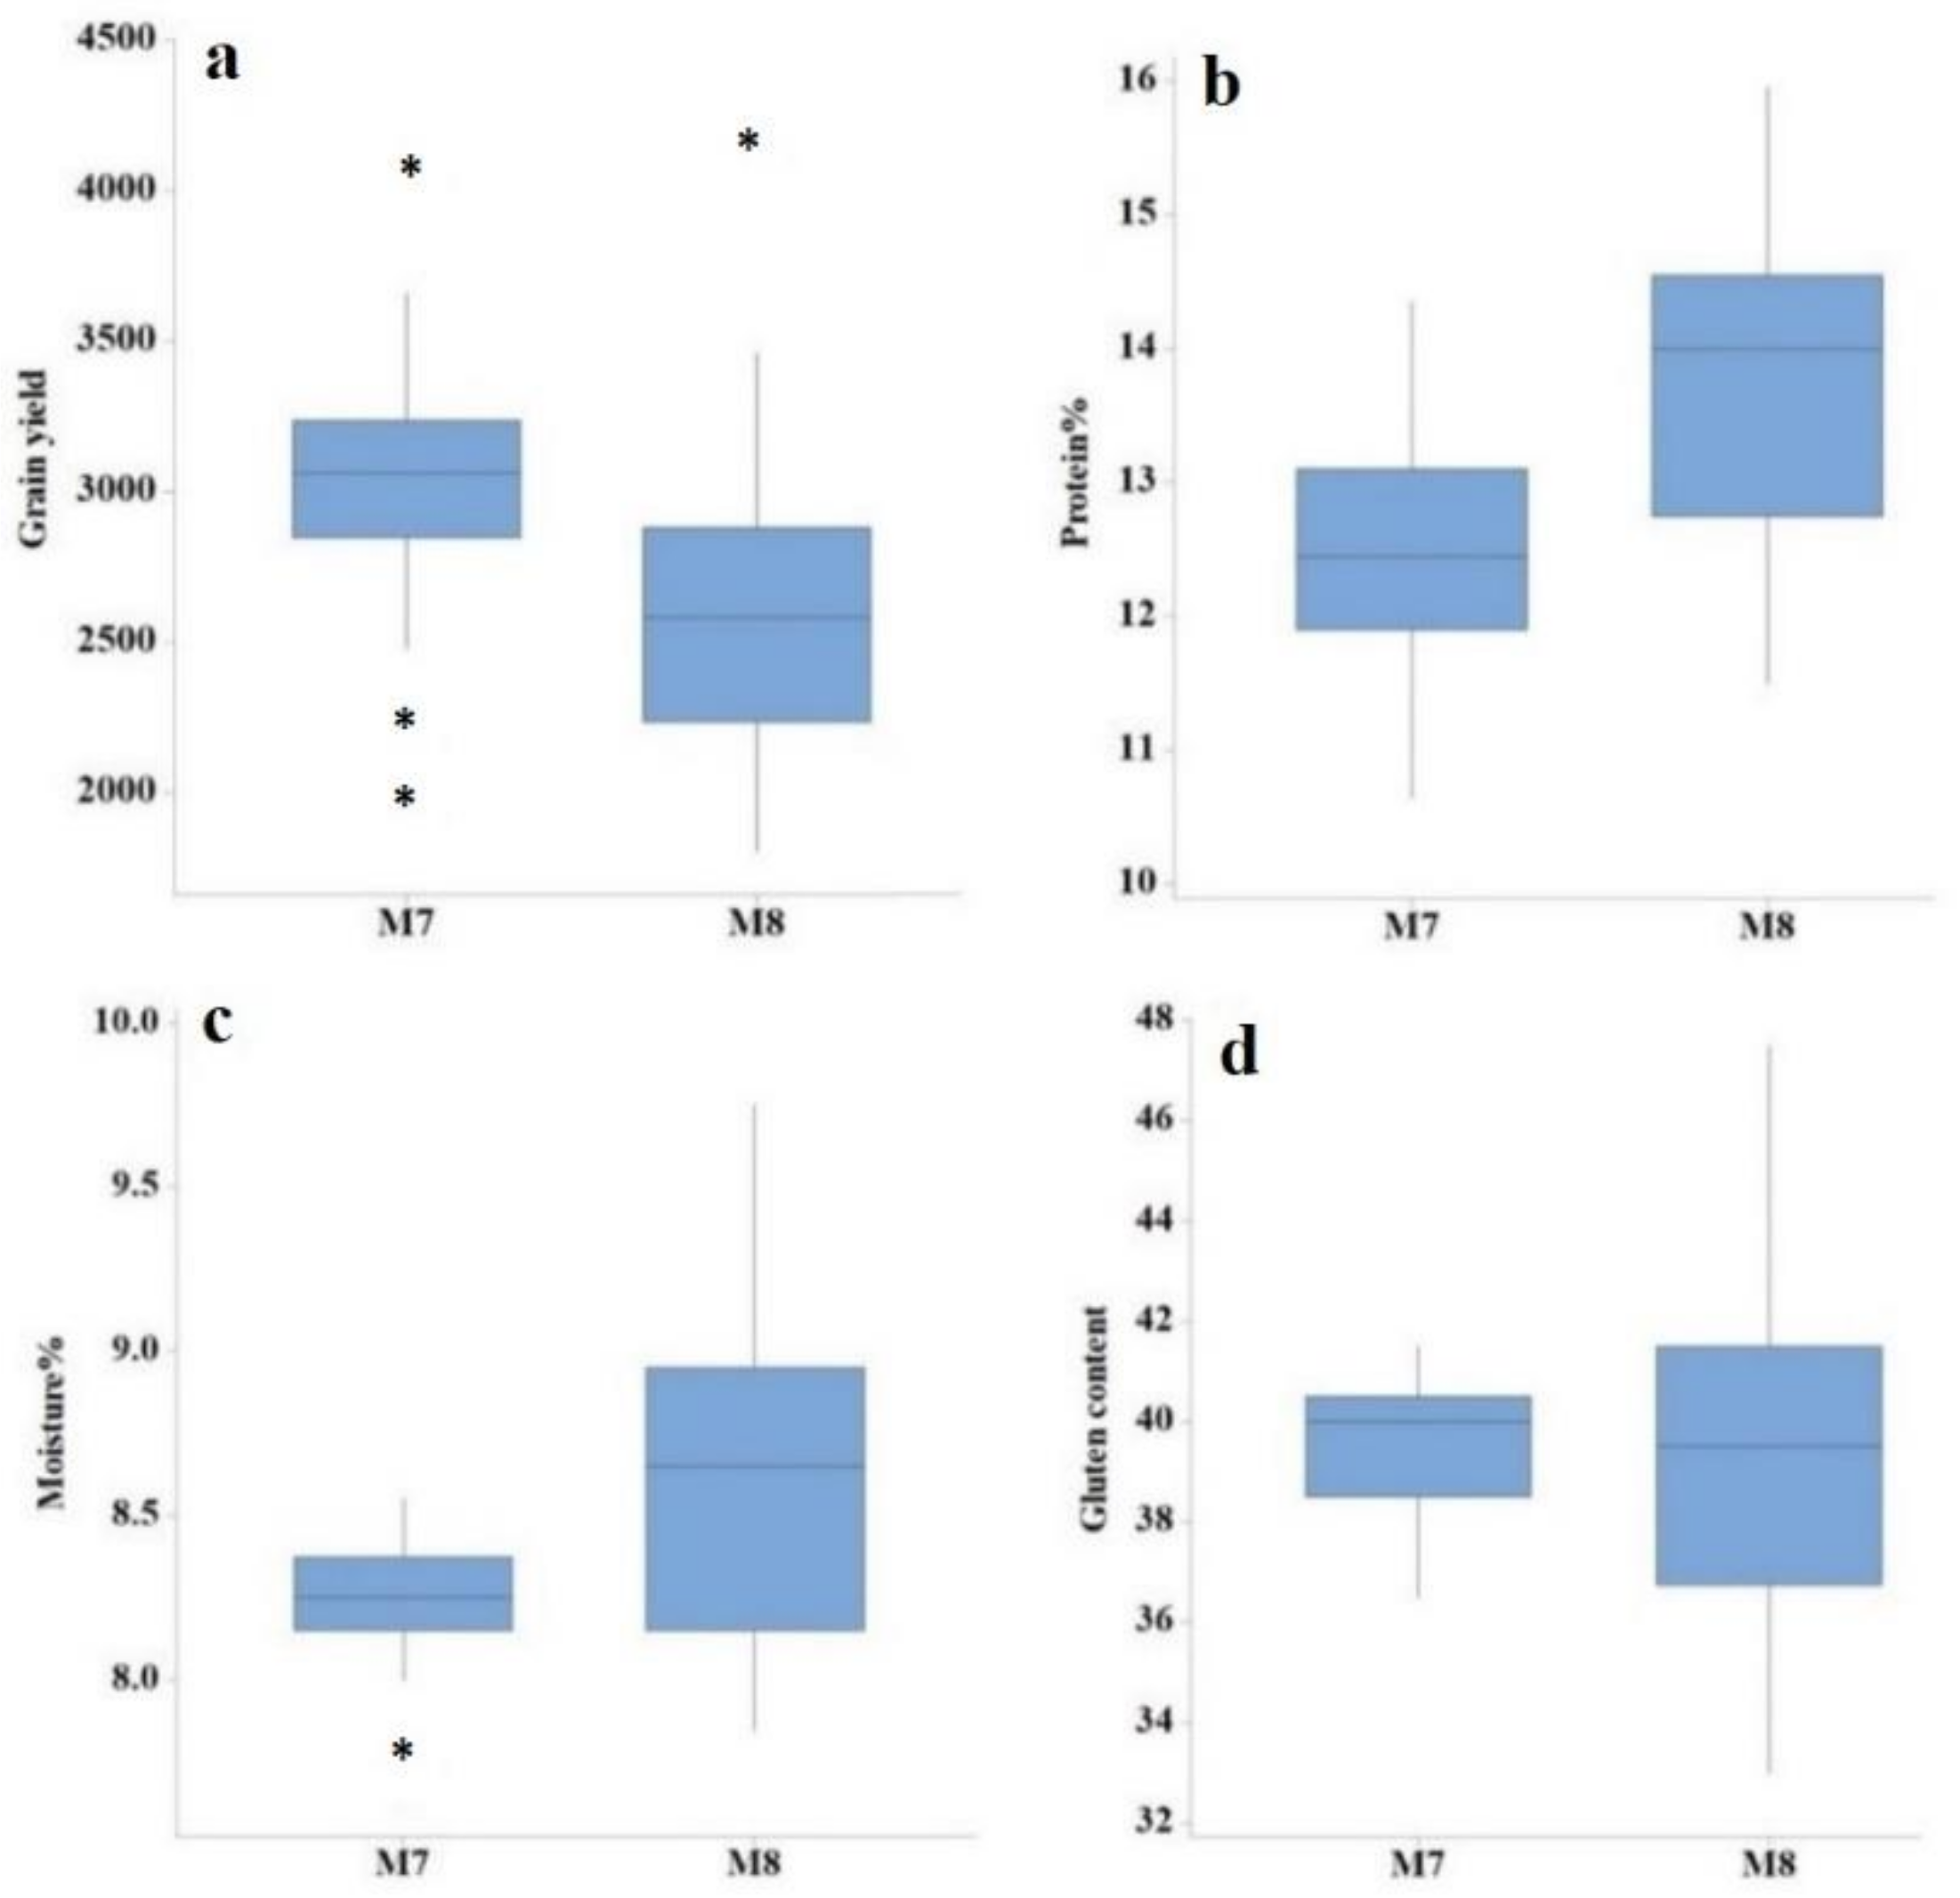
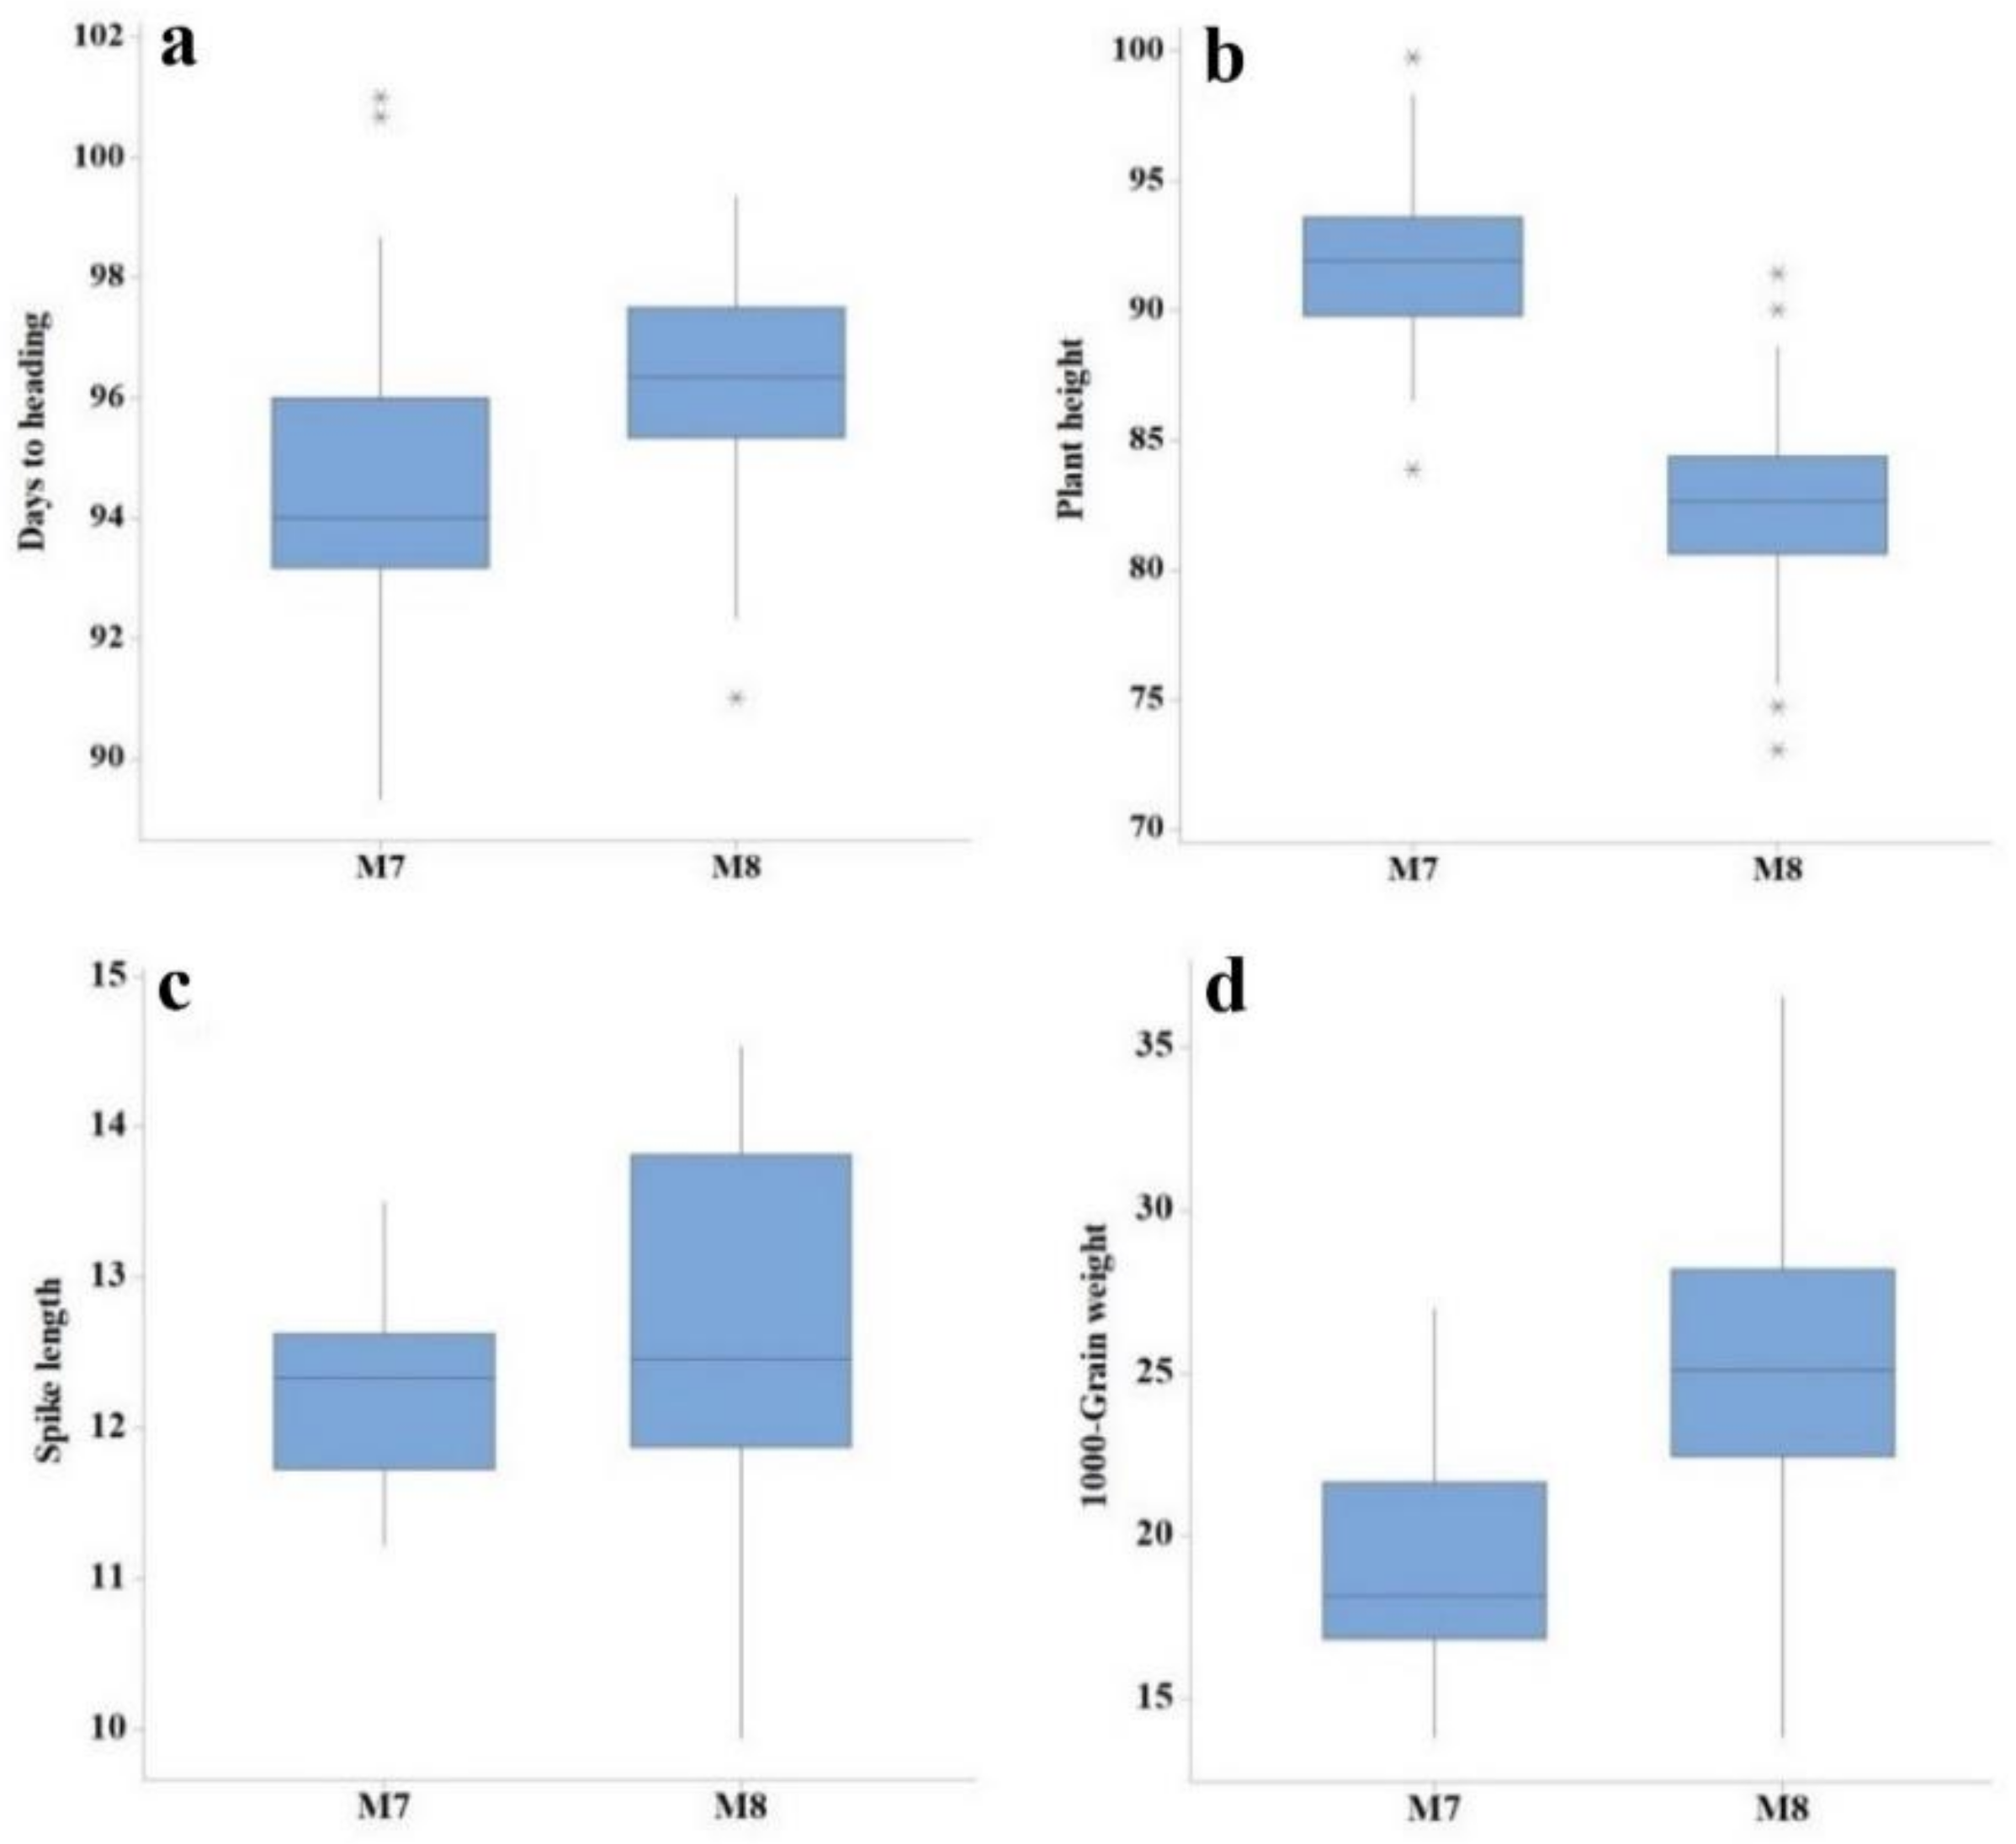
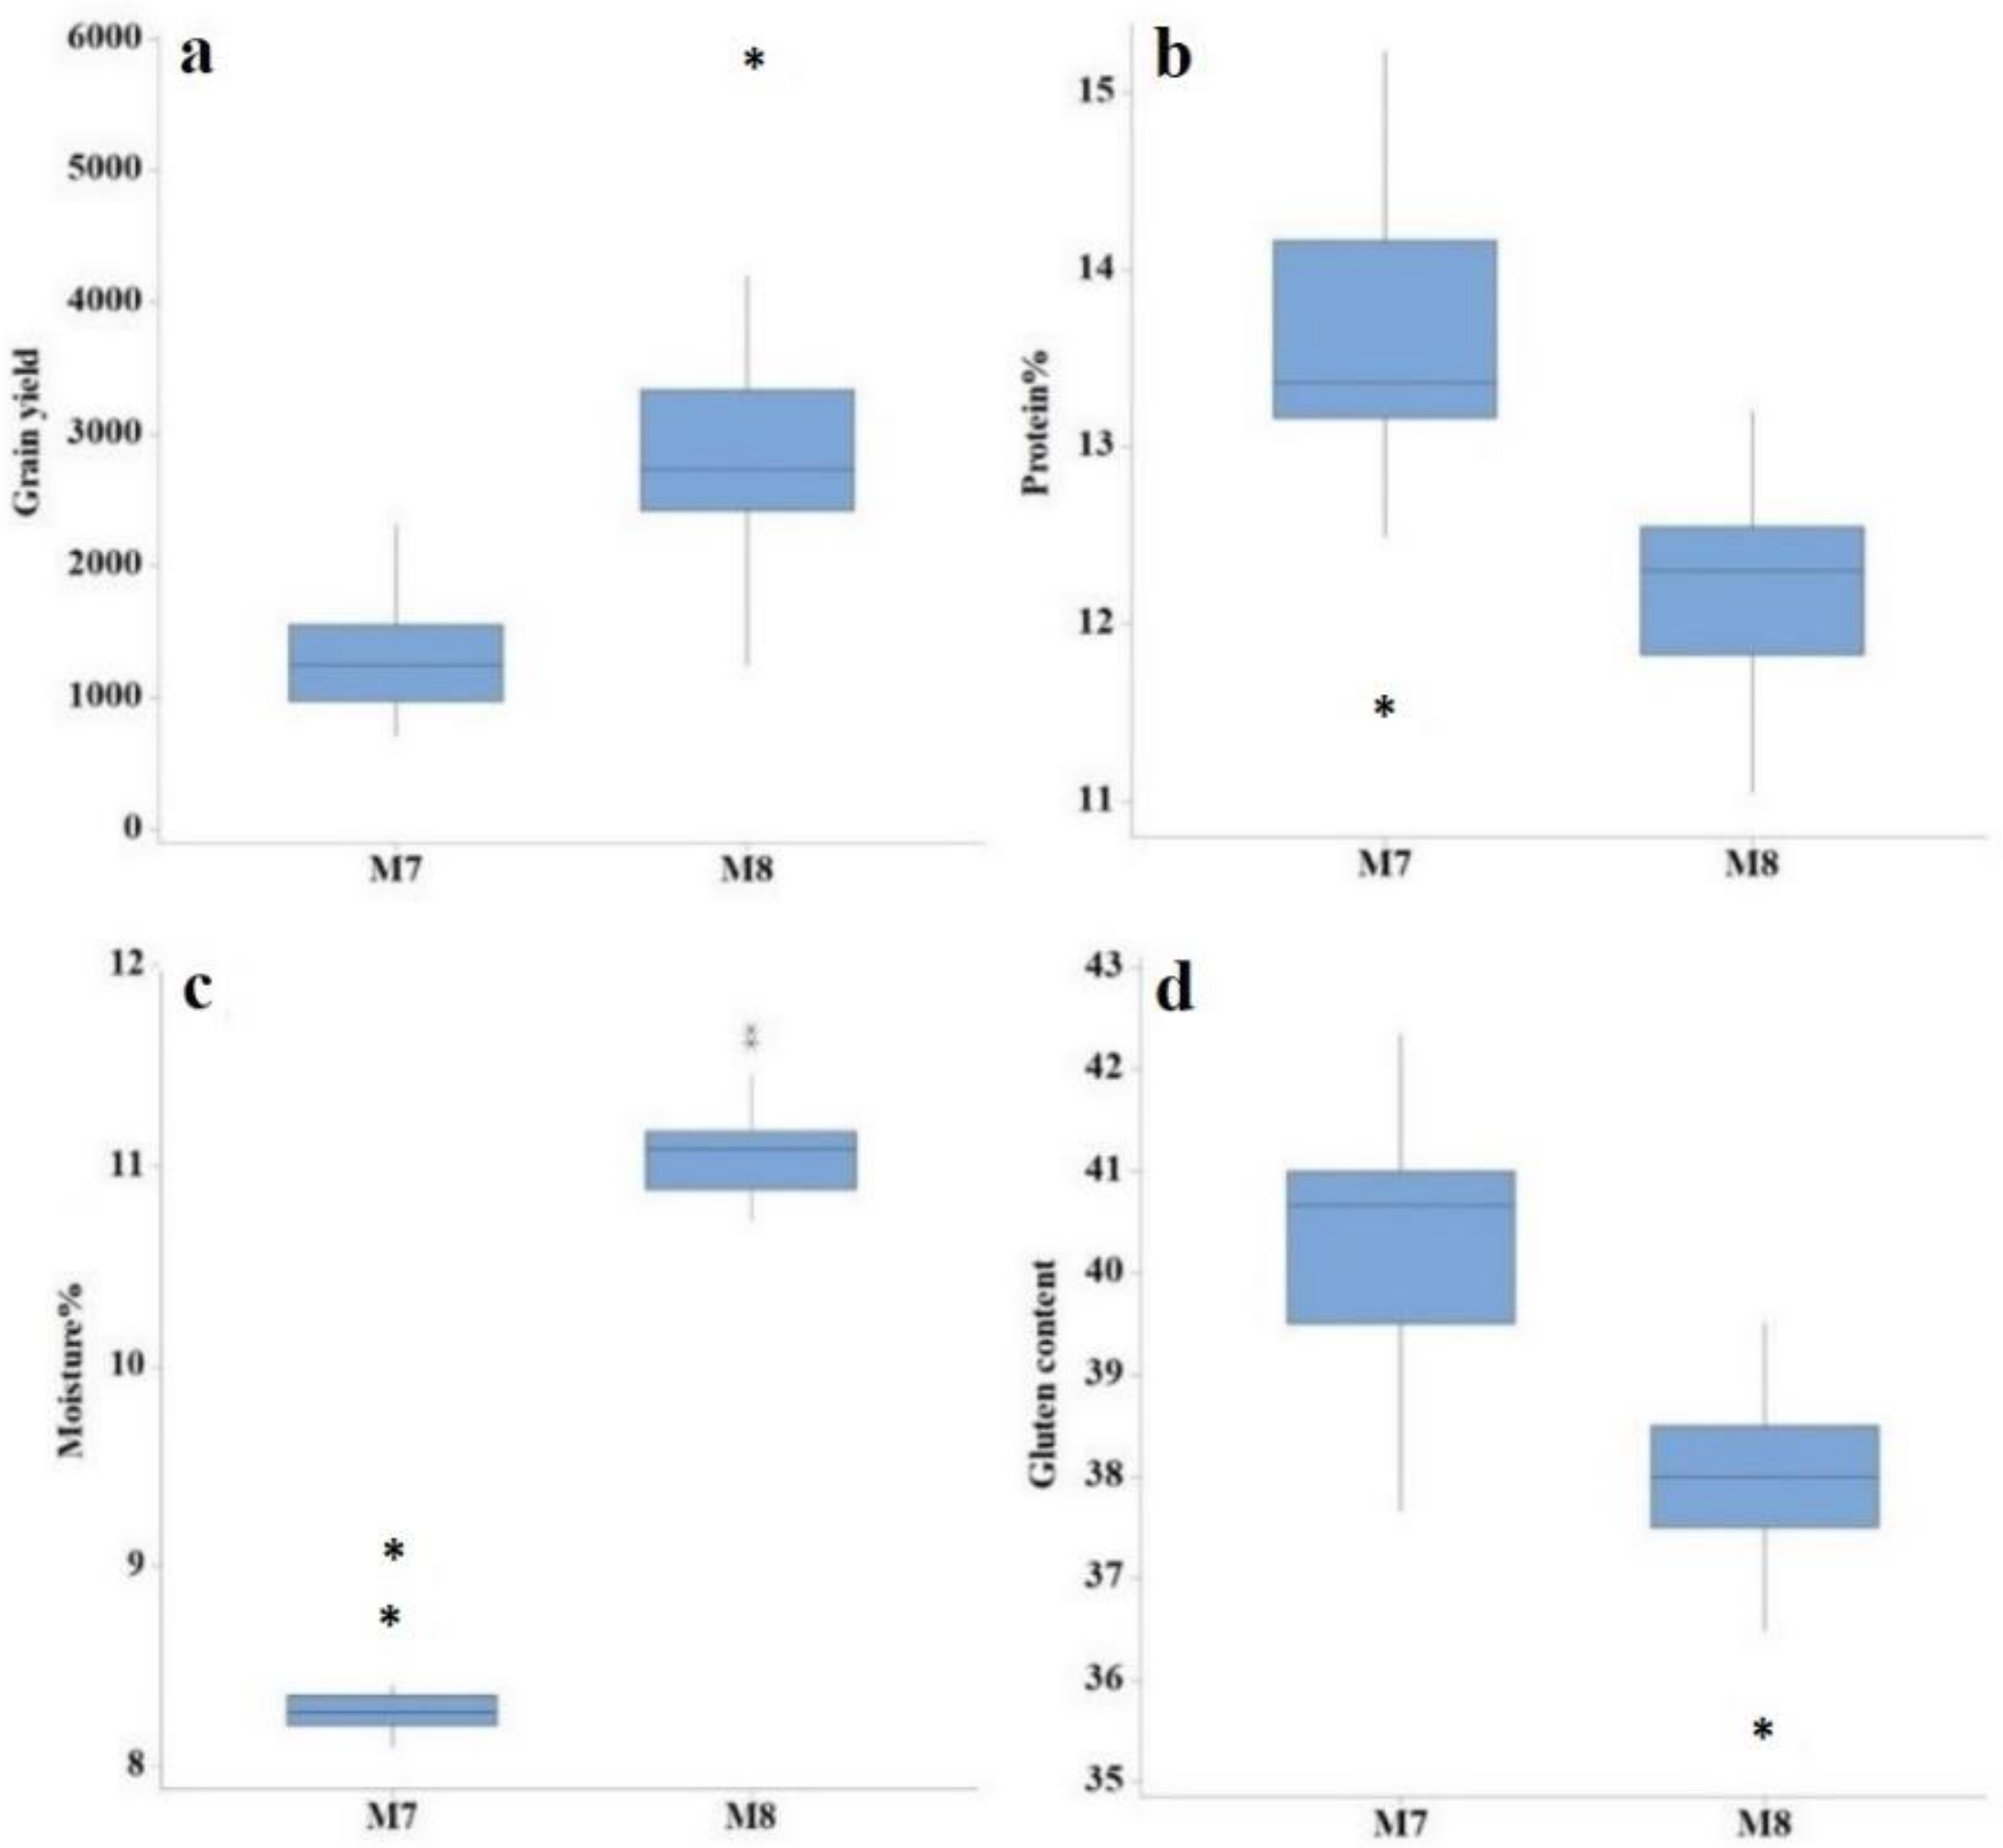
3.1. ANOVA and Descriptive Assessment

Highly significant differences were found for plant height, days to heading, and yield-related traits from the experimental fields sown at NIBGE (Table 1) and NIAB sites (Table 2) at p < 0.001. Genotypic variance declined gradually during successive generations. Furthermore, box plots also revealed variation for the studied traits in both generations (M7-M8) (Figure 1, Figure 2, Figure 3 and Figure 4).

3.2. Mean Values for Various Yield Components, Grain Yield, and Quality Traits

Significant variation was recorded among all mutant lines and the wild type for yield component, total yield, and grain quality parameters. At location NIBGE, the numbers of days to heading ranged from 91 to 102 for the M7 generation, while for the M8 generation it ranged from 91 to 99 days. Plant heights varied between 73.90 and 100.64 cm for the M7 generation, however, while a wide range of 70.04 to 89.52 cm was observed in M8. Spike lengths ranged from 10.10 to 14.62 cm in the M7 generation. Similar variation patterns were also obtained regarding other yield related parameters in both generations. Regarding grain quality traits, protein percentages varied between 10.65 and 14.35% in M7. Considerable amounts of variation were also recorded for moisture and gluten content (Table 3); hence, the studied mutant lines expressed genetic variation for all traits under study. These mutant lines could be explored in future wheat breeding programs.
At the NIAB location, the numbers of days to heading ranged from 89 to 101 for M7, while for the M8 generation it ranged from 91 to 99 days. Plant heights varied from 83.87 to 99.74 cm for the M7 generation; however, during M8, a wider range (73.02–91.44 cm) was measured. Spike lengths ranged from 11.22 to 13.50 cm in the M7 generation (Table 4). Similar variation patterns were observed for other yield components. For grain quality traits substantial differences among all the mutants and wild type were observed for both generations (M7 and M8). In M7, the protein content percentages varied between 11.50% and 15.95%. Significant variations were also observed in moisture and gluten contents for both generations (Table 4).

3.3. Mean Evaluation of Mutant Lines across Both Locations and Generations

The mean values of all traits under study for the selected 32 mutant lines and the wild type (Punjab-11) over two growing seasons and locations are presented in Table 5. The numbers of days to heading significantly differed for all mutants, which ranged from 90.46 to 98.25. Mutant lines Pb-M-1575, Pb-M-12 waxy, Pb-M-2041, and Pb-M-1802 showed the earliest heading times, whereas Pb-M-1027 waxy, Pb-M-2550, and Pb-M-59 waxy exhibited later heading times (Table 5). As early heading is a desirable character, mutant lines depicting lesser numbers of days to reach maturity are useful candidates for breeding early-maturing varieties. The plant heights of the mutant lines differed substantially (76.37 to 91.66 cm). The tallest plants belonged to Pb-M-1575, Pb-M-1064, and Pb-M-2041 lines, while the shortest plants were recorded for Pb-M-12 waxy, Pb-M-119 waxy, and Pb-M-2719 lines. The mean numbers of spikelets per spike were significantly different among the mutant lines and varied between 17.50 and 20.00. Furthermore, the 1000-grain weights were significantly different among the mutant lines, ranging from 17.60 to 28.42 g. The heaviest grain index values were observed for Pb-M-1027 waxy, Pb-M-59 waxy, Pb-M-1854, and Pb-M-1272 waxy, while the lightest grain index values were recorded for Pb-M-2728, Pb-M-12 waxy, and Pb-M-605. Correspondingly, substantial variations were observed for grain yields among the mutant lines, ranging from 1648.42 to 3269. 98 kg/ha. These mutant lines exhibited fluctuations in yield, i.e., Pb-M-59 waxy, Pb-M-1272 waxy, Pb-M-2260 produced the maximum grain yield, while Pb-M-12 waxy, Pb-M-2728, and Pb-M-1743 showed the lowest values. We observed significant differences for grain quality traits among all mutant lines. Protein contents varied from 12.19 to 13.68%, moisture contents ranged between 8.73 and 9.43%, while gluten contents ranged from 37.67 to 40.96 (Table 5). The mean values for all traits differed from the values for the wild type; however, the maximum fluctuation was found for the relative reductions in grain yield (34.36% for Pb-M-59 waxy and −29.25% for Pb-M-12 waxy), followed by TGW. The mean values for the mutants for gluten and moisture contents showed reductions compared to those for the wild type, except for two mutants (Table S1).

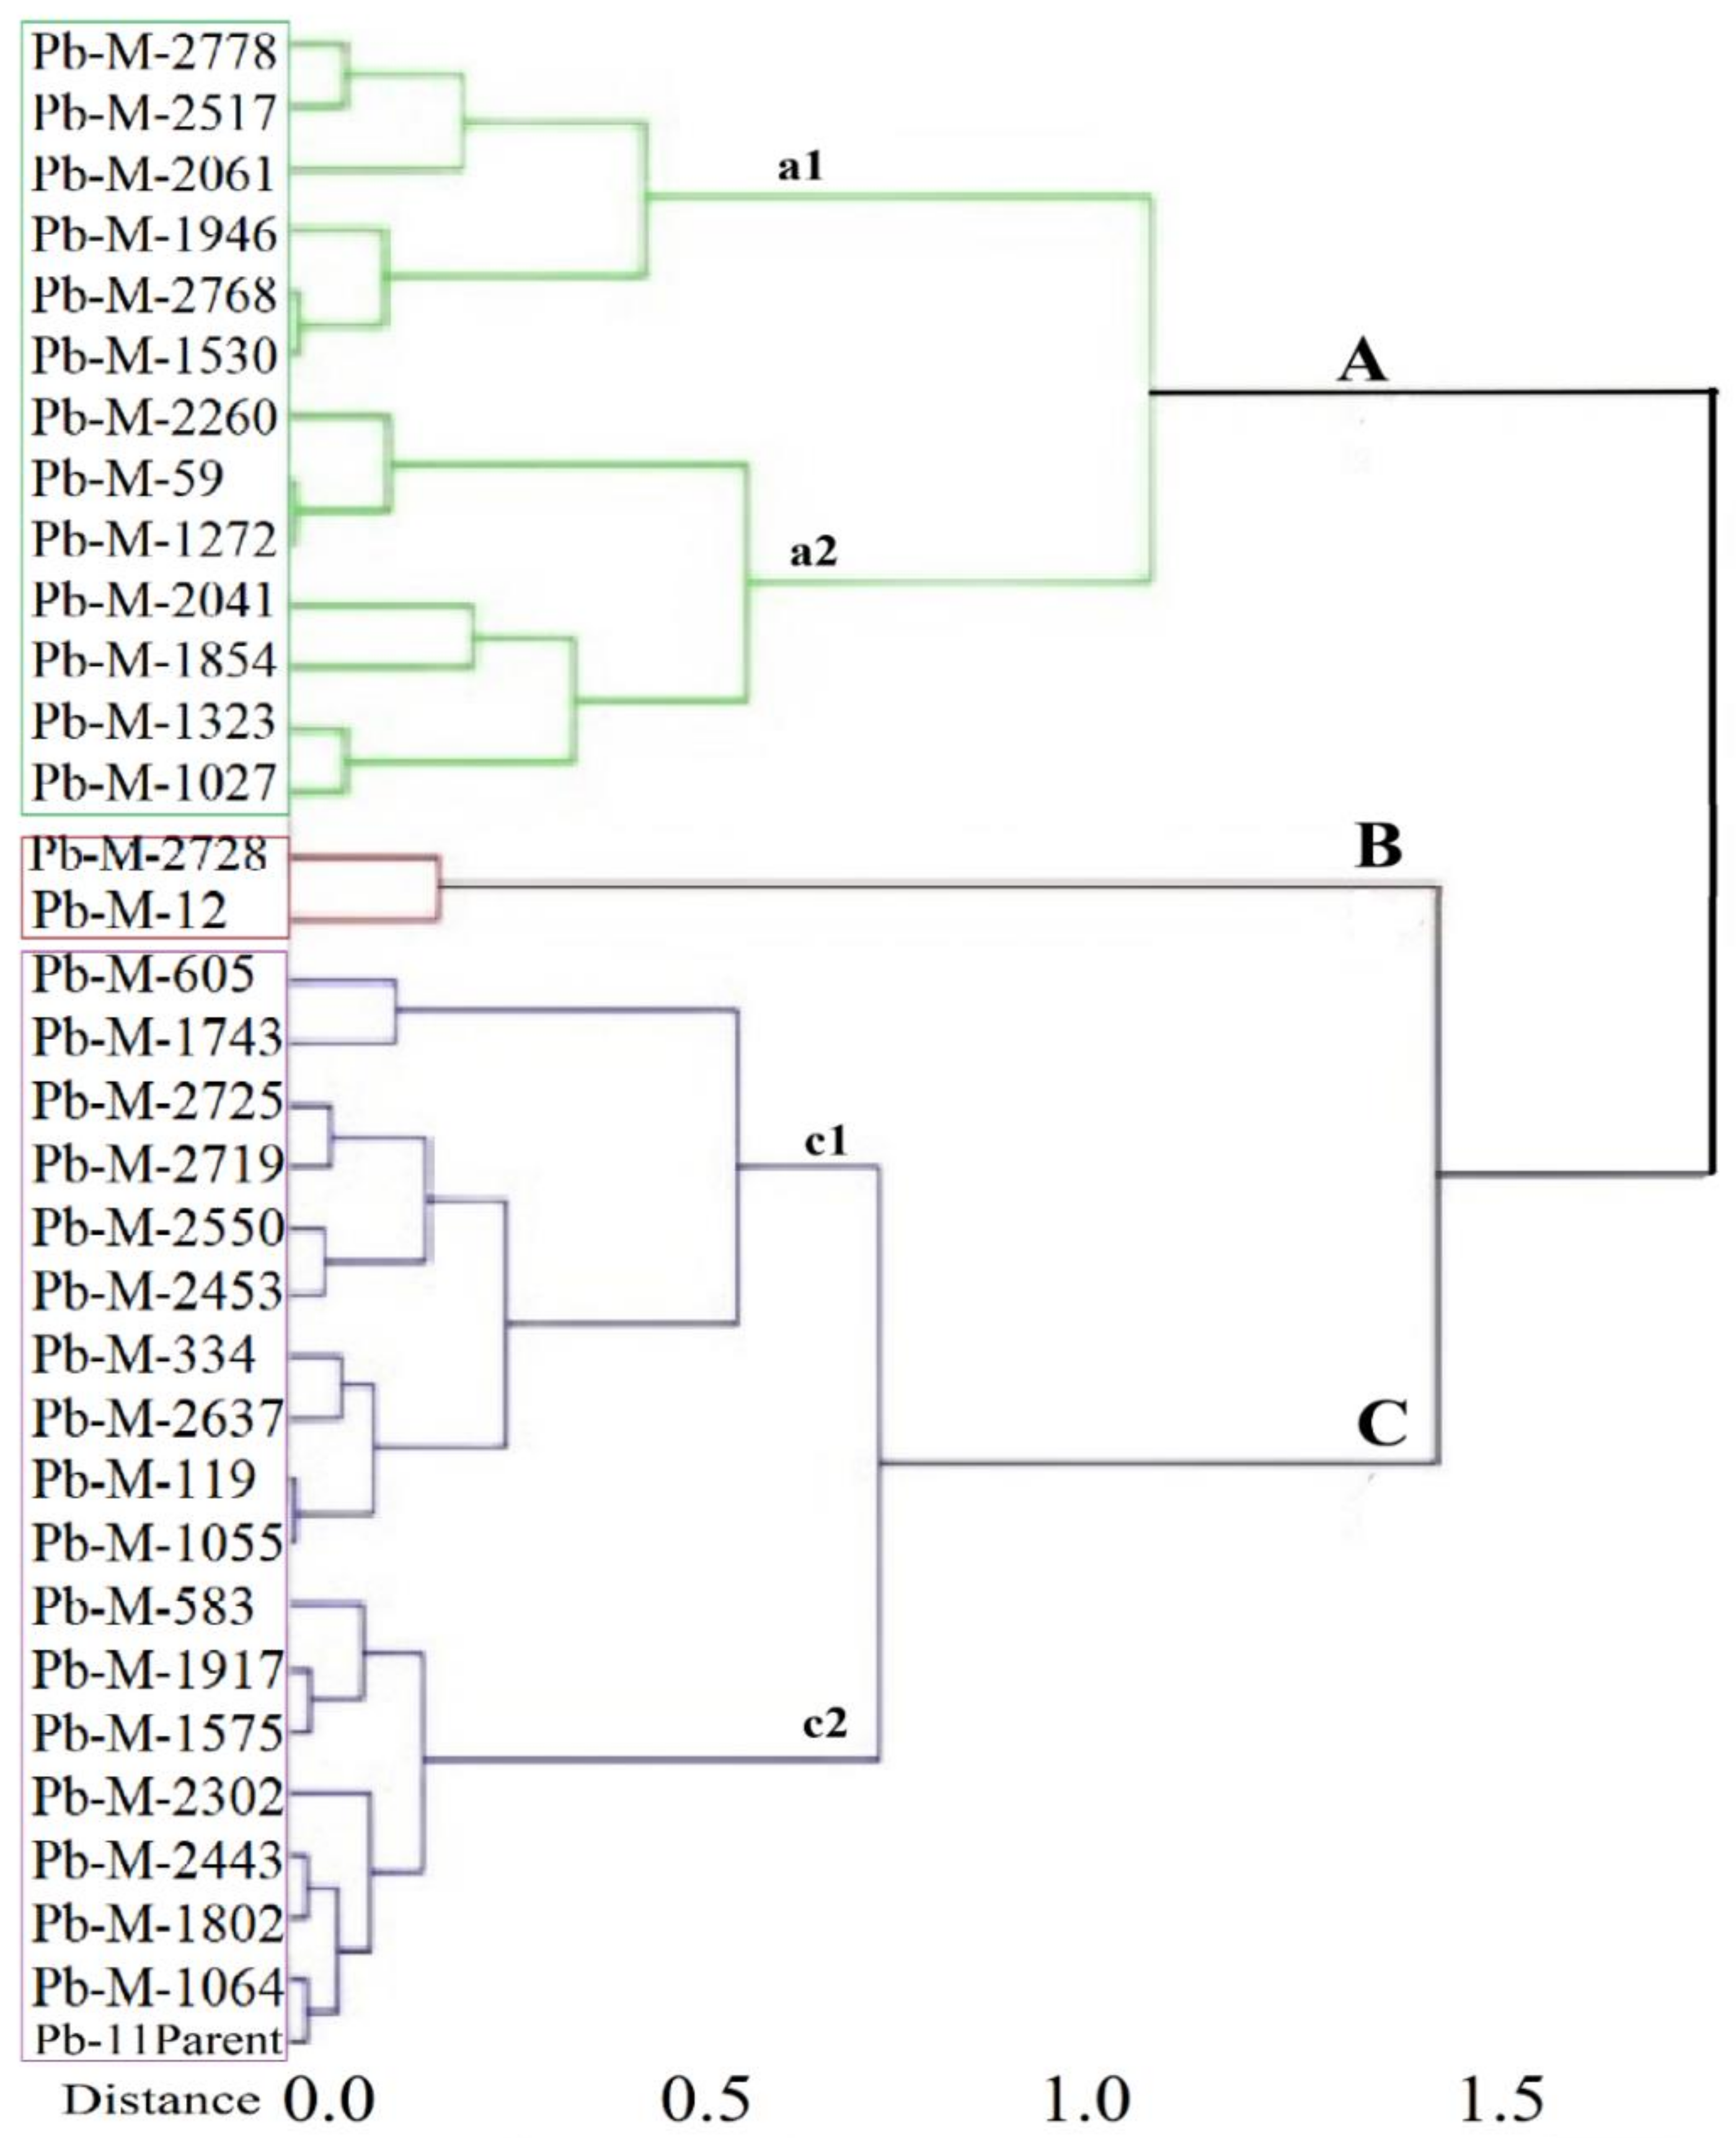
3.4. Cluster Analysis Based upon Yield Index

The yield index values for 32 mutant lines and the wild type were computed to classify the evaluated mutant lines according to their yield potential. The mutant lines were clustered into three groups using hierarchical clustering. Group “A” comprised two mutant lines with the lowest grain yields, while group “B” contained 18 mutant lines with high grain yield values; however, group “C” consisted of 13 mutant lines that had the highest grain yield values (Figure 5). Different colors represent different clusters in Figure 5.

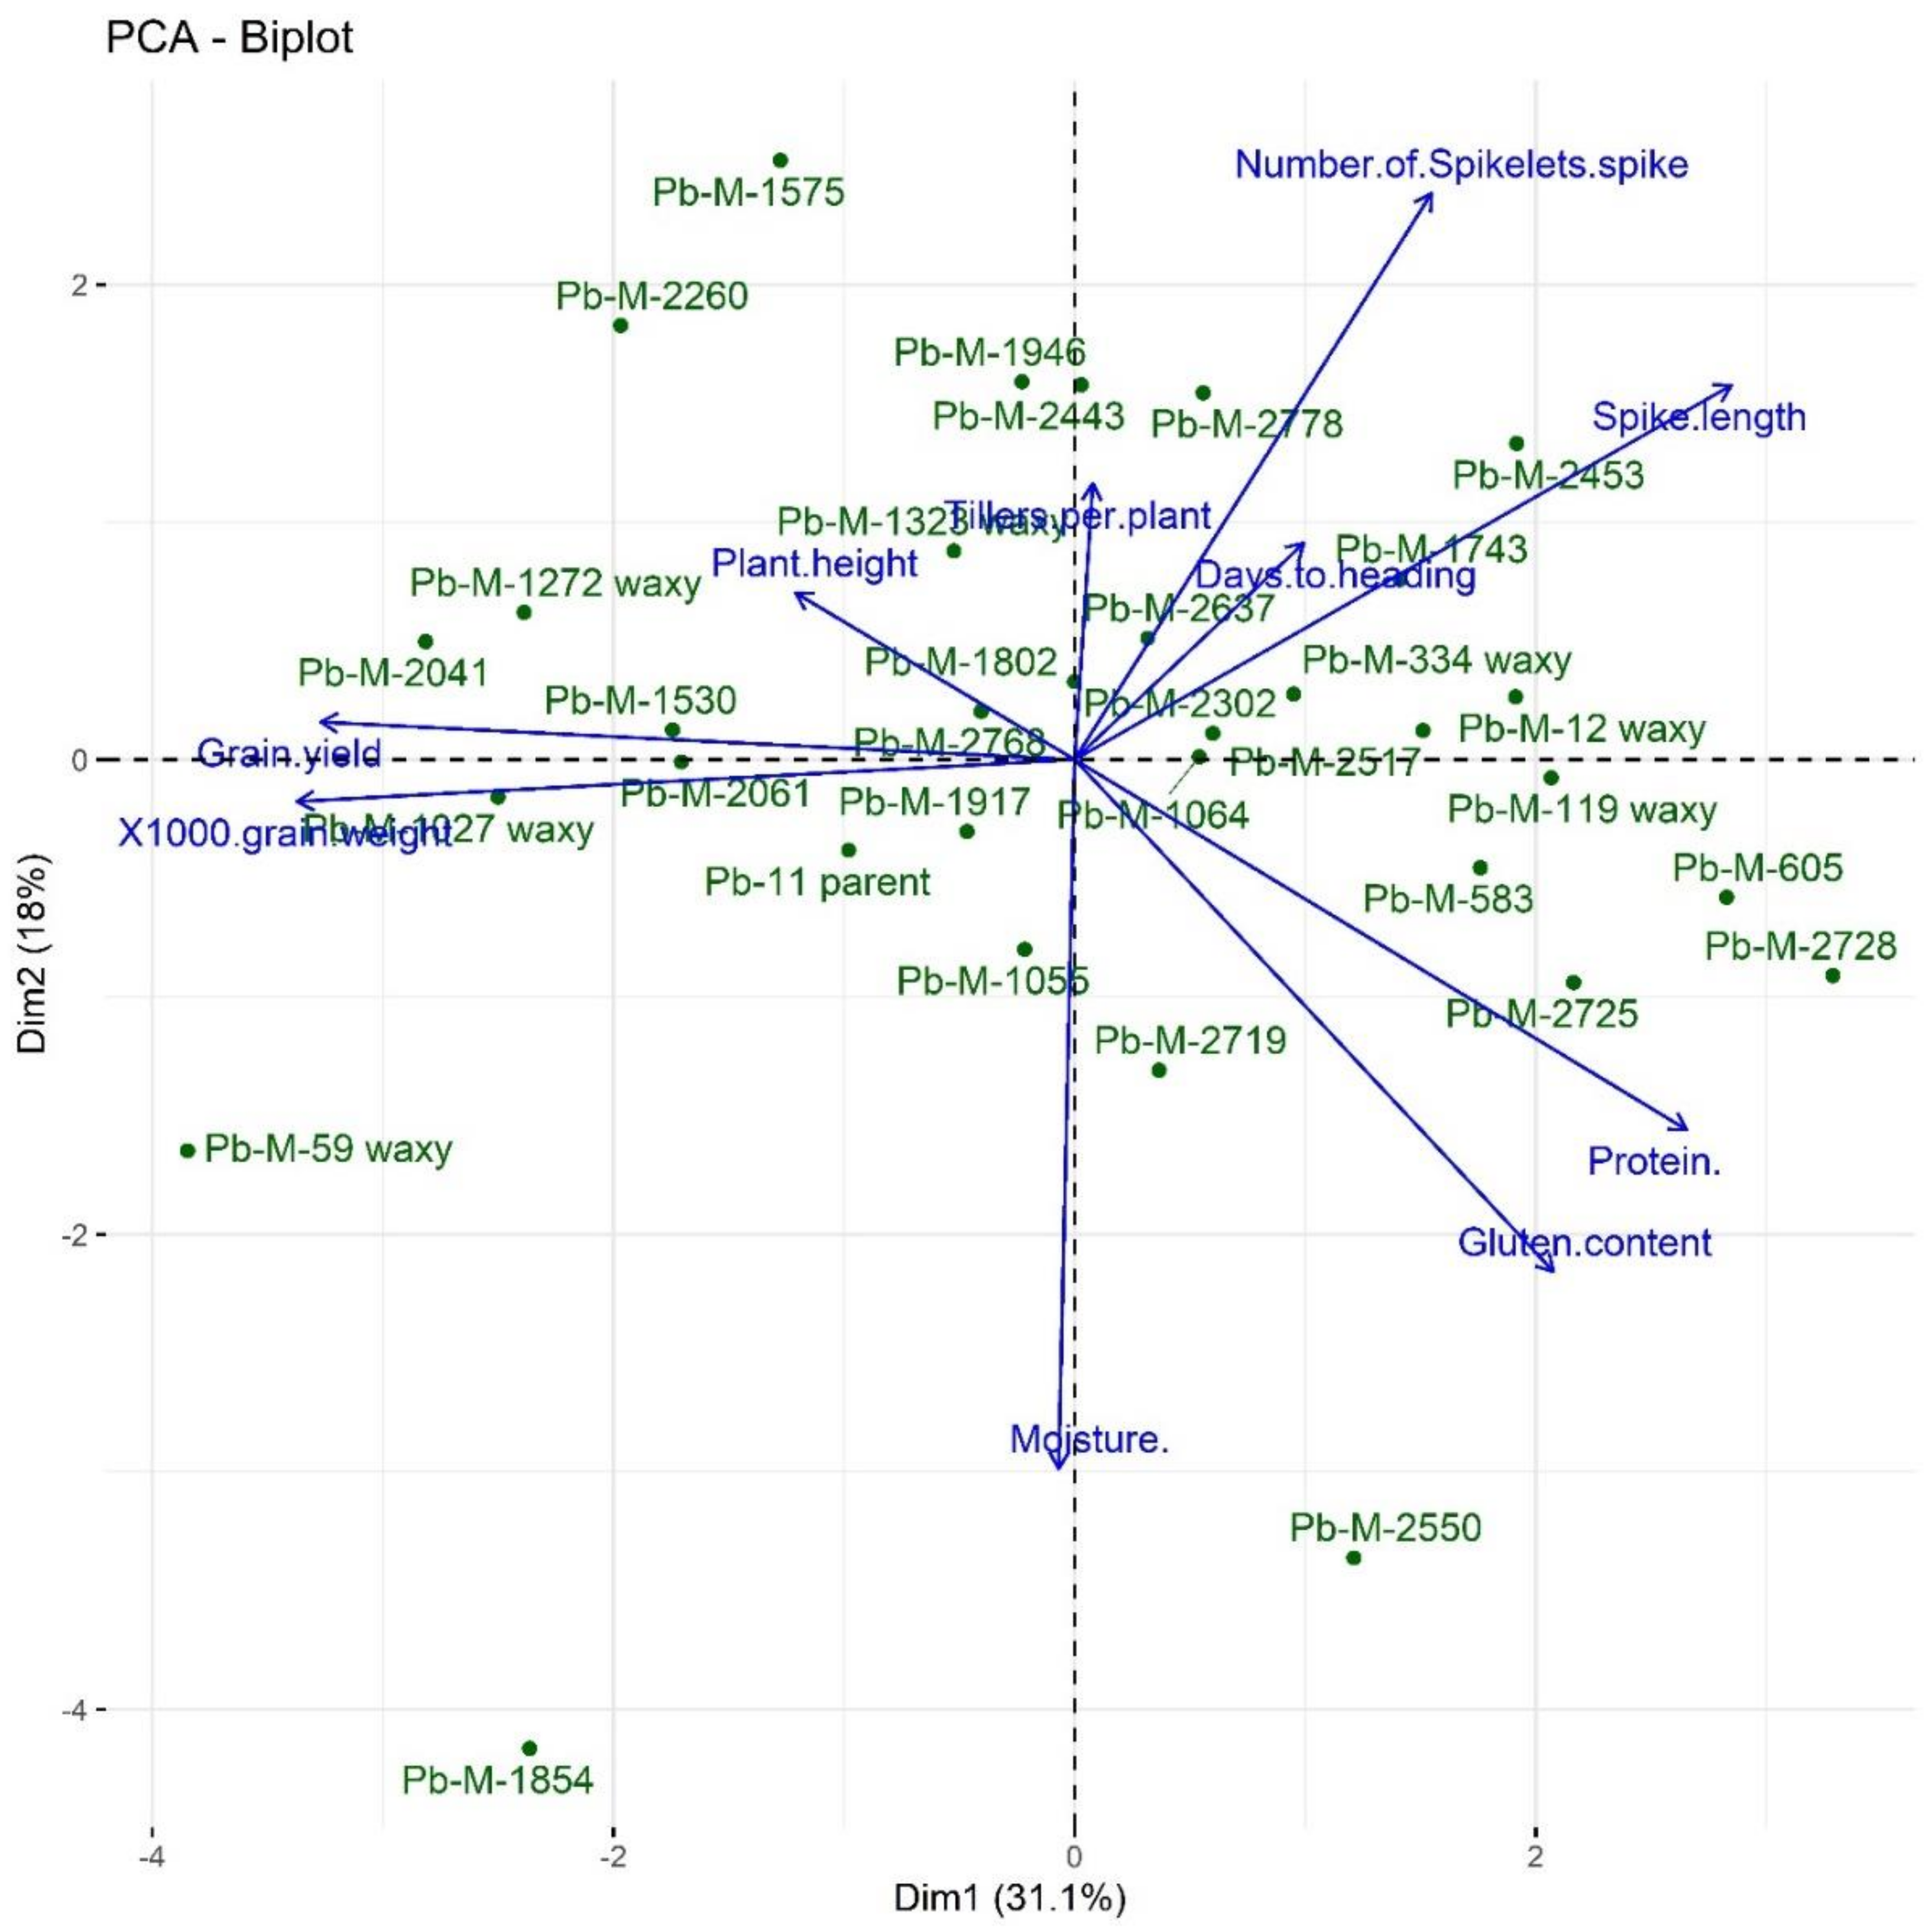
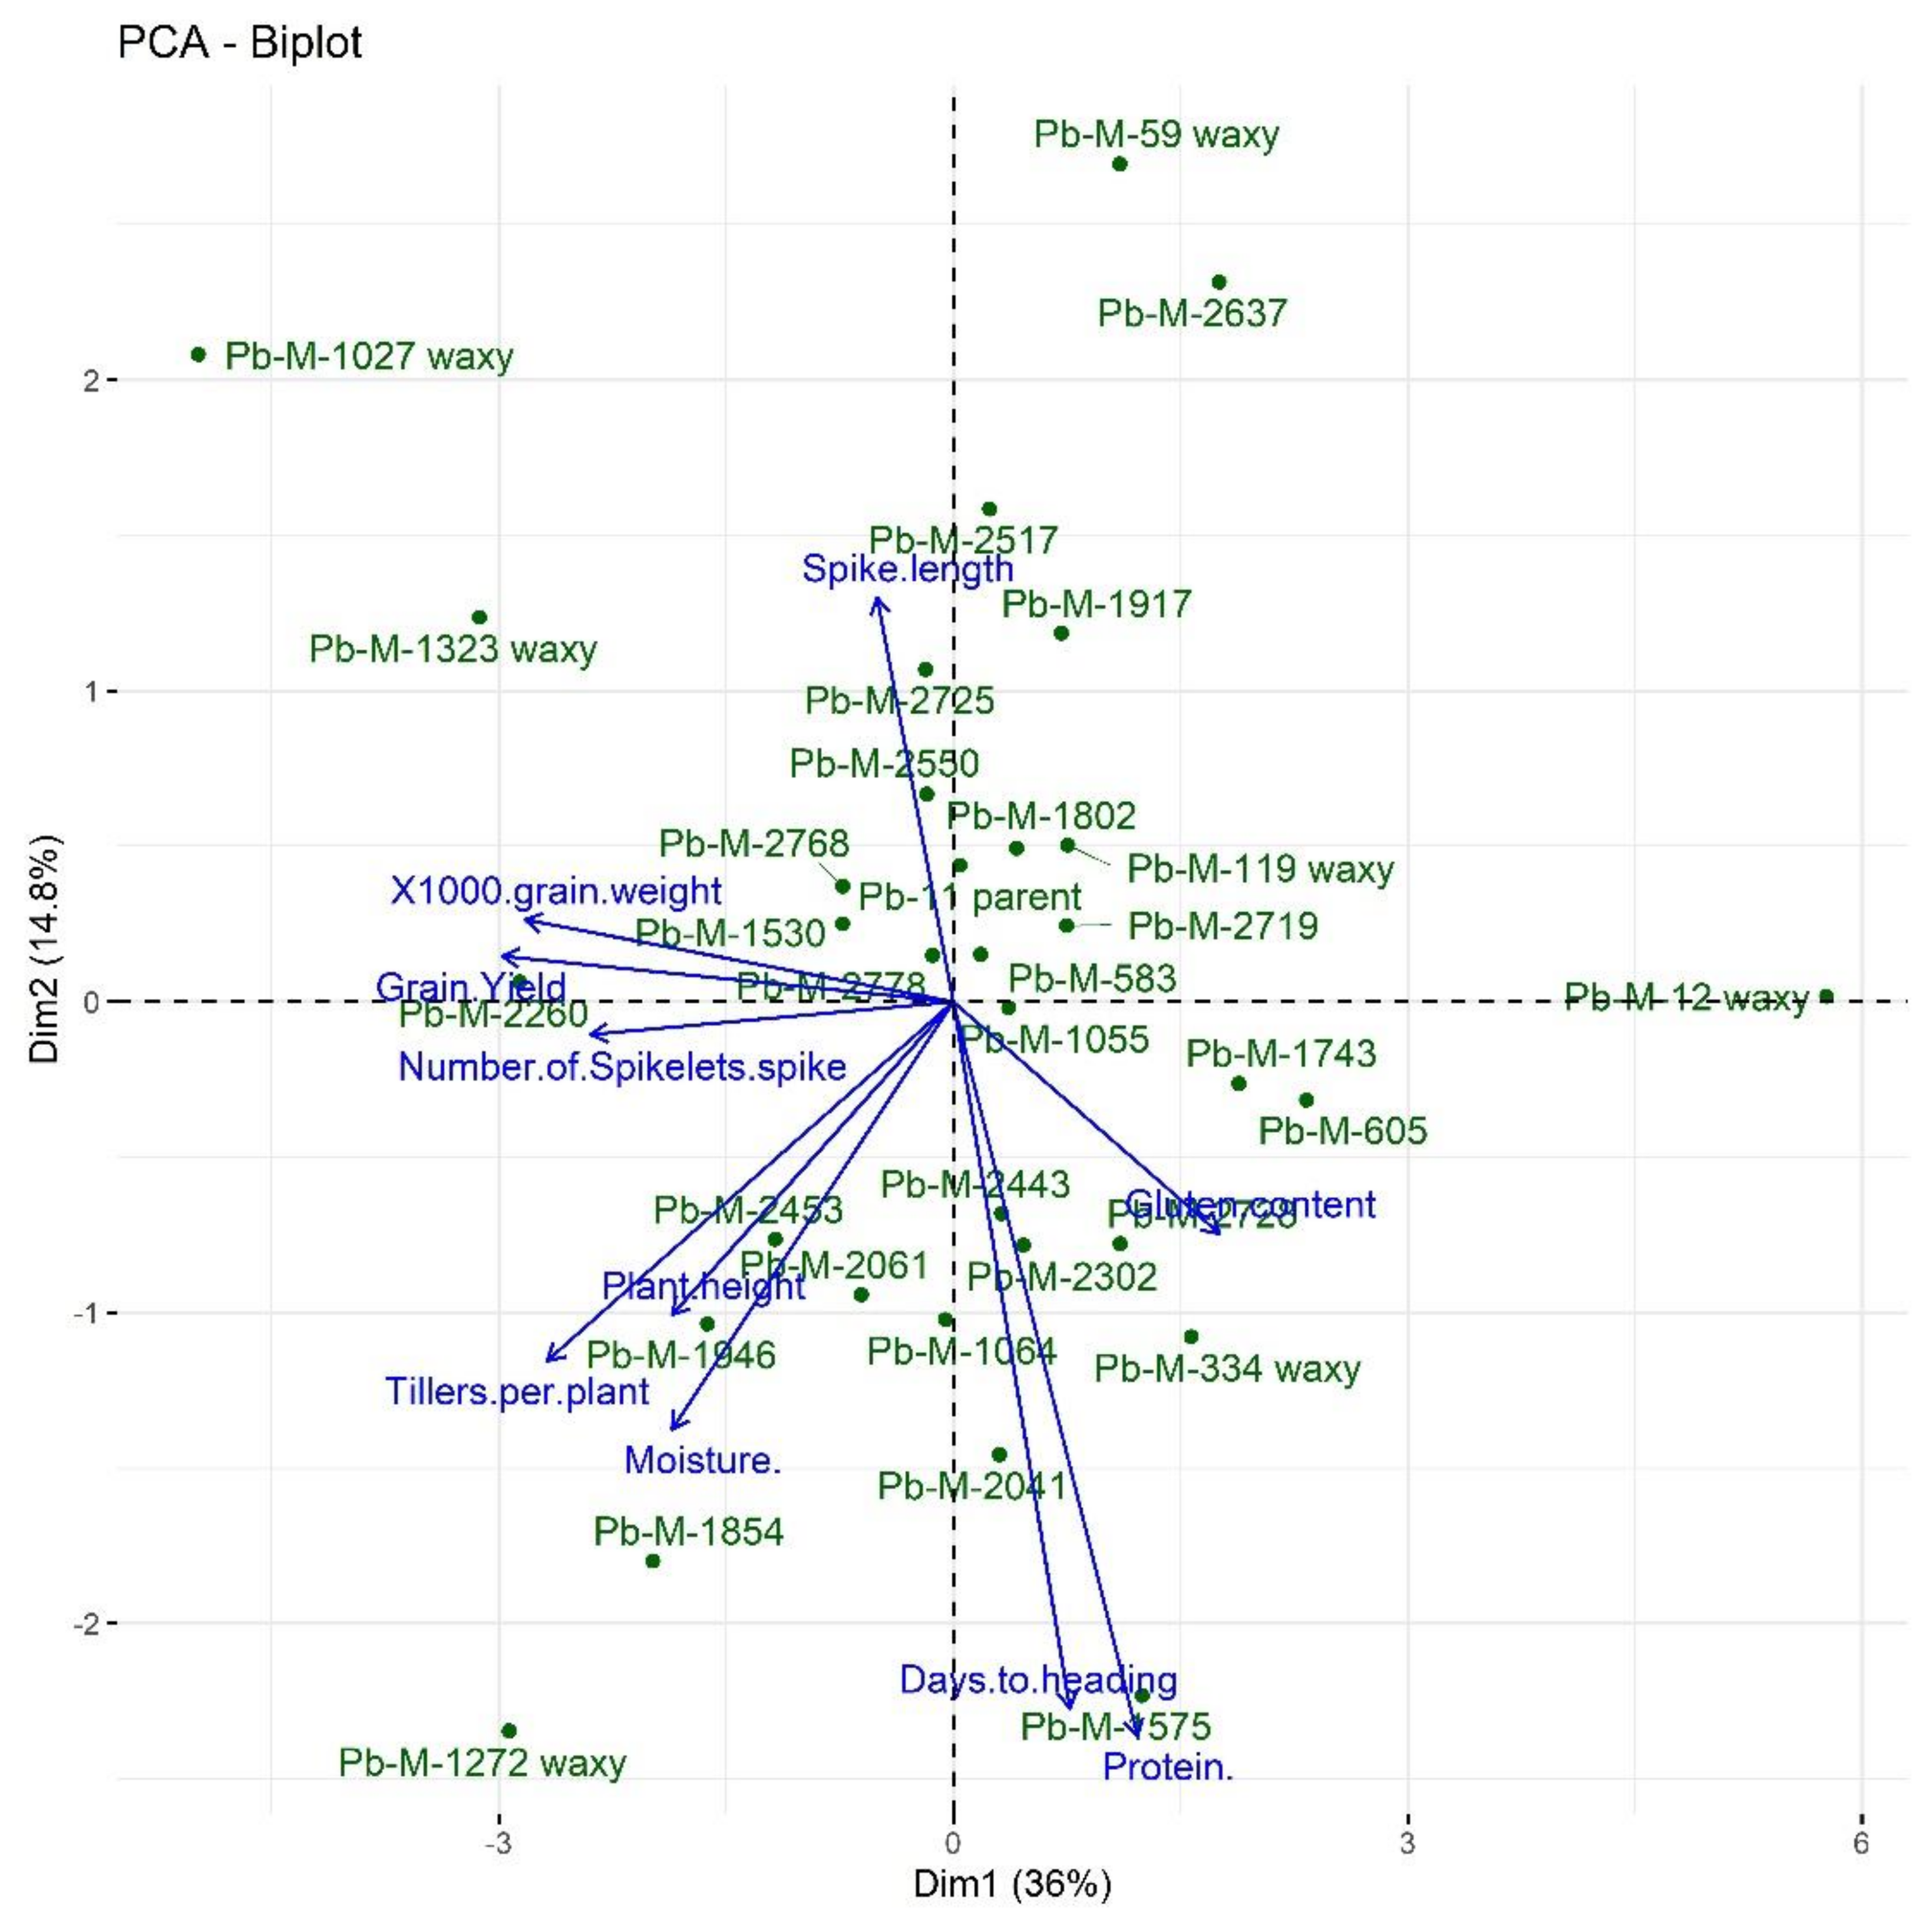
3.5. Principal Component Analysis (PCA)

In the present study, PCA was used to categorize the traits into six main principal components (PCs). For all morphological and quality traits, 90.28% variation was contributed by the first six components showing Eigen values greater than 0.5. The first PC accounted for 35.99%, the second PC for 18.36%, the third PC for 12.50%, and the fourth PC for approximately 8.84% of the total variation (Table 6). Furthermore, the rotation component matrix revealed that each PC contained different combinations of morphological and quality traits. The first PC showed linkages between grain quality (protein, moisture, and gluten contents) and yield components, including plant height, tillers per plant, 1000-grain weight, and grain yield; thus, PC1 allowed the simultaneous selection of morphological and quality traits. Similarly, the second PC exhibited positive effects in terms of the spike length, number of spikelets per spike, number of tillers per plant, and plant height. The third PC explained the moisture content, number of days to produce heads, and number of spikelets per spike (Table 7).

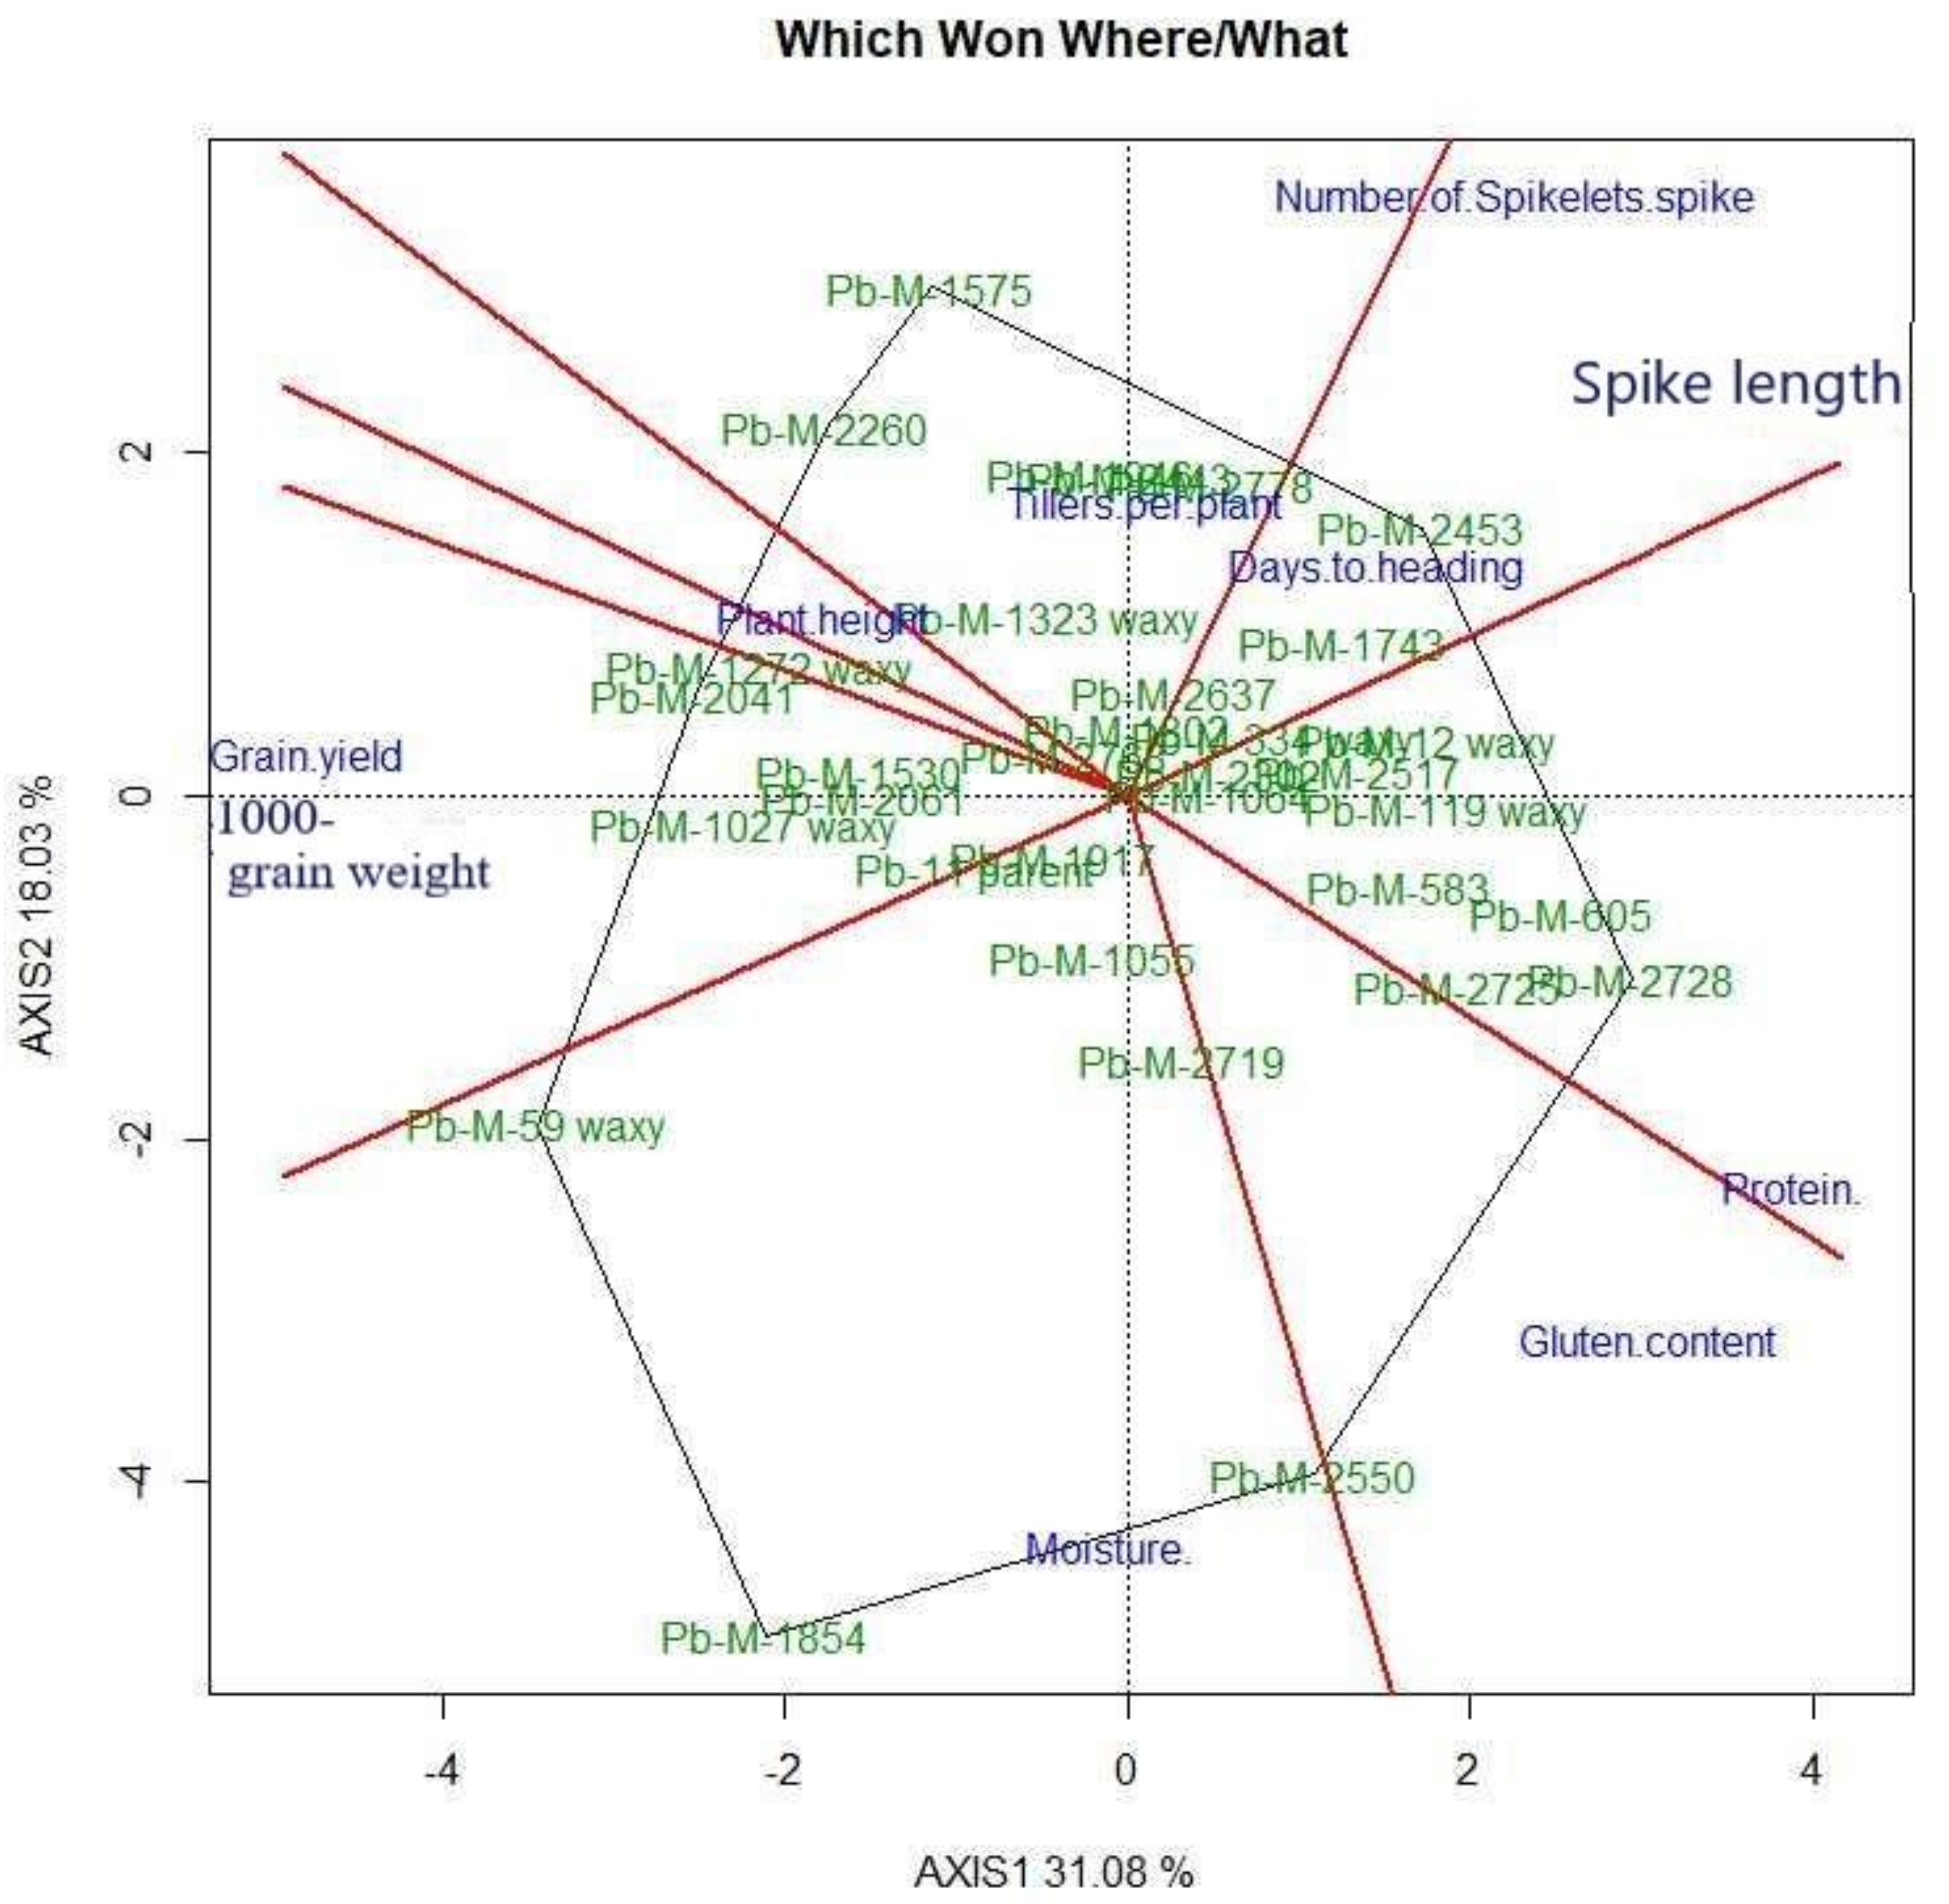
3.6. Genotype by Trait (GT) Bi-Plot Analysis

3.6.1. Interrelation among Different Traits

The GT data presented in Tables S2 and S3 show trait means for each of the 32 mutant lines plus the wild type screened across two locations for the period 2018–2020. The GT bi-plot based on trait-standardized data shows that the cosine of the angles between morphological trait vectors estimates the degree of correlation between them; hence, the angles < 90° (acute angles) show positive association, the angles > 90° depict the negative correlations, and exact angles of 90° indicate the absence of correlation between traits [60].
The GT bi-plot of the mean performance of all the mutant lines explained 49.1% of the total variation for the NIAB location (Figure 6). Based on the relationships between traits, different groups for the traits under study were identified, with different responses in terms of discriminating the mutant lines. Across the 32 mutant lines plus the wild type, plant height, 1000-grain weight, and grain yield values were positively associated (acute angles); however, these traits were negatively correlated with grain quality parameters such as protein, moisture, and gluten contents (obtuse angles); and were independent of the numbers of tillers per plant (near right angles). These relationships suggest that it is possible to combine higher yield, plant height, 1000-grain weight, and tillers per plant in a single mutant line (Figure 6).
The mutant line Pb-M-59 waxy produced the maximum grain yield and kernel weight; however, it exhibited a lower gluten content and protein percentage. As such, it is an ideal mutant line for incorporating high yield potential and protein contents. It is also indicated in Figure 6 that Pb-M-1854 combined all favorable traits, as it had a high grain yield and 1000-grain weight, as well as good protein content, moisture, and gluten content levels. Other mutant lines such as Pb-M-2778, Pb-M-2453, Pb-M-1743, Pb-M-334 waxy, Pb-M-2637, and Pb-M-2302 were located opposite to the origin of Pb-M-59 waxy and Pb-M-1854 relative to the bi-plot origin because their trait profiles were opposite. They had the highest numbers of spikelets per spike, spike lengths, days to heading, and intermediate numbers of tillers per plant. These mutant lines might be good candidates for studying the genetic determination of spike length and number of spikelets per spike in bread wheat. For grain quality parameters, Pb-M-2725, Pb-M-2550, Pb-M-2728, and Pb-M-2719 might be good mutant lines for studying the genetic basis of gluten, moisture, and protein content in mutant wheat population. In addition, many other relationships can be inferred (Figure 6), for example Pb-M-1272 waxy, Pb-M-2041, Pb-M-2260, Pb-M-1575, Pb-M-1530, and Pb-M-1323 waxy constituted a group of mutant lines sharing the same trait profiles, while Pb-M-2061, Pb-M-1027 waxy, and Pb-M-1917 formed another group. It would be logical to guess that the mutant lines within each group might harbor the same or similar alleles for the respective traits. Finally, it can be concluded that higher yield is negatively correlated with grain quality parameters.
For location NIBGE, the GT bi-plot of the mean performance of all the mutant lines explained 50.8% of the total variation. Across the 32 mutant lines and the wild type, 1000-grain weight, plant height, and grain yield values were positively associated, as an acute angle was present between these traits. These three traits were negatively correlated with other traits such as protein content, gluten content, and days to heading (obtuse angles), and they were independent of the number of spikelets per spike (near right angles) (Figure 7). Total grain yield was also positively correlated with plant height, number of tillers per plant, and the number of spikelets per spike. Additionally, number of spikelets per spike, plant height, number of tillers per plant, and moisture content were positively correlated; however, spike length was negatively correlated with gluten content, protein content, and number of days to heading (an obtuse angle) (Figure 7). These relationships suggest that it is possible to combine higher yield, plant height, 1000-kernal weight, and tillers per plant in a single wheat mutant line.
The mutant lines Pb-M-1323 waxy and Pb-M-1027 waxy exhibited the highest grain yields and 1000-grain weights, lower gluten and protein contents, and required lower numbers of days to reach maturity. Additionally, it is also evident that Pb-M-2453 accumulated all favorable traits, as it had a high yield and 1000-grain weight, as well as good protein, moisture, and gluten content levels (Figure 7). Other mutant lines such as Pb-M-2260, Pb-M-2453, Pb-M-2061, Pb-M-1946, Pb-M-1854, and Pb-M-1272 waxy showed the highest plant heights, numbers of tillers per plant, numbers of spikelets per spike, and moisture content levels. These observations suggest that mutant lines are useful for the genetic determination of yield-dependent attributes in wheat mutant populations. For grain quality parameters, mutant lines Pb-M-1575 and Pb-M-2728 could be explored to study the genetic basis of grain quality traits in bread wheat. All of the mutant lines showed varying degrees of association with multiple traits separately. For instance, Pb-M-2041, Pb-M-1575, Pb-M-334 waxy, Pb-M-2302, and Pb-M-2728 constituted a group of mutant lines with similar trait profiles, while Pb-M-1027 waxy, Pb-M-1323 waxy, and Pb-M-2768 constituted a different group of mutant lines sharing the same trait profiles (Figure 7). As demonstrated in the NIAB site experiment, grain yield and quality (protein and gluten contents) were also found to be negatively correlated at the NIBGE site, confirming the existence of a negative correlation between both traits.

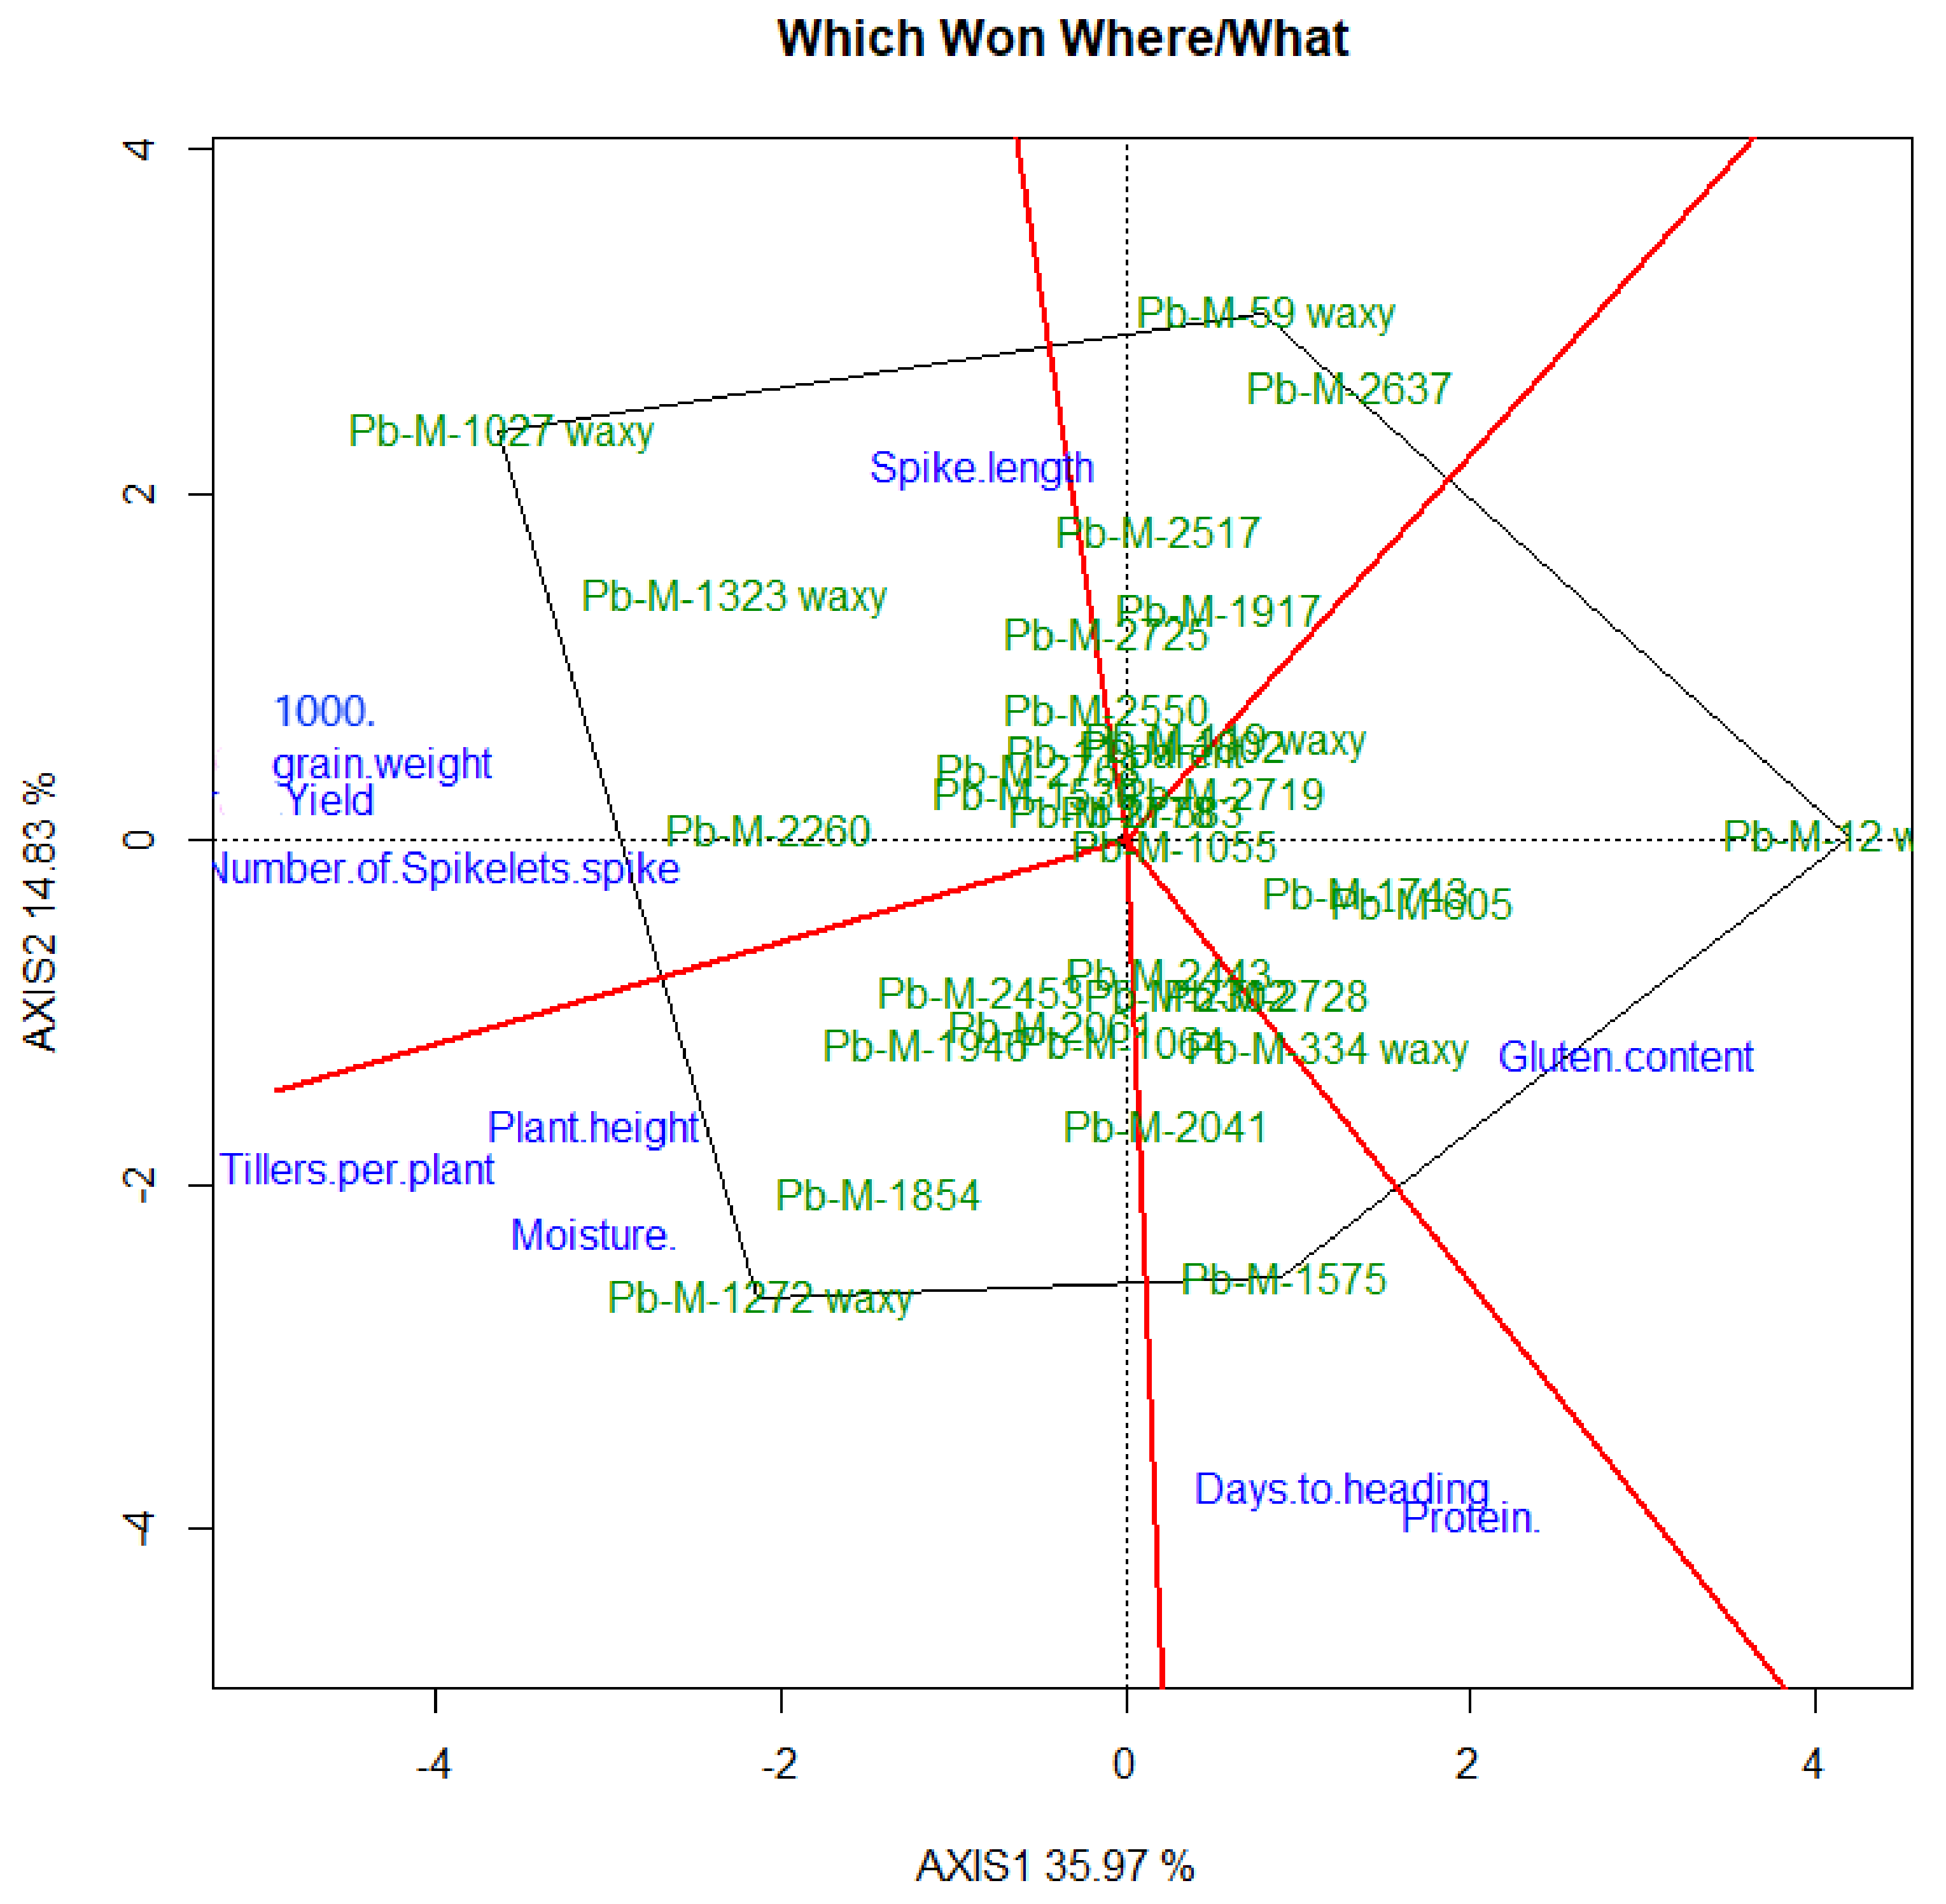
3.6.2. Genotype by Trait Profiles

The polygon view of the bi-plot helps in the identification and selection of mutant lines having the highest values for one or multiple traits. The mutant lines present at the vertex can be characterized for particular traits, while genotypes close to the bi-plot origin can be evaluated for a wide range of traits. Based on the trait associations, different groups of traits with different responses formed the basis of the mutant line discrimination. The vertex mutant lines in this investigation were Pb-M-59 waxy, Pb-M-1854, Pb-M-2550, Pb-M-2728, Pb-M-2453, and Pb-M-1575 (Figure 8). The vertex mutant lines were the most genetically diverse for some or all traits owing to having the longest distance from the origin of the bi-plot. Total grain yield and 1000-grain weight values fell in the Pb-M-59 waxy sector (Figure 8), suggesting that Pb-M-59 waxy had the highest or nearly the highest values for these traits. Similarly, other mutant lines such as Pb-M-1854 had high values for moisture content, Pb-M-2550 had a high gluten content, and Pb-M-2725 showed a high protein content. The bi-plot analysis did not explain all of the variation; thus, these predictions may vary for the observed numbers [61]. As illustrated in Figure 8, Pb-M-59 waxy had a vector length higher than the remaining mutant lines, showing the maximum values in terms of grain yield, 1000-grain weight, and good protein content; therefore, it is a suitable mutant line for improving the yield and quality of wheat. In addition, mutant lines having higher vector lengths, such as Pb-M-2041, Pb-M-1272 waxy, and Pb-M-1027 waxy, also presented high values for grain yield and 1000-grain weight. Likewise, the maximum numbers of spikelets per spike and spike lengths were recorded for Pb-M-2778, Pb-M-1743, and Pb-M-2453.
Regarding the polygon plot of the NIBGE location, the vertex mutant lines were Pb-M-59 waxy, Pb-M-12 waxy, Pb-M-1027 waxy, Pb-M-1575, and Pb-M-1272 waxy (Figure 9). The grain yield and 1000-grain weight traits fell in the Pb-M-1027 waxy sector, suggesting that Pb-M-1027 waxy had the highest or nearly the highest values for these traits. Likewise, Pb-M-1272 waxy showed the highest values in terms of plant height, tillers per plant, and moisture content. Pb-M-1575 showed high values in terms of protein content and days to heading, while Pb-M-12 waxy showed high gluten content. As illustrated in Figure 9, Pb-M-1027 waxy had the longest vector length, followed by Pb-M-12 waxy and Pb-M-59 waxy. Likewise, the highest values in terms of plant height, moisture content %, and tillers per plant were obtained for Pb-M-1272 waxy, Pb-M-1946, and Pb-M-1854 (Figure 9).

4. Discussion

The characterization and screening of bread wheat cultivars based on variations in agro-morphological traits are fundamental objectives in wheat breeding programs for the development of high-yielding wheat varieties [62]. The current study evaluated the potential of gamma-irradiated wheat mutant lines in terms of inducing morpho-quality traits, as well as their associations with yield.

4.1. Morphological Traits

Studying the variations in various morphological traits is important for characterizing diverse wheat genetic recourses, and these variations can be exploited in wheat breeding programs. Analysis of variance and other related genetical tools can help in designing suitable breeding criteria, which together can make a crop improvement program effective [63]. The evaluated mutant lines expressed substantial variations in plant height, spike length, and 1000-kernel weight for two consecutive years (Table 1 and Table 2, Figure 1 and Figure 2). The variations in morphological traits showed that the newly developed mutant lines can be used to develop genetically diverse and improved wheat varieties. For instance, a wide range of variations in yield-related traits was recorded. Such commonalities in terms of inducing mutations in complex traits controlling yield through physical mutagens have been reported [64,65,66,67,68], which are consistent with our observations. Similarly, highly significant levels of divergence for different morpho-quality traits among wheat cultivars were also reported in earlier studies [69,70,71,72,73], suggesting that the evaluation of mutant lines based on morpho-quality traits is a suitable criterion, as proven in the present study.

4.2. Multivariate Analysis

In the present study, 32 mutant lines and a wild type were grouped into three clusters based on the yield index (Figure 5). No duplicates were identified for grain yield among the mutant lines, elucidating the occurrence of genetic diversity in terms of grain yield. In accordance with the current findings, diversity among wheat genotypes was estimated using cluster analysis [74,75,76,77,78]. The grain yield is a very complicated trait, and continuous efforts are ongoing around the world in terms of identifying various mechanisms conferring different yield components. The present study provides a basis for breeders and geneticists seeking to add these mutants to their genetic resource bin, which will complement future studies aiming to unravel the secrets of the corresponding traits.
The present study also highlighted the degrees of association and dependence among grain yield, yield component, and quality parameters for the mutant lines. In the PCA, six major components were extracted for all traits; however, the first three components with Eigen values > 1 accounted for 66.84% of the total variability. Morphological traits, e.g., plant height, days to heading, tillers per plant, number of spikelets per spike, and grain yield, exhibited the maximum loading values contributing positively towards the entire variation. Our findings are in accordance with some earlier studies demonstrating that certain agronomic traits such as days to heading and maturity, plant height, and 1000-grain weight were strong correlated with grain yield [79]. It is suggested that the extent of genetic variation induced through mutations follows the same pattern of associations among the traits, as was reported for the recombinant breeding wheat populations. In the current study, the first two PCs covered multiple traits, including grain yield, 1000-grain weight, and quality traits, which contributed 54.34% of the total variation. Similar findings were also reported by Meena et al. [80], whereby the grain yield potential of recombinant inbred lines was evaluated using PCA, showing that 63.6% of the variation was contributed by the first two components containing grain yield, 1000-kernel weight, and quality traits. Furthermore, similar results were reported for wheat in earlier studies [81,82], indicating the reliability of our findings. Our study revealed that for the genetic improvement of grain yield, breeders could select the mutant lines expressing superior performance for 1000-grain weight, tillers per plant, number of spikelets per spike, and plant height. Among these, grain yield and yield components are the most important traits, which may lead to achieving higher grain yields.
In conclusion, indirect selection using plant height, number of tillers per plant, spike length, number of spikelets per spike, and 1000-kernel weight parameters can be exercised for the genetic improvement of wheat grain yield. Along with yield components, some important quality traits such as protein and moisture contents could be targeted to improve wheat quality.

4.3. GT Bi-Plot Analysis

A complete understanding of the associations among multiple traits and genotypes helps in designing breeding goals that pave the way for exercising indirect selection of other traits [83]. In the current study, the bi-plot grouped the traits under study, which exhibited varying degrees of correlation with each other. Positive correlations were found among 1000-kernel weight, plant height, number of spikelets per spike, number of tillers per plant, and grain yield, as indicated by the acute angles between their respective vectors (<90°). Additionally, different mutant lines depicted associations with different groups of traits; thus, the bi-plot exhibited excellent discrimination ability in selecting a specific genotype with a particular trait and in recommending a genotype for a particular trait. By adopting this technique, we are able to propose that mutant lines Pb-M-59 waxy and Pb-M-1027 waxy are suitable candidates for improving wheat yield, while Pb-M-2728 and Pb-M-2550 are suitable for enhancing grain quality. A similar approach was described in previous studies, showing that an assessment of visual comparisons can be made by producing a GT-bi plot, meaning the best-performing genotypes can be identified [84,85,86,87,88].
In the current investigation, the GT bi-plot explained 49.1% and 50.8% of the total variation for the NIAB and NIBGE locations, respectively. Strong associations among plant height, grain weight, and grain yield were found during both seasons at both locations. It was also shown that yield is positively correlated with yield components but negatively correlated with grain quality traits. The negative associations between grain yield and quality (protein and gluten contents) at both study locations should be considered in the selection of parents or mutants of either trait. Such associations were also reported in earlier studies [89,90].
Selection for high-yielding wheat mutant lines can be undertaken by exercising indirect selection for yield components, as found in the bi-plot analysis. The mutant lines showing long vector lengths are high yielding. For example, mutant line Pb-M-59 waxy and Pb-M-1854 depicted higher vector lengths than the other mutant lines. These mutants showed the highest values for grain yield, 1000-grain weight, and above-medium protein content; therefore, these mutant lines are suitable candidates for improving wheat yield and quality, as well as for conducting molecular genetic experiments. These propositions are based on the fact that the vector length has been found to be the most reliable criterion for selecting a high-yielding genotype [91]. These genotypes can be released as commercial varieties or can at least be utilized in wheat breeding programs.
The “which-won-where” polygon graph serves as a useful tool for assessing the trait profiles of individual genotypes [92]. The polygon plot also helps in identification and selection of genotypes having superior performance for particular traits that can be used in wheat improvement programs [93]. In the current study, an irregular polygon was formed by interconnecting all of the mutant lines with the longest vector lengths in all possible directions. Each side of the polygon comprised different sectors with different yield–trait combinations; each sector comprised a vertex mutant line. As such, mutant lines occurred at Pb-M-59 waxy, Pb-M-1027 waxy, and Pb-M-1854 vertices, among others, which showed better performance for yield–trait combinations as compared to the other mutant lines. The GT Bi-plot analysis used to differentiate genotypes based on multiple traits and to find kinship among the traits has been used in many crops, such as safflower [94], mung bean [95], barley [96], cotton [97], dry beans [98], durum wheat [99], maize [100], and rice [101].
In summary, it can be stated that the GT bi-plot analysis has been proven to be an effective tool for visualizing genotype and trait data for mutant wheat lines. It also provided the basis for visual comparisons and revealed interrelations among multiple traits and genotypes. Overall, these observations suggest its greater utility in wheat improvement programs and molecular genetics studies.

5. Conclusions

Achieving maximum grain yield is required to meet the increasing global food demands. Here, highly productive mutants were identified, which can be used for breeding and or direct cultivation. The analysis of data for multiple traits using the genotype by trait (GT) bi-plot methodology revealed that the GT bi-plot facilitated visual comparisons and the selection of wheat mutant lines. The GT bi-plot analysis of 32 mutant lines and a wild type showed a wide range of associations among traits and indicated that the most important traits for improving wheat varieties are grain yield, 1000-grain weight, number of tillers per plant, number of spikelets per spike, and plant height. It was also evident from the present findings that considerable variation was present among the mutant lines. It is also suggested that it is possible to develop mutant lines with contrasting traits that can be used to enhance genetic wheat resources. Mutant lines Pb-M-59 waxy, Pb-M-1027 waxy, Pb-M-1854, Pb-M-2728, and Pb-M-2550 can be targeted as potential candidates to improve wheat yield and grain quality. The methodology described in the present study is a useful assay for selecting high-yielding wheat genotypes with high grain quality. These mutants can be used in wheat improvement programs, as well as in exploring the genetic mechanisms of useful traits in wheat and other crops.

Supplementary Materials

The following are available online at https://www.mdpi.com/article/10.3390/agronomy11112288/s1: Table S1: Trait means for each of the 32 mutant lines plus the wild type screened at NIAB over the period 2018–2020. Table S2: Trait means for each of the 32 mutant lines plus the wild type screened at NIAB over the period 2018–2020. Table S3: Trait means for each of the 32 mutant lines plus the wild type screened at NIBGE over the period 2018–2020.

Author Contributions

Conceptualization, M.-u.-R.; methodology, M.-u.-R.; formal analysis, S.Z., and M.I.; data curation, S.Z., and S.I.; writing—original draft preparation, S.Z., and M.-u.-R.; writing—review and editing, S.Z.; M.-u.-R., and M.A.N.; visualization, S.Z., M.-u.-R., and M.A.N.; funding acquisition, M.-u.-R. All authors have read and agreed to the published version of the manuscript.

Funding

This research work was funded by the International Atomic Energy Commission (IAEA), Vienna, Austria, through a project entitled “Developing Germplasms through TILLING in Crop Plants Using Mutation and Genomic Approaches (PAK/5/047)”. We also acknowledge the support of the Higher Education Commission (HEC), Islamabad, Pakistan, for continuing the activities of the IAEA project towards the logical end through a project entitled “Identification of Disease and Insect Mutants using SSR and Next-Generation Sequencing Tools (6103-NRPU/R&D/HEC-2016)”. Funds for publication were utilized from the project entitled “Characterization of mutants derived from EMS-derived Gandum-1 for rust and drought tolerance for sustaining wheat yield in Pakistan”, funded by Agriculture Linkage Program, Pakistan Agriculture Research Council (ALP-PARC, CS049).

Data Availability Statement

The data from the manuscript can be found within the article, as well as in the Supplementary Files.

Acknowledgments

We thank the International Atomic Energy Commission (IAEA), Vienna, Austria, for providing funds through an umbrella project entitled “Developing Germplasms through TILLING in Crop Plants Using Mutation and Genomic Approaches (PAK/5/047) for inducing mutations in wheat. We are also grateful to the HEC, Islamabad, Pakistan, for providing financial support used to continue the activities of previous projects through a project entitled “Identification of Disease and Insect Mutants using SSR and Next-Generation Sequencing Tools (6103-NRPU/R&D/HEC-2016).

Conflicts of Interest

The authors had no conflict of interest. Additionally, the funding agency did not play any role in planning of the experiments, data collection, explaining the results, or writing of the manuscript. The funders also had no role in making decisions regarding publishing the results.

References

  1. Foreign Agricultural Service/USDA. World agricultural production, Circular series, WAP 8-21, August 2021. 2021. Available online: https://apps.fas.usda.gov/psdonline/circulars/production (accessed on 27 August 2021).
  2. Shewry, P.R.; Hey, S.J. The contribution of wheat to human diet and health. Food Energy Secur. 2015, 4, 178–202. [Google Scholar] [CrossRef] [PubMed]
  3. Joye, I.J. Dietary Fibre from Whole Grains and Their Benefits on Metabolic Health. Nutrients 2020, 12, 3045. [Google Scholar] [CrossRef]
  4. Mansour, E.; Merwad, A.M.A.; Yasin, M.A.T.; Abdul-Hamid, M.I.E.; El-Sobky, E.E.A.; Oraby, H.F. Nitrogen use efficiency in spring wheat: Genotypic variation and grain yield response under sandy soil conditions. J. Agric. Sci. 2017, 155, 1407. [Google Scholar] [CrossRef]
  5. Hickey, L.T.; Hafeez, A.N.; Robinson, H.; Jackson, S.A.; Leal-Bertioli, S.C.; Tester, M.; Gao, C.; Godwin, I.D.; Hayes, B.J.; Wulff, B.B. Breeding crops to feed 10 billion. Nat. Biotechnol. 2019, 37, 744–754. [Google Scholar] [CrossRef] [PubMed] [Green Version]
  6. Khadka, K.; Raizada, M.N.; Navabi, A. Recent progress in germplasm evaluation and gene mapping to enable breeding of drought-tolerant wheat. Front. Plant Sci. 2020, 11, 1149. [Google Scholar] [CrossRef]
  7. Adrees, M.; Khan, Z.S.; Ali, S.; Hafeez, M.; Khalid, S.; Ur Rehman, M.Z.; Hussain, A.; Hussain, K.; Chatha, S.A.S.; Rizwan, M. Simultaneous mitigation of cadmium and drought stress in wheat by soil application of iron nanoparticles. Chemosphere 2020, 238, 124681. [Google Scholar] [CrossRef] [PubMed]
  8. Nawaz, M.A.; Chung, G. Genetic Improvement of Cereals and Grain Legumes. Genes 2020, 11, 1255. [Google Scholar] [CrossRef] [PubMed]
  9. Ahmad, T.; Kumar, A.; Pandey, D.; Prasad, B. Correlation and path coefficient analysis for yield and its attributing traits in bread wheat (Triticum aestivum L. em Thell). J. Nat. Appl. Sci. 2018, 10, 1078–1084. [Google Scholar] [CrossRef] [Green Version]
  10. Gegas, V.C.; Nazari, A.; Griffiths, S.; Simmonds, J.; Fish, L.; Orford, S.; Sayers, L.; Doonan, J.H.; Snape, J.W. A genetic framework for grain size and shape variation in wheat. Plant Cell 2010, 22, 1046–1056. [Google Scholar] [CrossRef] [PubMed] [Green Version]
  11. Sonmezoglu, O.A.; Bozmaz, B.; Yildirim, A.; Kandemir, N.; Aydin, N. Genetic characterization of Turkish bread wheat landraces based on microsatellite markers and morphological characters. Turk. J. Biol. 2012, 36, 589–597. [Google Scholar]
  12. Kumbhar, S.D.; Kulwal, P.L.; Patil, J.V.; Sarawate, C.D.; Gaikwad, A.P.; Jadhav, A.S. Genetic diversity and population structure in landraces and improved rice varieties from India. Rice Sci. 2015, 22, 99–107. [Google Scholar] [CrossRef] [Green Version]
  13. Najaphy, A.; Parchin, R.A.; Farshadfar, E. Comparison of phenotypic and molecular characterizations of some important wheat cultivars and advanced breeding lines. Aust. J. Crop Sci. 2012, 6, 326. [Google Scholar]
  14. Ahmadi, M.; Farshadfar, E.; Veisi, S. Evaluation of genetic diversity in land races of bread wheat under irrigated and rainfed conditions. Int. J. Agric. Crop Sci. 2012, 4, 1627–1636. [Google Scholar]
  15. Mansour, E.; Moustafa, E.S.; Qabil, N.; Abdelsalam, A.; Wafa, H.A.; El Kenawy, A.; Casas, A.M.; Igartua, E. Assessing different barley growth habits under Egyptian conditions for enhancing resilience to climate change. Field Crop. Res. 2018, 224, 67–75. [Google Scholar] [CrossRef]
  16. Altay, F. Yield stability of some Turkish winter wheat (Triticum aestivum L.) genotypes in the Western Transtional Zone of Turkey. Turk. J. Field Crop. 2012, 17, 129–134. [Google Scholar]
  17. Denčić, S.R.; Mladenov, N.O.; Kobiljski, B.O. Effects of genotype and environment on breadmaking quality in wheat. Int. J. Plant Prod. 2012, 5, 71–82. [Google Scholar] [CrossRef]
  18. Malik, A.H.; Kuktaite, R.; Johansson, E. Combined effect of genetic and environmental factors on the accumulation of proteins in the wheat grain and their relationship to bread-making quality. J. Cereal Sci. 2013, 57, 170–174. [Google Scholar] [CrossRef]
  19. Mikulikova, D.; Masár, S.; Horvathova, V.; Kraic, J. Stability of quality traits in winter wheat cultivars. Czech. J. Food. Sci. 2009, 27, 403–417. [Google Scholar] [CrossRef] [Green Version]
  20. Kong, L.; Si, J.; Zhang, B.; Feng, B.; Li, S.; Wang, F. Environmental modification of wheat grain protein accumulation and associated processing quality: A case study of China. Aust. J. Crop Sci. 2013, 7, 173–181. [Google Scholar]
  21. Miralbes, C. Discrimination of European wheat varieties using near infrared reflectance spectroscopy. Food Chem. 2008, 106, 386–389. [Google Scholar] [CrossRef]
  22. Goesaert, H.; Brijs, K.; Veraverbeke, W.S.; Courtin, C.M.; Gebruers, K.; Delcour, J.A. Wheat flour constituents: How they impact bread quality, and how to impact their functionality. Trends Food Sci. Technol. 2005, 16, 12–30. [Google Scholar] [CrossRef]
  23. Pomeranz, Y. Wheat Chemistry and Technology (edited); American Association of Cereal Chemists: St. Paul, MN, USA, 1964. [Google Scholar]
  24. Hailegiorgis, D.; Mesfin, M.; Genet, T. Genetic divergence analysis on some bread wheat genotypes grown in Ethiopia. J. Cent. Eur. Agric. 2011, 12, 344–352. [Google Scholar] [CrossRef]
  25. Munjal, R. Genetic diversity in bread wheat for heat tolerance. Ekin J. Crop Breed. Genetic. 2017, 3, 60–78. [Google Scholar]
  26. Ahmad, H.M.; Awan, S.I.; Aziz, O.; Ali, M.A. Multivariative analysis of some metric traits in bread wheat (Triticum aestivum L.). Eur. J. Biotechnol. Biosci. 2014, 1, 22–26. [Google Scholar]
  27. Sahar, B.; Ahmed, B.; Naserelhaq, N.; Mohammed, J.; Hassan, O. Efficiency of selection indices in screening bread wheat lines combining drought tolerance and high yield potential. J. Plant Breed. Crop Sci. 2016, 8, 72–86. [Google Scholar] [CrossRef]
  28. Idrissi, O.; Chafika, H.; Nsarellah, N. Comparaison de lignées avancées de lentille sous stress hydrique durant la phase de floraison et formation des gousses. Nat. Technol. 2013, 8, 53A. [Google Scholar]
  29. Abdolshahi, R.; Nazari, M.; Safarian, A.; Sadathossini, T.S.; Salarpour, M.; Amiri, H. Integrated selection criteria for drought tolerance in wheat (Triticum aestivum L.) breeding programs using discriminant analysis. Field Crop. Res. 2015, 174, 20–29. [Google Scholar] [CrossRef]
  30. Eticha, F.; Grausgruber, H.; Berghoffer, E. Multivariate analysis of agronomic and quality traits of hull-less spring barley (Hordeum vulgare L.). J. Plant Breed. Crop Sci. 2010, 2, 81–95. [Google Scholar] [CrossRef]
  31. Marquetti, I.; Link, J.V.; Lemes, A.L.G.; dos Santos Scholz, M.B.; Valderrama, P.; Bona, E. Partial least square with discriminant analysis and near infrared spectroscopy for evaluation of geographic and genotypic origin of arabica coffee. Comput. Electron. Agric. 2016, 121, 313–319. [Google Scholar] [CrossRef]
  32. Das, B.; Nair, B.; Reddy, V.K.; Venkatesh, P. Evaluation of multiple linear, neural network and penalised regression models for prediction of rice yield based on weather parameters for west coast of India. Int. J. Biometeorol. 2018, 62, 1809–1822. [Google Scholar] [CrossRef] [PubMed]
  33. Das, B.; Sahoo, R.N.; Pargal, S.; Krishna, G.; Verma, R.; Chinnusamy, V.; Sehgal, V.K.; Gupta, V.K.; Dash, S.K.; Swain, P. Quantitative monitoring of sucrose, reducing sugar and total sugar dynamics for phenotyping of water-deficit stress tolerance in rice through spectroscopy and chemometrics. Spectrochim. Acta Part A Mol. Biomol. Spectrosc. 2018, 192, 41–51. [Google Scholar] [CrossRef]
  34. Verma, S.P.; Pathak, V.N.; Verma, O.P. Interrelationship between Yield and its Contributing Traits in Wheat (Triticum aestivum L.). Int. J Curr. Microbiol. App. Sci. 2019, 8, 3209–3215. [Google Scholar] [CrossRef]
  35. Abbasi, Z.; Arzani, A.; Majidi, M.M. Evaluation of genetic diversity of sugar beet (Beta vulgaris L.) crossing parents using agro-morphological traits and molecular markers. J. Agric. Sci. Technol. 2014, 16, 1397–1411. [Google Scholar]
  36. Kavithamani, D.; Yuvaraja, A.; Selvi, B. Principal component analysis and grouping of sorghum (Sorghum bicolor L. Moench) gene pool for genetic diversity. Electron. J. Plant Breed. 2019, 10, 1426–1434. [Google Scholar] [CrossRef]
  37. Al-Naggar, A.M.M.; Shafik, M.M.; Musa, R.Y.M. Genetic diversity based on morphological traits of 19 maize genotypes using principal component analysis and GT biplot. Annu. Res. Rev. Biol. 2020, 68–85. [Google Scholar] [CrossRef] [Green Version]
  38. Yan, W.; Kang, M.S. GGE Biplot Analysis: A Graphical Tool for Breeders, Geneticists, and Agronomists; CRC Press: Boca Raton, FL, USA, 2002. [Google Scholar]
  39. Ober, E.S.; Le Bloa, M.; Clark, C.J.; Royal, A.; Jaggard, K.W.; Pidgeon, J.D. Evaluation of physiological traits as indirect selection criteria for drought tolerance in sugar beet. Field Crop. Res. 2005, 91, 231–249. [Google Scholar] [CrossRef]
  40. Yan, W.; Kang, M.S.; Ma, B.; Woods, S.; Cornelius, P.L. GGE biplot vs. AMMI analysis of genotype-by-environment data. Crop Sci. 2007, 47, 643–653. [Google Scholar] [CrossRef]
  41. Lee, S.J.; Yan, W.; Ahn, J.K.; Chung, I.M. Effects of year, site, genotype and their interactions on various soybean isoflavones. Field Crop. Res. 2003, 81, 181–192. [Google Scholar] [CrossRef]
  42. Badu-Apraku, B.; Akinwale, R.O. Cultivar evaluation and trait analysis of tropical early maturing maize under Striga-infested and Striga-free environments. Field Crop. Res. 2011, 121, 186–194. [Google Scholar] [CrossRef]
  43. Gabriel, K.R. The biplot graphic display of matrices with application to principal component analysis. Biometrika 1971, 58, 453–467. [Google Scholar] [CrossRef]
  44. Yan, W.; Tinker, N.A. Biplot analysis of multi-environment trial data: Principles and applications. Can. J. Plant Sci. 2006, 86, 623–645. [Google Scholar] [CrossRef] [Green Version]
  45. Ilker, E.; Tonk, F.A.; Caylak, O.; Tosun, M.; Ozmen, İ. Assessment of Genotype X Environment Interactions for Grain Yield in Maize Hybrids Using Ammi and GGE Biplot Analyses. Turk. J. Field Crop. 2009, 14, 123–135. [Google Scholar]
  46. Ukalski, K.; Smialowski, T.; Ukalska, J. Yield and stability analysis of oat genotypes using graphical GGE method. Zywn. Nauk. Technol. J. 2010, 17, 127–140. [Google Scholar] [CrossRef]
  47. Ahmadi, J.; Vaezi, B.; Hossein Fotokian, M. Graphical analysis of multi-environment trials for barley yield using AMMI and GGE-biplot under rain-fed conditions. J. Plant Physiol. Breed. 2012, 2, 43–54. [Google Scholar]
  48. Kendal, E. Comparing durum wheat cultivars with genotype×yield×trait (GYT) and genotype× trait (GT) by biplot method. Chil. J. Agric. Res. 2019, 79, 512–522. [Google Scholar] [CrossRef] [Green Version]
  49. Mortazavian, S.M.M.; Nikkhah, H.R.; Hassani, F.A.; Sharif-al-Hosseini, M.; Taheri, M.; Mahlooji, M. GGE biplot and AMMI analysis of yield performance of barley genotypes across different environments in Iran. J. Agric. Sci. Technol. 2014, 16, 609–622. [Google Scholar]
  50. Sayar, M.S.; Han, Y. Determination of seed yield and yield components of grass pea (Lathyrus sativus L.) lines and evaluations using GGE Biplot analysis method. Tarım. Bilimleri. Dergisi. 2015, 21, 78–92. [Google Scholar] [CrossRef] [Green Version]
  51. Kendal, E.; Dogan, Y. Stability of a candidate and cultivars (Hordeum vulgare L.) by GGE biplot analysis of multi environment yield trials in spring barley. Agric. For. 2015, 61, 307–318. [Google Scholar] [CrossRef] [Green Version]
  52. Akcura, M.; Kokten, K.; Akcacik, A.G.; Aydogan, S. Pattern analysis of Turkish bread wheat landraces and cultivars for grain and flour quality. Turk. J. Field Crop. 2016, 21, 120–130. [Google Scholar] [CrossRef]
  53. Oral, E.; Kendal, E.; Dogan, Y. Selection the best barley genotypes to multi and special environments by AMMI and GGE biplot models. Fresen. Environ. Bulletin. 2018, 27, 5179–5187. [Google Scholar]
  54. Kumar, B.; Ruchi, G.M.L.; Upadhyay, A. Genetic variability, diversity and association of quantitative traits with grain yield in bread wheat (Triticum aestivum L.). Asian J. Agric. Res. 2009, 1, 4–6. [Google Scholar]
  55. Bilsborrow, P.; Cooper, J.; Tetard-Jones, C.; Średnicka-Tober, D.; Barański, M.; Eyre, M.; Schmidt, C.; Shotton, P.; Volakakis, N.; Cakmak, I.; et al. The effect of organic and conventional management on the yield and quality of wheat grown in a long-term field trial. Eur. J. Agron. 2013, 51, 71–80. [Google Scholar] [CrossRef] [Green Version]
  56. Steel, R.G. Principles and Procedures of Statistics a Biometrical Approach (No. 519.5 S8); McGraw Hill: New York, NY, USA, 1997. [Google Scholar]
  57. Ullah, I.; Ashraf, M.; Zafar, Y. Genotypic variation for drought tolerance in cotton (Gossypium hirsutum L.): Leaf gas exchange and productivity. Flora-Morphology, Distribution. Funct. Ecol. Plants. 2008, 203, 105–115. [Google Scholar] [CrossRef]
  58. Hintze, J. NCSS and PASS number crucher statistical systems. NCSS Statistical Software: Kaysville, UT, USA, 2001. Available online: http://www.NCSS.com (accessed on 27 August 2021).
  59. Frutos, E.; Galindo, M.P.; Leiva, V. An interactive biplot implementation in R for modeling genotype-by-environment interaction. Stochastic Environ. Res. Risk Assess. 2014, 28, 1629–1641. [Google Scholar] [CrossRef]
  60. Yan, W.; Rajcan, I. Biplot analysis of test sites and trait relations of soybean in Ontario. Crop Sci. 2002, 42, 11–20. [Google Scholar] [CrossRef]
  61. Yan, W.; Kang, M.S. GGE Biplot Analysis: A Graphical Tool for Breeders, Geneticists, and Agronomists; CRC Press: Boca Raton, FL, USA, 2003; p. 213. [Google Scholar]
  62. Osekita, O.S.; Ajayi, A.T. Character expression and selection differential for yield and its components in soybean (Glycine max (L.) Merrill). Acad. J. Agric. Res. 2013, 1, 167–171. [Google Scholar]
  63. Drezner, G.; Dvojkovic, K.; Horvat, D.; Novoselovic, D.; Lalic, A. Environmental impacts on wheat agronomic and quality traits. Cereal Res. Commun. 2007, 35, 357–360. [Google Scholar] [CrossRef]
  64. Atkinson, M.D.; Kettlewell, P.S.; Poulton, P.R.; Hollins, P.D. Grain quality in the Broadbalk wheat experiment and the winter North Atlantic oscillation. J. Agric. Sci. 2008, 146, 541. [Google Scholar] [CrossRef]
  65. Xie, Q. Physiological and Genetic Determination of Yield and Yield Components in a Bread Wheat× Spelt Mapping Population. Doctoral Dissertation, University of Nottingham, Nottingham, UK, 2015. [Google Scholar]
  66. ALIU, S.A.; Fetahu, S. Determination on genetic variation for morphological traits and yield components of new winter wheat (Triticum aestivum L.) lines. Not. Sci. Biol. 2010, 2, 121–124. [Google Scholar] [CrossRef] [Green Version]
  67. Shinwari, Z.K.; Rehman, H.I.N.A.; Rabbani, M.A. SDS-Page based genetic divergence in safflower (Carthamus Tinctorius L.). Pak. J. Bot. 2014, 46, 811–815. [Google Scholar]
  68. Singh, M.K.; Sharma, P.K.; Tyagi, B.S.; Singh, G. Genetic analysis for morphological traits and protein content in bread wheat (Triticum aestivum L.) under normal and heat stress environments. Indian J. Genet. Plant Breed. 2013, 73, 320–324. [Google Scholar] [CrossRef]
  69. Singh, G.; Kulshreshtha, N.; Singh, B.N.; Setter, T.L.; Singh, M.K.; Saharan, M.S.; Tyagi, B.S.; Verma, A.; Sharma, I. Germplasm characterization, association and clustering for salinity and waterlogging tolerance in bread wheat (Triticum aestivum). Indian J. Agric. Sci. 2014, 84, 1102–1110. [Google Scholar]
  70. Sabaghnia, N.; Janmohammadi, M.; Bashiri, A.; Asghari-Shirghan, R. Genetic variation of several bread wheat (Triticum aestivum L.) genotypes based on some morphological traits. Agron. Sci. 2014, 69, 44–54. [Google Scholar]
  71. Jaiswal, J.P. Genetic Diversity Analysis in Exotic Germplasm Accessions of Bread Wheat (Triticum aestivum L.) by Cluster Analysis. Electron. J. Plant Breed. 2015, 6, 1111–1117. [Google Scholar]
  72. Kumar, P.; Singh, G.; Kumar, S.; Kumar, A.; Ojha, A. Genetic analysis of grain yield and its contributing traits for their implications in improvement of bread wheat cultivars. J. Nat. Appl. Sci. 2016, 8, 350–357. [Google Scholar] [CrossRef]
  73. Jan, S.A.; Shinwari, Z.K.; Rabbani, M.A. Morpho-biochemical evaluation of Brassica rapa sub-species for salt tolerance. Genetika 2016, 48, 323–338. [Google Scholar] [CrossRef]
  74. Sabaghnia, N.; Behtash, F.; Janmohammadi, M. Graphic analysis of trait relations of spinach (Spinacia oleracea L.) landraces using the biplot method. Acta Univ. Agric. Et Silvic. Mendel. Brun. 2015, 63, 1187–1194. [Google Scholar] [CrossRef] [Green Version]
  75. Verma, P.N.; Singh, B.N.; Singh, G.; Singh, M.K.; Setter, T.L. Genetic diversity analysis for yield and other agronomic traits in bread wheat under water logged sodic soil condition. J. Wheat Res. 2014, 6, 51–58. [Google Scholar]
  76. Vora, Z.N.; Patel, J.B.; Pansuriya, A.G.; Yusufzai, S.A. Genetic divergence analysis in bread wheat (Triticum aestivum L.). Res. Environ. Life Sci. 2017, 10, 291–294. [Google Scholar]
  77. Sheykhi, A.; Pirdashti, H.; Abbasian, A.; Niknejhad, Y. Segregation of some wheat (Triticum aestivum L.) genotypes using cluster analysis procedure. Int. J. Farm Alli. Sci. 2014, 3, 225–229. [Google Scholar]
  78. Gharib, M.A.A.H.; Qabil, N.; Salem, A.H.; Ali, M.M.A.; Awaad, H.A.; Mansour, E. Characterization of wheat landraces and commercial cultivars based on morpho-phenological and agronomic traits. Cereal Res. Commun. 2021, 49, 149–159. [Google Scholar] [CrossRef]
  79. Spanic, V.; Cosic, J.; Zdunic, Z.; Drezner, G. Characterization of Agronomical and Quality Traits of Winter Wheat (Triticum aestivum L.) for Fusarium Head Blight Pressure in Different Environments. Agronomy 2021, 11, 213. [Google Scholar] [CrossRef]
  80. Meena, N.; Mishra, V.K.; Baranwal, D.K.; Singh, A.K.; Rai, V.P.; Prasad, R.; Arun, B.; Chand, R. Genetic evaluation of spring wheat (Triticum aestivum L.) recombinant inbred lines for spot blotch (Bipolaris Sorokiniana) resistance and yield components under natural conditions for South Asia. J. Agric. Sci. Technol. 2014, 16, 1429–1440. [Google Scholar]
  81. Bhanupriya, B.; Satyanarayana, N.; Mukherjee, S.; Sarkar, K. Genetic diversity of wheat genotypes based on principal component analysis in Gangetic alluvial soil of West Bengal. J. Crop Weed. 2014, 10, 104–107. [Google Scholar]
  82. Ali, M.A.; Zulkiffal, M.; Anwar, J.; Hussain, M.; Farooq, J.; Khan, S.H. Morpho-physiological diversity in advanced lines of bread wheat under drought conditions at post-anthesis stage. J. Anim. Plant Sci. 2015, 25, 431–441. [Google Scholar]
  83. Yan, W.; Tinker, N.A. An integrated system of biplot analysis for displaying, interpreting, and exploring genotype–by-environment interactions. Crop Sci. 2005, 45, 1004–1016. [Google Scholar] [CrossRef]
  84. Hagos, H.G.; Abay, F. AMMI and GGE biplot analysis of bread wheat genotypes in the northern part of Ethiopia. J. Plant Breed. Genet. 2013, 1, 12–18. [Google Scholar]
  85. Stanisavljević, D.; Mitrović, B.; Mirosavljević, M.; Ćirić, M.; Čanak, P.; Stojaković, M.; Ivanović, M. Identification of the most desirable maize testing environments in northern Serbia. Ratar. I Povrt. /Field Veg. Crop. Res. 2013, 50, 28–35. [Google Scholar]
  86. Adjabi, A.; Bouzerzour, A.; Benmahammed, A. Stability analysis of durum wheat (Triticum durum Desf.) grain yield. J. Agron. 2014, 13, 131–139. [Google Scholar] [CrossRef]
  87. Dogan, Y.; Kendal, E.; Oral, E. Identifying of relationship between traits and grain yield in spring barley by GGE Biplot analysis. Agri. For./Poljopr. I Sumar. 2016, 62, 239–252. [Google Scholar] [CrossRef]
  88. Karami, E.; Arshadi, A.; Sartip, A.; Zare, M.; Rezabakhsh, P. Genotypes performance in relation to drought tolerance in barley using multi-environment trials. Agron. Res. 2018, 16, 5–21. [Google Scholar]
  89. Oury, F.X.; Godlin, C. Yield and grain protein concentration in bread wheat: How to use the negative relationship between the two characters to identify favorable genotypes? Euphytica 2007, 157, 45–57. [Google Scholar] [CrossRef]
  90. Tayyar, S. Variation in grain yield and quality of Romanian bread wheat varieties compared to local varieties in northwestern Turkey. Rom. Biotechnol. Lett. 2010, 15, 5189–5196. [Google Scholar]
  91. Peterson, D.M.; Wesenberg, D.M.; Burrup, D.E.; Erickson, C.A. Relationships among agronomic traits and grain composition in oat genotypes grown in different environments. Crop Sci. 2005, 45, 249–255. [Google Scholar] [CrossRef] [Green Version]
  92. Kendal, E.; Sayar, M.S. The stability of some spring triticale genotypes using biplot analysis. J. Anim. Plant Sci. 2016, 26, 754–765. [Google Scholar]
  93. Yan, W.; Frégeau-Reid, J. Genotype by Yield* Trait (GYT) Biplot: A Novel Approach for Genotype Selection based on Multiple Traits. Sci. Rep. 2018, 8, 1–10. [Google Scholar] [CrossRef]
  94. Baljani, R.; Shekari, F.; Sabaghnia, N. Biplot analysis of trait relations of some safflower (Carthamus tinctorius L.) genotypes in Iran. Crop Res. 2015, 50, 63–73. [Google Scholar]
  95. Paramesh, M.; Reddy, D.M.; Priya, M.S.; Sudhakar, P.S.P.; Reddy, K.H.P. GT biplot analysis for yield and drought related traits in mung bean (Vigna radiata L. Wilczek). Electron. J. Plant Breed. 2016, 7, 538–543. [Google Scholar] [CrossRef]
  96. Kendal, E. Evaluation of some barley genotypes with genotype by yield* trait (GYT) biplot method. Agri. For./Poljopr. I Sumar. 2020, 6, 137–150. [Google Scholar]
  97. Xu, N.; Fok, M.; Li, J.; Yang, X.; Yan, W. Optimization of cotton variety registration criteria aided with a genotype-by-trait biplot analysis. Sci. Rep. 2017, 7, 17237. [Google Scholar] [CrossRef] [Green Version]
  98. González, A.M.; Monteagudo, A.B.; Casquero, P.A.; De Ron, A.M.; Santalla, M. Genetic variation and environmental effects on agronomical and commercial quality traits in the main European market classes of dry bean. Field Crop. Res. 2006, 95, 336–347. [Google Scholar] [CrossRef]
  99. Mohammadi, R.; Amri, A. Graphic analysis of trait relations and genotype evaluation in durum wheat. J. Crop Improv. 2011, 25, 680–696. [Google Scholar] [CrossRef]
  100. Dolatabad, S.S.; Choukan, R.; Hervan, E.M.; Dehghani, H. Multi-environment analysis of traits relation and hybrids comparison of maize based on the genotype by trait biplot. Am. J. Agric. Biol. Sci. 2010, 5, 107–113. [Google Scholar] [CrossRef] [Green Version]
  101. Samonte, S.O.P.; Tabien, R.E.; Wilson, L.T. Parental selection in rice cultivar improvement. Rice Sci. 2013, 20, 45–51. [Google Scholar] [CrossRef]
Figure 1. Boxplots showing median, minimum, maximum, and mean values (a) days to heading; (b) plant height; (c) spike length; (d) 1000-grain weight at the NIBGE location; * represents outliers.
Agronomy 11 02288 g001
Figure 2. Box plots showing median, minimum, maximum, and mean values: (a) grain yield; (b) protein%; (c) moisture%; (d) gluten content at NIBGE location; * represents outliers.
Agronomy 11 02288 g002
Figure 3. Boxplots showing the median, minimum, maximum, and mean values: (a) days to heading; (b) plant height; (c) spike length; (d) 1000-grain weight at the NIAB location; * represents outliers.
Agronomy 11 02288 g003
Figure 4. Box plot showing median, minimum, maximum, and mean values: (a) grain yield; (b) protein%; (c) moisture%; (d) gluten content at the NIAB location; * represents outliers.
Agronomy 11 02288 g004
Figure 5. Cluster dendrogram of 32 mutant lines and the wild type based upon mean yield index values calculated for both generations (M7 and M8) and locations (NIBGE and NIAB).
Agronomy 11 02288 g005
Figure 6. Genotype by trait bi-plot showing the associations among morphological and quality traits of 32 mutant lines and the wild type in M7 and M8 generations at the NIAB location.
Agronomy 11 02288 g006
Figure 7. Genotype by trait bi-plot showing the associations among morphological and quality traits of 32 mutant lines and the wild type in M7 and M8 generations at the NIBGE location.
Agronomy 11 02288 g007
Figure 8. Polygon view of the GT bi-plot of 32 mutant lines and the wild type sown at the NIAB location.
Agronomy 11 02288 g008
Figure 9. Polygon view of the GT bi-plot of 32 mutant lines and the wild type at the NIBGE location.
Agronomy 11 02288 g009
Table 1. Mean square values for all traits of 32 mutant lines and the wild type in M7 and M8 generations at the NIBGE location.
GenerationsTraitGenotypesErrorTotal
Df643298
M7Days to heading19.05 **2.7924.11
Plant height99.65 **6.61107.30
Tillers per plant1.56 **0.394.50
Spike length4.41 **42.9547.73
Number of spikelets per spike4.79 **2.067.62
1000-grain weight21.13 **2.5144.95
Grain yield510,874 **30,347614,024
Df323365
Protein content1.45 **0.011.45
Moisture content0.07 **0.010.15
Gluten content3.15 **0.357.88
Df643298
M8Days to heading11.95 **0.0312.07
Plant height53.72 **1.9058.65
Tillers per plant0.96 **0.632.17
Spike length1.86 **1.343.41
Number of spikelets per spike2.06 **1.445.48
1000-grain weight35.34 **0.3536.31
Grain yield958,408 **10,662969,070
Df323365
Protein content2.69 **1.253.95
Moisture content0.50 **0.330.83
Gluten content21.05 **7.5928.61
Df denotes the degree of freedom, ** indicates p-value < 0.01.
Table 2. Mean square values of all traits calculated for 32 mutant lines and the wild type in M7 and M8 generations at the NIAB location.
GenerationsTraitGenotypesErrorTotal
M7Df326498
Days to heading20.04 **5.8559.36
Plant height34.19 **6.6569.37
Tillers per plant0.54 **0.340.89
Spike length1.02 **0.7510.40
Number of spikelets per spike2.68 **1.8914.75
1000-grain weight34.14 **2.0346.33
Grain yield585,260 **27,621624,181
Df323365
Protein content1.30 **0.031.33
Moisture content0.087 **0.010.10
Gluten content2.57 **0.202.76
Df643298
M8Days to heading10.81 **0.5214.29
Plant height49.14 **1.5154.85
Tillers per plant0.35 **0.321.05
Spike length4.55 **0.355.09
Number of Spikelets per spike2.15 **1.415.14
1000-grain weight67.35 **0.3068.04
Grain yield2,111,692 **19772,113,669
Df323365
Protein content0.44 **0.020.46
Moisture content0.18 **0.010.19
Gluten content1.85 **0.522.36
Df denotes the degree of freedom, ** indicates p-value < 0.01.
Table 3. Descriptive statistics of all traits calculated for 32 mutant lines and the wild type in M7 and M8 generations at the NIBGE location.
GenerationTraitMinMaxMeanSDCV (%)LSD
M7Days to heading91.00102.0096.872.511.732.73
Plant height (cm)73.90100.6491.995.762.794.19
Tillers per plant4.007.005.300.7312.251.02
Spike length (cm)10.1014.6212.491.216.561.34
Number of spikelets per spike15.0021.0018.521.737.742.34
1000-grain weight21.6532.5226.232.656.051.29
Grain yield (kg/ha)2026.304098.403041.30412.665.73284.15
Protein content (%)10.6514.3512.460.840.950.24
Moisture content (%)7.658.558.250.191.020.17
Gluten content37.0042.0039.871.321.491.20
M8Days to heading91.0099.0095.241.950.180.27
Plant height (cm)70.0489.5281.924.231.682.25
Tillers per plant5.007.006.060.6112.921.30
Spike length (cm)11.0113.7812.530.799.231.89
Number of spikelets per spike15.0019.0017.851.126.821.96
1000-grain weight15.4932.9322.863.432.590.96
Grain yield (kg/ha)1806.304183.302592.50534.914.66168.43
Protein content (%)11.5015.9513.791.168.122.28
Moisture content (%)7.859.758.610.496.861.16
Gluten content33.0048.0039.613.307.005.61
Min: minimum; Max: maximum; SD: standard deviation; CV: coefficient of variation; LSD: least significant difference.
Table 4. Descriptive statistics of all traits calculated for 32 mutant lines and the wild type in M7 and M8 generations at the NIAB location.
GenerationTraitMinMaxMeanSDCV (%)LSD
M7Days to heading89.00101.0094.522.652.562.73
Plant height (cm)83.8799.7491.673.382.814.19
Tillers per plant4.006.004.640.6012.501.02
Spike length (cm)11.2213.5012.270.587.041.34
Number of spikelets per spike17.0021.0019.001.507.382.34
1000-grain weight13.8326.9519.083.277.472.59
Grain yield (kg/ha)717.862309.401343.60441.6912.37284.15
Protein content (%)11.5315.2313.570.811.210.33
Moisture content (%)8.108.878.320.181.080.18
Gluten content37.6742.3340.291.021.100.90
M8Days to heading91.0099.0096.091.890.751.18
Plant height (cm)73.0291.4482.894.051.582.00
Tillers per plant6.007.006.610.508.680.93
Spike length (cm)9.9414.5412.681.234.690.97
Number of spikelets per spike17.0021.0019.301.426.331.94
1000-grain weight13.8536.5525.474.742.140.89
Grain yield (kg/ha)1244.505819.102951.20838.395.4972.52
Protein content (%)11.0513.2012.260.471.100.27
Moisture content (%)10.7311.6811.070.241.100.23
Gluten content36.0040.0038.360.961.891.46
Min: minimum; Max: maximum; SD: standard deviation; CV: coefficient of variation; LSD: least significant difference.
Table 5. Mean performance of 32 mutant lines and the wild type for two generations (M7 and M8) and locations (NIBGE and NIAB).
Sr. #GenotypesDTHPlant HeightTPPSpike LengthNumber of Spikelets Per SpikeTGWGrain YieldProtein ContentMoisture ContentGluten Content
1Pb-11 parent96.2588.005.5712.3518.0022.432433.7112.229.3540.25
2Pb-M-1027 waxy90.4687.916.3312.4819.0028.043110.0412.199.1537.88
3Pb-M-105595.8888.285.2812.5518.5022.952088.0212.859.1139.67
4Pb-M-106494.8391.625.8613.2718.5024.332442.2813.659.1840.13
5Pb-M-119 waxy96.6181.205.3812.2518.5021.002091.1813.109.1038.83
6Pb-M-12 waxy98.2376.374.9011.4718.0018.131648.4213.298.7840.96
7Pb-M-1272 waxy97.4689.615.8611.7219.0027.083265.7512.949.3638.71
8Pb-M-1323 waxy93.7586.285.7612.4220.0028.423082.3812.868.9639.29
9Pb-M-153096.7587.155.6712.9118.5025.192806.9912.749.2138.17
10Pb-M-157598.2591.665.6813.2018.0022.272373.5213.459.2339.11
11Pb-M-174396.7984.935.3312.5319.0021.331917.9912.968.8739.21
12Pb-M-180297.5587.895.6912.2418.0024.152408.4612.738.9438.92
13Pb-M-185496.0087.755.9210.8618.0027.153001.5913.129.3939.17
14Pb-M-191797.4288.555.1012.7318.0023.912384.6812.948.9138.42
15Pb-M-194696.0888.735.9012.8220.0023.022757.6112.769.1239.38
16Pb-M-204197.7990.695.3911.7318.0025.162911.4612.969.0438.04
17Pb-M-206194.7589.875.6012.1619.0024.502670.9812.819.3838.87
18Pb-M-226096.3486.776.0012.2120.0026.933219.0312.409.0837.67
19Pb-M-230297.5086.885.4611.9018.5023.082466.1512.958.9339.88
20Pb-M-244395.7587.145.5012.4519.0021.632417.5913.088.9939.75
21Pb-M-245395.0889.476.3213.5020.0023.552192.2713.239.1639.96
22Pb-M-251795.2586.445.2913.3118.5023.172572.6412.909.0040.19
23Pb-M-255092.9288.755.2912.3918.5021.432175.0513.689.1939.08
24Pb-M-263794.4984.215.1812.8318.5021.262145.4812.389.0239.45
25Pb-M-271994.1783.855.3411.6618.5022.482240.8713.288.8440.00
26Pb-M-272596.5087.185.7113.0419.0021.912261.8113.218.9539.55
27Pb-M-272896.6786.465.9012.4918.5017.601721.8813.509.4339.25
28Pb-M-276894.4287.555.6312.8018.5024.942801.2513.168.7938.42
29Pb-M-277895.3388.725.7113.2919.0022.612600.0412.828.9839.92
30Pb-M-334 waxy95.5886.785.4412.0818.5021.972118.4813.558.9040.04
31Pb-M-58394.7187.065.4913.3718.0022.832342.9313.429.1339.50
32Pb-M-59 waxy92.9784.385.2412.0017.5027.423269.9812.848.8138.58
33Pb-M-60595.1786.715.3513.0519.5020.551970.3013.659.0540.97
DTH: number of days to heading; TPP: number of tillers per plant; TGW: 1000-grain weight.
Table 6. Principal component analysis showing Eigen values, percentages of variance, and cumulative percentages for all traits.
TraitsPrincipal Component (PC)Eigen ValuePercent
Variance
Cumulative Percentage
Days to headingPC13.598635.9935.99
Plant heightPC21.835518.3654.34
Tillers per plantPC31.249612.566.84
Spike lengthPC40.88408.8475.68
Number of spikelets per spikePC50.81258.1383.8
1000-grain weightPC60.64636.4690.27
Grain YieldPC70.43934.3994.66
Protein contentPC80.28422.8497.5
Moisture contentPC90.18251.8399.33
Gluten contentPC100.06710.67100
Table 7. Rotation component matrix of different traits with Eigen values > 0.5 in the first five components.
PC1PC2PC3PC4PC5
Grain yieldSpike lengthMoisture contentNumber of spikelets per spikeDays to heading
1000-grain weightNumber of spikelets per spikeDays to heading____
Tillers per plantPlant heightNumber of spikelets per spike____
Gluten contentTillers per plant______
Plant height________
Protein content________
Moisture content________
Publisher’s Note: MDPI stays neutral with regard to jurisdictional claims in published maps and institutional affiliations.

