Article

De novo QTL-seq Identifies Loci Linked to Blanchability in Peanut (Arachis hypogaea) and Refines Previously Identified QTL with Low Coverage Sequence

1
Hudson Alpha Institute for Biotechnology, 601 Genome Way, Huntsville, AL 35806, USA
2
Peanut Company of Australia, 133 Haly St, Kingaroy, QLD 4610, Australia
3
Horticulture Department, The University of Georgia Tifton Campus, Tifton, GA 31793, USA
4
Institute of Plant Breeding, Genetics & Genomics, University of Georgia, Tifton, GA 31793, USA
5
USDA-ARS, Crop Genetics and Breeding Research Unit, Tifton, GA 31793, USA
*
Authors to whom correspondence should be addressed.
Agronomy 2021, 11(11), 2201; https://doi.org/10.3390/agronomy11112201
Submission received: 4 October 2021 / Revised: 25 October 2021 / Accepted: 27 October 2021 / Published: 30 October 2021
(This article belongs to the Special Issue Peanut: A Promising Star to Feed the Future)

Abstract

:
Blanchability is an often overlooked, but important trait for peanut breeding. The process of blanching, removing the skin, is an important step in the processing of raw nuts for manufacturing. Under strong genetic control and requiring considerable effort to phenotype, blanchability is conducive for marker-assisted selection. We used QTL sequencing (QTL-seq) to identify two QTLs related to blanchability using previously phenotyped breeding populations. To validate the QTLs, we show that two markers can select for significantly increased blanchability in an independent recombinant inbred line (RIL) population. Two wild introgressions from Arachis cardenasii conferring strong disease resistance were segregated in the population and were found to negatively impact blanchability. Finally, we show that by utilizing highly accurate sequence analysis pipelines, low coverage sequencing can be used to genotype whole populations with increased power and precision. This study highlights the potential to mine breeding data to identify and develop useful markers for genetic improvement programs, and provide powerful tools for breeding for processing and quality traits.

1. Introduction

Quantitative trait locus sequencing (QTL-seq) is a genetic analysis that takes advantage of the ever-decreasing cost in whole genome sequencing (WGS). The two seminal papers describing the simple approach of bulk segregant analysis were first published in 1991 [1,2]. The markers being used were restriction fragment length polymorphism (RFLP) or random amplified polymorphic DNA (RAPD), and in the absence of genome sequences, identifying new markers was difficult within mapping populations. After an interval was initially mapped to control a trait of interest, it was not possible to fine map the interval further in the absence of polymorphic markers. The method of bulk segregant analysis (BSA) rested on the hypothesis that markers linked to the trait of interest will segregate with the phenotype in a segregating population. The individuals exhibiting the extreme tails of the phenotypic distribution will be differentiated by only those markers that were physically within the genomic region of interest. In the case of the original methods, random oligos could be screened in the bulked DNA until polymorphic markers were found. This was how new markers could be identified and placed on the genetic map to fine map the trait to a higher resolution.
The application of BSA evolved as molecular markers became higher throughput. Hybridization expression arrays were used in Arabidopsis to map mutations [3]. In yeast, hybridization arrays and the ability to assay extremely large populations allowed profiling the structure of complex traits controlled by many loci [4]. Whole genome sequencing (WGS) using short reads resulted in more accuracy for mapping mutations in Arabidopsis [5,6]. This was extended to plants without reference genomes as mapping-by-sequencing [7]. Mapping mutations in crop plants with larger genomes was introduced as MutMap, which was highlighted in rice [8], and extended to use mutants without crossing back to a wild-type parent [9]. Using rice, BSA was used in combination with WGS to map natural variation in crops in a technique named QTL-seq [10]. The application of QTL-seq moved to more complex genomes; tomato [11], chickpea [12], cucumber [13], oilseed rape [14], guinea yam [15], watermelon [16], and peanut [17,18,19,20].
The strengths of QTL-seq are its simplicity, efficiency of resource use, and flexibility to utilize historical data. There are limitations however. If the parental genotypes used are divergent from the reference genome, there is variation that short reads cannot account for. This variation—insertions, deletions, duplications, and copy number variants—has major consequences for the expression of phenotypes [21,22]. If one parent is more divergent from the reference than the other parent, then reference bias can skew allele frequencies away from the true frequency in the bulks [23]. For crop genomes, which are either polyploid or have a polyploidization event in their evolutionary history, homeologous sequences introduce an additional layer of noise [24,25]. The consequence is that short reads will pile up in regions that are duplicated in the bulks, but not in the reference, resulting in incorrect allele frequency for that physical location. Alternatively, homeologous sequences will map incorrectly and create further noise in the signal.
For complex polyploid genomes like peanut (Arachis hypogaea), the analysis of the bulk sequence data has relied on generating high quality parental sequence data first, and then utilizing it to either modify the reference genome to be parental-specific [17,19,20], or to call SNPs between the parents with specialized pipelines to use in the analysis of the bulks [18,26]. In heterozygous crops, like Brassica rapa, a strategy was devised that used sequences from parents and F1 hybrids to identify SNPs that were homozygous in the parent of interest [27]. In the case of peanut, the results have been useful, but still exhibit noise to the extent that the precise structure of the identified loci are not clear. The higher noise to signal ratio also precludes identifying minor effect QTL. In cases where the parents of a population are ambiguous, or when using breeding populations with complex pedigrees, it is more useful to be able to call SNPs directly from the bulk sequence without needing parental sequence. Relying on parental sequence is not cost effective, and it also limits the genetic material that can be used to map traits. For complex genomes, it is imperative to be able to analyze QTL-seq datasets from the bulk sequence alone.
A useful outcome for QTL-seq analyses is that markers can be developed straight from breeding populations to be used directly within those breeding programs [17,18,26]. A good example of this is rust resistance in the breeding programs at ICRISAT in India [17]. The markers developed from QTL-seq analysis have been included in a SNP panel that is being used in the global peanut breeding community to select for rust resistance. In this case, it was the discovery of a wild introgression that conferred resistance and was amenable to marker-assisted selection with markers that could select for the introgression on chromosome A03 [17]. A trait that is important for peanut processing and is time consuming to measure is blanchability [28,29]. Blanching consists of heating peanuts to a temperature that removes the skins without damaging the kernel. It is very important to blanch peanuts for quality control (removal of damaged kernels, including aflatoxin contamination) and for processing applications (peanut butter, confectionery). Wright and colleagues (2018) [28] found that the blanching percentage was under strong genetic control with very low genotype × environment (G × E) interactions. Peanut breeding programs generally do not select for blanching percentage due to the high labor investment needed to test. Additionally, a large number of seeds are needed to test blanching percentage, which precludes selection at early generations. Current uniform trials in the United States do not test for blanching percentage (https://www.ars.usda.gov/southeast-area/dawson-ga/national-peanut-research-laboratory/docs/uniform-peanut-performance-tests-uppt/, accessed on 28 October 2021). Despite not having information on the blanching percentage of different cultivars, the cost savings for manufacturers would be substantial. After blanching, any unblanched kernels are discarded as waste, sold as less valuable products, or crushed for oil. The combination of strong genetic control, small G × E effect, and laborious measurement makes blanching an excellent target for marker assisted selection (MAS) in peanut [28,29].
Wild species represent a critical source for alleles that confer strong resistance to disease and tolerance to stress, and peanut is no exception [30,31,32]. Three introgressions from Arachis cardenasii have recently been discovered to contribute strong resistance to important fungal diseases [17,33,34]. These introgressions have been so successful that they were shared all over the world by breeders as “silent” sources of strong resistance and were just recently discovered [35]. The introgressions, two on chromosome A02 and one on chromosome A03, are physically not large, but contain many genes. There is potential linkage drag associated with them that manifests in unexpected ways.
In this study, we use a novel pipeline, Khufu, to de novo analyze a new dataset focused on blanching in peanut. We identify two QTL controlling blanching percentage in peanut. We validate those QTL in an independent recombinant inbred line (RIL) population. We also investigate the effect of Arachis cardenasii introgressions on blanching and these QTL. Finally, we benchmark Khufu on previously published datasets in peanut and discuss the potential for genotyping applications in crops with complex genomes.

2. Materials and Methods

2.1. Blanching QTL-seq and Validation

Good and poor blanching lines were selected from data generated in Wright et al., 2018. Each line was extracted for DNA individually and quantified using a Qubit fluorometer. Equal concentrations of each were pooled into ‘good blanching’ and ‘poor blanching’ DNA pools. The pools were sequenced by Novogene using Illumina HiSeq 2 × 150 bp sequencing. After filtering, a total of 193,712,311 reads from the good blanching pool were mapped (100%; 94.9% properly paired) and 248,926,026 reads from the poor blanching pool (100%; 94.9% properly paired). Analysis of sequenced bulks was carried out using the Khufu pipeline (https://www.hudsonalpha.org/khufudata/, accessed on 28 October 2021).

2.2. Development of RIL Population and Marker Validation

A recombinant inbred line (RIL) population was developed by crossing Middleton x Sutherland cultivars, comprising of 406 individual lines (RILs) at the Peanut Company of Australia (PCA), Kingaroy, Queensland, Australia. Middleton is a reliable high yielding commercial cultivar and has been used extensively in the Australian Peanut Breeding Program (APBP). The pedigree of the resistant parent, Sutherland, is (B123 (F1) × CS22) × D45-p37-102, and is tolerant to multiple foliar diseases; late leaf spot (Phaeoisariopsis personata), peanut rust (Puccinia arachidis) and web blotch [36]. Hybridization between parental lines was performed in 2014 and the single seed descent (SSD) method was employed under field conditions from the F2 to the F6 generation. Extracted DNAs from 406 RIL lines were used for marker validation. Blanching percentage was performed as described in Wright et al., 2018 [28]. Kompetitive allele specific PCR (KASP) markers were designed from the most significant SNPs from the QTLs on B11 and A06 (Table S3). Two methods were used to assess the significance of each identified locus to blanching percentage. The blanching data were transformed into ranks and ANOVA’s were run using each marker alone and the combination of both markers in R. LSMeans for each marker and combinations of them were calculated using the lsmeans package in R. An additional test using a Kruskal–Wallis non parametric test was performed using Kruskal.test in R.

2.3. Analysis of Published Datasets

Sequences from published datasets were downloaded from public databases (NCBI SRA and DDBJ Bioproject). Raw fastq files were not processed further and were subjected to the Khufu pipeline as downloaded.

2.4. Post-Khufu Filtering

We implemented a shiny app to facilitate final polishing post-Khufu processing. It can be freely accessed here: https://w-korani.shinyapps.io/khufu_var2/ (accessed on 28 October 2021). This allows filtering in real time so the user can identify trends within potential noisy groups of SNPs. There are minimum and maximum depth filters. Low depth loci estimate allele frequencies poorly and loci with depths more than twice the estimated read coverage can signal regions of paralogous read mapping. The minor allele frequency filter was first suggested by Takagi et al., (2013) [10] as a mechanism to filter erroneous base calls if a particular alternative allele was in low frequency in both bulks. We implemented an “interval” filter which filters out potential SNPs clustered closely together (<100 bp). This indicates repetitive content and reads from many loci overlapping one locus.
The shiny app takes as input R objects that are created as output from the Khufu analysis pipeline. In the supplement we have included the R objects for the full Blanching data set, and the down sampled 5×, 10×, and 20× sets.

3. Results and Discussion

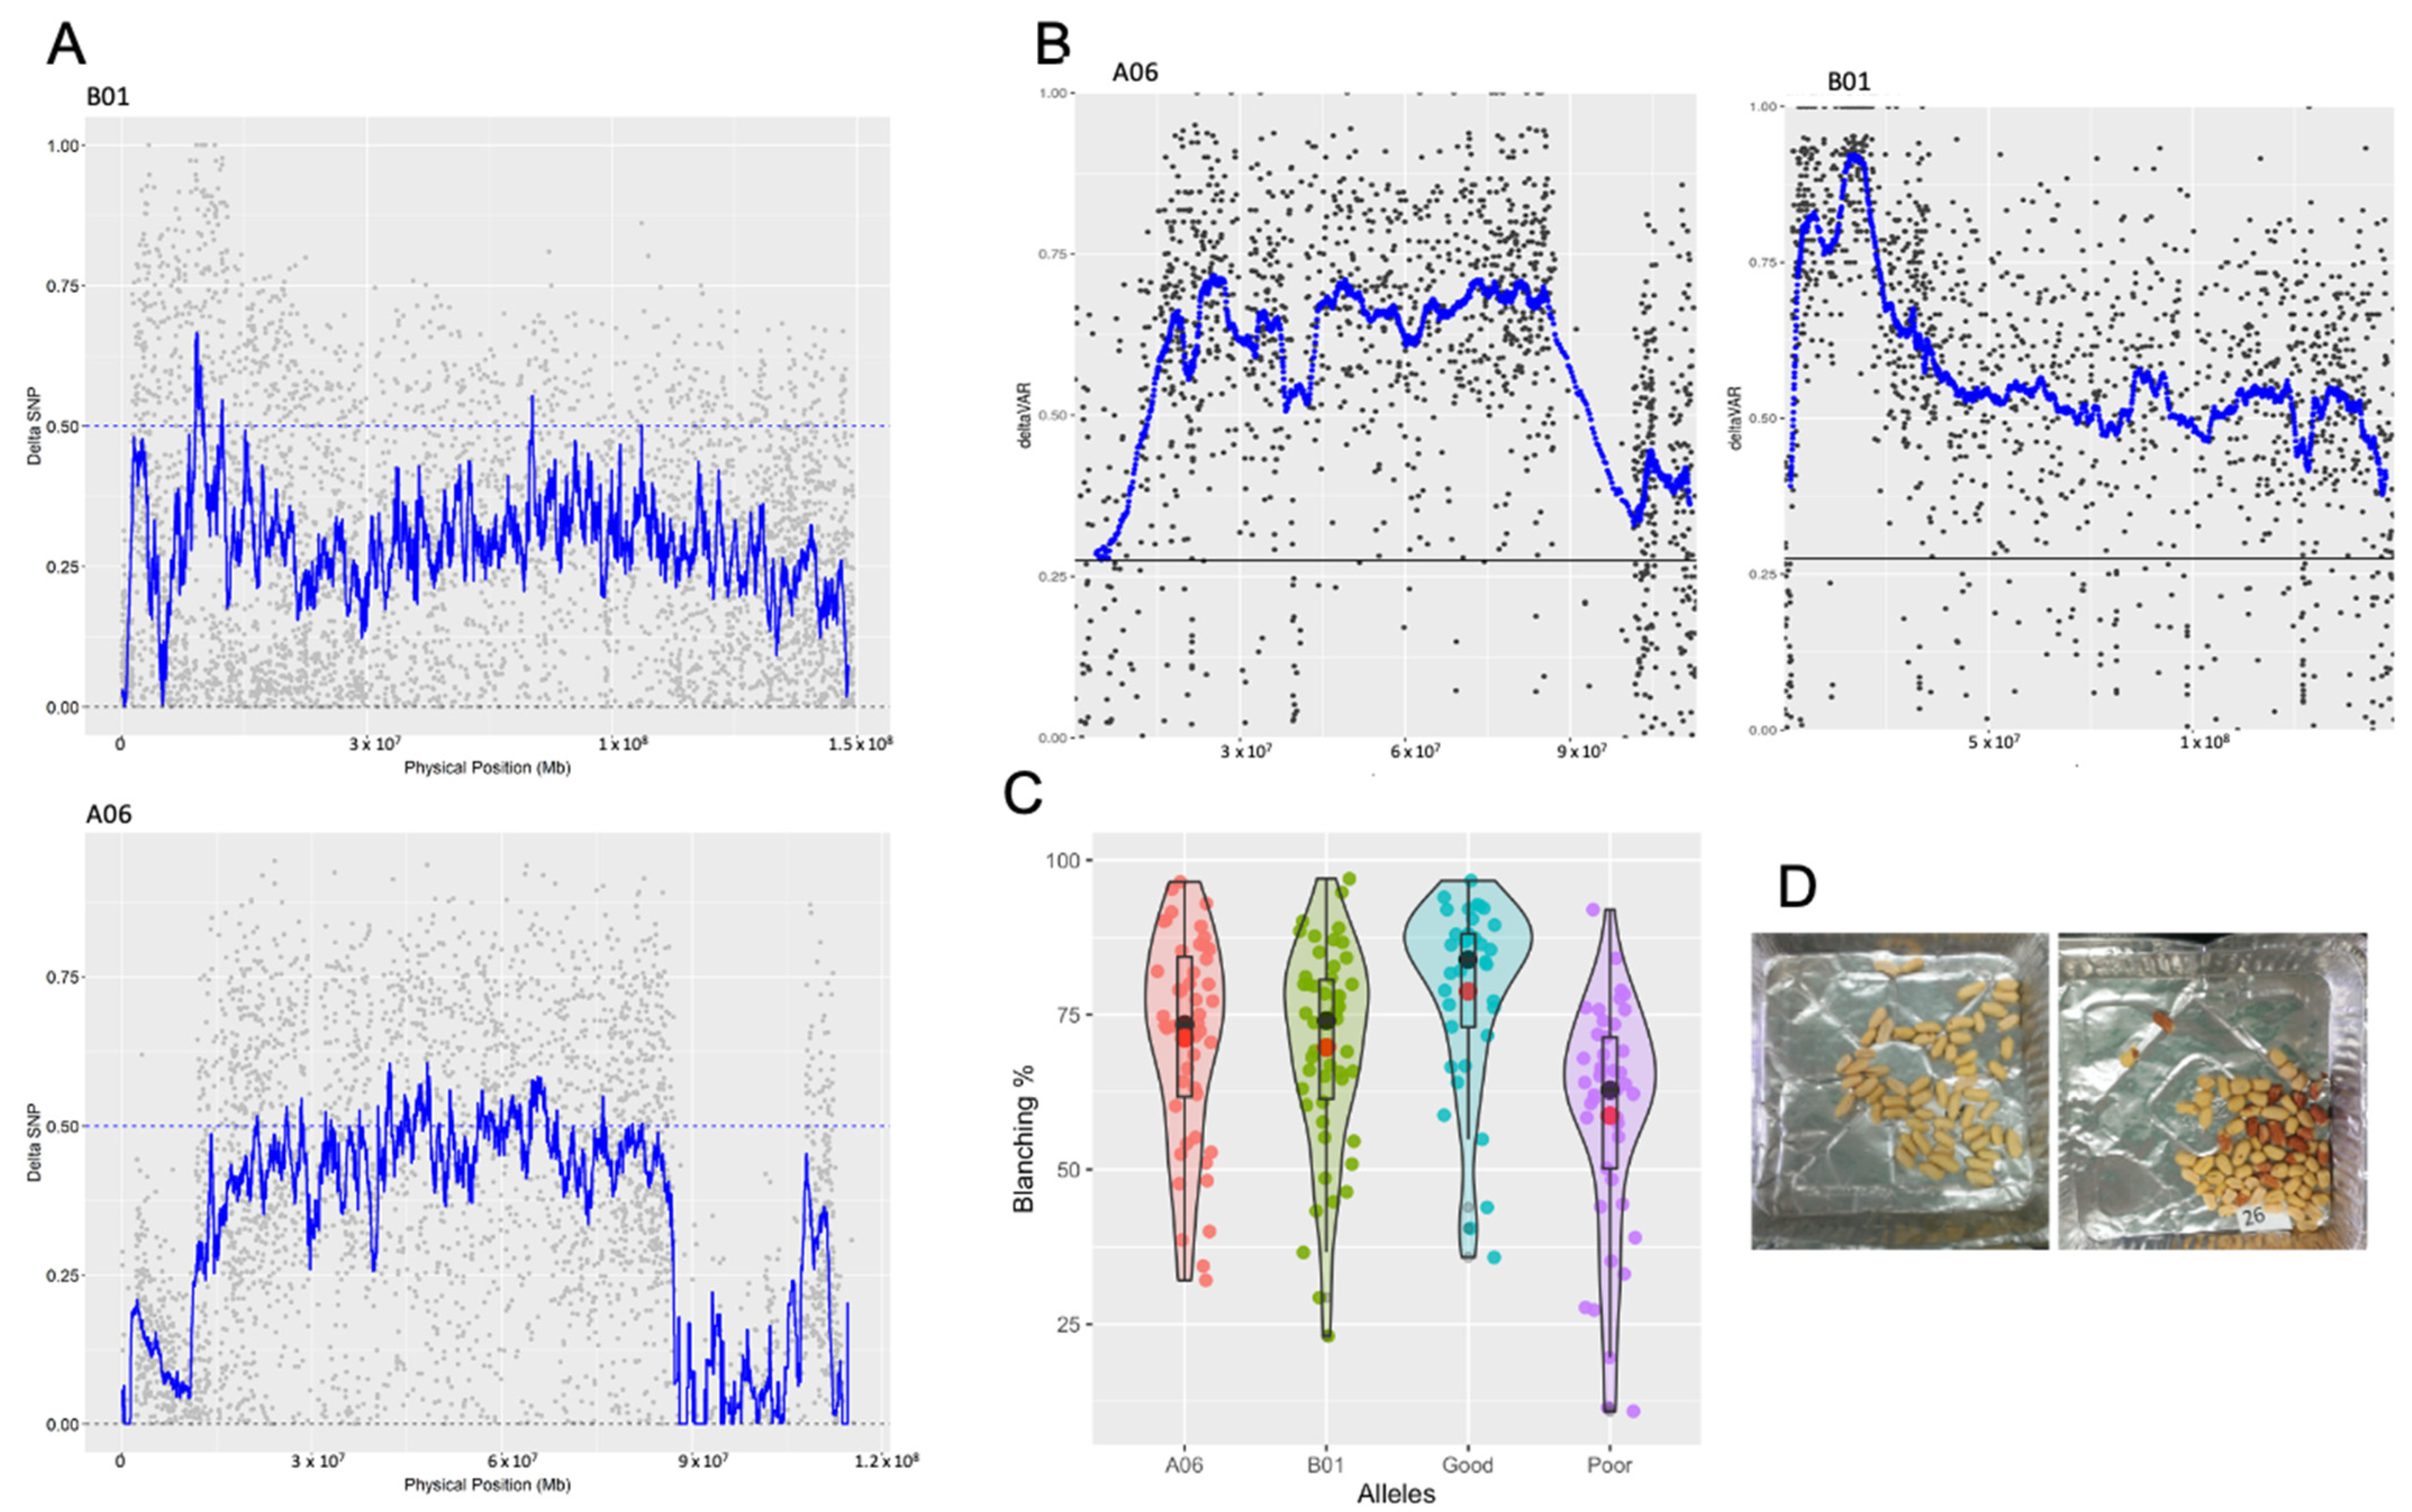
3.1. Blanchability QTL-seq

To identify QTLs associated with blanchability in peanut, we sequenced two bulks of breeding lines from three populations with related parents (Table 1). The parents with high blanching percentage were Walter and Redvale and the low blanching parents were Sutherland and a sister line of Sutherland [28]. Redvale is a selection from a cross with Walter as a parent. We first analyzed the data by calling parent-specific SNPs by re-sequencing Walter, Redvale, and Sutherland and identifying SNPs where Walter and Redvale shared an allele and Sutherland had an alternate allele. We used these SNPs to analyze the QTL-seq dataset and identified two QTLs on chromosomes A06 and B11 (Figure 1A). Markers were developed from the most significant SNPs within the identified peaks on A06 and B11. We next used a recombinant inbred line (RIL) population to validate the putative QTL. The parents of the population are Sutherland (poor blancher; 74.5%) and Middleton (good blancher; 89%). Middleton is not related to Walter or Redvale and so represents a good source to test the markers in unrelated populations where blanching is segregating. Both markers could select for increased blanching percentage in an unrelated RIL population, with A06 having a stronger effect (F = 6.73; df = 176; RANK ANOVA p = 0.0002; Kruskal p = 0.0003; Effect 9.8%; Median = 73.4%; R2 = 10.3%) than B11 (F = 3.5; df = 176; RANK ANOVA p = 0.01; Kruskal p = 0.005; Effect 8.03%; Median = 74%; R2 = 5.6%). The two markers combined were additive (F = 5; df = 176; RANK ANOVA p < 0.0001; Effect 19.7%; Median = 76.9%; R2 = 14.8%). The lsmean estimate when both alleles are beneficial is 79.3%, and when both alleles are non-beneficial is 59.6%. Selecting with the two markers shifts the median blanching percentage from 62.8% to 83.9% (21% increase).
We used Khufu (https://www.hudsonalpha.org/khufudata/, accessed on 28 Ocotber 2021) to re-analyze the blanching QTL-seq dataset using de novo discovered SNPs from the bulk data (Figure 1B). The QTL on A06 has a stronger signal overall with the smoothed average above 0.6 with Khufu compared to 0.5 using parental sequence. The QTL on B11 is much stronger with the peak smoothed average reaching 0.85 compared to 0.65 using parental data. The results support that QTL-seq can be analyzed straight from bulk sequence even in crops with complex genomes, without the need to generate parental sequence when suitable informatic pipelines are utilized.

3.2. Linkage Drag from Wild Introgressions

Sutherland is known to have introgressions on chromosomes A02 and A03 derived from Arachis cardenasii [35]. The lines that were chosen from QTL-seq should have inherited these introgressions independent of their blanching percentage. However, there were two peaks on chromosome A02 that corresponded to the introgressed regions (Figure 2A). The RIL population used for validation was also genotyped using a 10 SNP chip that assayed the introgressions. Initially, we used only those lines without introgressions in the RIL population for validation (Figure 1; 180 lines). On their own, the introgressions on the top of A02 and the bottom of A03 significantly affect blanching percentage (Figure 2B and Table 2). Selecting against the introgressions raises the mean and median blanching percentage by 10.7% and 11.6%, respectively (Table 2 and Figure 2C). If the introgressions are not taken into account and selection in the population is just with the A. hypogaea QTL identified in this study, the effect is lessened. Finally, the QTL on B01 and A06 only have a small effect if selecting in a population that has both introgressions fixed (Table 2 and Figure 2D).

3.3. Improving QTL-seq Analysis in Polyploid Crops

There are two current methods that are employed to analyze QTL-seq data in polyploid crops, with a special focus on peanut. One is to use a specialized pipeline to identify high quality SNPs from the parental sequence, as in Cui et al., (2020) [26] and Clevenger et al., (2018) [18]. The other is to use parental sequence to generate population-specific reference genomes and then analyze the QTL-seq data using those modified genomes while filtering for high quality, uniquely mapping reads, and depth. Both methods were successful in identifying significant QTL, although the noise in the data obscured the genetic structure of the loci. Further, sequencing parents to high coverage depth incurs additional substantial cost and requires the use of biparental populations where the parents are known and available.
Cui et al., (2020) [26] used QTL-seq to identify QTLs contributing to stem rot resistance in the field in peanut. From stem rot bulks sequenced to high depth (>40 × genome coverage), there were two QTLs identified on chromosomes A05 and A01 that could explain about 21% of the variance observed. The strategy used in Cui et al., (2020) [26] was to identify putative parental SNPs from the parental sequence (using the polyploid-specific pipeline SWEEP [18]) that were then used in the bulks to calculate allele frequency. Using Khufu, we analyzed the same bulk sequence de novo and identified the peaks on chromosomes A01 and A05 (Figure S1). Khufu identified two additional peaks on chromosomes A04 and A07 that were not identified previously (Figure S2). We developed kompetitive allele specific PCR (KASP) markers to assay the new QTL on A04 in the validation populations used in Cui et al., (2020) [26]. These markers were able to increase the ability to select for stem rot resistance (Figure S2). The QTL on A07 was also identified in Luo et al., (2020) [37].
To test the feasibility of using lower coverage sequence data, we re-analyzed a QTL-seq dataset focused on late leaf spot resistance in peanut where the bulks were sequenced to approximately 10× genome coverage [18]. Khufu successfully identified the three QTL de novo from bulk sequence that were validated in Clevenger et al., (2018) [18] and Chu et al., (2019) [38] (Figure S3). The QTL on B03 (on Arachis hypogaea known as B13) has a clear peak in the Khufu analysis indicating potential to develop more tightly linked markers to resistance.
Pandey et al., (2020) [39] used QTL-seq to identify QTLs associated with fresh seed dormancy in peanut. Using Khufu, we identified those same QTLs de novo from the bulked sequence (Figure S4). As was the case with the stem rot dataset, the Khufu peaks had a higher smoothed average on chromosome B05, reaching 0.75 in the region from which Pandey and colleagues (2020) [39] developed a marker to select for the trait. Zhao and colleagues (2020) [20] used QTL-seq to identify a candidate gene for purple testa color in peanut on chromosome A10 using the parental sequence to analyze the bulk sequence data. Without the parental sequence, Khufu identified the same QTL and the predicted peak region (107,280,934 to 110,087,506) contained the most likely candidate gene which was functionally shown to control anthocyanin accumulation in tobacco [20] (Figure S5).
Bertioli et al., (2020) [40] estimated that the rate of polymorphism between two peanut accessions is, on average, 1 SNP per 10,000 bp by comparing two reference-quality genome sequences. One advantageous aspect of QTL-seq is the theoretical ability to have access to all SNP polymorphisms segregating in the population. The result is that the SNP or group of SNPs that are most closely linked to the functional variation (or are the functional variation) are available. In contrast, the probability that a SNP array with fixed markers includes the most closely linked SNPs is low and decreases with low throughput marker types. Khufu identified 244,329 SNPs in the dormancy dataset (1 SNP per 10,395 bp), 372,611 SNPs in the stem rot dataset (1 SNP per 6816 bp), and 225,029 SNPs in the purple testa dataset (1 SNP per 11,287 bp). The number of SNPs Khufu filtering identifies de novo from the bulk sequences is within the estimate of polymorphic SNPs between any two A. hypogaea accessions. The filtering procedure of Khufu should be applicable for other genotyping applications using short reads in crops with complex genomes.

3.4. Potential for Genotyping Using Skim Sequencing

For crops with large, complex genomes, genotyping large populations still relies heavily on fixed SNP arrays. These arrays are incredibly useful, yet suffer from ascertainment bias. Reduced representation methods allow de novo SNP discovery yet only access a small portion of the genome. The accuracy of profiling SNPs within bulked samples should be useful for genotyping applications using sequencing. As a reference set of SNPs, we identified variants by comparing two published peanut genomes, Tifrunner [41], and Shitouqi [42]. Using Illumina sequencing of the two genotypes that were sequenced, we called SNPs using Khufu at different depths of coverage (Table S1). Across all levels of depth, Khufu calls alleles with more than 99% accuracy (according to the allele in the reference genome sequence). Above 10× coverage, Khufu identifies more than 95% of the SNPs. At lower coverage, Khufu identifies more than 71% at 5× coverage and 46% at 3×.
We tested if it were possible to identify de novo SNPs in the parents of a population sequenced at 10× coverage and then call alleles in the progeny sequenced at 1× or even 0.5× coverage (Table S2). At 1× coverage, 27% of the possible SNPs could be called at 100% allele accuracy. At 0.5× coverage, 14% of possible SNPs could be called at 100% allele accuracy. With an estimate of 1 SNP per 10 kilobases polymorphic between any two peanut accessions, we can expect to call an average 67,000 SNPs with 1× coverage and 37,500 with 0.5× coverage. This represents genome-wide distribution of markers.
Finally, we analyzed a RIL population that was genotyped using WGS re-sequencing [43]. Using 5× coverage WGS of the progeny, Agarwal and colleagues mapped 11,106 SNPs using SWEEP_GOLD (https://github.com/w-korani/SWEEP_GOLD, accessed on 28 Ocotber 2021). Using Khufu, we identified and called 86,987 SNPs in the progeny after down sampling to <3× coverage. Analysis of physical maps color-coded for parental allele illustrates the accuracy of Khufu at low coverages (Figure S6).

3.5. Future Considerations for QTL-seq Using Low Coverage Sequence Data

Analysis of sequence data in tetraploid peanut has been difficult and relied on specialized pipelines [25,44]. Accurate analysis of low coverage sequencing data for a polyploid crop such as peanut has not been viable until now. We were intrigued by the possibility of thinking about QTL-seq in a different way. The process of sequencing a bulk of 20 individuals to 20× genome coverage is akin to computationally bulking 20 fastq files that were sequenced to 1× genome coverage. If then, in a population of 300 individuals that was segregating strongly for multiple traits, each individual was sequenced to 1× coverage, QTL-seq could be carried out for all of the traits at once. We tested this concept using the RIL population from Agarwal et al., (2019) [43]. We used bulks representing 10, 20, 30, and 40% of the population (Figure 3). We successfully identified the TSWV (tomato spotted wilt virus) QTL on chromosome A01 with high resolution. The signal was most strong with the smaller bulks, but the variance and noise were very low when bulking 40%.

4. Conclusions

Blanchability is an important processing trait for peanut. There is a considerable energy requirement and significant additional costs to remove seed coats from poor blanching varieties as a result of lost kernels during processing and sorting. In contrast, if the processing application requires skin, it would be beneficial to utilize varieties that are resistant to blanching. As a breeding target, blanchability presents a challenge in that it is labor intensive and requires a large seed input which precludes testing at early generations. These considerations make blanchability an excellent target for marker assisted selection. In this study, we identified two strong QTL for blanchability and validated them in an independent population. Markers selecting for these QTL are available for breeding programs. We discovered linkage drag associated with two prominent A. cardenasii introgressions that confer disease resistance and also increase blanching resistance. Although for many applications this would be deleterious, it presents a unique opportunity to develop disease resistant and blanching resistant cultivars that are uniquely suitable for confectionery. Finally, we highlight the power of low coverage sequencing of whole populations to carry out QTL-seq experiments instead of using sequenced bulks.

Supplementary Materials

The following are available online at https://www.mdpi.com/article/10.3390/agronomy11112201/s1, Figure S1: (A) Original dSNP plots from Cui et al., 2020, where SNPs were identified from parental sequence first and then assayed in the bulks (B) dSNP plots from khufu showing more clear identification of QTLs without parental sequence; Figure S2: Validation of additional minor QTLs identified. Top—Additional potential QTLs identified by Khufu on A04 and A07. Bottom—Two measures of stem rot resistance in a population grouped by the putative beneficial (R) allele and susceptible (S) allele in the QTL region on A04 (red are individuals with the R allele, green are heterozygous, and blue have the S allele). WMCP represents the percentage of plants in a plot with a stem rot rating of 0 or 1 (no symptoms or one small lesion). WMA represents a disease score (0–10) of inoculated plants where 0 is no symptoms and 10 is a deceased plant. Scores are LSMeans from three years of data (2013, 2014, 2015) and three replicates per year. More information on the population and phenotypes available in Cui et al., 2019. For the WMCP trait, the QTL on A04 is significant using an ANOVA on ranks (F = 6.95; p = 0.001) and a Kruskal–Wallis non-parametric test (p = 0.001). For the WMA trait, the QTl on A04 is significant using an ANOVA (F = 3.16; p = 0.046) and a Kruskal–Wallis test (p = 0.036); Figure S3: Scatter plots from Clevenger et al., 2017, with validated QTL on A05 (05), B05 (now Arachis hypogaea B15), and B03 (now Arachis hypogaea B13) using the parental sequence. Khufu analysis straight from bulk sequence; Figure S4: Figure from Pandey et al., 2020, showing the identification of a QTL controlling fresh seed dormancy on chromosome B05 (15) using parental sequence as a guide. The same data analyzed de novo with Khufu. Additional QTL were identified on chromosome 10 (shown) and 9 which were not reported in Pandey et al., 2020; Figure S5: Figure from Zhao et al., 2020, showing the identification of a QTL controlling purple testa color on chromosome A10 (15) using parental sequence as a guide (left). The same data analyzed de novo with Khufu (right); Figure S6: Representative physical map of 133 RIL individuals. Shown is chromosome A01. Red represents parent 1 allele, yellow represents heterozygous, and blue represents parent 2 allele. White is missing data. Individuals are clustered by similarity for visualization. Alleles are unfiltered out of the Khufu pipeline other than missing data < 25%. Markers in order of physical position are rows and individuals are columns; Table S1: Accuracy of allele calls using Khufu at different depths. Using SNPs identified from comparing reference genome sequences as a validation set, Khufu was used to call alleles using Illumina data at different coverages; Table S2: Polymorphic SNPs were called between Tfrunner and Shitouqi using 10× coverage Illumina sequence. To simulate “progeny”, we downsampled the sequence to 0.5× and 1× coverage and called alleles based on the “parental” SNP sites; Table S3: KASPar marker sequence for Blanching percentage.

Author Contributions

W.K. and J.C. analyzed published datasets, developed Khufu, and drafted the manuscript. W.K. designed and wrote the code for the shiny application and for all modules of Khufu. Y.C. and P.O.-A. validated QTL, and revised the manuscript. C.C. and C.B. provided technical lab support. D.O. conceived and carried out the blanching experiments. B.G. provided some resources for validation. J.C. and G.W. conceived and supervised the project, secured funding, and revised the manuscript. All authors have read and agreed to the published version of the manuscript.

Funding

Funding was provided by the Grains Research and Development Corporation-GRDC, under the project ‘Australian Peanut Breeding Program—PCA00003’.

Institutional Review Board Statement

Not applicable.

Informed Consent Statement

Not applicable.

Data Availability Statement

R object files of blanching data of the full set, and 20X, 10X, and 5X subsets are included in the supplemental materials. Raw data fastq sequences of high and low bulks of blanching data are deposited at the NCBI (http://www.ncbi.nlm.nih.gov/, accessed on 28 Ocotber 2021) under BioProject PRJNA714121.

Acknowledgments

We acknowledge Justin N. Vaughn for discussing the methods used and reviewing the manuscript, and Mars-Wrigley for supporting J. Clevenger for a portion of the project. We also acknowledge Robert Henry, Agnello Furtado and RCN Rachaputi from the Queensland Alliance for Agriculture and Food Innovation (QAAFI) at the University of Queensland, Australia, for their preliminary work on development of blanching markers.

Conflicts of Interest

The authors declare no conflict of interest.

References

  1. Giovannoni, J.J.; Wing, R.A.; Ganal, M.W.; Tanksley, S.D. Isolation of molecular markers from specific chromosomal intervals using DNA pools from existing mapping populations. Nucleic Acids Res. 1991, 19, 6553–6558. [Google Scholar] [CrossRef] [PubMed] [Green Version]
  2. Michelmore, R.; Paran, I.; Kesseli, R.V. Identification of markers linked to disease-resistance genes by bulked segregant analysis: A rapid method to detect markers in specific genomic regions by using segregating populations. Proc. Natl. Acad. Sci. USA 1991, 88, 9828–9832. [Google Scholar] [CrossRef] [Green Version]
  3. Borevitz, J.O.; Liang, D.; Plouffe, D.; Chang, H.S.; Zhu, T.; Weigel, D.; Berry, C.C.; Winzeler, E.; Chory, J. Large-scale identification of single-feature polymorphisms in complex genomes. Genome Res. 2003, 13, 513–523. [Google Scholar] [CrossRef] [PubMed] [Green Version]
  4. Ehrenreich, I.M.; Torabi, N.; Jia, Y.; Kent, J.; Martis, S.; Shapiro, J.A.; Gresham, D.; Caudy, A.A.; Kruglyak, L. Dissection of genetically complex traits with extremely large pools of yeast segregants. Nature 2010, 464, 1039–1042. [Google Scholar] [CrossRef] [PubMed] [Green Version]
  5. Ossowski, S.; Schneeberger, K.; Clark, R.M.; Lanz, C.; Warthmann, N.; Weigel, D. Sequencing of natural strains of Arabidopsis thaliana with short reads. Genome Res. 2008, 18, 2024–2033. [Google Scholar] [CrossRef] [Green Version]
  6. Schneeberger, K.; Ossowski, S.; Lanz, C.; Juul, T.; Petersen, A.H.; Nielsen, K.L.; Jørgensen, J.E.; Weigel, D.; Andersen, S.U. SHOREmap: Simultaneous mapping and mutation identification by deep sequencing. Nat. Methods 2009, 6, 550–551. [Google Scholar] [CrossRef] [PubMed]
  7. Galvão, V.C.; Nordström, K.J.; Lanz, C.; Sulz, P.; Mathieu, J.; Posé, D.; Schmid, M.; Weigel, D.; Schneeberger, K. Synteny-based mapping-by-sequencing enabled by targeted enrichment. Plant J. Cell Mol. Biol. 2012, 71, 517–526. [Google Scholar] [CrossRef]
  8. Abe, A.; Kosugi, S.; Yoshida, K.; Natsume, S.; Takagi, H.; Kanzaki, H.; Matsumura, H.; Yoshida, K.; Mitsuoka, C.; Tamiru, M.; et al. Genome sequencing reveals agronomically important loci in rice using MutMap. Nat. Biotechnol. 2012, 30, 174–178. [Google Scholar] [CrossRef] [Green Version]
  9. Fekih, R.; Takagi, H.; Tamiru, M.; Abe, A.; Natsume, S.; Yaegashi, H.; Sharma, S.; Sharma, S.; Kanzaki, H.; Matsumura, H.; et al. MutMap+: Genetic mapping and mutant identification without crossing in rice. PLoS ONE 2013, 8, e68529. [Google Scholar] [CrossRef]
  10. Takagi, H.; Abe, A.; Yoshida, K.; Kosugi, S.; Natsume, S.; Mitsuoka, C.; Uemura, A.; Utsushi, H.; Tamiru, M.; Takuno, S.; et al. QTL-seq: Rapid mapping of quantitative trait loci in rice by whole genome resequencing of DNA from two bulked populations. Plant J. 2013, 74, 174–183. [Google Scholar] [CrossRef]
  11. Illa-Berenguer, E.; Van Houten, J.; Huang, Z.; van der Knaap, E. Rapid and reliable identification of tomato fruit weight and locule number loci by QTL-seq. Theor. Appl. Genet. 2015, 128, 1329–1342. [Google Scholar] [CrossRef] [PubMed]
  12. Das, S.; Upadhyaya, H.D.; Bajaj, D.; Kujur, A.; Badoni, S.; Laxmi Kumar, V.; Tripathi, S.; Gowda, C.L.; Sharma, S.; Singh, S.; et al. Deploying QTL-seq for rapid delineation of a potential candidate gene underlying major trait-associated QTL in chickpea. DNA Res. 2015, 22, 193–203. [Google Scholar] [CrossRef] [PubMed]
  13. Lu, H.; Lin, T.; Klein, J.; Wang, S.; Qi, J.; Zhou, Q.; Sun, J.; Zhang, Z.; Weng, Y.; Huang, S. QTL-seq identifies an early flowering QTL located near Flowering Locus T in cucumber. TAG Theor. Appl. Genet. 2014, 127, 1491–1499. [Google Scholar] [CrossRef] [PubMed]
  14. Wang, C.; Hai, J.; Yang, J.; Tian, J.; Chen, W.; Chen, T.; Luo, H.; Wang, H. Influence of leaf and silique photosynthesis on seeds yield and seeds oil quality of oilseed rape (Brassica napus L.). Eur. J. Agron. 2016, 74, 112–118. [Google Scholar] [CrossRef]
  15. Tamiru, M.; Natsume, S.; Takagi, H.; White, B.; Yaegashi, H.; Shimizu, M.; Yoshida, K.; Uemura, A.; Oikawa, K.; Abe, A.; et al. Genome sequencing of the staple food crop white Guinea yam enables the development of a molecular marker for sex determination. BMC Biol. 2017, 15, 86. [Google Scholar] [CrossRef] [Green Version]
  16. Gimode, W.; Clevenger, J.; McGregor, C. Fine-mapping of a major quantitative trait locus Qdff3-1 controlling flowering time in watermelon. Mol. Breed. 2020, 40, 3. [Google Scholar] [CrossRef]
  17. Pandey, M.K.; Khan, A.W.; Singh, V.K.; Vishwakarma, M.K.; Shasidhar, Y.; Kumar, V.; Garg, V.; Bhat, R.S.; Chitikineni, A.; Janila, P.; et al. QTL-seq approach identified genomic regions and diagnostic markers for rust and late leaf spot resistance in groundnut (Arachis hypogaea L.). Plant Biotechnol. J. 2017, 15, 927–941. [Google Scholar] [CrossRef] [Green Version]
  18. Clevenger, J.; Chu, Y.; Chavarro, C.; Botton, S.; Culbreath, A.; Isleib, T.G.; Holbrook, C.C.; Ozias-Akins, P. Mapping Late Leaf Spot Resistance in Peanut (Arachis hypogaea) Using QTL-seq Reveals Markers for Marker-Assisted Selection. Front. Plant Sci. 2018, 9, 83. [Google Scholar] [CrossRef] [Green Version]
  19. Kumar, R.; Janila, P.; Vishwakarma, M.K.; Khan, A.W.; Manohar, S.S.; Gangurde, S.S.; Variath, M.T.; Shasidhar, Y.; Pandey, M.K.; Varshney, R.K. Whole-genome resequencing-based QTL-seq identified candidate genes and molecular markers for fresh seed dormancy in groundnut. Plant Biotechnol. J. 2020, 18, 992–1003. [Google Scholar] [CrossRef]
  20. Zhao, Y.; Ma, J.; Li, M.; Deng, L.; Li, G.; Xia, H.; Zhao, S.; Hou, L.; Li, P.; Ma, C.; et al. Whole-genome resequencing-based QTL-seq identified AhTc1 gene encoding a R2R3-MYB transcription factor controlling peanut purple testa colour. Plant Biotechnol. J. 2020, 18, 96–105. [Google Scholar] [CrossRef] [Green Version]
  21. Schiessl, S.-V.; Katche, E.; Ihien, E.; Chawla, H.S.; Mason, A.S. The role of genomic structural variation in the genetic improvement of polyploid crops. Crop. J. 2019, 7, 127–140. [Google Scholar] [CrossRef]
  22. Alonge, M.; Wang, X.; Benoit, M.; Soyk, S.; Pereira, L.; Zhang, L.; Suresh, H.; Ramakrishnan, S.; Maumus, F.; Ciren, D.; et al. Major Impacts of Widespread Structural Variation on Gene Expression and Crop Improvement in Tomato. Cell 2020, 182, 145–161. [Google Scholar] [CrossRef] [PubMed]
  23. Günther, T.; Nettelblad, C. The presence and impact of reference bias on population genomic studies of prehistoric human populations. PLoS Genet. 2019, 15, e1008302. [Google Scholar] [CrossRef] [Green Version]
  24. Glover, N.M.; Redestig, H.; Dessimoz, C. Homoeologs: What Are They and How Do We Infer Them? Trends Plant Sci. 2016, 21, 609–621. [Google Scholar] [CrossRef] [PubMed] [Green Version]
  25. Clevenger, J.; Chavarro, C.; Pearl, S.A.; Ozias-Akins, P.; Jackson, S.A. Single Nucleotide Polymorphism Identification in Polyploids: A Review, Example, and Recommendations. Mol. Plant 2015, 8, 831–846. [Google Scholar] [CrossRef] [Green Version]
  26. Cui, R.; Clevenger, J.; Chu, Y.; Brenneman, T.; Isleib, T.G.; Holbrook, C.C.; Ozias-Akins, P. Quantitative trait loci sequencing—Derived molecular markers for selection of stem rot resistance in peanut. Crop. Sci. 2020, 60, 2008–2018. [Google Scholar] [CrossRef] [Green Version]
  27. Itoh, N.; Segawa, T.; Tamiru, M.; Abe, A.; Sakamoto, S.; Uemura, A.; Oikawa, K.; Kutsuzawa, H.; Koga, H.; Imamura, T.; et al. Next-generation sequencing-based bulked segregant analysis for QTL mapping in the heterozygous species Brassica rapa. Theor. Appl. Genet. 2019, 132, 2913–2925. [Google Scholar] [CrossRef] [PubMed]
  28. Wright, G.C.; Borgognone, M.G.; OConnor, D.J.; Rachaputi, R.C.N.; Henry, R.J.; Furtado, A.; Anglin, N.L.; Freischfresser, D.B. Breeding for improved blanchability in peanut: Phenotyping, genotype × environment interaction and selection. Crop. Pasture Sci. 2018, 69, 1237–1250. [Google Scholar] [CrossRef]
  29. Cruickshank, A.W.; Tonks, J.W.; Kelly, A.K. Blanchability of peanut (Arachis hypogaea L.) kernels: Early generation selection and genotype stability over three environments. Aust. J. Agric. Res. 2003, 54, 885–888. [Google Scholar] [CrossRef] [Green Version]
  30. Kovach, M.J.; McCouch, S.R. Leveraging natural diversity: Back through the bottleneck. Curr. Opin. Plant Biol. 2008, 11, 193–200. [Google Scholar] [CrossRef] [PubMed]
  31. Leal-Bertioli, S.C.; Cavalcante, U.; Gouvea, E.G.; Ballén-Taborda, C.; Shirasawa, K.; Guimarães, P.M.; Jackson, S.A.; Bertioli, D.J.; Moretzsohn, M.C. Identification of QTLs for Rust Resistance in the Peanut Wild Species Arachis magna and the Development of KASP Markers for Marker-Assisted Selection. G3 2015, 5, 1403–1413. [Google Scholar] [CrossRef] [PubMed] [Green Version]
  32. Ballén-Taborda, C.; Chu, Y.; Ozias-Akins, P.; Timper, P.; Holbrook, C.C.; Jackson, S.A.; Bertioli, D.J.; Leal-Bertioli, S.C.M. A new source of root-knot nematode resistance from Arachis stenosperma incorporated into allotetraploid peanut (Arachis hypogaea). Sci. Rep. 2019, 9, 17702. [Google Scholar] [CrossRef] [PubMed]
  33. Stalker, H. Utilizing Wild Species for Peanut Improvement. Crop. Sci. 2017, 57, 1102–1120. [Google Scholar] [CrossRef]
  34. Lamon, S.; Chu, Y.; Guimaraes, L.A.; Bertioli, D.J.; Leal-Bertioli, S.C.; Santos, J.F.; Godoy, I.J.; Culbreath, A.K.; Holbrook, C.C.; Ozias-Akins, P. Characterization of peanut lines with interspecific introgressions conferring late leaf spot resistance. Crop. Sci. 2021, 61, 1724–1738. [Google Scholar] [CrossRef]
  35. Bertioli, D.J.; Clevenger, J.; Godoy, I.; Stalker, T.; Santos, J.F.; Wood, S.; Abernathy, B.; Azevedo, V.; Campbell, J.; Chu, Y.; et al. Legacy genetics of Arachis cardenasii in the peanut crop. Proc. Natl. Acad. Sci. USA 2021, 118, e2104899118. [Google Scholar] [CrossRef] [PubMed]
  36. Khedikar, Y.P.; Gowda, M.V.; Sarvamangala, C.; Patgar, K.V.; Upadhyaya, H.D.; Varshney, R.K. A QTL study on late leaf spot and rust revealed one major QTL for molecular breeding for rust resistance in groundnut (Arachis hypogaea L.). Theor. Appl. Genet. 2010, 121, 971–984. [Google Scholar] [CrossRef] [PubMed] [Green Version]
  37. Luo, Z.; Cui, R.; Chavarro, C.; Tseng, Y.-C.; Zhou, H.; Peng, Z.; Chu, Y.; Yang, X.; Lopez, Y.; Tillman, B.; et al. Mapping quantitative trait loci (QTLs) and estimating the epistasis controlling stem rot resistance in cultivated peanut (Arachis hypogaea). Theor. Appl. Genet. 2020, 133, 1201–1212. [Google Scholar] [CrossRef] [PubMed]
  38. Chu, Y.; Chee, P.; Culbreath, A.; Isleib, T.G.; Holbrook, C.C.; Ozias-Akins, P. Major QTLs for Resistance to Early and Late Leaf Spot Diseases Are Identified on Chromosomes 3 and 5 in Peanut (Arachis hypogaea). Front. Plant Sci. 2019, 10, 883. [Google Scholar] [CrossRef] [PubMed]
  39. Pandey, M.K.; Pandey, A.K.; Kumar, R.; Nwosu, C.V.; Guo, B.; Wright, G.C.; Bhat, R.S.; Chen, X.; Bera, S.K.; Yuan, M.; et al. Translational genomics for achieving higher genetic gains in groundnut. Theor. Appl. Genet. 2020, 133, 1679–1702. [Google Scholar] [CrossRef] [PubMed] [Green Version]
  40. Bertioli, D.J.; Abernathy, B.; Seijo, G.; Clevenger, J.; Cannon, S. Evaluating two different models of peanut’s origin. Nat. Genet. 2020, 52, 557–559. [Google Scholar] [CrossRef]
  41. Bertioli, D.J.; Jenkins, J.; Clevenger, J.; Dudchenko, O.; Gao, D.; Seijo, G.; Leal-Bertioli, S.; Ren, L.; Farmer, A.D.; Pandey, M.K.; et al. The genome sequence of segmental allotetraploid peanut Arachis hypogaea. Nat. Genet. 2019, 51, 877–884. [Google Scholar] [CrossRef] [PubMed] [Green Version]
  42. Zhuang, W.; Chen, H.; Yang, M.; Wang, J.; Pandey, M.K.; Zhang, C.; Chang, W.C.; Zhang, L.; Zhang, X.; Tang, R.; et al. The genome of cultivated peanut provides insight into legume karyotypes, polyploid evolution and crop domestication. Nat. Genet. 2019, 51, 865–876. [Google Scholar] [CrossRef] [PubMed]
  43. Agarwal, G.; Clevenger, J.; Kale, S.M.; Wang, H.; Pandey, M.K.; Choudhary, D.; Yuan, M.; Wang, X.; Culbreath, A.K.; Holbrook, C.C.; et al. A recombination bin-map identified a major QTL for resistance to Tomato Spotted Wilt Virus in peanut (Arachis hypogaea). Sci. Rep. 2019, 9, 18246. [Google Scholar] [CrossRef] [PubMed]
  44. Korani, W.; Clevenger, J.P.; Chu, Y.; Ozias-Akins, P. Machine Learning as an Effective Method for Identifying True Single Nucleotide Polymorphisms in Polyploid Plants. Plant Genome 2019, 12. [Google Scholar] [CrossRef] [PubMed] [Green Version]
Figure 1. (A) Initial QTL-seq using parental sequence to identify SNPs for use in analyzing bulk sequence. Delta SNP—the difference in allele frequency between the good blanching bulk and the poor blanching bulk—is 0 to 1, where 1 is good blanching allele. (B) The same QTLs identified with Khufu de novo from bulk sequence. Because allele parentage is not discerned, delta SNP is set from 0 (equal frequency between bulks) to 1 (complete segregation between bulks). (C) Validation of markers in an independent RIL population. Violin/Jitter/Box plots show the blanching% of RILs with the high blanching allele at A06 only, B11 only, both A06 and B11, and both poor (low blanching) alleles. Black dots show median values, and red dots are the mean. Selecting for either marker alone is significant compared to selecting for both poor alleles, and selecting for the good blanching allele at both loci provides the highest blanching percentage and skews the distribution towards 100%. (D) Representative pictures of a good blanching sample (left) and a poor blanching sample (right).
Agronomy 11 02201 g001
Figure 2. Effect of wild introgressions on blanchability. (A) QTL-seq shows signal corresponding to two A. cardenasii introgressions on chromosome A02. Note, there is a gap of SNPs in the introgression on the top of the chromosome due to those reads being filtered out. The signal shows A. hypogaea alleles in strong linkage with the introgression. (B) Selecting for the introgressions negatively affects blanchability. 0—hypogaea allele; 1—cardenasii allele. (C) When selecting against the introgressions, the QTLs on A06 and B11 can select for increased blanchability. (D) When selecting for the introgressions, the QTLs on A06 and B11 have little to no effect on blanchability.
Agronomy 11 02201 g002
Figure 3. In silico bulking and QTL-seq analysis of TSWV resistance. A major QTL is identified on chromosome A01 (top). We tested bulking 10%, 20%, 30%, and 40% of the population (left to right). The bottom shows the same bulk percentages for a chromosome with no signal (A02). Notice the noise decreases significantly as bulk% increases.
Agronomy 11 02201 g003
Table 1. Phenotypes for selected lines for bulk sequencing.
GenotypeBlanchingPedigreeBulk
P24-p188-9355.4Tingoora × D147-p3-115Poor Blancher
P13-p07-21959.6Sutherland × WalterPoor Blancher
P24-p187/205-9771.5Tingoora × D147-p3-115Poor Blancher
P23-p157-6574.1Redvale × D147-p3-115Poor Blancher
P13-p45-23576.7Sutherland × WalterPoor Blancher
P23-p157-6484.0Redvale × D147-p3-115Good Blancher
P13-p23-23385.2Sutherland × WalterGood Blancher
P23-p153-6285.8Redvale × D147-p3-115Good Blancher
P13-p21-22391.0Sutherland × WalterGood Blancher
P23-p171-8591.0Redvale × D147-p3-115Good Blancher
Walter92.2 Good Blanching Parent
Redvale93.3Walter × D45-p37-102Good Blanching Parent
Sutherland *75.4 Poor Blanching Parent
* Data from 2019.
Table 2. Effect of A. cardenasii introgressions on blanching percentage.
A02A03A06 + B01Blanching (Lsmeans)Blanching (Median)Number of Individuals
carcarGood63.463.852
carhypGood68.070.460
hypcarGood69.571.138
hyphypGood74.378.992
carcarPoor56.560.427
carhypPoor60.96923
hypcarPoor57.767.212
hyphypPoor57.162.634
carcar-63.462.679
carhyp-68.069.283
hypcar-69.569.756
hyphyp-74.174.2126
Publisher’s Note: MDPI stays neutral with regard to jurisdictional claims in published maps and institutional affiliations.

