Article

Growth, Yield, Quality, and Phytochemical Behavior of Three Cultivars of Quinoa in Response to Moringa and Azolla Extracts under Organic Farming Conditions

by
Rasha S. El-Serafy
1,
Abdel-Nasser A. El-Sheshtawy
2,*,
Usama A. Abd El-Razek
3,
Ahmed F. Abd El-Hakim
4,
Mostafa M. A. Hasham
5,
Rokayya Sami
6,*,
Ebtihal Khojah
6 and
Amina A. M. Al-Mushhin
7
1
Horticulture Department, Faculty of Agriculture, Tanta University, Tanta 31527, Egypt
2
Environment and Bio-Agriculture Department, Faculty of Agriculture, Al-Azhar University, Cairo 11651, Egypt
3
Agronomy Department, Faculty of Agriculture, Tanta University, Tanta 31527, Egypt
4
Biochemistry Department, Faculty of Agriculture, Al-Azhar University, Cairo 11651, Egypt
5
Agronomy Department, Faculty of Agriculture, Al-Azhar University, Cairo 11651, Egypt
6
Department of Food Science and Nutrition, College of Sciences, Taif University, P.O. Box 11099, Taif 21944, Saudi Arabia
7
Department of Biology, College of Science and Humanities in Al-Kharj, Prince Sattam Bin Abdulaziz University, Al-Kharj 11942, Saudi Arabia
*
Authors to whom correspondence should be addressed.
Agronomy 2021, 11(11), 2186; https://doi.org/10.3390/agronomy11112186
Submission received: 27 September 2021 / Revised: 26 October 2021 / Accepted: 26 October 2021 / Published: 29 October 2021
(This article belongs to the Special Issue Application of Biostimulants and Bioeffectors on Crop Production)

Abstract

:
Increased demand for quinoa as a functional food has resulted in more quinoa-growing areas and initiatives to increase grain production, particularly in organic agriculture. Quinoa seeds are a superfood with incredible nutritional benefits. They are abundant in secondary metabolites with significant medicinal activity. This report was consequently performed to investigate whether Azolla fliculoides (AE) or moringa leaf extract (MLE) foliar spray can be supplemented as organic extracts to enhance quinoa growth and productivity under organic farming. Three quinoa cultivars, KVL–SRA2 (C1), Chipaya (C2), and Q–37 (C3), were grown organically and subjected to foliar spraying with AE or MLE at a 20% ratio, as well as their combination (AE+MLE). Plant performance of the three cultivars was significantly enhanced by MLE or AE applications as compared with control plants. The highest outputs were obtained by AE+MLE treatment, which significantly increased the seed yield by about 29% as compared with untreated plants. Seed quality exhibited a marked increase in response to AE+MLE that was superior in this regard as it showed higher protein, carbohydrates, saponine, tannins, phenolics, and flavonoids content. The C3-cultivar demonstrated the highest productivity, saponine, and flavonoids levels as compared to the other cultivars. Overall, the current study indicated that foliar spray with AE+MLE could enhance growth and productivity as well as quality and pharmaceutical active ingredients of quinoa cultivars grown under farming conditions.

1. Introduction

Quinoa (Chenopodium quinoa Willd) is an annual herb in the Chenopodiaceae family that is used as a functional food because of its high protein; essential amino acids, particularly lysine (5.1–6.4%) and methionine [1,2]; dietary fiber; nutrients (Ca, P, K, Fe, Zn, and Mg); and vitamins (A, B2, and E) [3]. Interestingly, quinoa grains contain small amounts of the important polyunsaturated fatty acids Omega-3 and Omega-6 [4] and are gluten-free. Quinoa has a high amount of pharmacological components, making it an effective anti-inflammatory, anticancer, antiviral, and antidepressant [5,6,7]. Additionally, quinoa seeds are used to lose weight and protect against coronary heart disease [8], as well as to lower blood sugar and insulin levels [9]. Saponins and tannins are the main antinutrients found in quinoa seeds [10]. Saponins are caused by the bitterness of quinoa seeds. The amount of saponins contained in quinoa seeds is controlled by environmental conditions and the cultivars [11,12]. Saponins are bioactive ingredients with analgesic, antiallergic, and antioxidant effects [13,14]. Additionally, quinoa has a small amount of tannins that give it an astringent taste and reduce its food palatability, but adequate processing may reduce saponin and tannin contents [11]. The unfavorable impression is caused by saponins’ and tannins’ ability to bind to proteins and macromolecules such as starch, lowering the nutritional value of food [10]. In quinoa seeds, the secondary metabolites of phenols and flavonoids have been classified. Phenolics enhance health by modulating carbohydrate and lipid metabolism, improving pancreas β-cell function, and stimulating insulin excretion [15]. Additionally, they have an essential role in attenuating hyperglycemia, dyslipidemia, and the resistance of insulin [16]. In addition, phenolics contribute to preventing the onset of noncommunicable diseases due to antioxidant, anti-inflammatory, and antiproliferative [17].
Quinoa originated in the Andean region, but by the end of the 1980s, it had expanded to 11 nations and had been introduced to Africa, North America, Europe, and Asia. Quinoa has a high level of resilience to a variety of common environmental stresses, including drought, frost, soil salinity, diseases, and pests [18]. It is a very important commercial crop because of the growing demand for it as a functional food [19]. The demand for organic crops, especially quinoa, has grown dramatically in developed nations. Organic quinoa prices were much higher and more appealing to businesses [19]. Under organic agriculture conditions, using organic extracts is an important subject for enhancing the growth and yield, altering phytochemical content [20], inducing crop physiology and biochemistry such as photosynthetic rate [21], enhancing antioxidant machinery [22], and improving root system development [23], subsequently improving nutrient uptake and use efficiency [24].
Nitrogen is a macro-element and has a critical role in plant growth and development [25]. Because of the necessity of N for maximum growth and optimal production, organic and biological sources of N form an essential strategy for increasing crop yields under organic farming practices. Azolla fliculoides Lam. is a free-floating fern native to the American continent [26] and has great importance as a biological source of N due to its ability to fix 30–60 kg N ha−1 [27,28,29,30]. Additionally, it is rich in phytohormones (auxins, cytocinins, and gibberellins), essential amino acids, protein, and vitamins and has high mineral content [28,31]. As a result, it can be used for enhancing crop production. Wheat and beet yields increased following Azolla treatments [32,33]. Azolla application caused an increase in olive output [34], eggplant yield [35], and squash fruits [36]. Urea required for rice and maize production decreased by 25% and 30% after Azolla supplementation [37,38].
Moringa leaf extract (MLE) is a promising organic extract in the agriculture field due to its high content of phytohormones, antioxidants, vitamins, and minerals [39,40,41,42]. It is used to improve plant development and yields in a wide range of crops [20,40,43,44,45], as well as to alleviate the adverse impact of biotic and abiotic stress [39,46,47,48]. MLE has a positive influence on endogenous phytohormone levels, which improves plant development and yield [46,49]. MLE enhanced chlorophyll and protein levels in spinach leaves [50], increased growth performance and yields of sweet basil [51], and improved nutrient levels in mandarin leaf [52].
Many scholars have reported about Azolla’s use as compost or soil supplementation, but there are very limited reports about the influences of AE foliar spray on plant performance and secondary metabolites accumulation or on proximate analysis, which could improve quinoa quality under organic agriculture. Therefore, the goal of this study was to evaluate the influences of AE or MLE and their combination on growth, yields, and changes in the proximate analysis as well as saponins, tannins, and phenolic compounds accumulation on three cultivars of quinoa grown under organic farming. The null hypothesis of the current study states that there is no difference between cultivars and the effects of AE or MLE and their combinations as well as their interactions against the alternative hypothesis which assumes that there are significant differences between the effects of using organic extracts in the cultivation of the studied quinoa cultivars and their interactions.

2. Materials and Methods

2.1. Experimental Site and Plant Material

The experiment was conducted in the Organic Farm of the Environment and Bio-Agriculture Department, Faculty of Agriculture, Al-Azhar University, Cairo, Egypt, (30°03′12″ N and 31°19′05.2″ E) in the winter seasons of 2018/2019 and 2019/2020. The meteorological data for the experimental area are presented in Table 1. Quinoa grains were obtained from the Plant Breeding Unit, Desert Research Center. Quinoa seeds of three cultivars were utilized. (1) KVL–SRA2, (C1) native to Denmark, has a red seed color, (2) Chipaya, (C2) native to the Altiplano Salares and Bolivia, has a mixed seed color (white and Paige), and (3) Q–37, (C3) native to Chile, has a light yellow seed color.

2.2. The Extracts Preparation

Azolla fliculoides Lam. plants were collected from Azolla plants grown on soil medium in a greenhouse at the Organic Farm of Environment and Bio-Agriculture Department. The plants were washed three times with water to eliminate any undesirable items before being spread out on blotting paper to absorb any surplus water. Fresh leaves of moringa trees (Moringa oleifera Lam.) grown in the Organic Farm of Environment and Bio–Agriculture Department were collected and were rinsed three times with water. The following procedures were used to make 20% aqueous extracts of Azolla (AE) and moringa (MLE): in a domestic blender, 100 g fresh material was blended with 500 mL distilled water for 15 min, and the extracts were filtered using a muslin cloth according to the procedure of Yasmeen et al. (2012) [53]. Tween–20 at 0.1% (v/v) was used as a surfactant. The chemical analysis of AE and MLE is presented in Table 2.

2.3. Experimental Design and Treatments

The field experiments were arranged in a split-plot design with three replicates. The main plots were quinoa cultivars, and the subplots were the organic extracts of AE, MLE, their combination (AE+MLE), and without extract (WE) as control. The subplot net area was 10.50 m2 (7 rows of 50 cm width and 3 m length) with plant spacing 20 cm (maximum 105 plants/each subplot). Compost at a rate of 25 ton ha1 was supplemented to the experimental soil during seedbed preparation. The physical and chemical analyses of compost were pH 8.2, EC (dSm1) 5.2, bulk density (g cm3) 0.23, organic carbon (%) 18.8, organic matter (%) 32.5, total N (%) 1.3, and C/N ratio 18.8:1.3. For both seasons, quinoa seeds were planted on 30 October. After three weeks, the seedlings were trimmed to a plant/hill ratio. Quinoa cultivars were foliar sprayed three times with 20% aqueous extracts of AE, MLE, and their combination using a backpack sprayer (Jacto® model PJH, Brazil), nozzle type cone (Jacto JCI 80 015), and pressure of 75 psi. Each subplot received 0.2 L (190 L ha−1) of the organic extract. The first addition was 30 days after sowing, the second was 15 days later, and the third was 15 days later. Control plants were foliarly sprayed with tap water at the same time as treatments. The physical properties of the experimental soil were sand, 60.18%; silt, 16.51%; and clay, 23.31%. The chemical properties were pH 7.8, EC 0.82 mmohs cm−1. N, P, and K content were 68.10, 7.41, and 259.20 mgL−1, respectively. Mg was 1.01 mmolc L1, CaCO3 was 3%, Ca+2 was 1.5 mmolc L1, and Na+ was 7.5 mmolc L1.

2.4. Growth Performance

From each sub plot, ten plant samples were randomly collected to determine the characteristics of plant height (cm), inflorescence number plant−1 (Info), and 1000-seed weight (TSW) (g). Additionally, the seed yield (SY) (kg ha−1), straw yield (StY) (kg ha−1), and biological yield (BY) (kg ha−1) were determined for each subplot, and the harvest index (HI) (%) was calculated (seed yield ÷ biological yield) × 100.

2.5. Leaf Pigments

Leaf pigments of quinoa leaves were determined according to Dere [54], and samples of cut leaf segments (0.5 g) were obtained and extracted with methanol (96%) to assess the chlorophyll (Chlo) and carotenoids (Caro) concentration and presented in mg g−1 FW.

2.6. Proximate Analysis of Quinoa Seeds

The proximate analysis of quinoa seeds was estimated according to AOAC (2000) [55]. The protein content (Pro) was measured using the traditional Micro-Kjeldhal digestion and distillation process, and the fat content (Fa) was analyzed using Soxhlet method. The ash content of the seeds sample was assessed using a Muffle furnace. The dietary fiber (Fi) in quinoa seeds was determined by the enzymatic–gravimetric method. Total carbohydrates (Carbo) were estimated usig the Weinmann [56] procedure. Nutritional energy (NE) was calculated according the following formula: Nutritional energy (Kcal) = 4 × (proteins % + carbohydrates %) + (9 × fats %).

2.7. Total Saponins

In order to determine saponin (Sa) content, 30 g of quinoa seeds were ground and separated over a water bath at 60 °C for 3 h with continuous stirring. On the basis of the weight, the ratio of water to grounded seeds was 15 to 1. The supernatant was filtered after centrifuging the extract, and then the extract was analyzed using reverse-phase–high-pressure liquid chromatography (RP–HPLC). Total saponin content was calculated as described by Martinez et al. [57] using the following formula: Total saponin (mg g−1 DW) = (weight of residue ÷ weight of sample taken).

2.8. Tannin Content

The analysis of tannin content (Ta) was carried out using Chanwitheesuk et al.’s [58] technique with minor modifications. In a 20 h incubation period, 0.5 g of the extract was blended at diethyl ether with a volume of 10 mL. The mixture was filtered after incubation, and the residue was heated in 100 mL distilled water for 2 h. After that, it was chilled and filtered. The filtrate was diluted with distilled water to 100 mL, and 0.1 mL of the solution was treated with 0.1 mL of Folin–Ciocalteu reagent. The mixture was vortexed, and then 2 mL of Na2CO3 was added and vortexed again. At room temperature, the blend was incubated for 30 min, and the absorbance was measured at 760 nm. The findings were estimated from a standard tannic acid curve made using the tannic acid. Total tannins concentration was measured in mg tannic acid g−1 DW [59].

2.9. Total Phenolic and Flavonoids Content

The Folin–Ciocalteu method was used to quantify total phenolics (Ph) in quinoa seeds using the gallic acid standard as reported by Boateng et al. [60] with minor modifications. Quinoa seeds (1 g) were crashed and mixed with 80% methanol at a volume of 50 mL and macerated for 48 h at room temperature. In order to determine phenolics content, the extract was maintained below 4 °C after solvents were fully removed. Leaf extract was combined with the Folin–Ciocalteu reagent at a ratio of 1 mL:1 mL and let to stand for incubation (5 min). After that, 2 mL of Na2CO3 solution (70 g L−1) was added. It was incubated at 25 °C for another 2 h. The absorbance was then determined at a wavelength of 750 nm. The phenolic content was measured in mg GAE g−1 DW. Total flavonoids (Fl) in quinoa seeds were estimated using the aluminum chloride technique by Boateng et al.’s and Talukdar’s [60,61] procedures. For 45 min, a combination of 0.5 mL of the sample and 0.5 mL of aluminum chloride (2%) was left at room temperature. The absorbance of the resultant combination was then measured at 420 nm. The flavonoids content is given in mg CAE g−1 DW, and the standard curve was calculated using catechin (CAE).

2.10. Statistical Analysis

The dataset of studied characters was collected and subjected to univariate and multivariate statistical analysis. The normality test for data was proceeded by the Shapiro–Wilk test. The combined analysis of variance (ANOVA) across two seasons was performed according to Gomez and Gomez [62] following homogeneity test of error variance using MSTAT statistical package. Duncan’s Multiple Range Test was used to do mean comparisons. Pooled data for traits across seasons, replications, cultivars, and foliar treatments used for correlation analysis and principal component analysis (PCA). Origin Pro 2021 (Origin Lab, Northampton, MA, USA) was employed for the elaboration of figures.

3. Results

3.1. Analysis of Variance

Analysis of variance for combined over seasons showed that there are highly significant differences within cultivars as well as within the organic extracts for all the studied traits (Table 3). Moreover, results in the same table show a significant interaction between the cultivars and the organic extracts in all traits except for chlorophyll (Chlo) and carotenoids (Caro) traits. The interaction between organic extracts and seasons was not significant except in the two traits of straw (StY) and biological yield (BY).
Regarding the percentages of variance of individual sources for the analysis of variance, the results in Table 4 show that the cultivars had the largest percentage of the total variance in the traits of SY, StY, BY, Pr, As, Fi, Sa, Ph, and Fl, while the organic extracts (OE) had the largest variance in PH, Info, TSW, HI, Chlo, Caro, and Fa traits but the C × OE interaction had the largest percentage of the variance in NE trait.
The biological yield showed a significant difference between seasons, although the seed and straw yields were not significant (Table 3). In terms of the percentage of variation in those traits, the variation in seasons was less than that of cultivars and organic extracts and their interactions, which indicates the weak effect of seasonal variation on those traits (Table 3). The lack of random variation between the two seasons may be due to the location, where the geography of the experiment was stable in the two seasons, and the climatic conditions did not differ between the two seasons. The percentage of variance of individual sources in the analysis variance was calculated for the combined analysis (Table 4), but it was not calculated for the analysis of variance for each season separately because there was no difference between seasons.
The analysis of variance for the 2018/2019 season showed that there were significant differences within the cultivars as well as within the organic extracts for all the studied traits (Table 5). Additionally, results in the same Table present a significant interaction between cultivars and the organic extracts in all traits except SY, Chlo, Caro, As, and Sa. The season of 2019/2020 had the same trend.

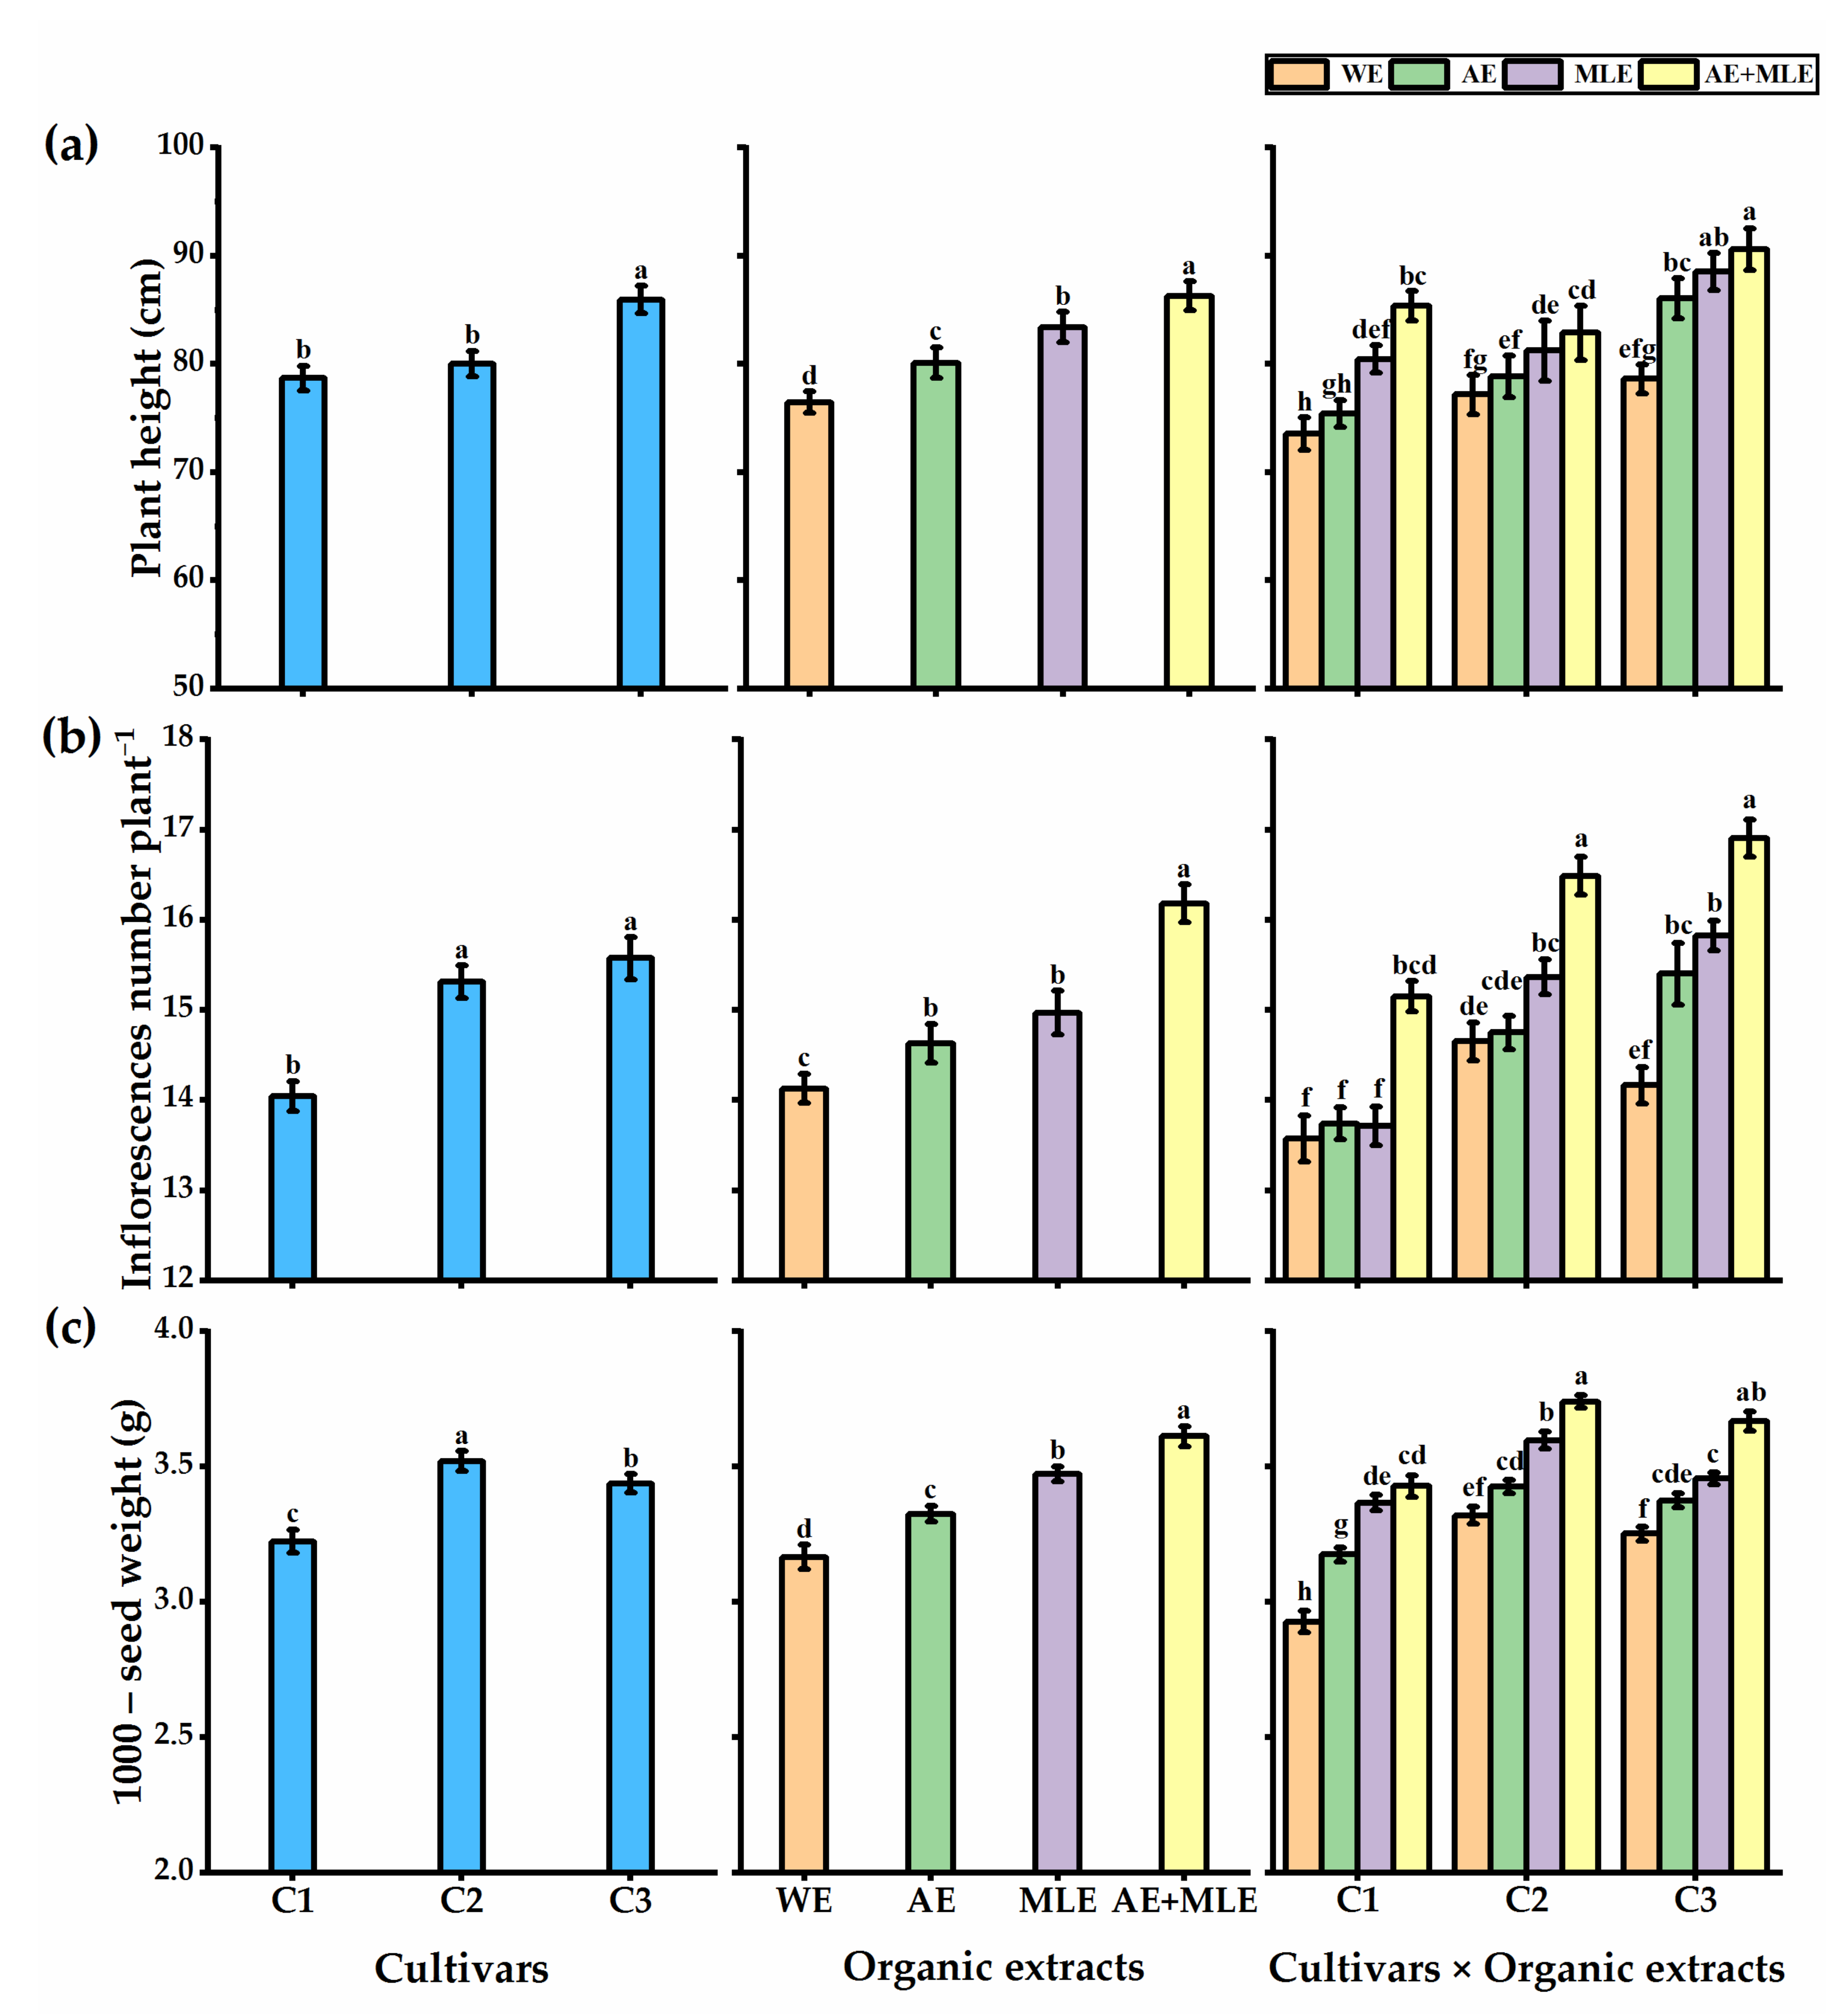
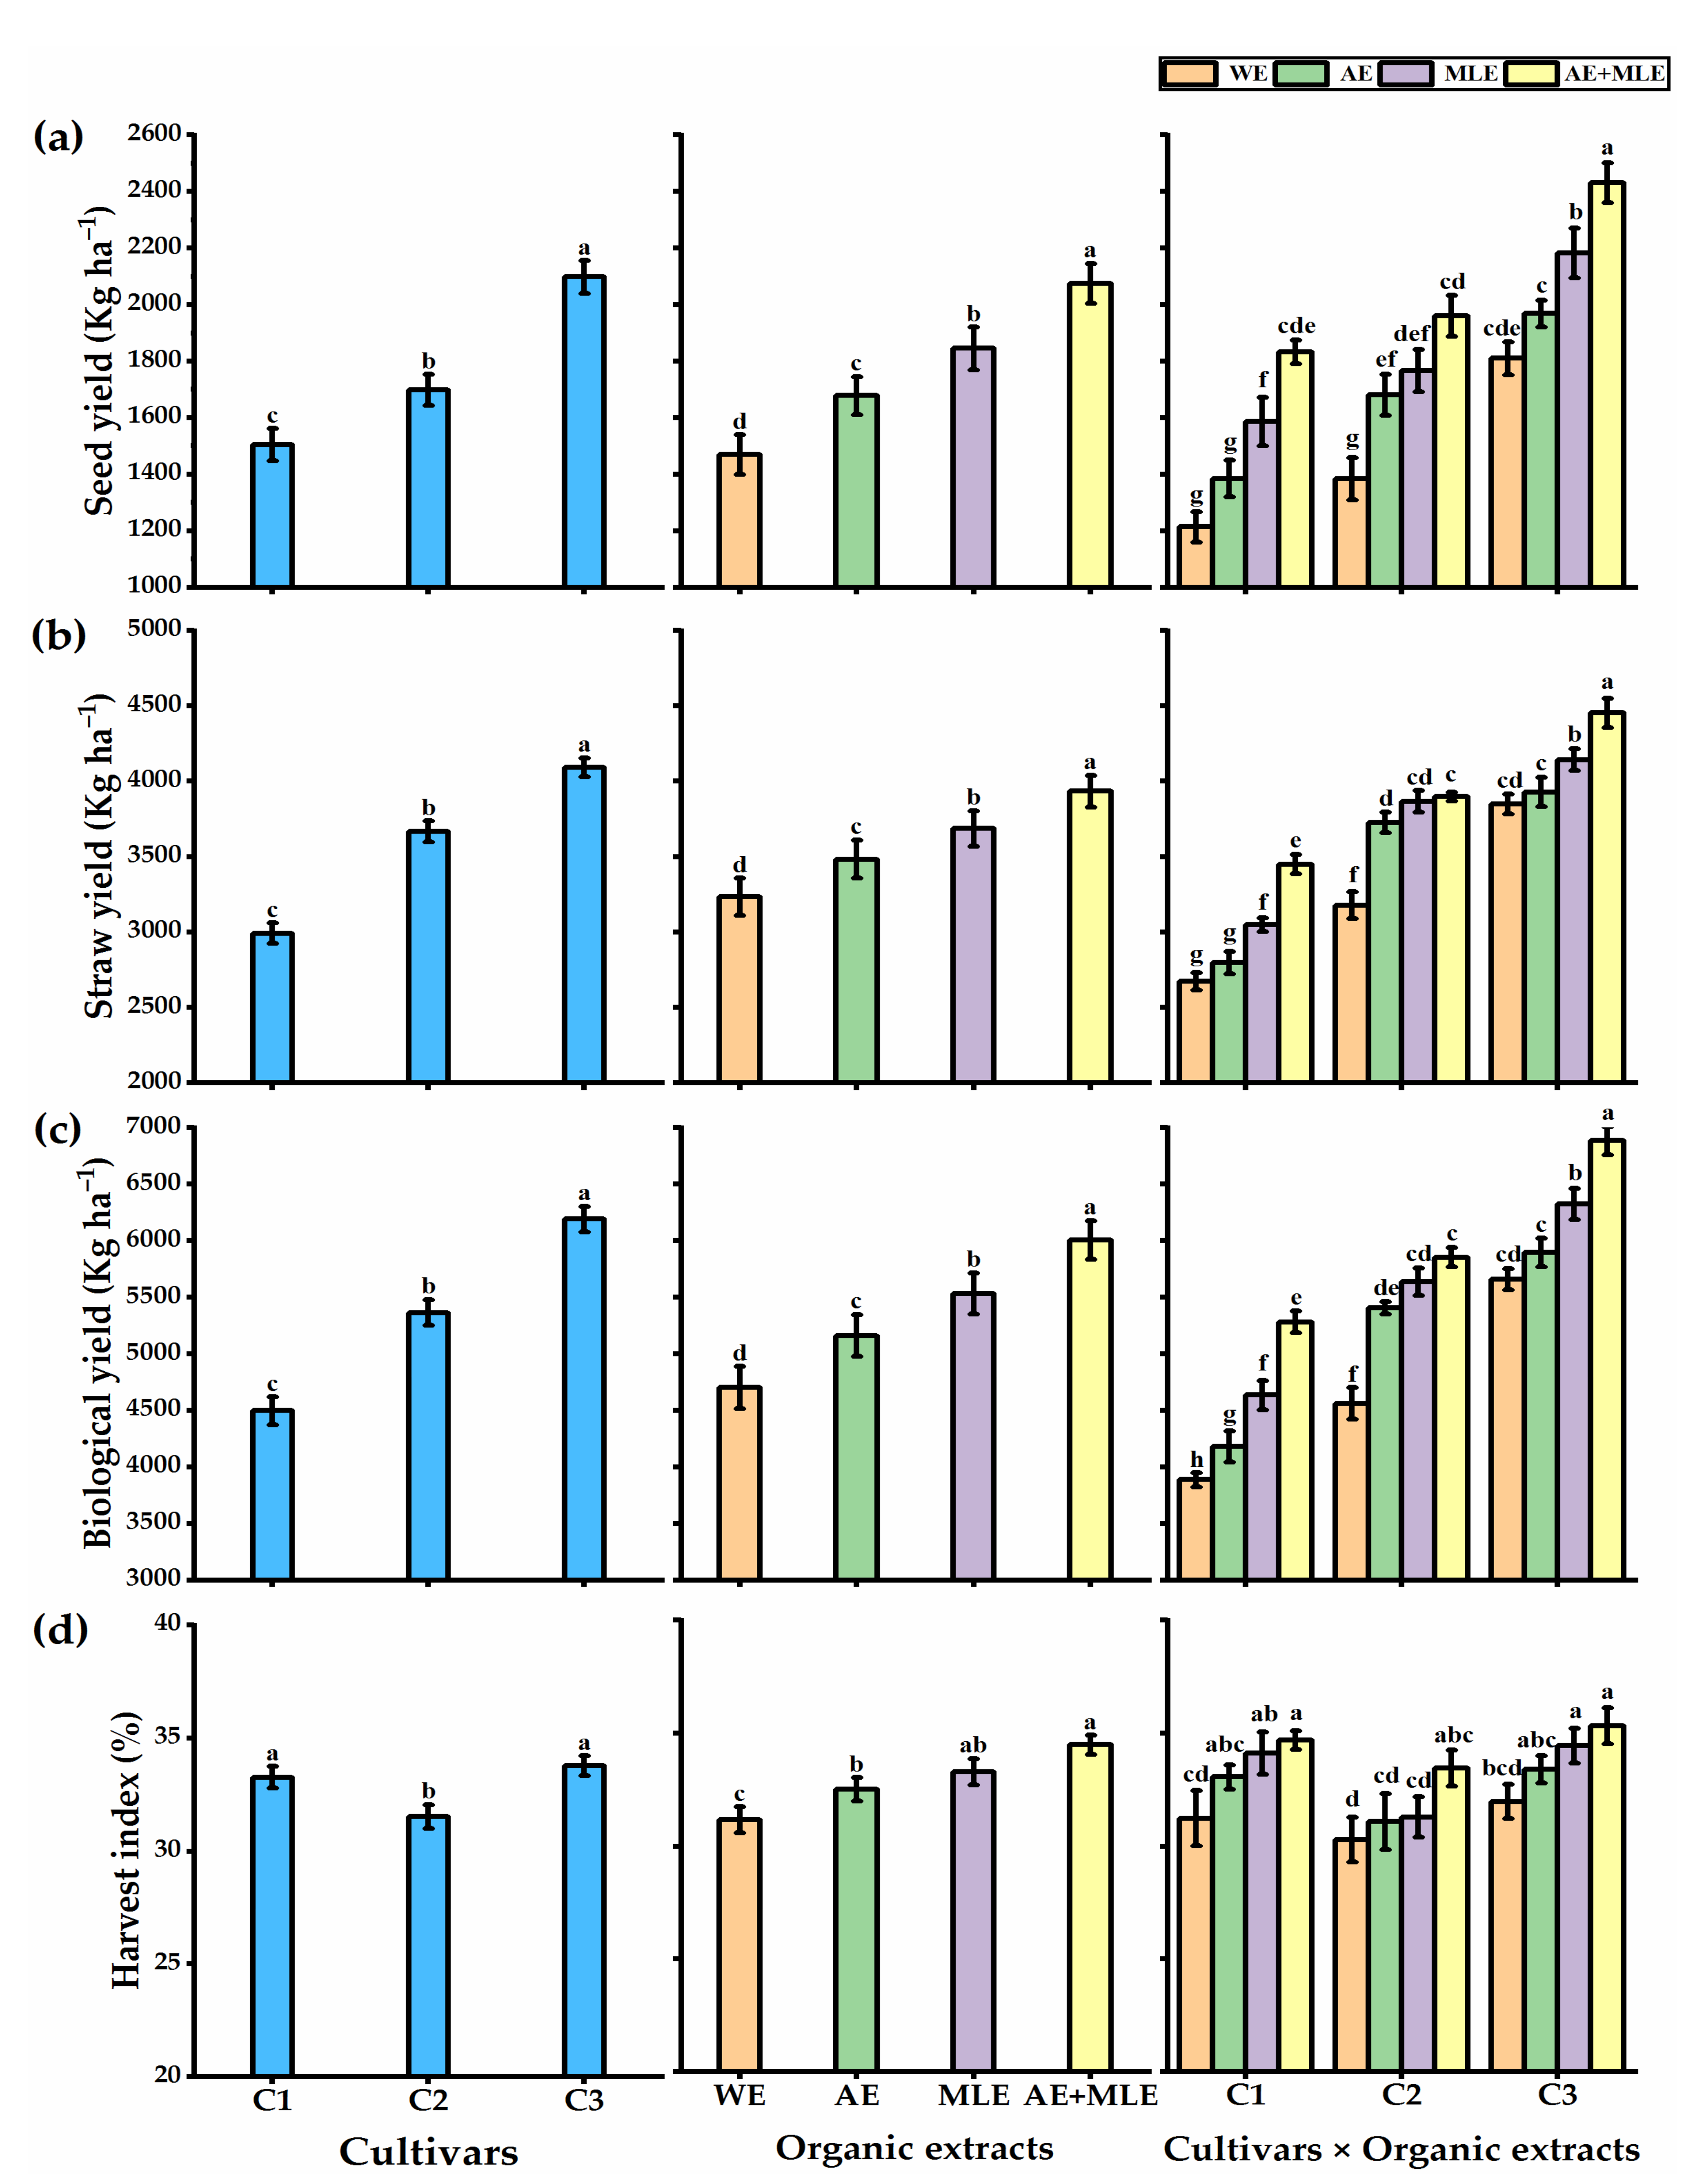
3.2. Growth Performance and Yields
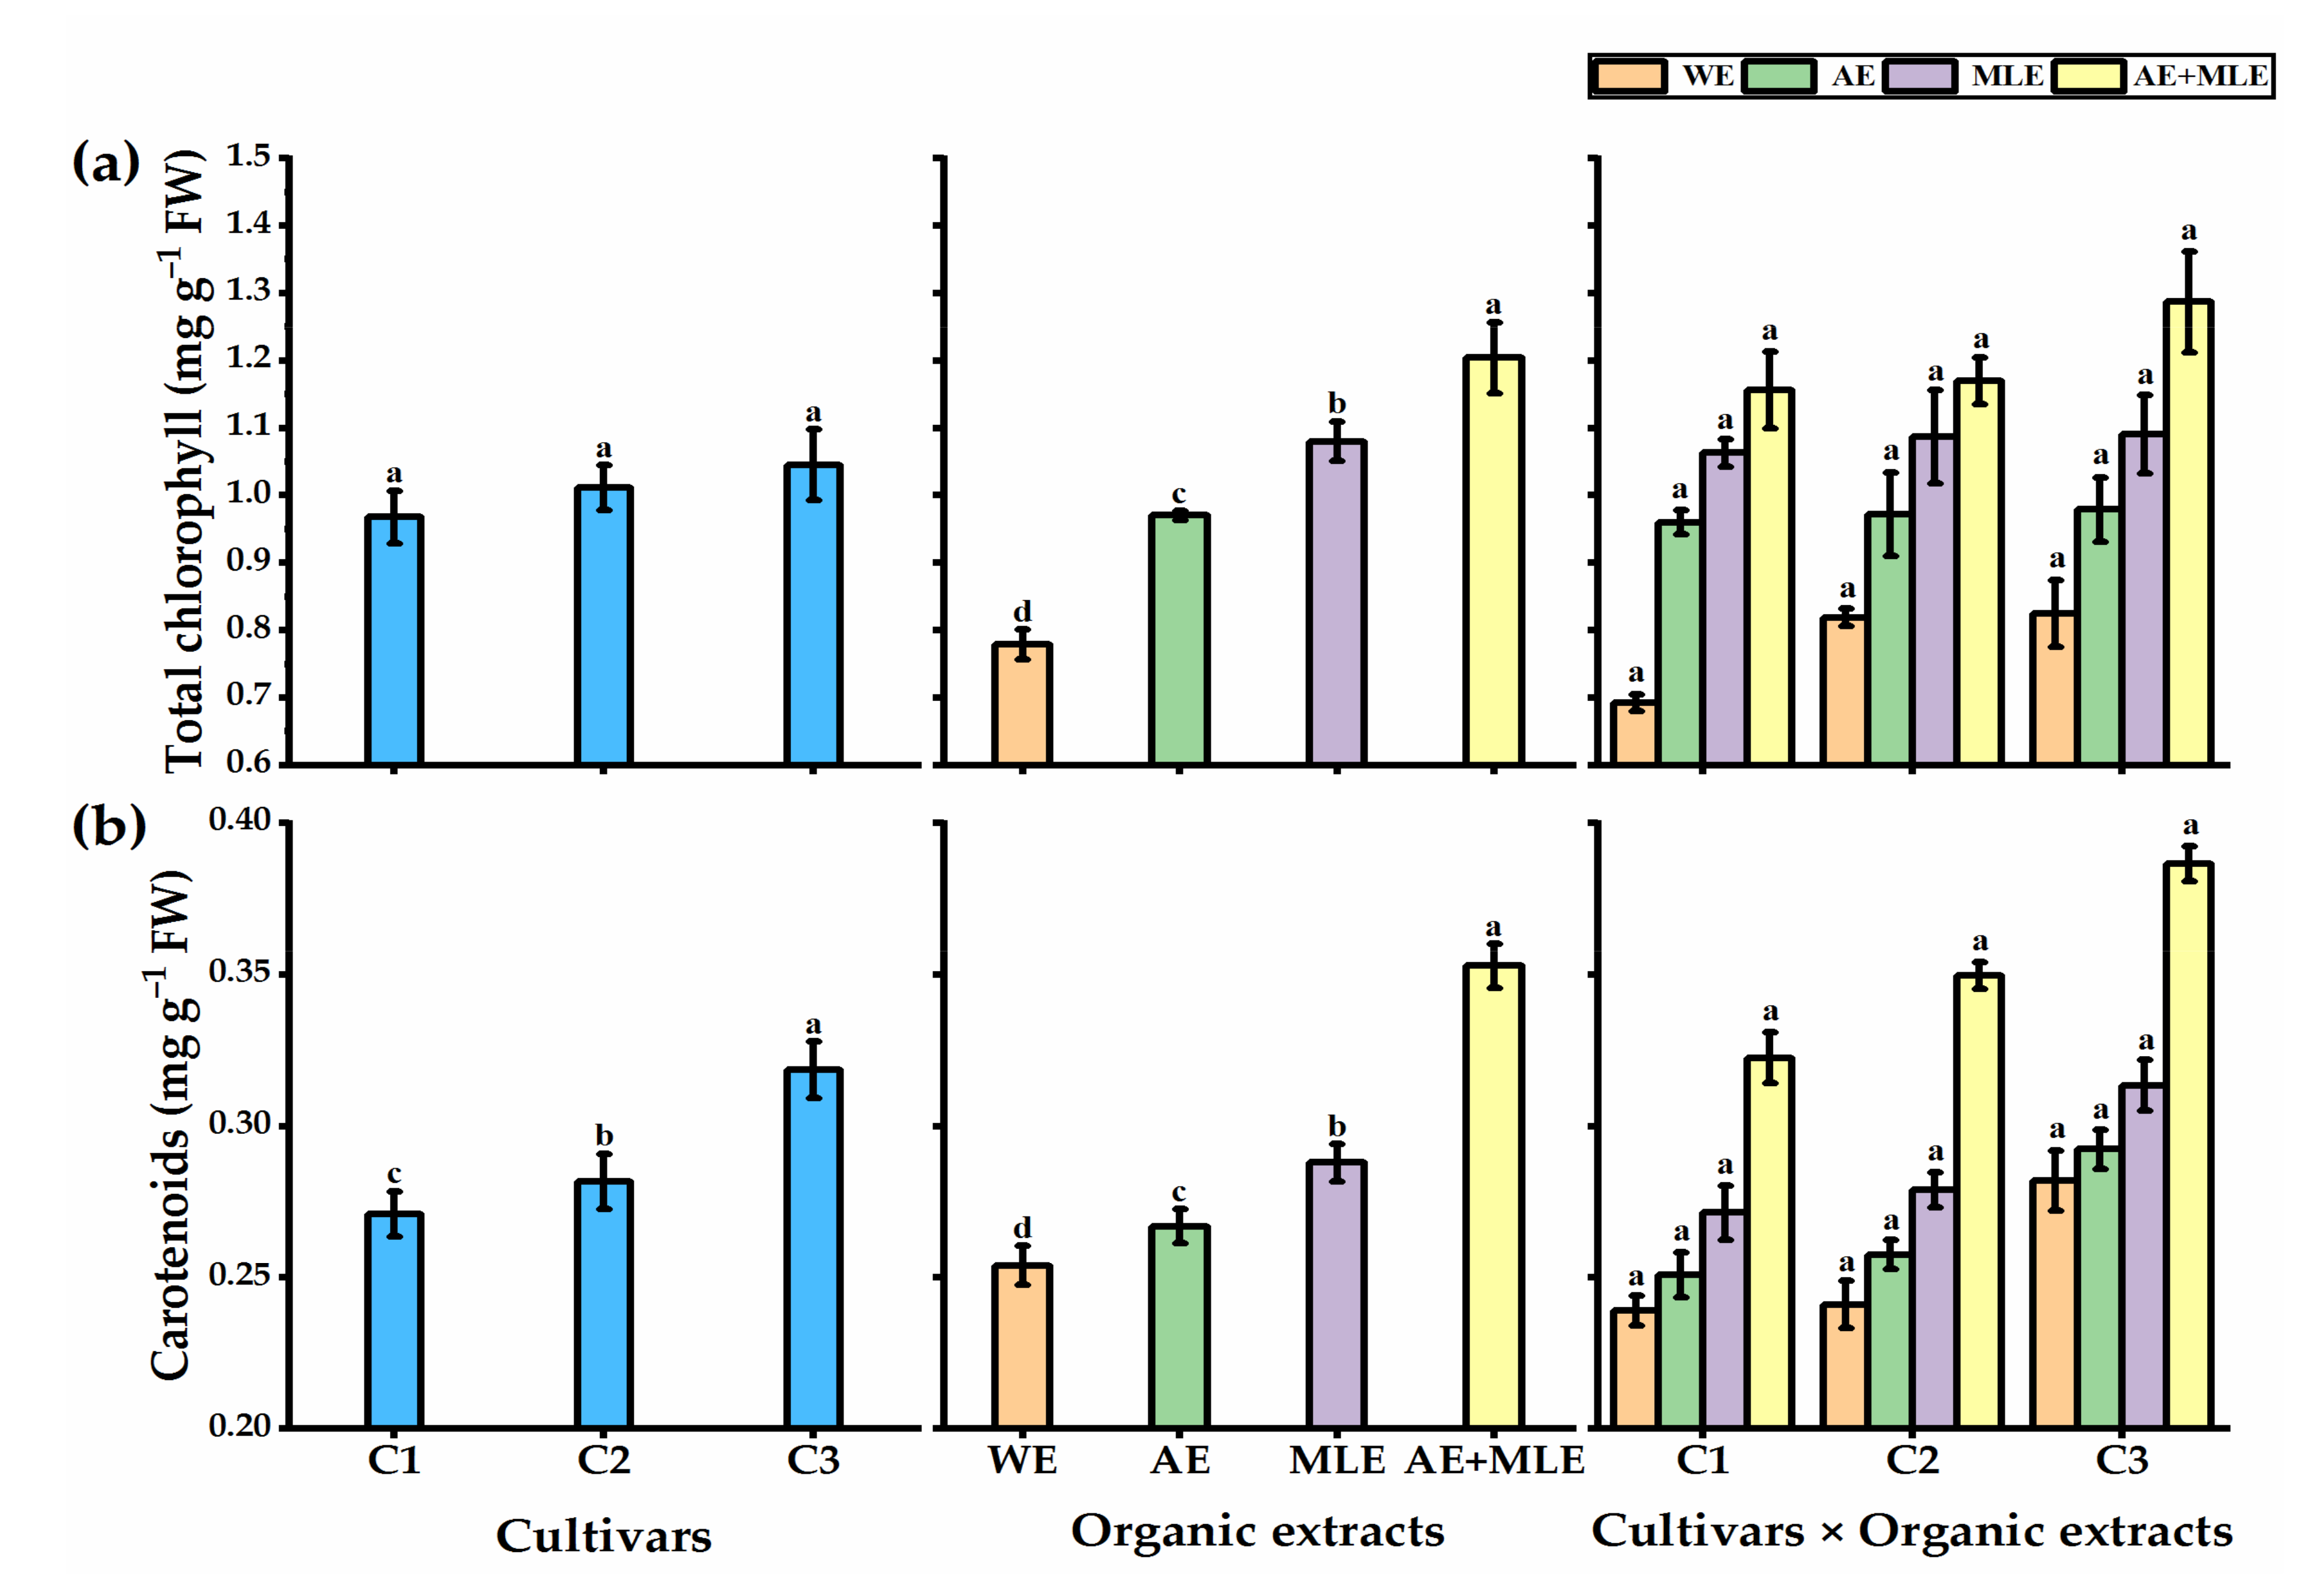
Foliar spraying with AE and MLE for quinoa production significantly enhanced the growth and yields of quinoa cultivars (Figure 1 and Figure 2). The C3-plants significantly displayed the highest values in this respect, but the lowest values were obtained by the C1-plants. In terms of AE and MLE and their combinations, the highest values were exhibited by the AE+MLE treatment as they gave 86.3 cm and 16.18 for plant height and inflorescence number plant−1, respectively, compared with 76.45 cm and 14.13 exhibited by control plants, respectively (Figure 1a,b). Concerning the interaction, quinoa cultivars revealed great variations in response to different foliar applications, as the C3 × AE+MLE treatment significantly exhibited the tallest plants (90.6 cm), which carried the highest inflorescence number plant−1 (16.91) relative to the other treatments. Untreated C1-plants produced shorter plants (73.6 cm) with lower inflorescence number plant−1 (13.6).
Quinoa outputs presented in Figure 1 and Figure 2 revealed that the C2 plants showed the highest 1000-seed weight, but the C3-plants exhibited the maximum seed and straw yields compared C1-plants by 28 and 27% higher for seed and straw yields, respectively. The traits of 1000-seed weight, seed, and straw yields significantly increased when quinoa plants were foliarly sprayed with AE (4.8, 12.4 and 7.2%) and MLE (8.9, 20.4 and 12.3%) as compared with control plants, respectively. The maximum 1000-seed weight, seed, and straw yields (12.4, 29.2 and 17.8% higher than untreated plants, respectively) were observed when the plants were exposed to AE+MLE foliar spray. The treatment of C3 × AE+MLE significantly displayed the highest seed and straw yields (2432 and 4453 kg, respectively). The lowest yields were observed by the C1 × WE-plants, which recorded 1215 and 2673 kg for seed and straw yields, respectively. Moreover, biological yield exhibited great variations as impacted by the treatments used (Figure 2c).
The C3-plants significantly gave the highest biological yield (6191 kg), but C1-plants showed the lowest value (4497 kg) in this respect. Both AE and MLE significantly boosted quinoa biological yield as compared with untreated plants. The maximum biological yield (6007 kg) was given following spraying the plant foliage with AE+MLE. In terms of the interaction, quinoa plants subjected to C3 × AE+MLE significantly exhibited maximum biological yield (6884 kg). On the other hand, the lowest biological value was observed by C1 × WE-plants. Furthermore, AE and MLE utilization significantly enhanced HI values as compared with untreated plants. The highest HI value was observed by treated plants with AE+MLE as it increased by 9.6% compared to control plants. Concerning the cultivar, C3 plants significantly showed the highest HI value. The C3 plants subjected to AE+MLE significantly recorded the highest HI value (Figure 2d).

3.3. Leaf Pigments

Foliar spraying with AE and MLE for quinoa production under organic conditions significantly enhanced leaf pigments of quinoa cultivars (Figure 3). The C3 plants significantly recorded the highest levels of total chlorophyll and carotenoids (1.05 and 0.32 mg g−1FW, respectively), while the C1 plants gave the lowest values (0.97 and 0.27 mg g−1FW, respectively) in this respect. Plants subjected to foliar spray with AE significantly presented an increase in total chlorophyll and carotenoid contents by 19.7 and 4.8% relative to untreated plants, respectively. Foliar spraying with MLE led to an increase in total chlorophyll and carotenoids levels in quinoa leaves, but a significant increase was observed when quinoa plants received AE and MLE application. The C3 plants that were foliarly sprayed with AE+MLE significantly exhibited maximum levels of leaf pigments as they gave 1.29 and 0.39 mg g−1FW for total chlorophyll and carotenoids, respectively. On the other hand, C1 × WE-plants recorded the lowest levels of leaf pigments (0.69 and 0.24 mg g−1FW for total chlorophyll and carotenoids, respectively).

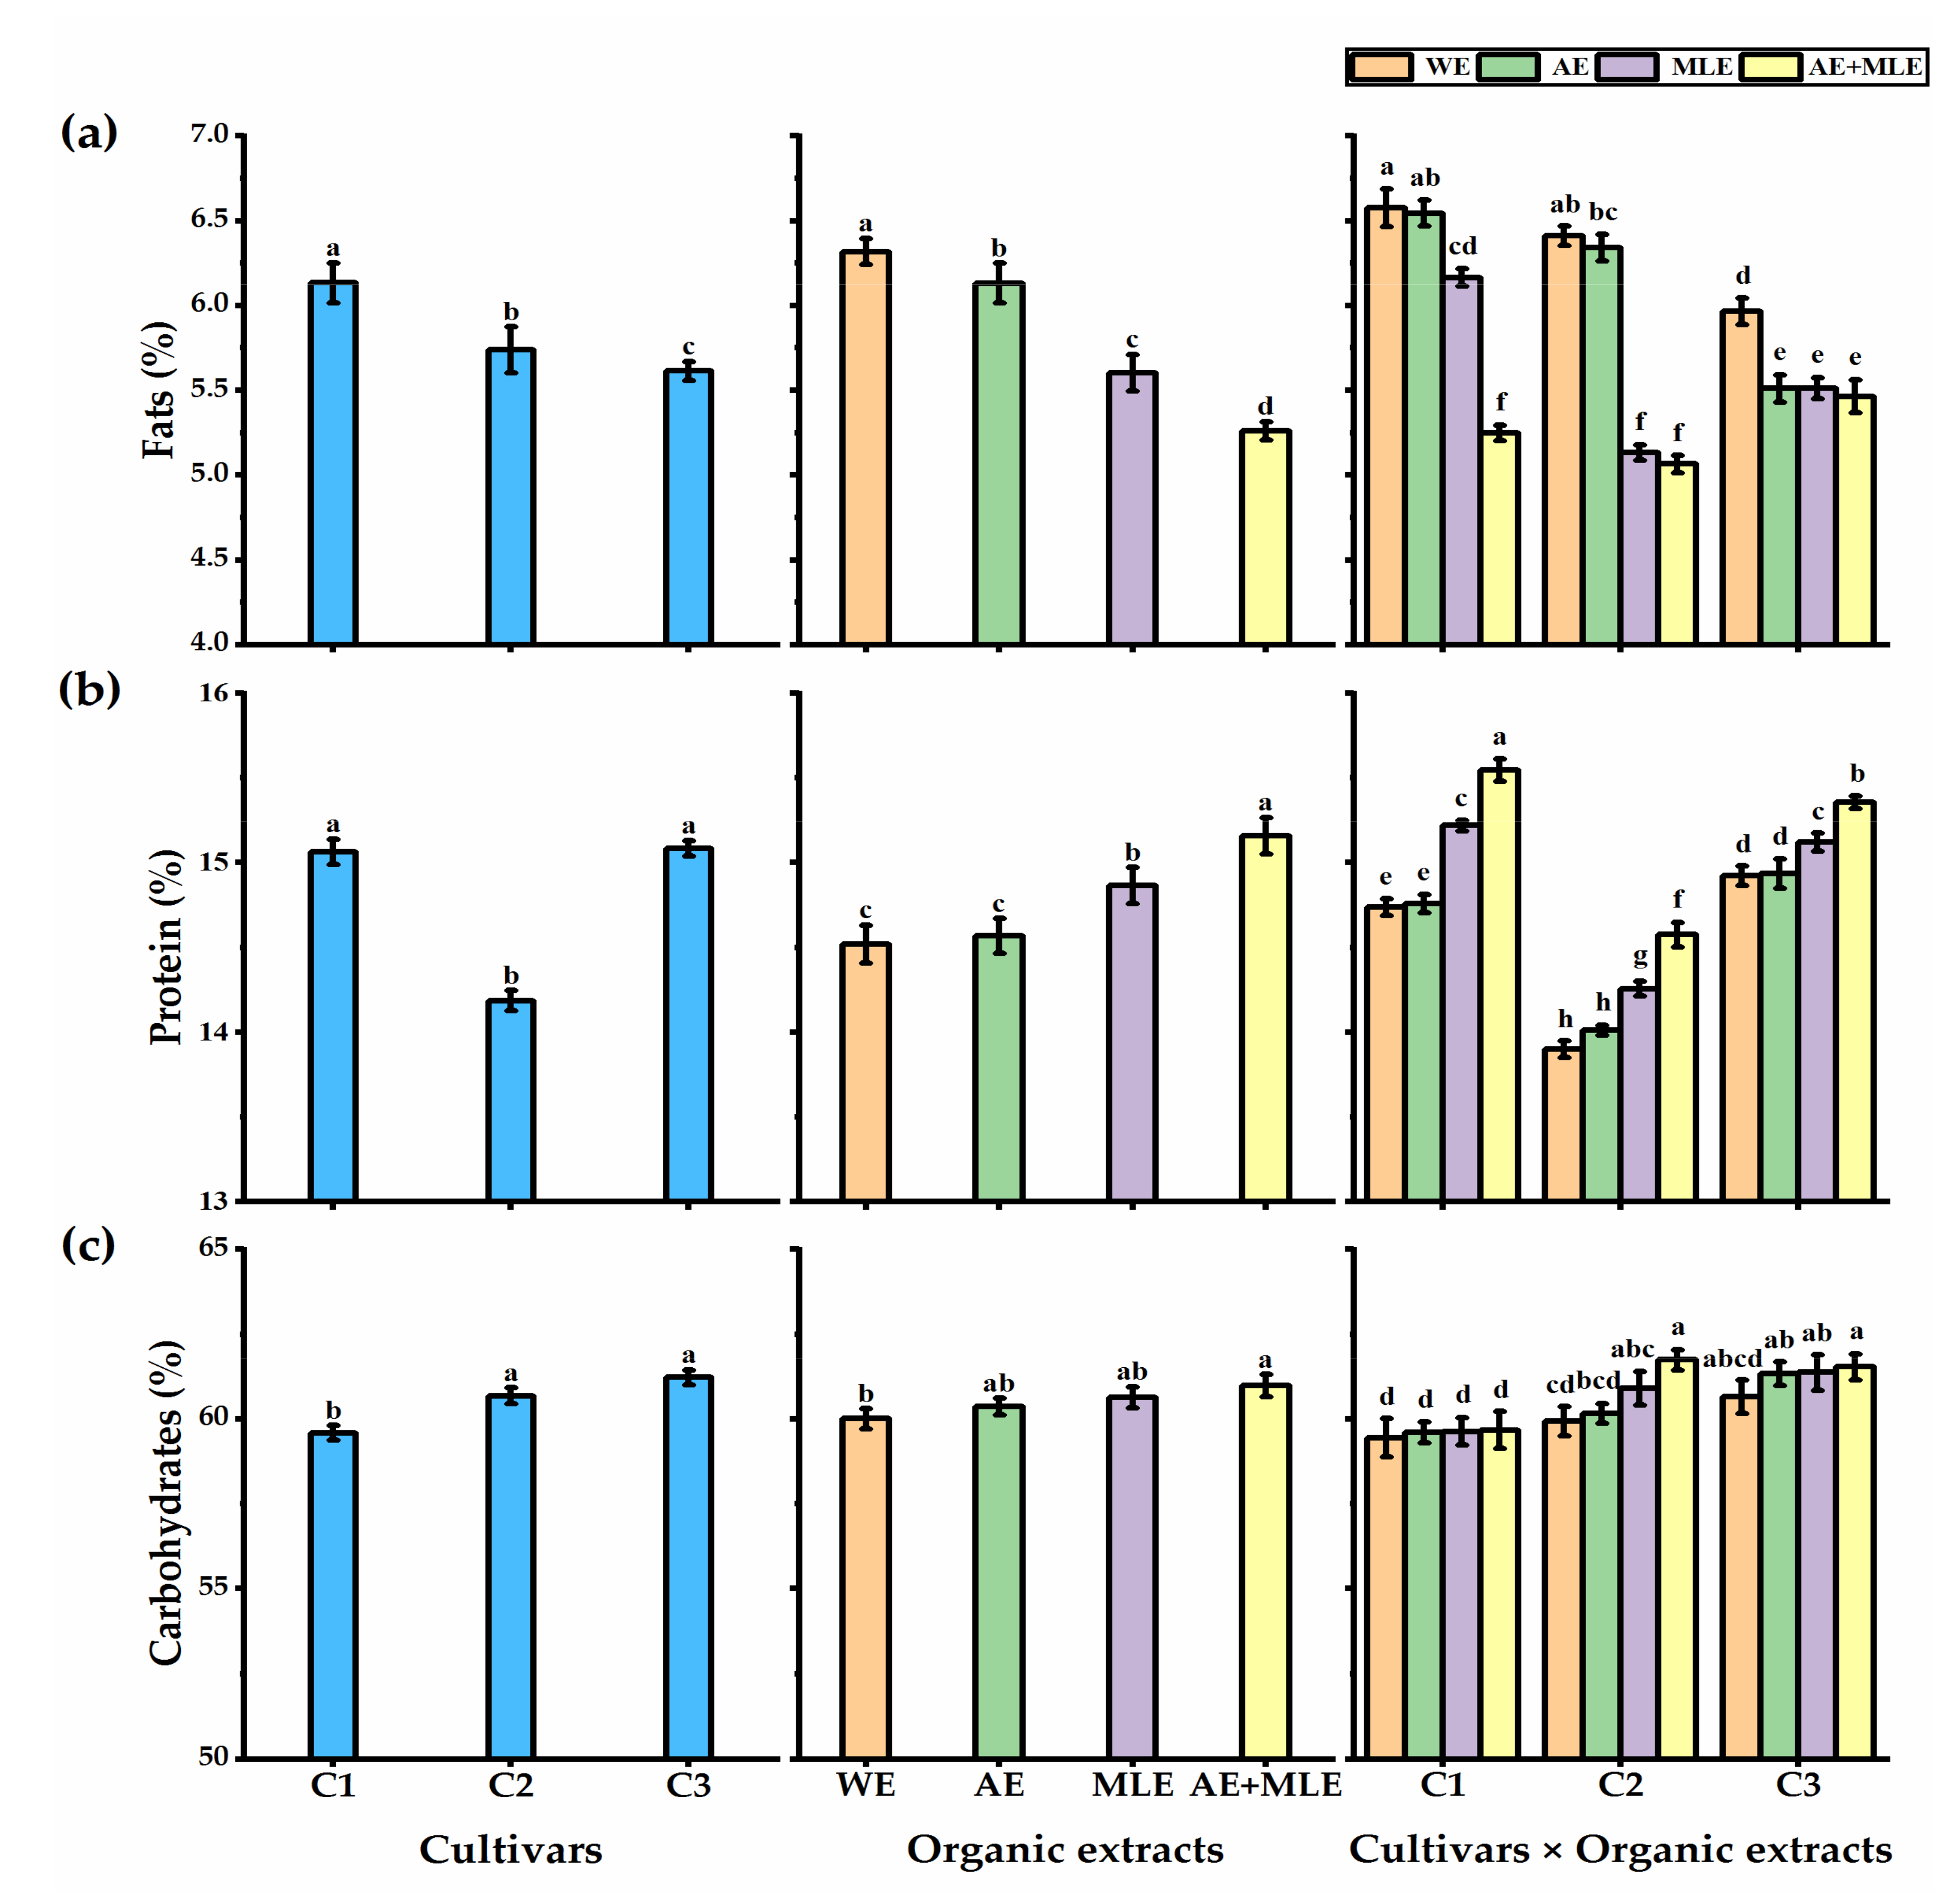
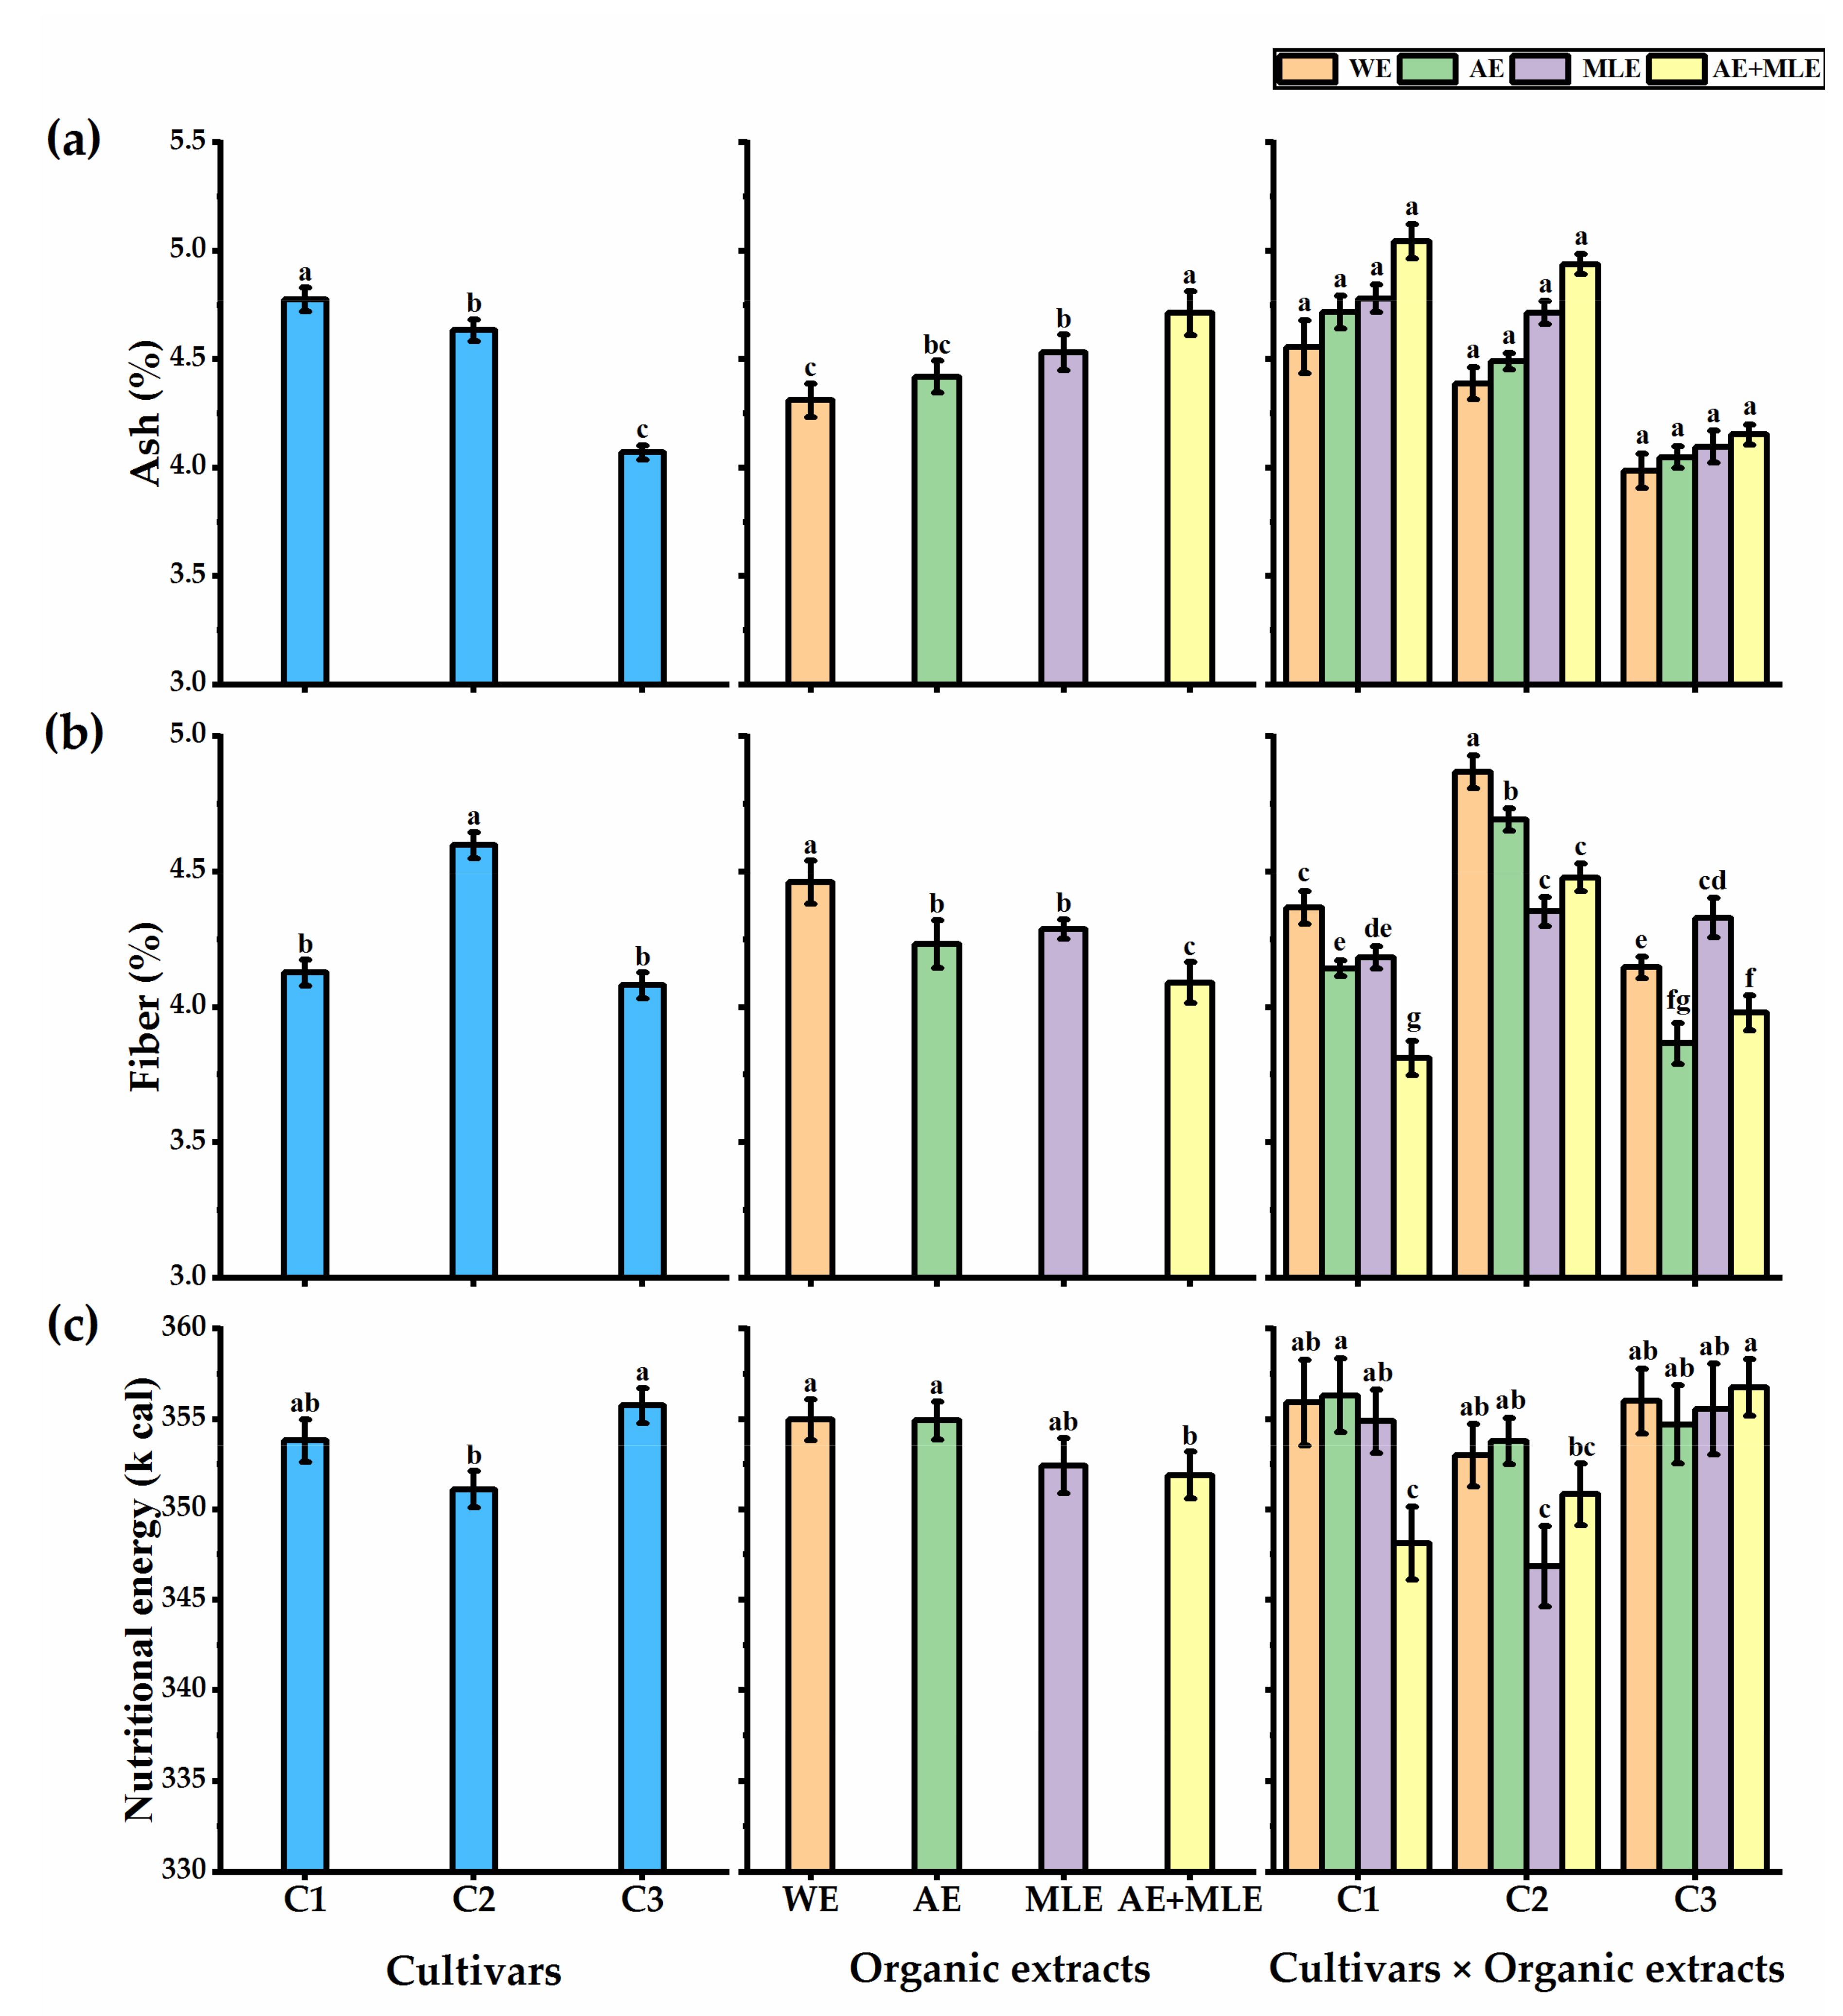
3.4. Proximate Analysis of Quinoa Seeds

The results in Figure 4 and Figure 5 present the seed proximate analysis of quinoa cultivars in response to AE and MLE foliar spray. Quinoa cultivars exhibited great variations in seed proximate analysis as C1 and C3 cultivars presented higher protein content than the C2 cultivar, Wwhile C1 plants presented higher ash content against the carbohydrate content that presented an increase in C3 and C2 than C1 plants. The protein, ash, and carbohydrate content revealed a significant increase when AE and MLE were applied as compared to control plants. The maximum values of protein, ash, and carbohydrates were detected when quinoa foliage received AE+MLE, which led to an increase in protein, ash, and carbohydrates content by 4.2, 8.5 and 1.6%, respectively, as compared with control plants. In terms of the interaction, the C1 plants treated with AE+MLE significantly exhibited higher protein and ash contents (15.56 and 5.%, respectively) as compared to the other treatments. The highest carbohydrate content was observed in C2 plants foliarly sprayed with AE+MLE (61.7%), followed by C3 plants treated with AE+MLE (61.5%), while the lowest carbohydrate content was given by C1 × WE plants (59.5%). Untreated plants significantly showed the highest fat and fiber content (6.3 and 4.6%, respectively) as compared to other treated plants. However, the lowest fat and fiber levels were exhibited by AE+MLE treatment, as they showed 5.3 and 4.1%, respectively. The C1 plants significantly showed the highest fat content (6.13%), but the C3 plants presented the lowest fat content (5.6%). Concerning the fiber content (Figure 5b), the C2 plants significantly showed the highest fiber level (4.6%), while the lowest fiber content was presented by C3 plants (4.1%). In terms of the interaction, C1 × WE plants significantly gave the highest fat content (6.6%), but the lowest value was given by C2 × AE+MLE plants (5.1%).
Regarding the nutritional energy of quinoa seeds, treating quinoa plants with AE+MLE reduced seed energy, as they gave the lowest value (352 kcal), while untreated plants recorded the highest values in this respect (3545 kcal). A significant increase was noticed among quinoa cultivars, as C3 plants exhibited the highest energy values (356 kcal), while C2 plants exhibited the lowest values in this respect (351 kcal). The interaction effect between the cultivars and foliar treatments revealed that the maximum calories obtained were given by C3 × AE+MLE treatment (358 kcal). The lowest energy was obtained by C2 × MLE treatment, which was 347 kcal (Figure 5c).

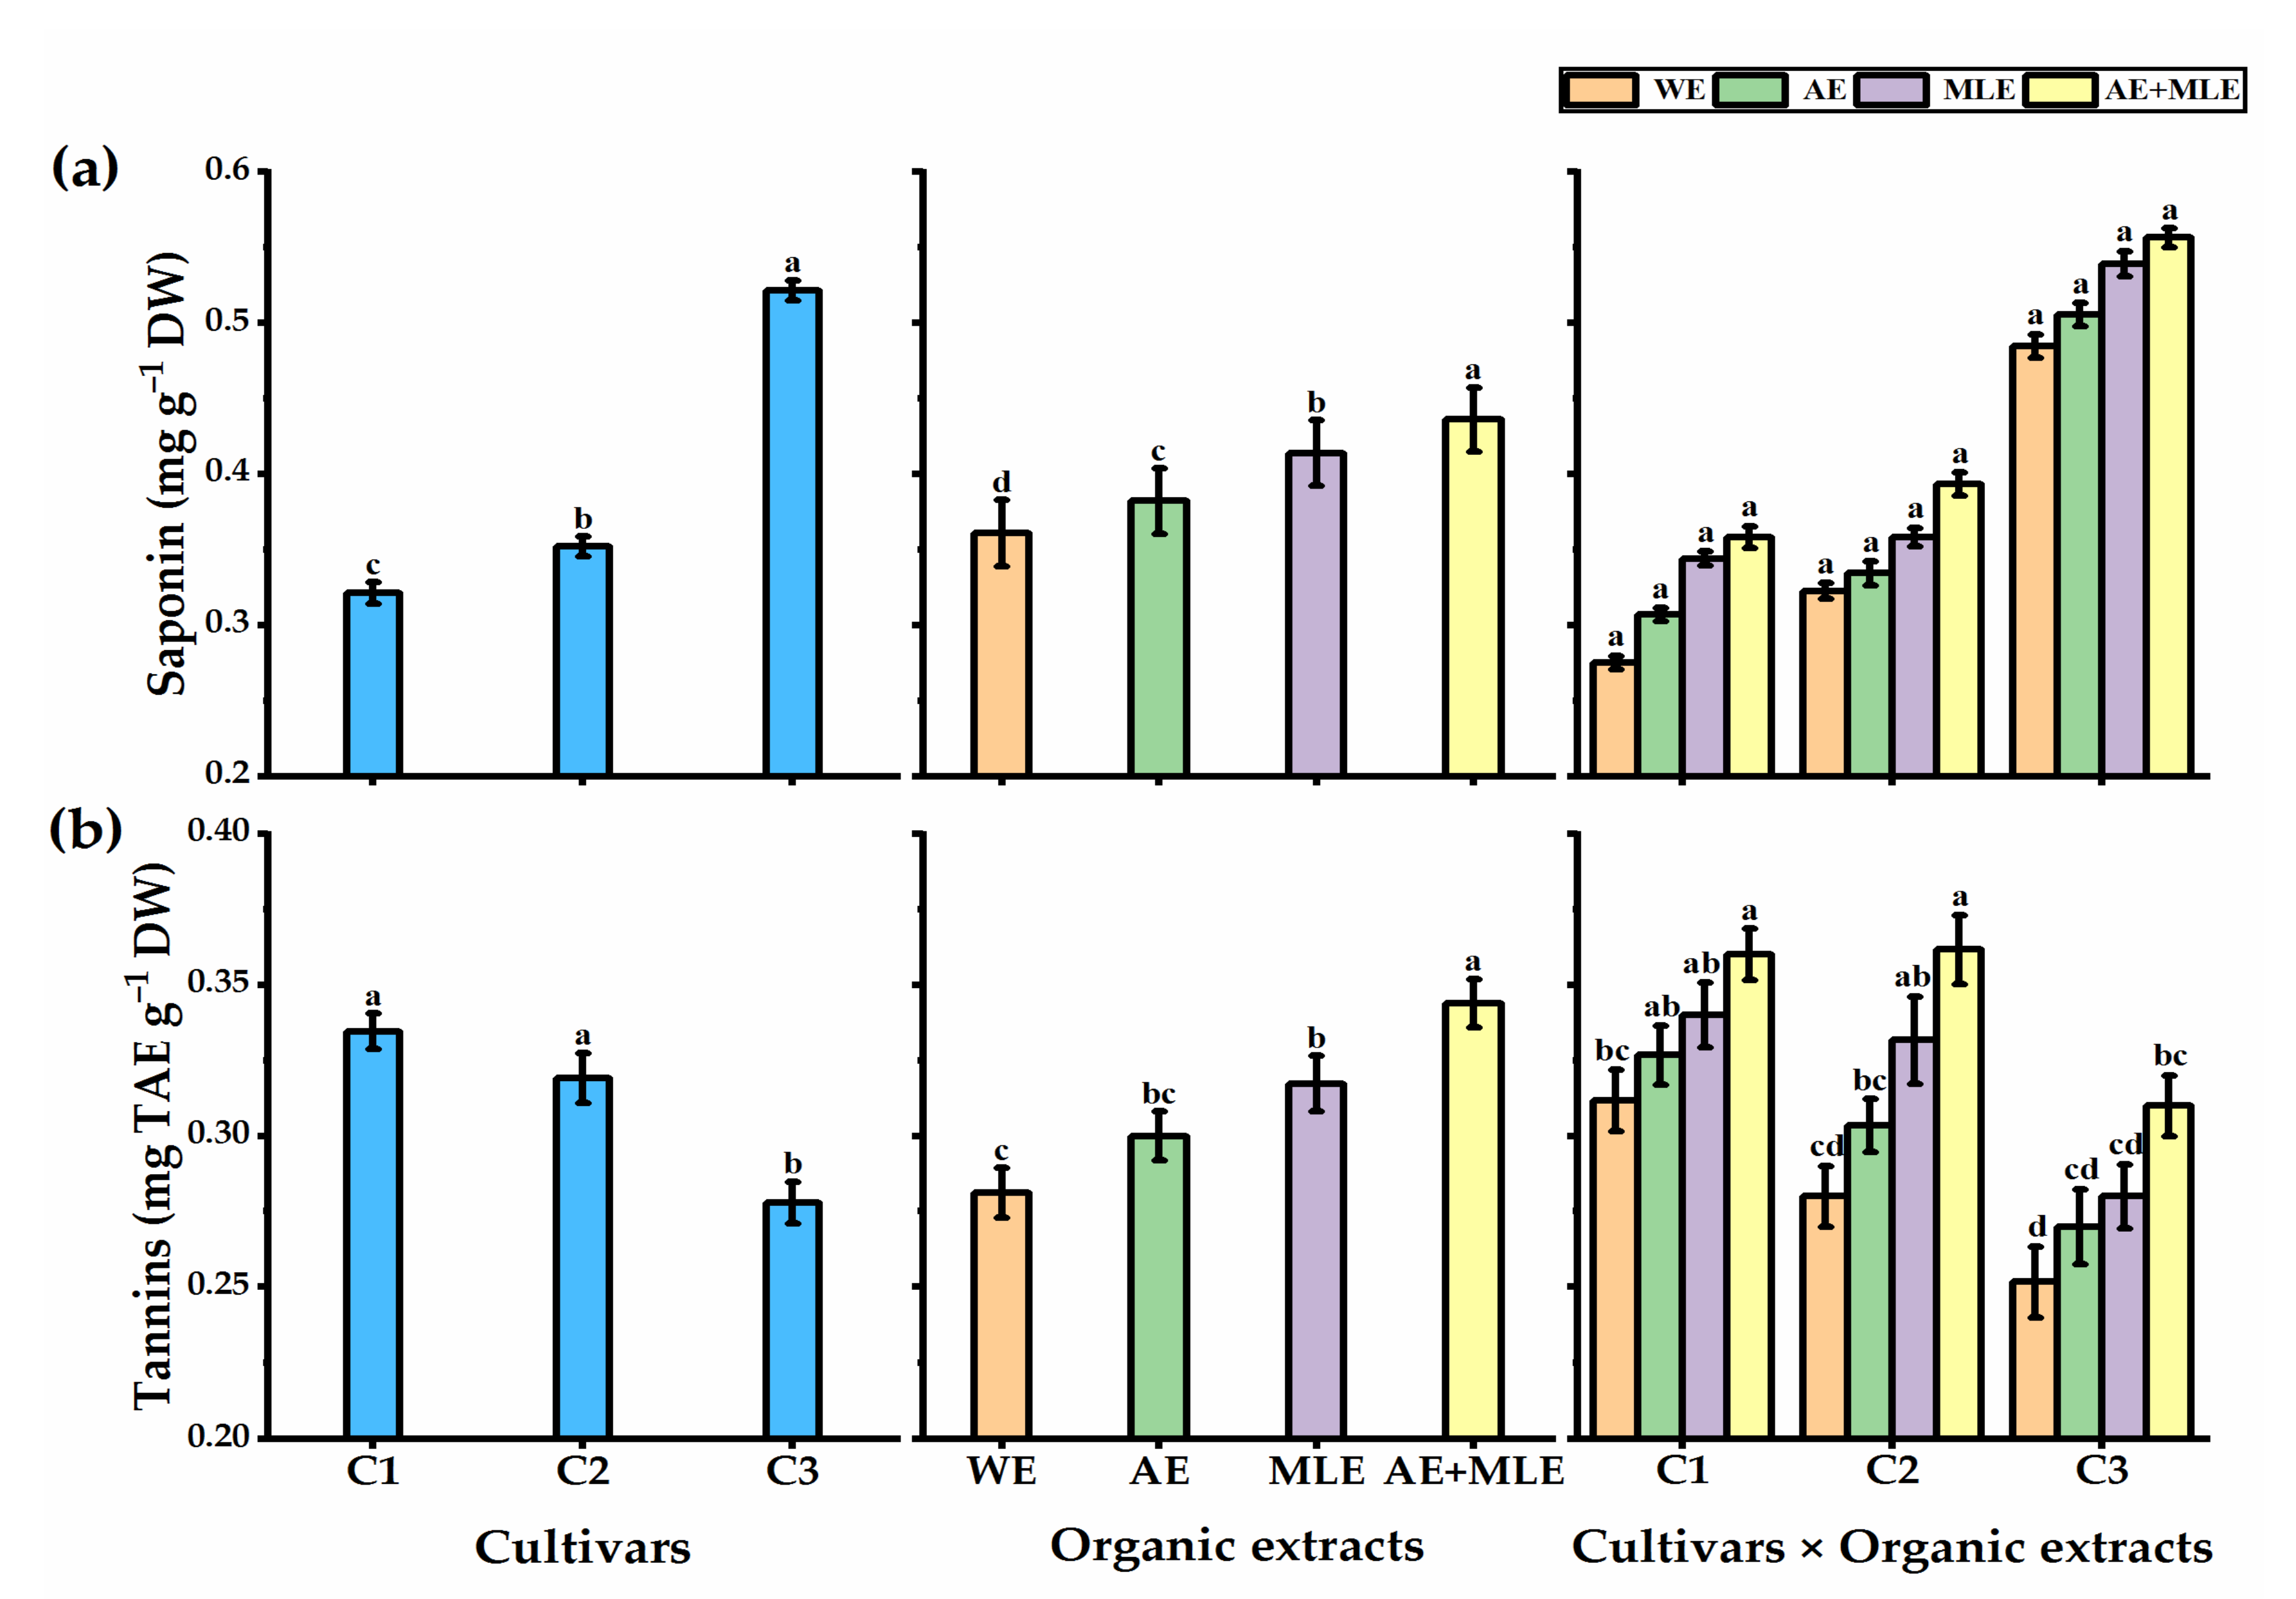
3.5. Saponin Content

The results presented in Figure 6a reveal the effect of foliar extracts with AE, MLE, and their interaction on the saponin content in three cultivars of quinoa plants. Foliar application of AE increased saponin content by 5.6% more than control plants. Additionally, foliar application with MLE resulted in an increase in saponin content by 12.8% as compared to untreated plants, while the highest increase in saponin level (17.3%) was observed by the treatment of AE+MLE. Regarding quinoa cultivars, C3 plants had the highest levels of saponin as compared with the other cultivars (C1 and C2), and these levels increased when their plants were supplemented with the extracts used, as a growing increase was obtained by AE followed by MLE, followed by their combination (AE+MLE). The lowest saponin level was detected in C1 × WE-plants, but the foliar spraying with AE or MLE and AE+MLE significantly increased saponin content.

3.6. Tannin Content

The presented results in Figure 6b indicate that C3 plants exhibited the lowest tannin levels (0.28 mg TAE g−1 DW), and the highest levels were observed by C1 plants (0.34 mg TAE g−1 DW). Foliar application with different extracts significantly increased tannin content in quinoa seeds. The lowest tannin level (0.28 mg TAE g−1 DW) was noticed by untreated plants. On the other hand, the highest level of tannins was given by AE+MLE treatment (0.34 mg TAE g−1 DW). Concerning the interaction effect, foliar spray with AE+MLE resulted in the maximum increase in tannin levels in all quinoa cultivars, as it increased tannin levels by 13.4, 22.6, and 18.8% for C1, C2, and C3, respectively.

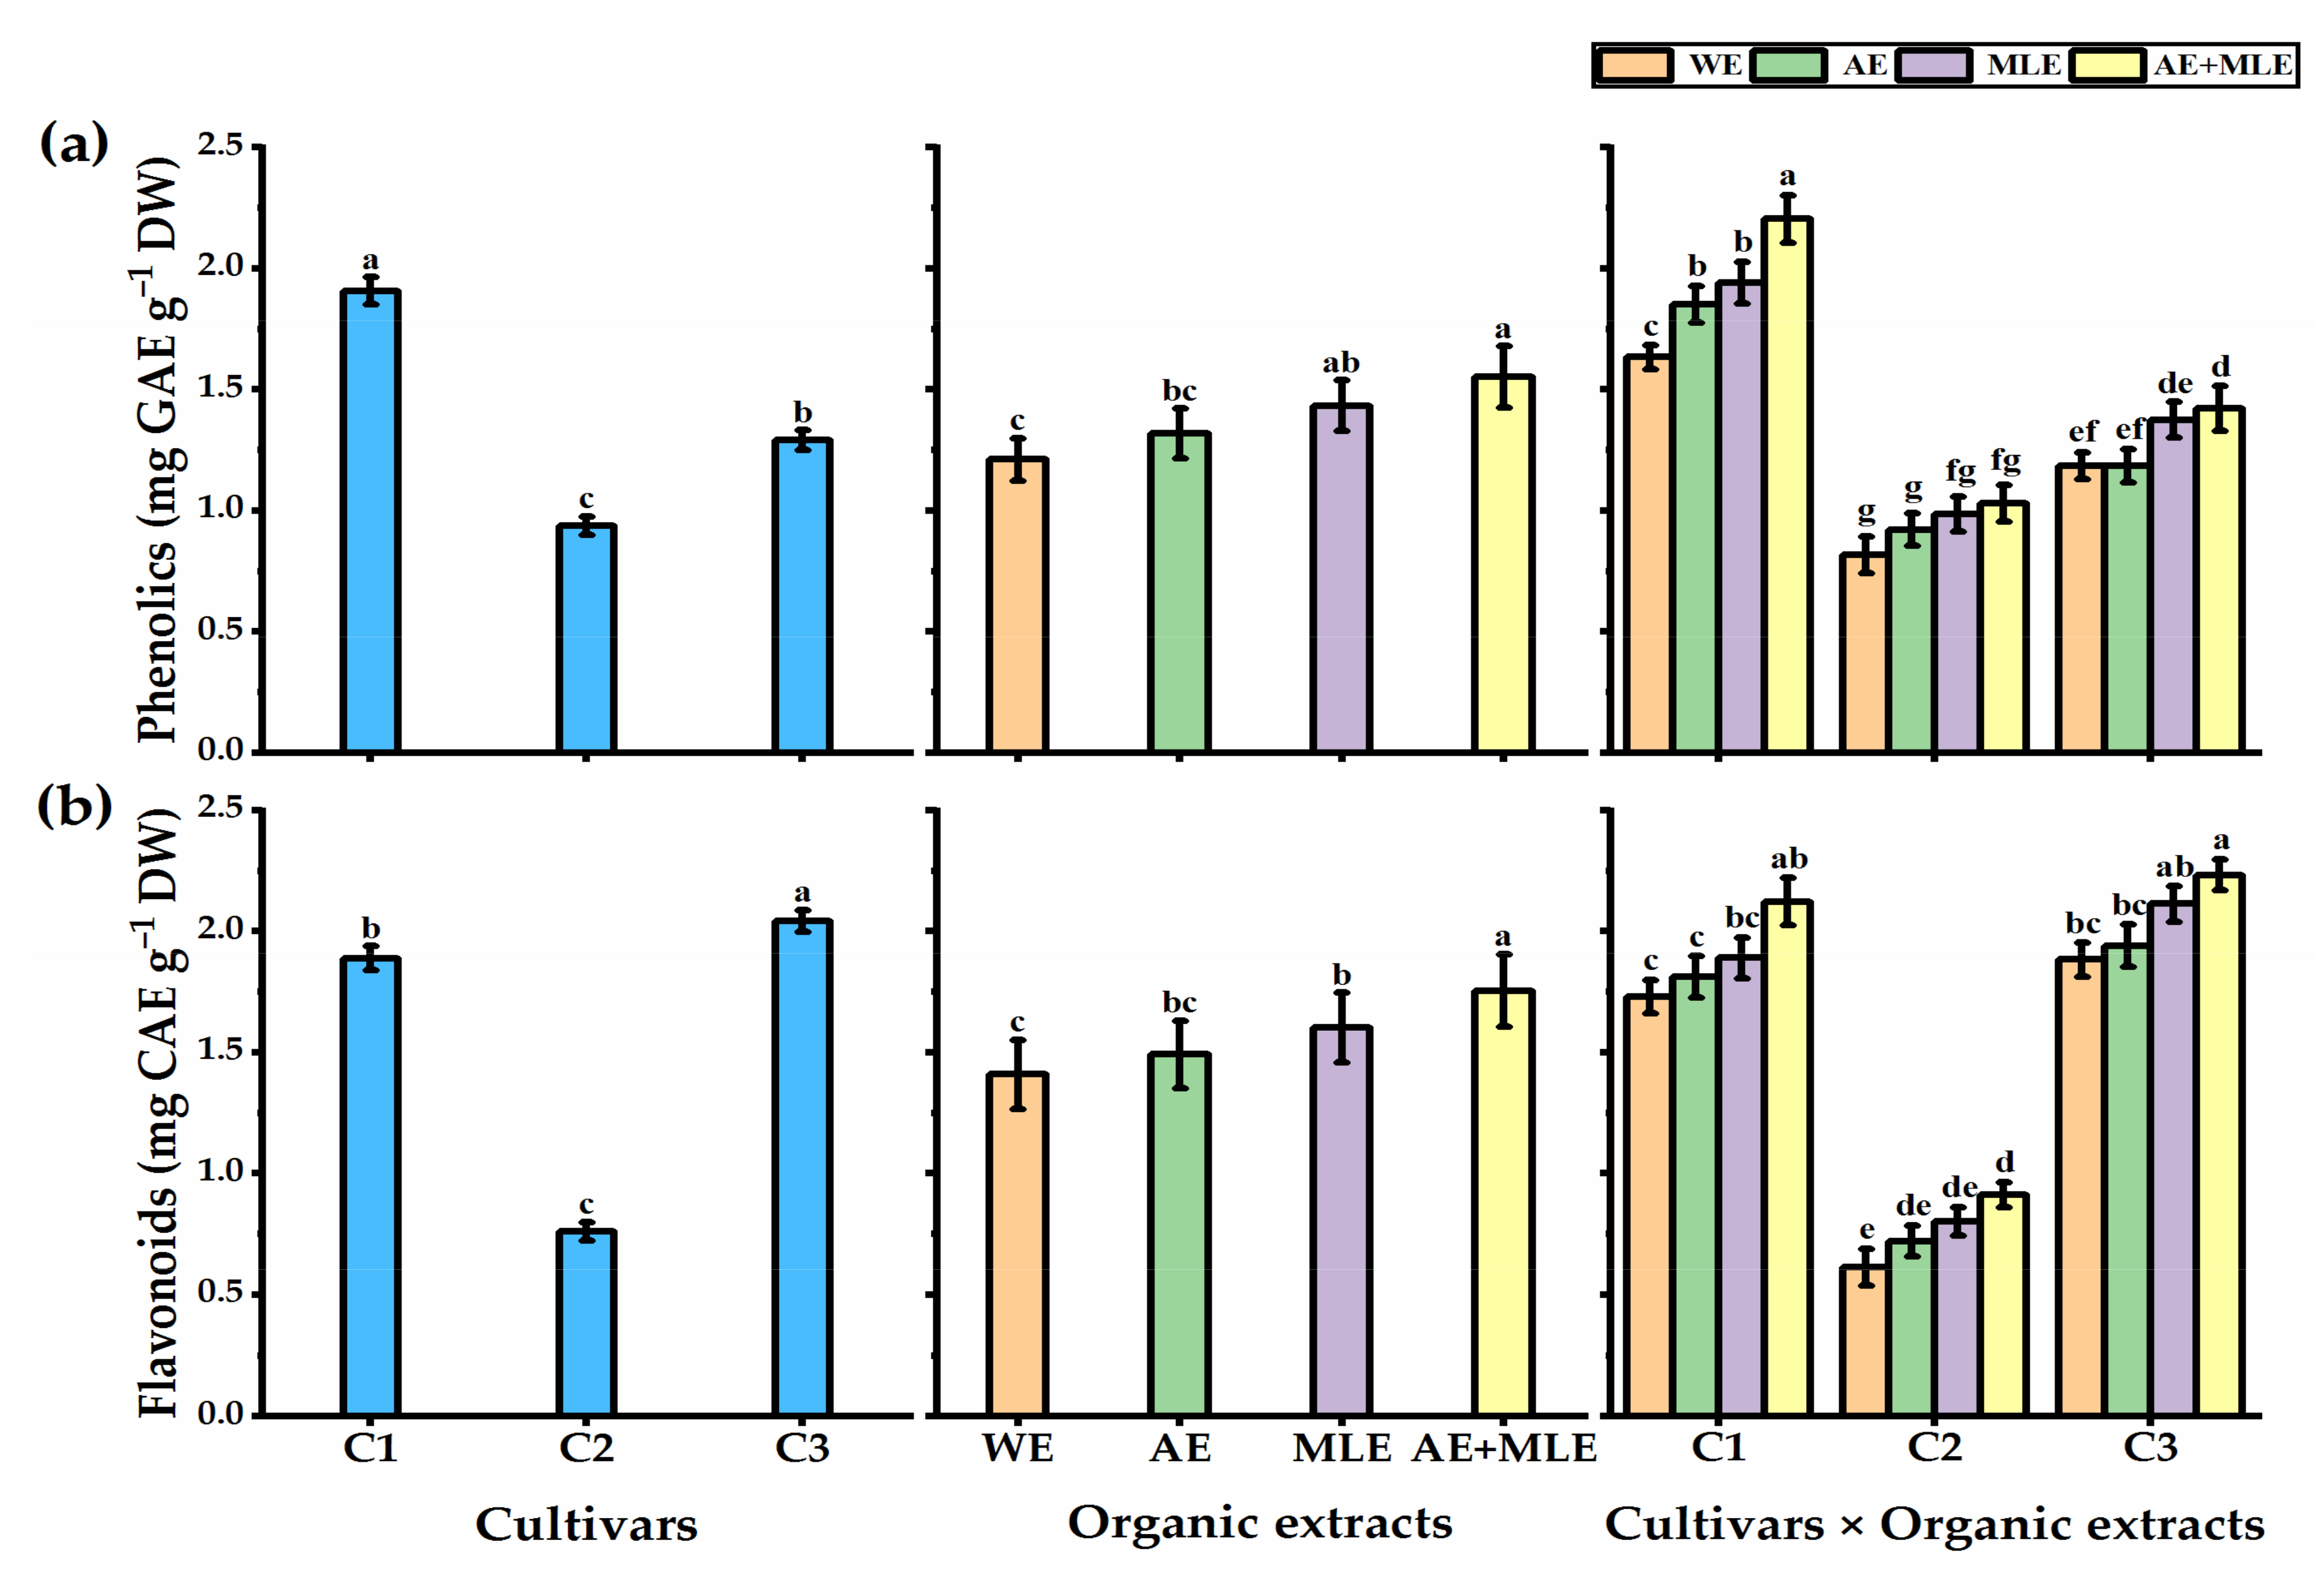
3.7. Total Phenols and Flavonoids Content

All the cultivars under study exhibited a significant response to foliar application (Figure 7). The C2 plants exhibited the lowest levels of phenols (0.938 mg GAE g−1 DW) and flavonoids contents (0.761 mg CAE g−1 DW). While the highest levels of phenols were obtained by C1 plants and by C3 plants for flavonoids content. Foliar application with AE or MLE significantly increased the phenols and flavonoids levels in quinoa seeds as compared with untreated plants. The maximum increase was obtained by AE+MLE treatment (21.9 and 19.8% higher than untreated plants for total phenols and flavonoids content, respectively). In terms of the interaction, the highest level of total phenols was observed by C1 × AE+MLE (2.20 mg GAE g−1 DW). On the other hand, the highest level of flavonoids was observed for C3 plants foliar sprayed by AE+MLE (2.23 mg CAE g−1 DW).

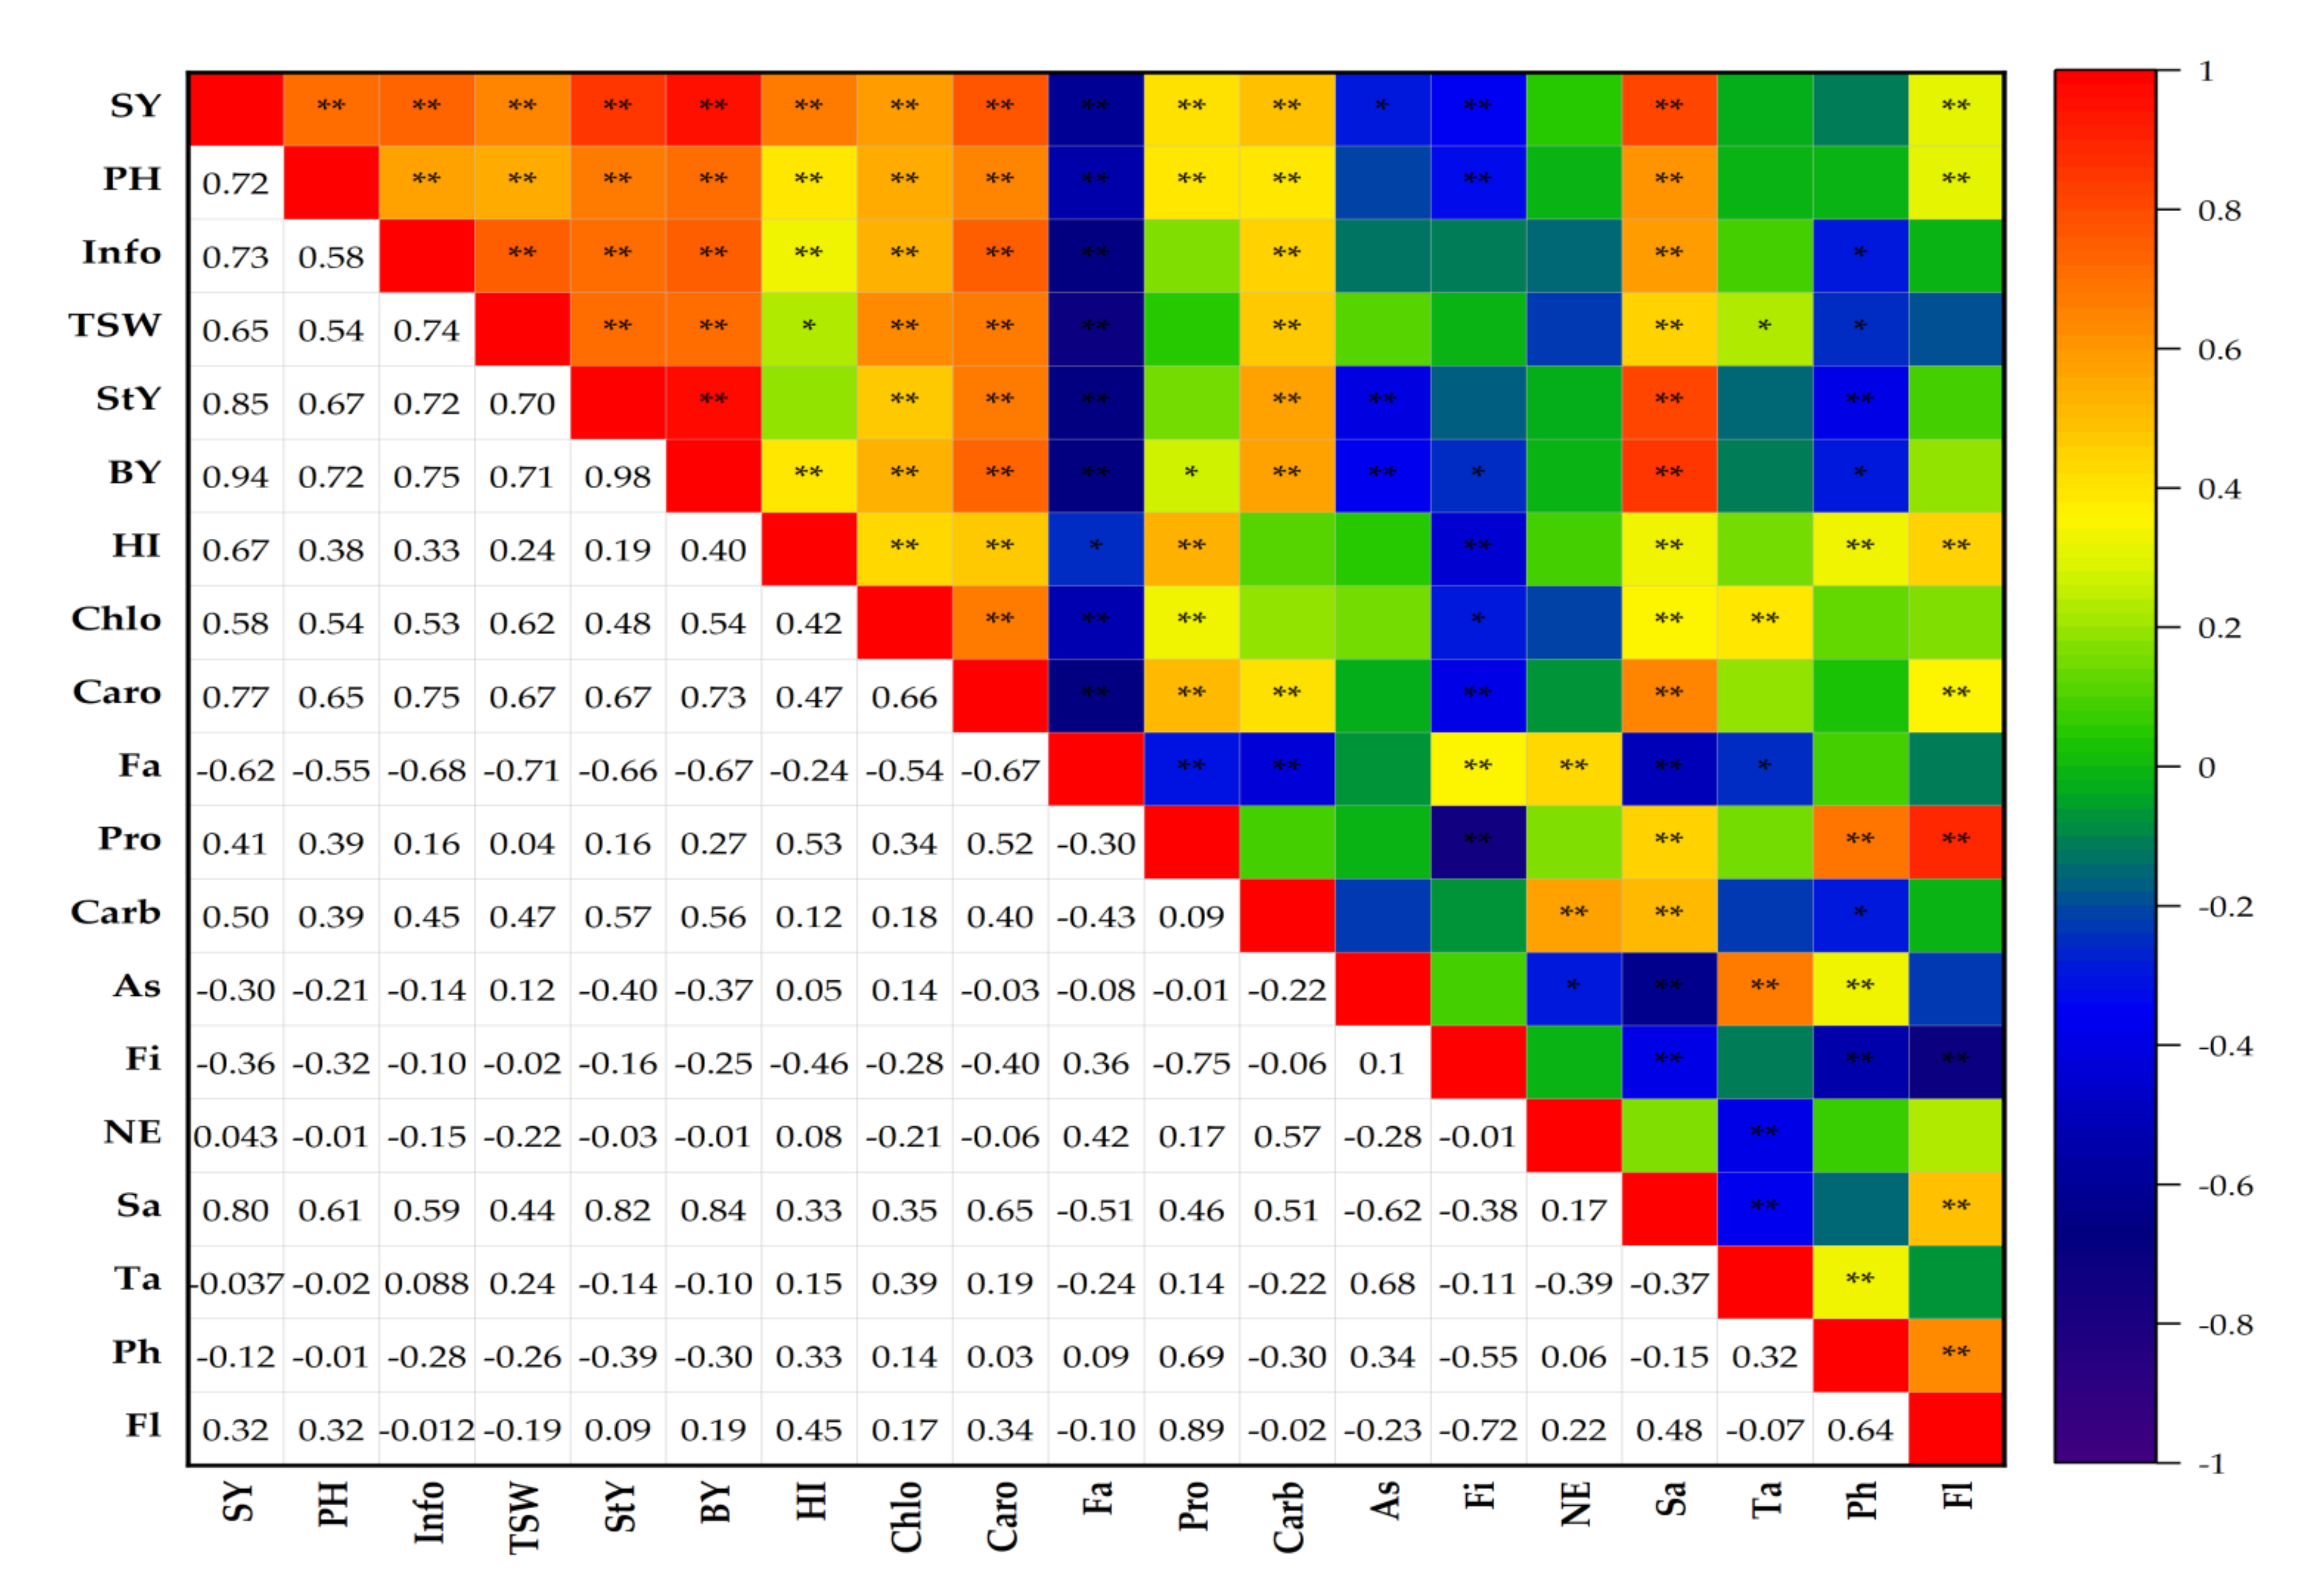
3.8. The Correlation Coefficients Analyses

Matrix correlations between measured traits across three cultivars of quinoa and foliar application with organic extracts are presented in Figure 8. A highly positive and significant (p ≤ 0.01) correlation was noticed between seed yield (SY) with biological yield (BY) and straw yield (StY) (r = 0.94 **, and 0.85 **, respectively), as well as between StY with BY (r = 0.98 **). Moreover, high positive and significant (p ≤ 0.01) correlations (r = 0.82 **, and 0.84 **, respectively) were obtained between saponine (Sa) and StY and between saponine and BY, respectively. However, a moderate correlations were given by SY and harvest index (HI) (r = 0.67 **), carbohydrates (Carb) (r = 0.50 **), 1000-seed weight (TSW) (r = 0.65 **), chlorophyll (Chlo) (r = 0.58 **), and protein (Pro) (r = 0.41 **). On the other hand, SY correlated negatively with fat (Fa) (r = −0.62 **), ash (As) (r = −0.30 *), fiber (Fi) (r = −0.36 **), and phenols (Ph) (r = −0.12). Saponine presented a negative and significant correlation with Fa (r = −0.51 **), As (r = −0.62 **), Fi (r = −0.38 **) and a positive significant correlation with Carb (r = 0.51 **), and Pro (r = 0.46 **). Yield components showed a positive correlation with largest correlation coefficient of BY with SY (0.94), which indicates the possibility of multicollinearity between these traits.

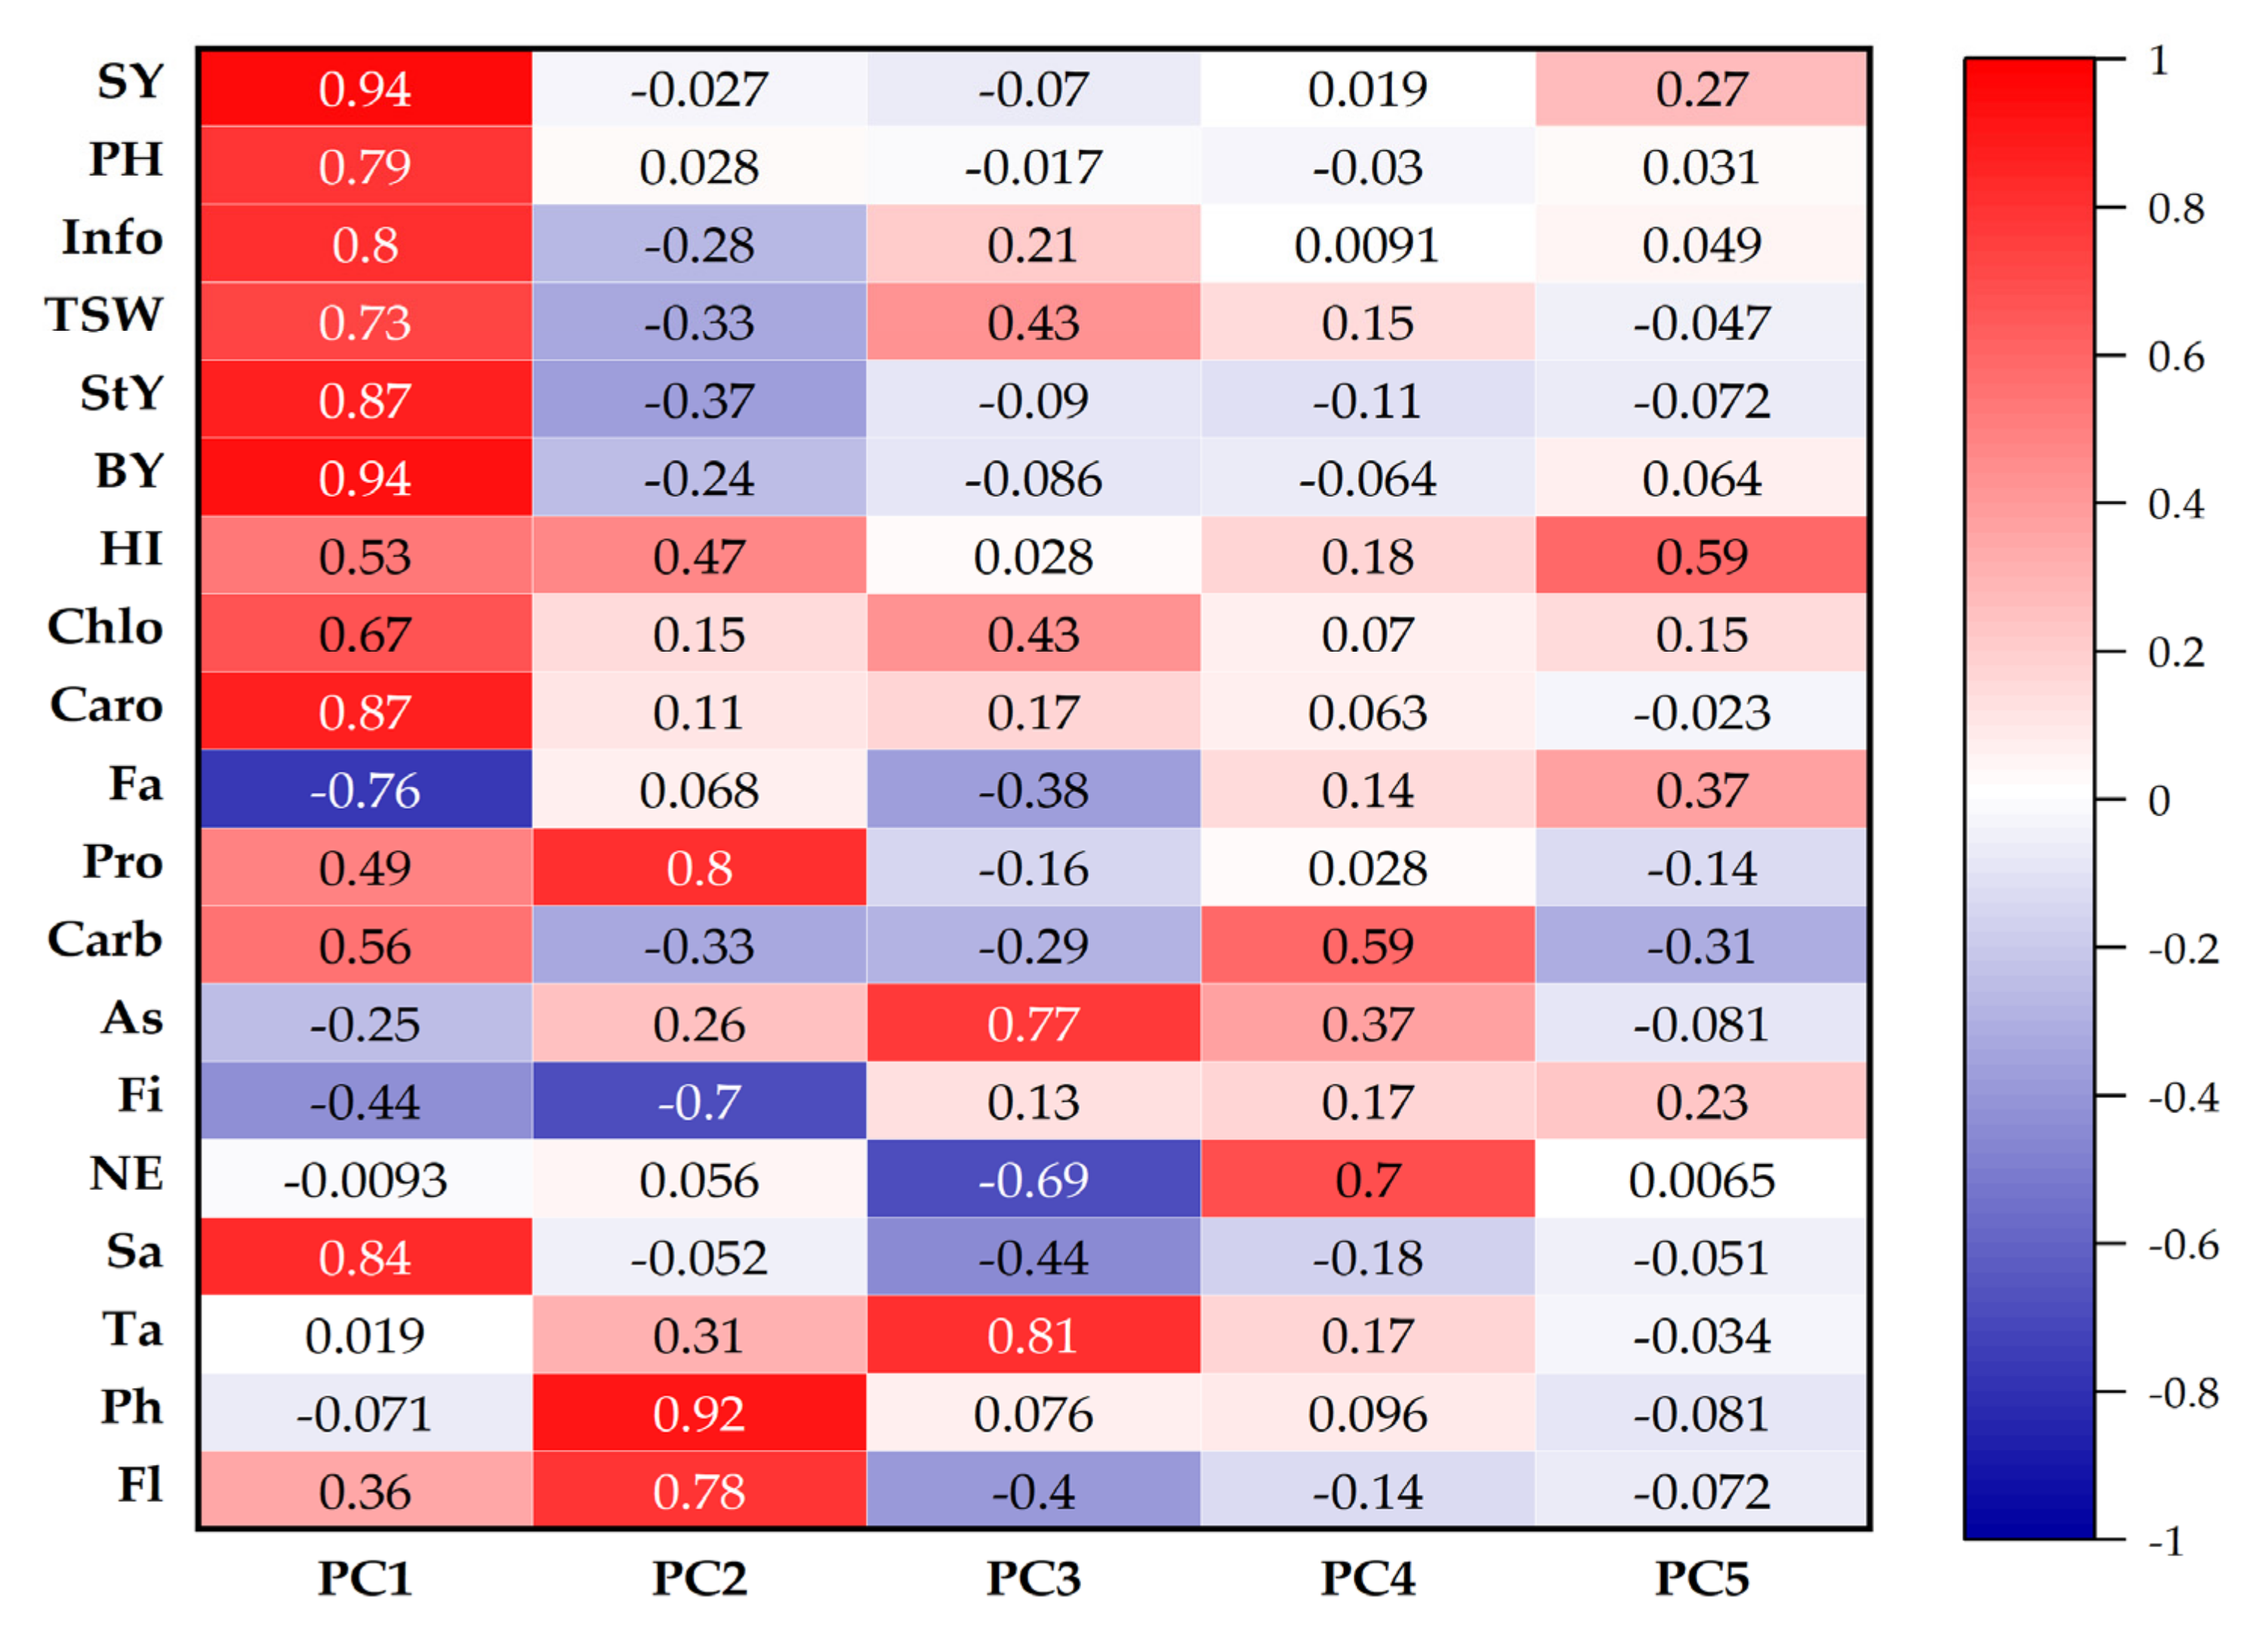
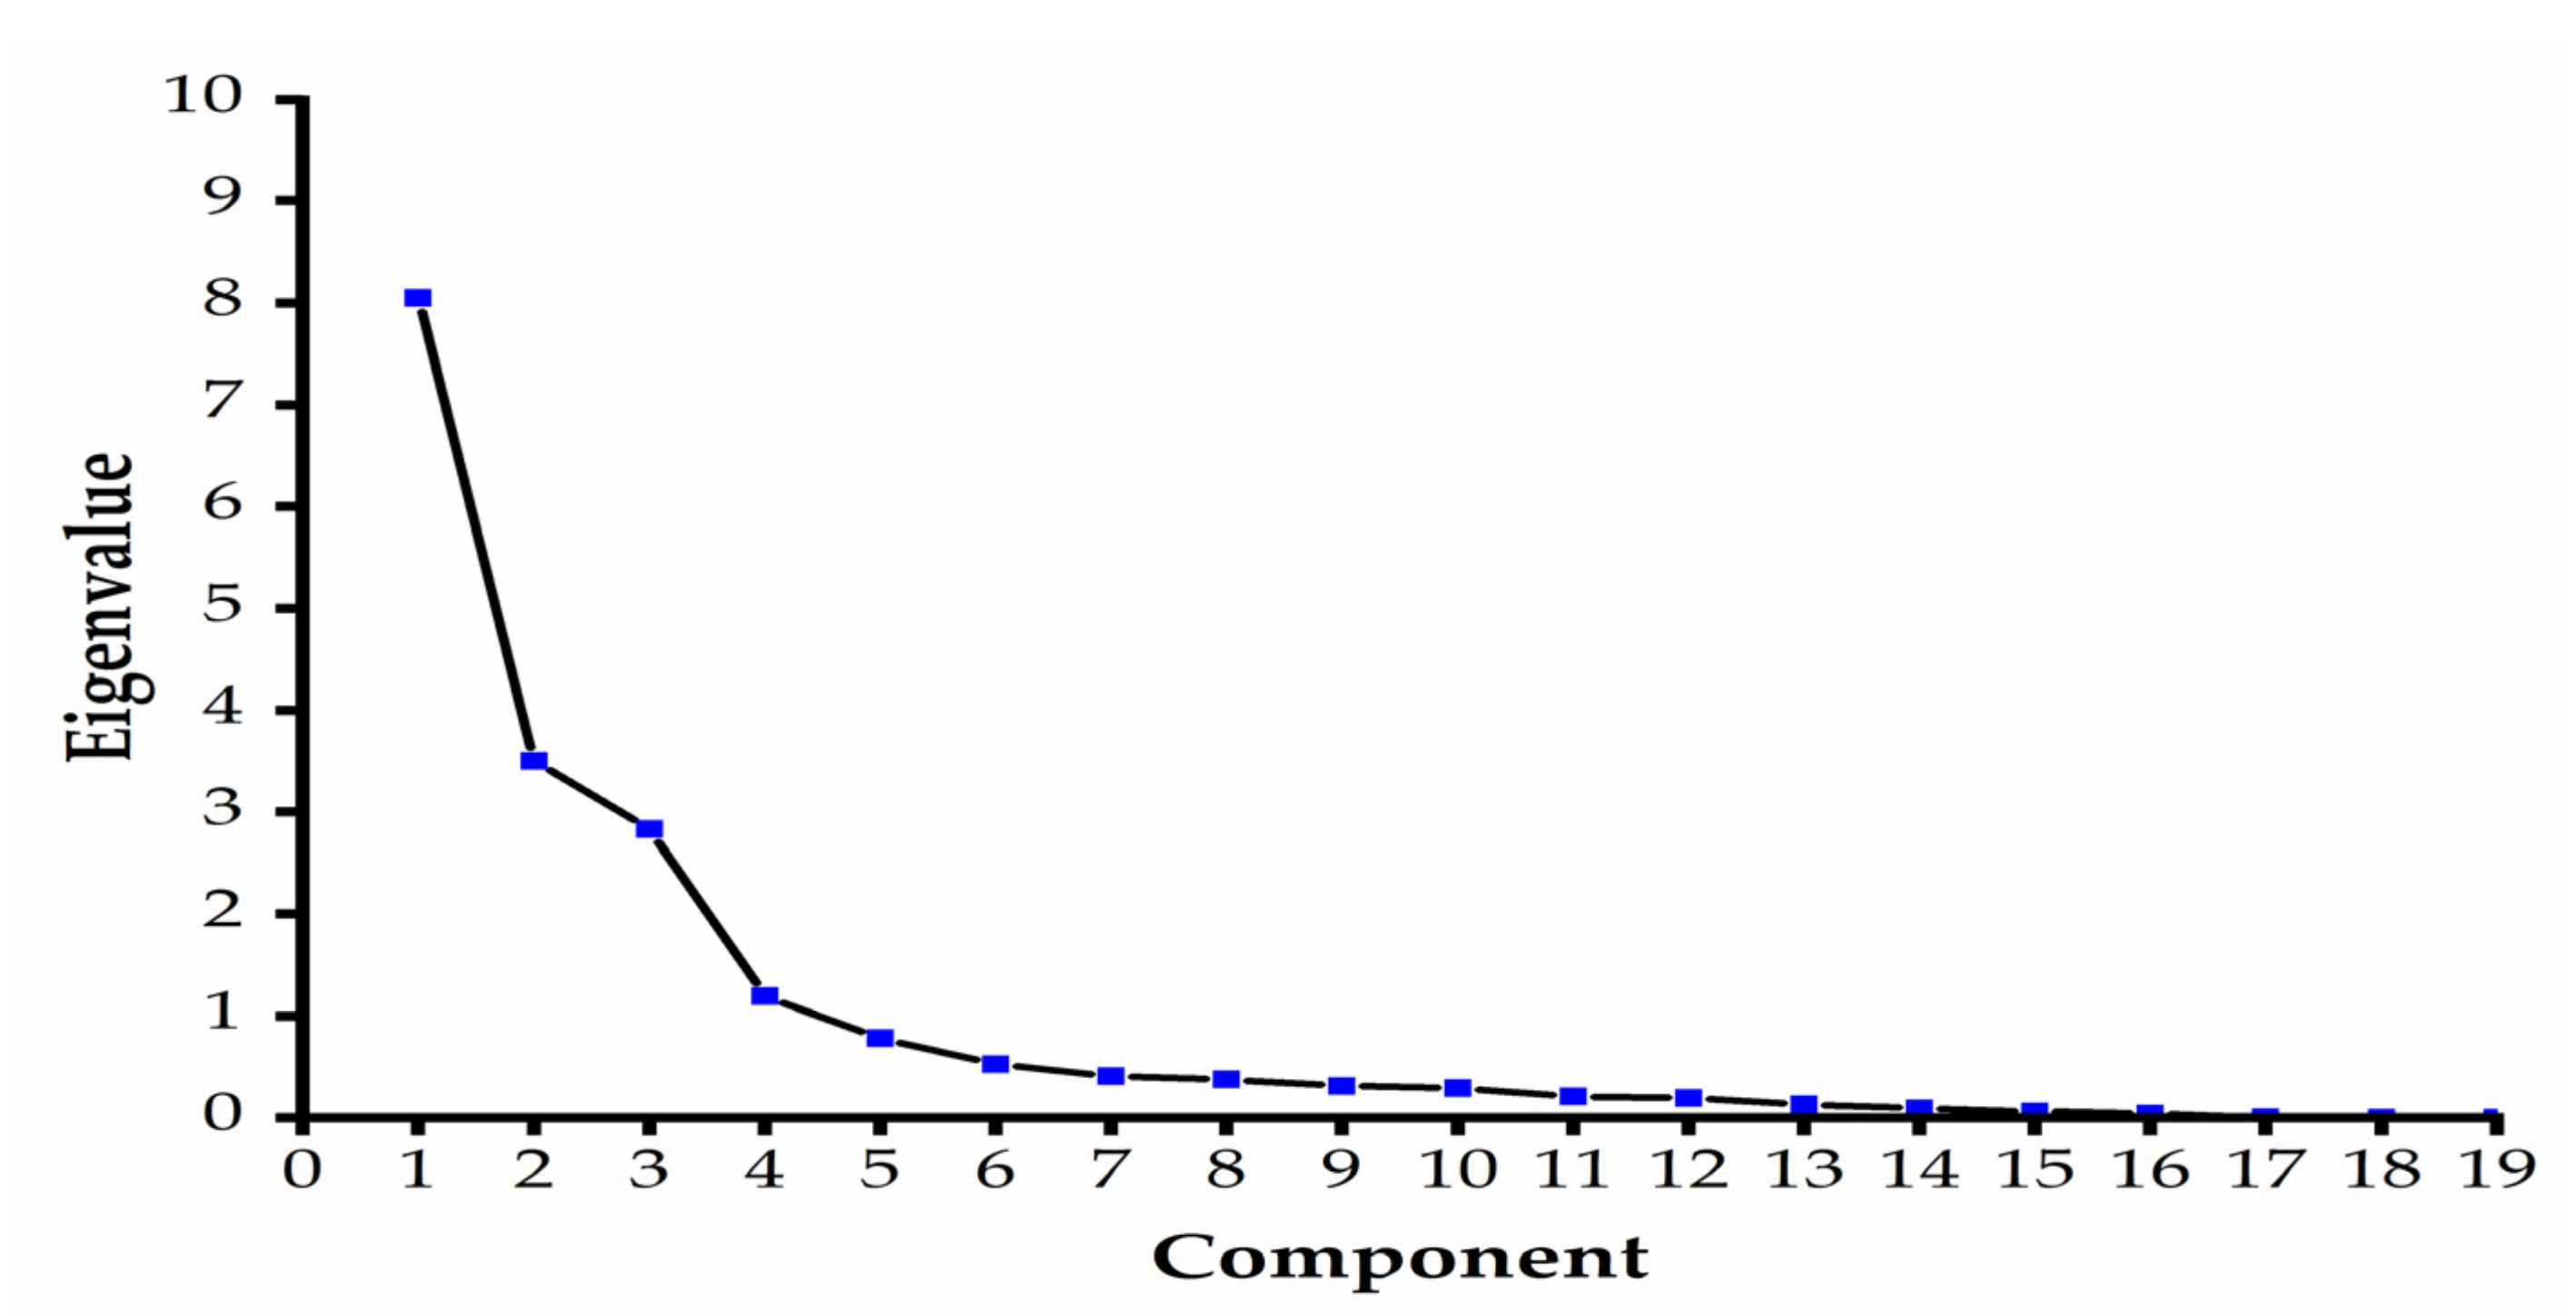
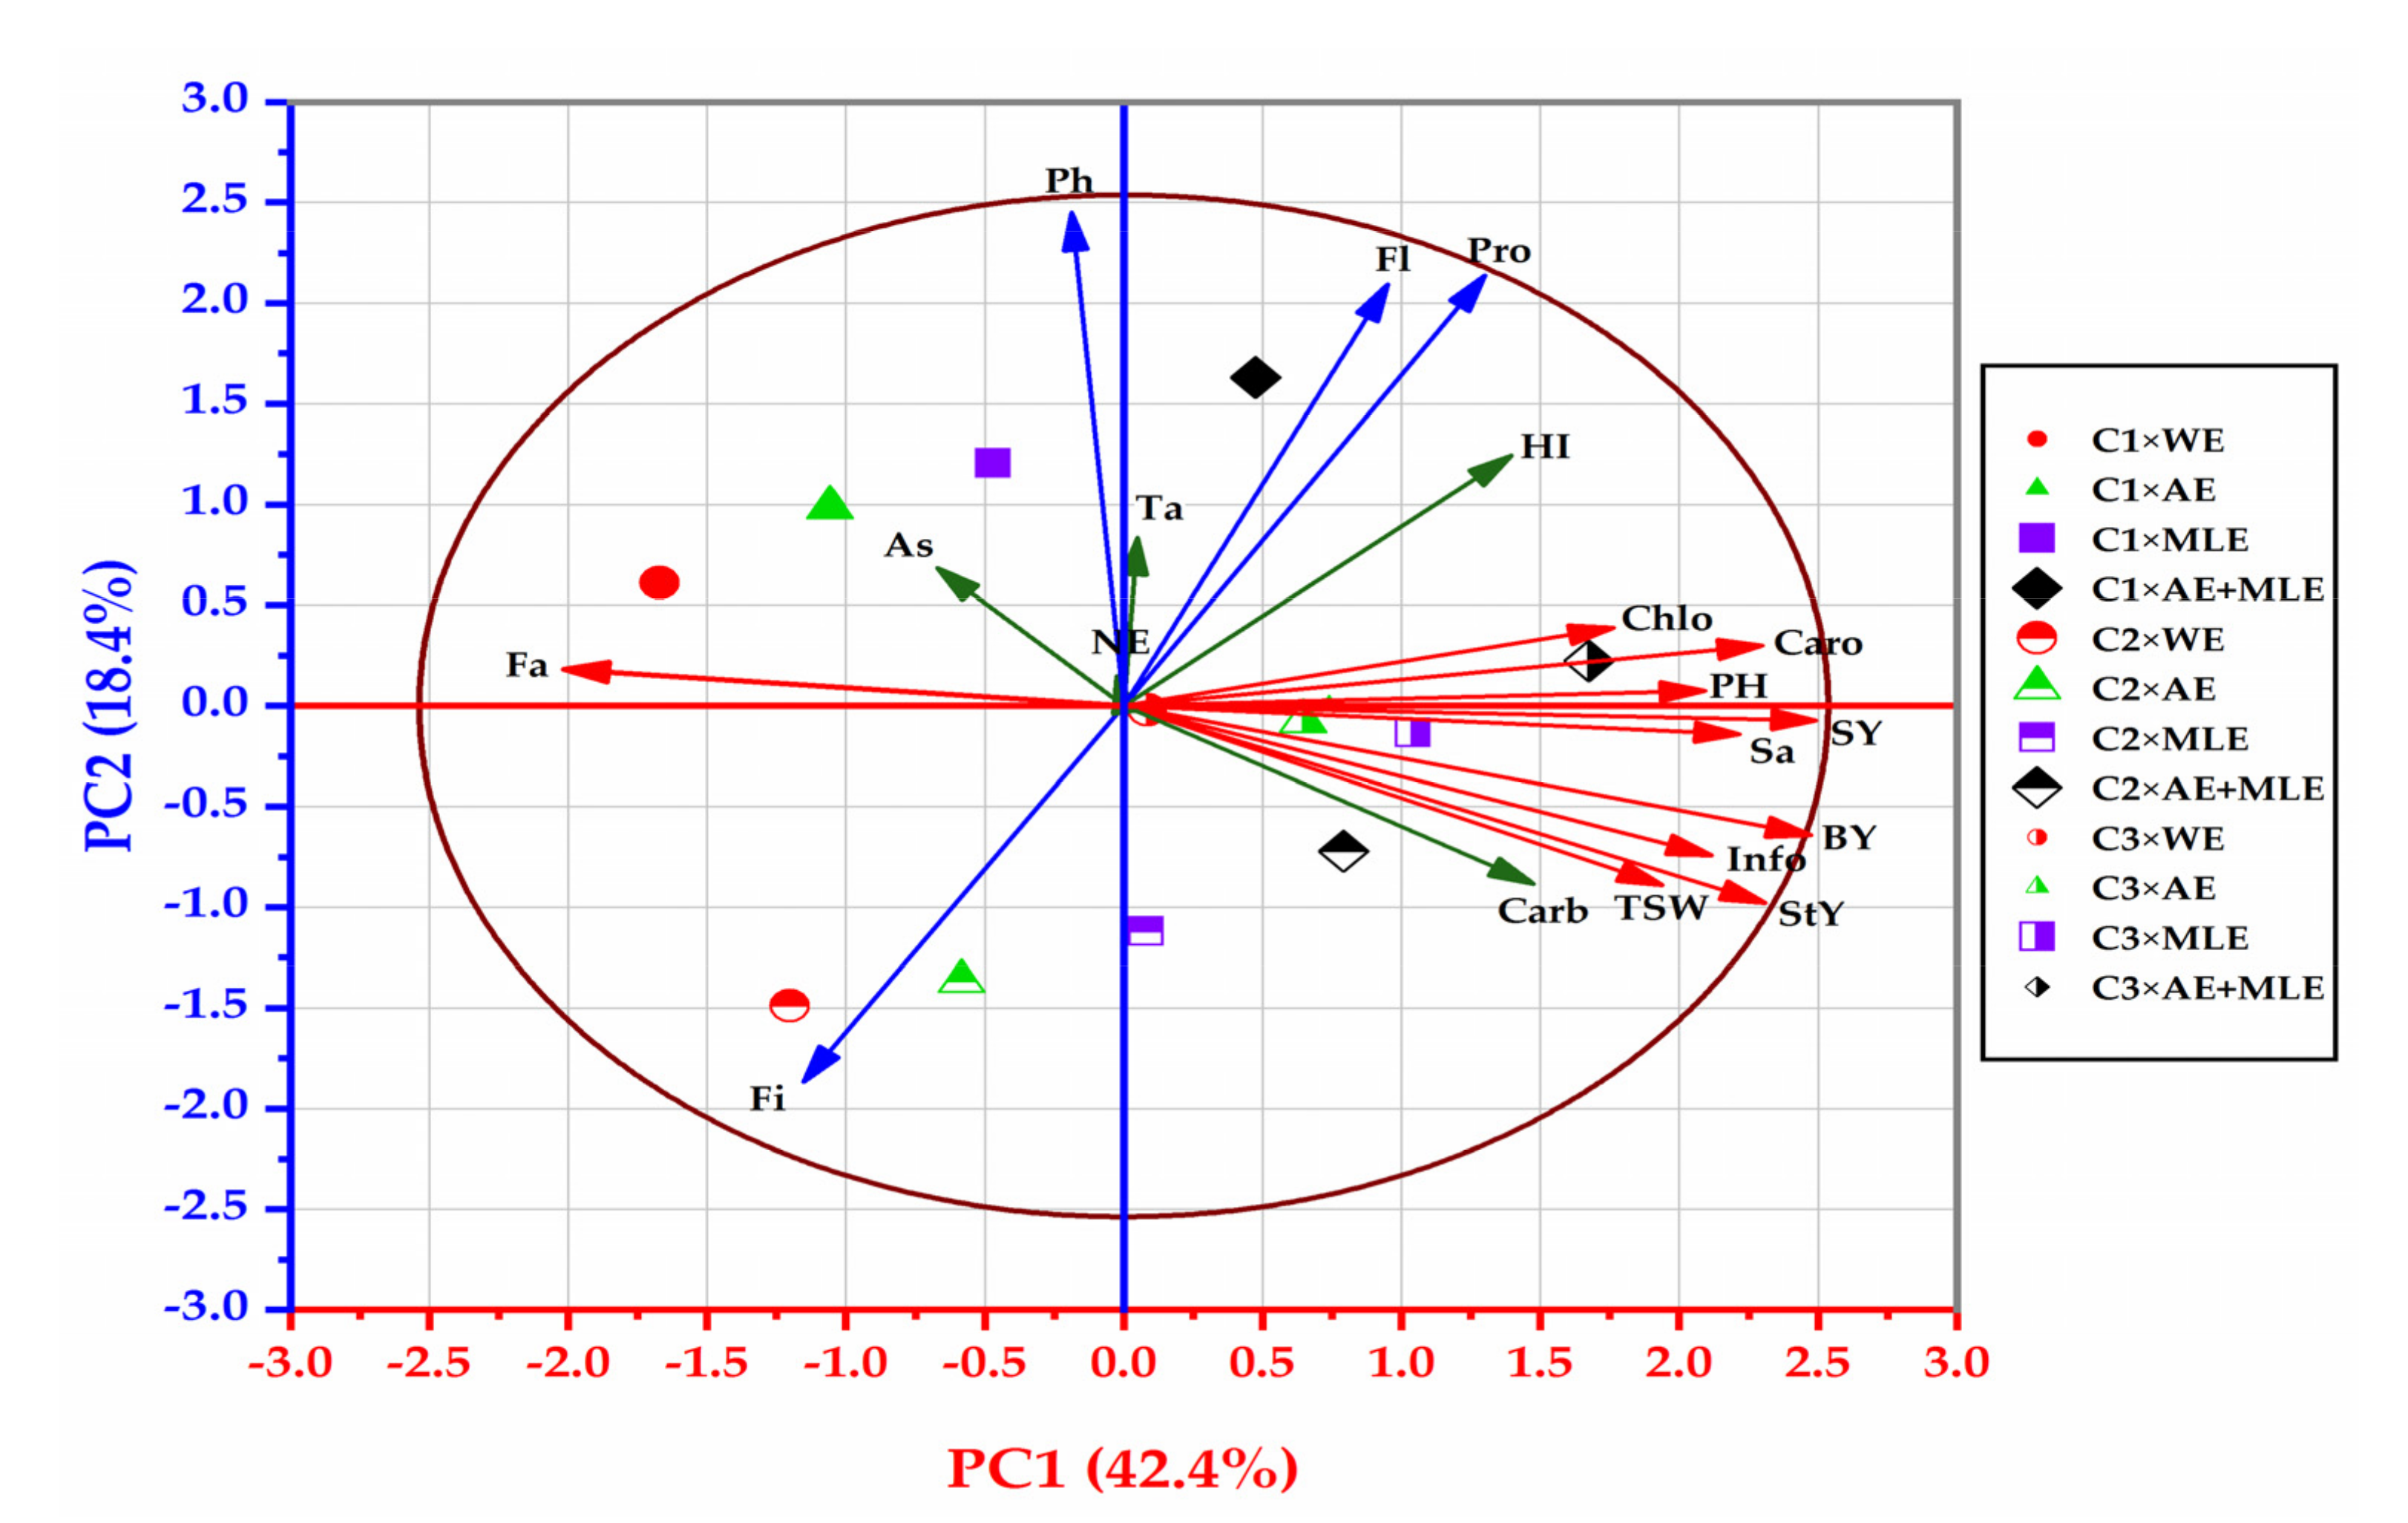
3.9. Principal Component Analysis

Principal component analysis (PCA) was conducted to measure the close relationship between different variables and the cultivar and foliar application interaction. The scree plot was drawn from the Eigenvalues associated with components in descending order, viz., the number of the components (Figure 9). Four out of nineteen components (PCs) were discovered with an Eigenvalue of >1. These principal components (PCs) contributed 81.97% towards the total variability of all traits. Contributions of PC1 were superlative towards the variability (42.36%), PC2 (18.44%), PC3 (14.90%), and PC4 (6.28%); components after 10 had eigenvalues equal to zero; and approximately 0.68% from the traits were loaded onto PC1 and PC2 (Figure 10). The correlation between traits and components is presented in Figure 11. The traits SY, PH, Info, TSW, StY, BY, Chlo, and Sa displayed a positive correlation of factor loadings on PC1, while, Fa had significantly negative loadings. On the other hand, Pro, Ph, and Fl displayed a positive correlation of factor loadings on PC2, while Fi had significantly negative loadings. Some traits showed a positive correlation with other components. The traits of AS and Ta positively correlated with PC3, while Carb and NE had a positive correlation with PC4. The variable HI is positively correlated with PC5. The vectors (arrows) in Figure 11 represent the loading for each trait on components and arrows with red color denote the traits on the first component (PC1), while blue arrows denote PC2 and green arrows present the loading on the other PCs. The colored shapes represent the individual observation under foliar treatments for each cultivar in two seasons.

4. Discussion

4.1. Plant Growth and Yield

In terms of climate, the conditions of the cultivated area and seasons were similar, as the average temperatures of the two seasons during the experiment period ranged from 13.71 °C to 21.11 °C and from 13.75 °C to 21.57 °C for the first and second seasons, respectively. Additionally, the RH% ranged from 48.43 to 65.12% for the first season and from 54.35 to 64.18% for the second season. The rainfall during the two seasons ranged from 0.15 to 0.85 mm/day for the first season and from 0.15 to 1.89 mm/day for the second season, and the wind speed ranged from 0.24 to 0.65 m s−1 and from 0.32 to 0.68 s−1 for the first and second seasons, respectively.
An enhancement was observed in the growth and outputs of quinoa cultivars following foliar application with AE or MLE. Azolla filiculoides has been widely used in agriculture for improving plant growth [34,35,36] and motivating plant tolerance to biotic and abiotic stress [38,63,64]. Azolla fixes biological N and minimizes fertilizer leaching [65]. The utilization of Azolla as a compost or soil amendment in the green manure for enhancing crop production has been previously studied in many reports. However, little information is available about Azolla extract as a foliar application, particularly in organic agriculture. Foliar application with AE presented a slight enhancement in the growth and productivity of quinoa cultivars.
Azolla is a plentiful source of macro- and micronutrients [26], crude protein, growth-promoting cytokinins, jasmonic acid, and salicylic acid [66,67], and vitamins [68]. This could raise the endogenous phytohormone levels and nutrient uptake, leading to plant growth and development improvements. Cytokinins are the phytohormones found in AE that stimulate cell division and alter apical dominance. Therefore, we noticed an improvement in plant height, inflorescence number, and yield traits following AE supplementation. These results are compatible with Ripley et al. [32], who illustrated that an improvement was detected in wheat plants subjected to Azolla filiculoides application. The addition of dry Azolla significantly improved the growth and yield of squash [36] and increased eggplant fruit yield [35]. Total chlorophyll in quinoa leaves increased after AE foliar spray. Azolla has a high content of N and Mg (Table 2), the essential elements for chlorophyll biosynthesis. In addition, the enhancement in photosynthetic pigments after AE spray could be due to the chlorophyll and carotenoids found in Azolla. Foliar application of Azolla filiculoides improved the chlorophyll content of Beta vulgaris [33]. Additionally, Sharifi et al. [64] stated that Azolla compost enhanced the chlorophyll content of safflower leaves. Dry Azolla significantly maximized leaf pigments, improved fruit characters, and increased nutrient content in squash fruits [36].
MLE is rich in essential nutrients, antioxidants, amino acids, phytohormones, phenols, and ascorbates [69,70,71]. The findings of the current study indicate that MLE substantially enhanced plant growth criteria and boosted yield characteristics. Quinoa plant growth performance has been improved following MLE due to auxins and gibberellins in MLE, which play an important role in cell elongation and thus increase stem elongation [72]. Furthermore, the high amount of zeatin found in MLE stimulates plant growth via cell division and elongation [73] and chlorophyll biosynthesis [72]. MLE provides plants with N, the necessary element for maximum plant growth and yield, and enhances nutrient uptake [74]. The enhancement in photosynthetic pigments after MLE application could be due to MLE content of Mg, the important element in the biosynthesis of chlorophyll [72], in addition to chlorophyll and carotenoids present in MLE [75]. Such a result was obtained by Rashid et al. [45], who observed an improvement in quinoa growth and seed yield following MLE foliar application under normal and heat conditions. Under the current study, the augmentation in growth attributes is reflected ultimately in yield traits that have been enhanced by AE and MLE foliar application.

4.2. Proximate Analysis

Seed protein and carbohydrates content varied significantly between cultivars. The foliar application of AE, MLE, or AE+MLE significantly increased seed protein concentration. These results are contrary to Rashid [45], who found that MLE did not increase protein content in quinoa seeds significantly. Both AE and MLE are rich in N, the necessary element for protein synthesis. A gradual increase in crude protein in wheat grains was observed with increasing nitrogen fertilization levels [76,77]. Foliar application with AE and MLE exhibited an increase in total carbohydrate in quinoa seeds. The protein and carbohydrate accumulation in quinoa seeds following AE or MLE treatments could be attributed to the protein and carbohydrate content of Azolla and moringa leaves. Such a result was reported by Latif and Mohamed [49], who observed an improvement in the soluble sugars of the common bean affected by MLE application. The cytokinins found in moringa leaves stimulate carbohydrate metabolism [78]. There is little to no documented effect of AE or MLE on fats, fiber, and ash content. Marti et al. [76] demonstrated that fiber content decreased as N levels increased. N increases the cell content and reduces the cell wall concentration [79]. These reports may confirm our results about the significant reduction in fiber content following AE or MLE applications (as a source of N) as compared with control plants. Protein had a negative correlation with both fats (r = −0.30 **) and fiber (r = −0.75 **), but a positive correlation with seed yield (r = 0.41 **). These correlations may point to a decrease in fat and fiber content in quinoa seeds as protein and seed yield increase. Similar results were obtained by Filho et al. and El-Serafy et al. [80,81]. Ash content increased following AE or MLE application, which may be due to the positive effects of these extracts on mineral content.

4.3. Photochemical Analysis

Quinoa seeds contain the antinutritional compounds saponins and tannins [10], which are found in the seed coat. Saponins and tannins have beneficial effects on the immune system [82], as an anti-inflammatory [83,84,85], anticarcinogenic, and hypocholesterolemic [86]. The lowest saponin content was observed in C1 (KVL–SRA2) along with higher tannin content, while the highest saponin content was noticed in C3 plants (Q-37) with the lowest tannin content. Such results were obtained by Melini and Melini [11] who observed that the KVL–SRA2 cultivar is the most popular for human consumption and contains the lowest level of saponins. Quinoa cultivars treated with AE, MLE, or their combination revealed a significant increase in saponins and tannin content, reaching their highest content by AE+MLE treatment. There is little information about the relationship between AE or MLE application and saponin production. Both AE and MLE provide plants with N, the essential element required for saponin and tannin biosynthesis. Panax notoginseng plants supplemented with N exhibited an increase in saponin synthesis [87]. Additionally, the increases in saponins and tannin content following MLE application may be due to the MLE content of saponins and tannins. Bilalis et al. [88] observed a positive correlation between saponin content and nitrogen fertilization.
Phenolic substances are a source of antioxidants in plants generated as a response to the oxidative damage caused by environmental stress [89]. The phenolics were two to three times greater in pigmented quinoa cultivars than in the white cultivars [90]. Total phenols and flavonoids content in quinoa seeds have been increased in response to AE and MLE foliar applications. This may be a result of the high phenol and flavonoids content in MLE and AE, which might increase the endogenous content of phenols and flavonoids [50] in quinoa seeds. This might possibly be due to the minerals, β-carotene, and vitamins included in moringa leaves, which may cause plants to enhance their phenolic metabolism. [91]. Dry Azolla application significantly increased total phenols in chamomile [92]. Yasmeen et al. [53] reported that wheat seeds primed with MLE presented an increase in total phenols. The enhancement in phenolic compounds in quinoa seeds following MLE treatment observed in the current report is parallel with that obtained in fennel plants subjected to MLE addition [20]. El-Sadek [93] investigated the yield and yield components of five quinoa genotypes in eight different environments and found that the environmental impact was the main source of variance and attributed to 88.5% of the total variance in grain yield. Additionally, genotypes and the environment × genotype interaction accounted for only 5.46 and 6.06%, respectively of the total variance; consequently, he reported that in the field experiments, which include a wide range of environments (locations and seasons), random variation appears between those environments, and this is evident in breeding programs or assessment of crop varieties. This is inconsistent with our results, as the effect of seasons was lower than the cultivars and organic extracts and their interactions as a proportion of the total variance. Based on the previous results, there are significant differences between the cultivars and organic extracts and their interactions, and we cannot accept the null hypothesis and therefore accept the alternative hypothesis.

5. Conclusions

This study was performed to shed more light on the possibility of positive effects of AE and MLE for improving plant growth, yields, seed quality, and phytochemical content of three cultivars of quinoa under organic agriculture. Foliar spray with AE or MLE had a significant (p ≤ 0.05) influence on the yields of the three cultivars. The C3 cultivar outperformed other cultivars of C1 and C2 in terms of the mentioned traits. The combination of AE+MLE was the more effective application, stimulating the yields of quinoa. The relationship between seed yield and biological yield was highly positive and statistically significant (p ≤ 0.01) (r = 0.94 **). It can be concluded that the C3 plants subjected to foliar application of AE+MLE at a rate of 20% produced maximum seed yield with the highest quality, and pharmaceutical substances under organic farming conditions.

Author Contributions

Conceptualization, methodology, A.-N.A.E.-S., R.S.E.-S., U.A.A.E.-R. and A.F.A.E.-H.; software, A.-N.A.E.-S., U.A.A.E.-R. and M.M.A.H.; validation, R.S.E.-S. and A.F.A.E.-H., formal analysis, A.-N.A.E.-S., M.M.A.H. and U.A.A.E.-R., investigation, A.-N.A.E.-S., R.S.E.-S. and A.F.A.E.-H., resources, A.-N.A.E.-S., data curation, A.-N.A.E.-S., M.M.A.H. and U.A.A.E.-R.; writing—original draft preparation, A.-N.A.E.-S., R.S.E-S., E.K. and E.K.; writing—review and editing, A.-N.A.E.-S., R.S.E.-S., E.K. and A.-N.A.E.-S.; visualization, A.-N.A.E.-S., A.A.M.A.-M. and U.A.A.E.-R.; supervision, A.-N.A.E.-S.; project administration, A.-N.A.E.-S. and U.A.A.E.-R.; funding acquisition, R.S., E.K., A.A.M.A.-M. All authors have read and agreed to the published version of the manuscript.

Funding

This research received no external funding.

Data Availability Statement

No new data were created or analyzed in this study.

Acknowledgments

Taif University Researchers Supporting Project Number (TURSP-2020/307), Taif University, Taif, Saudi Arabia. Additionally, the authors thank Prince Sattam Bin Abdulaziz University, Al-Kharj for their scientific contributions.

Conflicts of Interest

The authors declare no conflict of interest.

References

  1. Prakash, D.; Pal, M. Chenopodium: Seed protein, fractionation and amino acid composition. Int. J. Food Sci. Nutr. 1998, 49, 271–275. [Google Scholar] [CrossRef]
  2. Bhargava, A.; Shukla, S.; Ohri, D. Genetic variability and heritability of selected traits during different cuttings of vegetable Chenopodium. Ind. J. Genet. Plant Breed. 2003, 63, 359–360. [Google Scholar]
  3. James, A.L.E. Quinoa (Chenopodium quinoa Willd.): Composition, chemistry, nutritional, and functional properties. Adv. Food Nutr. Res. 2009, 58, 1–31. [Google Scholar]
  4. Repo-Carrasco, R.; Espinoza, C.; Jacobsen, S.E. Nutritional value and use of the Andean crops quinoa (Chenopodium quinoa) and kaniwa (Chenopodium pallidicaule). Food Rev. Int. 2003, 19, 179–189. [Google Scholar] [CrossRef]
  5. Stewart, L.K.; Soileau, J.L.; Ribnicky, D.; Wang, Z.Q.; Raskin, I.; Poulev, A.; Majewski, M.; Cefalu, W.T.; Gettys, T.W. Quercetin transiently increases energy expenditure but persistently decreases circulating markers of inflammation in C57BL/6J mice fed a high-fat diet. Metabolism 2008, 57, 39–46. [Google Scholar] [CrossRef] [PubMed] [Green Version]
  6. Spedding, G.; Ratty, A.; Middleton, E., Jr. Inhibition of reverse transcriptases by flavonoids. Antivir. Res. 1989, 12, 99–110. [Google Scholar] [CrossRef]
  7. Murakami, A.; Ashida, H.; Terao, J. Multitargeted cancer prevention by quercetin. Cancer Lett. 2008, 269, 315–325. [Google Scholar] [CrossRef]
  8. Jenkins, D.J.A.; Kendall, C.W.C.; Augustin, L.S.A.; Franceschi, S.; Hamidi, M.; Marchie, A.; Jenkins, A.L.; Axelsen, M. Glycemic index: Overview of implications in health and disease. Am. J. Clin. Nutr. 2002, 76, 266–273. [Google Scholar] [CrossRef]
  9. Berti, C.; Riso, P.; Monti, L.D.; Porrini, M. In vitro starch digestibility and in vivo glucose response of gluten-free foods and their gluten counterparts. Eur. J. Nutr. 2004, 43, 198–204. [Google Scholar] [CrossRef]
  10. Filho, A.M.M.; Pirozi, M.R.; Borges, J.T.D.S.; Sant’Ana, H.M.P.; Chaves, J.B.P.; Coimbra, J.S.D.R. Quinoa: Nutritional, functional, and antinutritional aspects. Crit. Rev. Food Sci. Nutr. 2017, 57, 1618–1630. [Google Scholar] [CrossRef]
  11. Melini, V.; Melini, F. Functional components and anti-nutritional factors in gluten-free grains: A focus on quinoa seeds. Foods 2021, 10, 351. [Google Scholar] [CrossRef]
  12. Valencia-Chamorro, S.A. Quinoa. In Caballero B.: Encyclopedia of Food Science and Nutrition; Academic Press: Amsterdam, The Netherlands, 2003; Volume 8, pp. 4895–4902. [Google Scholar]
  13. Güçlü-Üstündag, Ö.; Mazza, G. Saponins: Properties, applications and processing. Crit. Rev. Food Sci. Nutr. 2007, 47, 231–258. [Google Scholar] [CrossRef] [PubMed]
  14. Kuljanabhagavad, T.; Thongphasuk, P.; Chamulitrat, W.; Wink, M. Triterpene saponins from Chenopodium quinoa Willd. Phytochemistry 2008, 69, 1919–1926. [Google Scholar] [CrossRef] [PubMed]
  15. Vauzour, D.; Rodriguez-Mateos, A.; Corona, G.; Oruna-Concha, M.J.; Spencer, J.P. Polyphenols and human health: Prevention of disease and mechanisms of action. Nutrients 2010, 2, 1106–1131. [Google Scholar] [CrossRef] [PubMed] [Green Version]
  16. Lin, D.; Xiao, M.; Zhao, J.; Li, Z.; Xing, B.; Li, X.; Kong, M.; Li, L.; Zhang, Q.; Liu, Y.; et al. An overview of plant phenolic compounds and their importance in human nutrition and management of type 2 diabetes. Molecules 2016, 21, 1374. [Google Scholar] [CrossRef] [PubMed]
  17. Koch, W. Dietary polyphenols-important non-nutrients in the prevention of chronic noncommunicable diseases. A systematic review. Nutrients 2019, 11, 1039. [Google Scholar] [CrossRef] [Green Version]
  18. Jacobsen, S.E. The worldwide potential of quinoa (Chenopodium quinoa Willd.). Food Rev. Int. 2003, 19, 167–177. [Google Scholar] [CrossRef]
  19. Alandia, G.; Rodriguez, J.P.; Jacobsen, S.E.; Bazile, D.; Condori, B. Global expansion of quinoa and challenges for the Andean region. Glob. Food Sec. 2020, 26, 100429. [Google Scholar] [CrossRef]
  20. El-Serafy, R.S.; El-Sheshtawy, A.A. Effect of nitrogen fixing bacteria and moringa leaf extract on fruit yield, estragole content and total phenols of organic fennel. Sci. Hortic. 2020, 265, 109209. [Google Scholar] [CrossRef]
  21. El-Serafy, R.S.; El-Sheshtawy, A.A.; Dahab, A.A.; Al-Ashkar, I. Can yeast extract and chitosan-oligosaccharide improve fruit yield and modify the pharmaceutical active ingredients of organic fennel? Ind. Crops Prod. 2021, 173, 114130. [Google Scholar] [CrossRef]
  22. Malik, A.; Mor, V.S.; Tokas, J.; Punia, H.; Malik, S.; Malik, K.; Sangwan, S.; Tomar, S.; Singh, P.; Singh, N.; et al. Biostimulant-treated seedlings under sustainable agriculture: A global perspective facing climate change. Agronomy 2021, 11, 14. [Google Scholar] [CrossRef]
  23. El-Serafy, R.S. Phenotypic plasticity, biomass allocation, and biochemical analysis of cordyline seedlings in response to oligo-chitosan foliar spray. J. Soil Sci. Plant Nutr. 2020, 20, 1503–1514. [Google Scholar] [CrossRef]
  24. El-Serafy, R.S.; El-Sheshtawy, A.-N.A.; Atteya, A.K.; Al-Hashimi, A.; Abbasi, A.M.; Al-Ashkar, I. Seed priming with silicon as a potential to increase salt stress tolerance in Lathyrus odoratus. Plants 2021, 10, 2140. [Google Scholar] [CrossRef]
  25. Ding, Z.; Zhou, Z.; Lin, X.; Zhao, F.; Wang, B.; Lin, F.; Ge, Y.; Eissa, M.A. Biochar impacts on NH3-volatilization kinetics and growth of sweet basil (Ocimum basilicum L.) under saline conditions. Ind. Crops Prod. 2020, 157, 11290–12903. [Google Scholar] [CrossRef]
  26. Shaltout, K.H.; El-Komi, T.M.; Eid, E.M. Seasonal variation in the phytomass, chemical composition and nutritional value of Azolla filiculoides Lam. along the water courses in the Nile Delta. Egypt Feddes Reper. 2012, 123, 37–49. [Google Scholar] [CrossRef]
  27. Bocchi, S.; Malgioglio, A. Azolla-anabaena as a biofertilizer for rice paddy fields in the Po Valley, a Temperate Rice Area in Northern Italy. Int. J. Agron. 2010, 2010, 152158. [Google Scholar] [CrossRef] [Green Version]
  28. Awodun, M.A. Effect of Azolla (Azolla species) on physiomineral properties of the soil. World J. Agric. Sci. 2008, 4, 157–160. [Google Scholar]
  29. Kassem, A.H.M.; Abd El-Aal, A.M. Minimizing the effect of soil salinity on fennel plant using cyanobacteria and compost. J. Product. Dev. 2016, 21, 153–178. [Google Scholar]
  30. Setiawati, M.R.; Damayani, M.; Herdiyantoro, D.; Suryatmana, P.; Anggraini, D.; Khumairah, F.H. The application dosage of Azolla pinnata in fresh and powder form as organic fertilizer on soil chemical properties, growth and yield of rice plant. AIP Conf. Proc. 2018, 1927, 030017. [Google Scholar]
  31. Bindhu, K.B. Effect of azolla extract on growth performance of Pisum Sativum. Int. Res. J. Biol. Sci. 2013, 2, 88–90. [Google Scholar]
  32. Ripley, B.S.; Kiguli, L.N.; Barker, N.P. Azolla fliculoides as a biofertilizer of wheat under dry-land soil conditions. South Afr. J. Bot. 2003, 69, 295–300. [Google Scholar] [CrossRef]
  33. De Bever, A.; Ndakidemi, P.A.; Laubscher, C.P. Efects of different combinations of Hoagland’s solution and Azolla fliculoides on photosynthesis and chlorophyll content in Beta vulgaris subsp. Cycla ‘fordhook giant’ grown in hydroponic cultures. Afr. J. Biotechnol. 2013, 12, 2006–2012. [Google Scholar]
  34. Petruccelli, R.; Bati, C.B.; Carlozzi, P.; Padovani, G.; Vignozzi, N.; Bartolini, G. Use of Azolla as a growing medium component in the nursery production of olive trees. Int. J. Basic Appl. Sci. 2015, 4, 333–339. [Google Scholar] [CrossRef] [Green Version]
  35. Musse, A.A.; El-Sheshtawy, A.A.; Massoud, O.N.; Ghanem, K.M. Response of eggplant to irrigation water quality, fertilization and organic extracts under urban agriculture system. Al-Azhar J. Agric. Res. 2021, 46, 74–90. [Google Scholar]
  36. Youssef, M.A.; AL-Huqail, A.A.; Ali, E.F.; Majrashi, A. Organic amendment and mulching enhanced the growth and fruit quality of squash plants (Cucurbita pepo L.) grown on silty loam soils. Horticulturae 2021, 7, 269. [Google Scholar] [CrossRef]
  37. Malyan, S.K.; Bhatia, A.; Kumar, S.S.; Fagodiya, R.K.; Pugazhendhi, A.; Duc, P.A. Mitigation of greenhouse gas intensity by supplementing with Azolla and moderating the dose of nitrogen fertilizer. Biocatal. Agric. Biotechnol. 2019, 20, 101266. [Google Scholar] [CrossRef]
  38. Maswada, H.F.; Abd El-Razek, U.A.; El-Sheshtawy, A.A.; Mazrou, Y.S.A. Effect of Azolla filiculoides on growth, physiological and yield attributes of maize grown under water and nitrogen deficiencies. J. Plant Growth Regul. 2021, 40, 558–573. [Google Scholar] [CrossRef]
  39. Rady, M.M.; Varma, B.C.; Howladar, S.M. Common bean (Phaseolus vulgaris L.) seedlings overcome NaCl stress as a result of presoaking in Moringa oleifera leaf extract. Sci. Hortic. 2013, 162, 63–70. [Google Scholar] [CrossRef]
  40. Yasmeen, A.; Nouman, W.; Basra, S.M.A.; Wahid, A.; Hussain, N.; Afzal, I. Morphological and physiological response of tomato (Solanum lycopersicum L.) to natural and synthetic cytokinin sources: A comparative study. Acta Physiol. Plant 2014, 36, 3147–3155. [Google Scholar] [CrossRef]
  41. Elzaawely, A.A.; Ahmed, M.E.; Maswada, H.F.; Xuan, T.D. Enhancing growth, yield, biochemical, and hormonal contents of snap bean (Phaseolus vulgaris L.) sprayed with moringa leaf extract. Arch. Agron. Soil Sci. 2017, 63, 687–699. [Google Scholar] [CrossRef]
  42. Atteya, A.K.G.; Sami, R.; Al-Mushhin, A.A.M.; Ismail, K.A.; Genaidy, E.A.E. Response of seeds, oil yield and fatty acids percentage of Jojoba Shrub strain EAI to mycorrhizal fungi and moringa leaves extract. Horticulturae 2021, 7, 395. [Google Scholar] [CrossRef]
  43. Abdalla, M.M. The potential of Moringa oleifera extract as a biostimulant in enhancing the growth, biochemical and hormonal contents in rocket (Eruca vesicaria subsp. sativa) plants. Int. J. Plant Physiol. Biochem. 2013, 5, 42–49. [Google Scholar]
  44. Iqbal, M.A. Improving the growth and yield of canola (Brassica napus L.) with seed treatment and foliar sprays of brassica (Brassica naups L.) and moringa (Moringa oleifera L.) leaf extracts. Am.-Eurasian J. Agric. Environ. Sci. 2014, 14, 1067–1073. [Google Scholar]
  45. Rashid, N.; Basra, S.M.; Shahbaz, M.; Iqbal, S.; Hafeez, M.B. Foliar applied moringa leaf extract induces terminal heat tolerance in quinoa. Int. J. Agric. Biol. 2018, 20, 157–164. [Google Scholar]
  46. Yasmeen, A.; Basra, S.M.A.; Farooq, M.; Rehman, H.; Hussain, N.; Athar, H.R. Exogenous application of moringa leaf extract modulates the antioxidant enzyme system to improve wheat performance under saline conditions. Plant Growth Regul. 2013, 69, 225–233. [Google Scholar] [CrossRef]
  47. Howladar, S.M. A novel Moringa oleifera leaf extract can mitigate the stress effects of salinity and cadmium in bean (Phaseolus vulgaris L.) plants. Ecotoxicol. Environ. Saf. 2014, 100, 69–75. [Google Scholar] [CrossRef]
  48. Maswada, H.F.; Abd El-Razek, U.A.; El-Sheshtawy, A.A.; Elzaawely, A.A. Morpho-physiological and yield responses to exogenous moringa leaf extract and salicylic acid in maize (Zea mays L.) under water stress. Arch. Agron. Soil Sci. 2018, 64, 994–1010. [Google Scholar] [CrossRef]
  49. Latif, H.H.; Mohamed, H.I. Exogenous applications of moringa leaf extract effect on retro transposon, ultra structural and biochemical contents of common bean plants under environmental stresses. S. Afr. J. Bot. 2016, 106, 221–231. [Google Scholar] [CrossRef]
  50. Aslam, M.; Sultana, B.; Anwar, F.; Munir, H. Foliar spray of selected plant growth regulators affected the biochemical and antioxidant attributes of spinach in a field experiment. Turk. J. Agric. For. 2016, 40, 136–145. [Google Scholar] [CrossRef]
  51. Prabhu, M.; Kumar, A.R.; Rajamani, K. Influence of different organic substances on growth and herb yield of sacred basil (Ocimum sanctum L.). Indian J. Agric. Res. 2010, 44, 48–52. [Google Scholar]
  52. Nasir, M.; Khan, A.S.; Basra, S.A.; Malik, A.U. Foliar application of moringa leaf extract, potassium and zinc influence yield and fruit quality of ‘Kinnow’mandarin. Sci. Hortic. 2016, 210, 227–235. [Google Scholar]
  53. Yasmeen, A.; Basra, S.M.A.; Wahid, A.; Nouman, W.; Rehman, H. Exploring the potential of Moringa oleifera leaf extract (MLE) as seed priming agent in improving wheat performance. Turk. J. Bot. 2012, 37, 512–520. [Google Scholar]
  54. Dere, Ş.; Güneş, T.; Sivaci, R. Spectrophotometric determination of chlorophyll-A, B and total carotenoid contents of some algae species using different solvents. Tr. J. Botany 1998, 22, 13–17. [Google Scholar]
  55. AOAC. Official Methods of Analysis, 17th ed.; Association of Official Analytical Chemists: Gaithersburg, MD, USA, 2000. [Google Scholar]
  56. Weinmann, H. Determination of total available carbohydrates in plants. Plant Physiol. 1947, 22, 279–290. [Google Scholar] [CrossRef] [Green Version]
  57. Martinez, E.A.; Veas, E.; Jorquera, C.; San Martın, R.; Jara, P. Re-Introduction of quinoa into Arid Chile: Cultivation of two lowland races under extremely low irrigation. J. Agron. Crop Sci. 2009, 195, 1–10. [Google Scholar] [CrossRef]
  58. Chanwitheesuk, A.; Teerawutgulrag, A.; Rakariyatham, N. Screening of antioxidant activity and antioxidant compounds of some edible plants of Thailand. Food Chem. 2004, 92, 491–497. [Google Scholar] [CrossRef]
  59. Rebaya, A.; Souad, I.B.; Béatrice, B.; Valérie, M.L.; Fathi, M.; Evelyne, O.; Jamila, K.C.; Malika, T.A. Total phenolic, total flavonoid, tannin content, and antioxidant capacity of Halimium halimifolium (Cistaceae). J. Appl. Pharm. Sci. 2014, 5, 52–57. [Google Scholar]
  60. Boateng, J.; Verghese, M.; Walker, L.T.; Ogutu, S. Effect of processing on antioxidant contents in selected dry beans (Phaseolus spp. L.). LWT-Food Sci. Technol. 2008, 41, 1541–1547. [Google Scholar] [CrossRef]
  61. Talukdar, D. Flavonoid-deficient mutants in grass pea (Lathyrus sativus L.): Genetic control, linkage relationships, and mapping with aconitase and S-nitrosoglutathione reductase isozyme loci. Sci. World J. 2012, 2012, 345983. [Google Scholar] [CrossRef] [Green Version]
  62. Gomez, K.A.; Gomez, A.A. Statistical Procedures for Agricultural Research; John Wiley & Sons: Hoboken, NJ, USA, 1984. [Google Scholar]
  63. Razavipour, T.; Moghaddam, S.S.; Doaei, S.; Noorhosseini, S.A.; Damalas, C.A. Azolla (Azolla filiculoides) compost improves grain yield of rice (Oryza sativa L.) under different irrigation regimes. Agric. Water Manag. 2018, 209, 1–10. [Google Scholar]
  64. Sharifi, P.; Shorafa, M.; Mohammadi, M.H. Comparison of the effect of cow manure, vermicompost, and azolla on safflower growth in a saline-sodic soil. Commun. Soil Sci. Plant Anal. 2019, 50, 1417–1424. [Google Scholar]
  65. Maham, S.G.; Rahimi, A.; Subramanian, S.; Smith, D.L. The environmental impacts of organic greenhouse tomato production based on the nitrogen-fixing plant (Azolla). J. Clean. Prod. 2020, 245, 118679. [Google Scholar] [CrossRef]
  66. Stirk, W.A.; Van Staden, J. Occurrence of cytokinin-like compounds in two aquatic ferns and their exudates. Environ. Exp. Bot. 2003, 49, 77–85. [Google Scholar] [CrossRef]
  67. De Vries, S.; De Vries, J.; Teschke, H.; von Dahlen, J.K.; Rose, L.E.; Gould, S.B. Jasmonic and salicylic acid response in the fern Azolla filiculoides and its cyanobiont. Plant Cell Environ. 2018, 41, 2530–2548. [Google Scholar] [CrossRef]
  68. Maham, S.G.; Rahimi, A.; Smith, D.L. Environmental assessment of the essential oils produced from dragonhead (Dracocephalum moldavica L.) in conventional and organic farms with different irrigation rates. J. Clean. Prod. 2018, 204, 1070–1086. [Google Scholar] [CrossRef]
  69. Gopalakrishnan, L.; Doriya, K.; Kumar, D.S. Moringa oleifera: A review on nutritive importance and its medicinal application. Food Sci. Hum. Wellness 2016, 5, 49–56. [Google Scholar]
  70. Carillo, P. GABA shunt in durum wheat. Front. Plant Sci. 2018, 9, 100. [Google Scholar] [CrossRef]
  71. Atteya, A.K.G.; Albalwa, A.N.; El-Serafy, R.S.; Albalwa, K.; Bayomy, H.M.; Genaidy, E.A.E. Response of Moringa oleifera seeds and fixed oil production to vermicompost and NPK under calcareous soil conditions. Plants 2021, 10, 1998. [Google Scholar] [CrossRef]
  72. Taiz, L.; Zeiger, E. Plant Physiology, 5th ed.; Sinauer Associates, Inc., Publishers Sunderland: Sunderland, MA, USA, 2010; p. 782. [Google Scholar]
  73. Fuglie, L.J. The Miracle Tree: Moringa Oleifera: Natural Nutrition for the Tropics. The Miracle Tree: The Multiple Attributes of Moringa; Harborne, J.B., Ed.; Introduction to Ecological Biochemistry; Academic Press: New York, NY, USA, 2000; p. 172. [Google Scholar]
  74. Nurzyńska-Wierdak, R. Does mineral fertilization modify essential oil content and chemical composition in medicinal plants? Acta Sci. Pol. Hortorum Cultus 2013, 12, 3–16. [Google Scholar]
  75. Ashfaq, M.; Basra, S.; Ashfaq, U. Moringa: A miracle plant of agro-forestry. J. Agric. Soc. Sci. 2012, 8, 115–122. [Google Scholar]
  76. Marti, A.; Ulrici, A.; Foca, G.; Quaglia, L.; Pagani, M.A. Characterization of common wheat flours (Triticum aestivum L.) through multivariate analysis of conventional rheological parameters and gluten peak test indices. LWT-Food Sci. Technol. 2015, 64, 95–103. [Google Scholar] [CrossRef] [Green Version]
  77. Kunkulberga, D.; Linina, A.; Ruza, A. Effect of nitrogen fertilization on protein content and rheological properties of winter wheat wholemeal. Foodbalt 2019, 2019, 88–92. [Google Scholar]
  78. Emongor, V.E. Effects of moringa (Moringa oleifera) leaf extract on growth, yield and yield components of snap beans (Phaseolus vulgaris). Br. J. Appl. Sci. Technol. 2015, 6, 114–122. [Google Scholar] [CrossRef]
  79. Van Soest, P.J. Nutritional Ecology of the Ruminant; Cornell University Press: Ithaca, NY, USA, 1994; p. 476. [Google Scholar]
  80. Filho, M.M.; Destro, D.; Miranda, L.A.; Spinosa, W.A.; CarrãoPanizzi, M.C.; Montalván, R. Relationships among oil content, protein content and seed size in soybeans. Braz. Arch. Biol. Technol. 2001, 44, 23–33. [Google Scholar] [CrossRef] [Green Version]
  81. El-Serafy, R.S.; El-Sheshtawy, A.A.; Ali, H.E. Phenology, architecture, yield and fatty acid content of chia in response to sowing date and plant spacing. Fayoum J. Agric. Res. Dev. 2020, 34, 314–331. [Google Scholar]
  82. Verza, S.G.; Silveira, F.; Cibulski, S.; Kaiser, S.; Ferreira, F.; Gosmann, G.; Roehe, P.M.; Ortega, G.G. Immunoadjuvant activity, toxicity assays, and determination by UPLC/Q-TOFMS of triterpenic saponins from Chenopodium quinoa seeds. J. Agric. Food Chem. 2012, 60, 3113–3118. [Google Scholar] [CrossRef]
  83. Yao, Y.; Yang, X.; Shi, Z.; Ren, G. Anti-inflammatory activity of saponins from quinoa (Chenopodium quinoa Willd.) seeds in lipopolysaccharide-stimulated RAW 264.7 macrophages cells. J. Food Sci. 2014, 79, 1018–1023. [Google Scholar]
  84. Noratto, G.; Carrión-Rabanal, R.; Medina, G.; Mencia, A.; Mohanty, I.; González, D.A.; Murphy, K. Quinoa protective effects against obesity-induced intestinal inflammation. FASEB J. 2015, 29, 602–609. [Google Scholar] [CrossRef]
  85. Noratto, G.D.; Murphy, K.; Chew, B.P. Quinoa intake reduces plasma and liver cholesterol, lessens obesity-associated inflammation, and helps to prevent hepatic steatosis in obese db/db mouse. Food Chem. 2019, 287, 107–114. [Google Scholar] [CrossRef]
  86. Shi, J.; Arunasalam, K.; Yeung, D.; Kakuda, Y.; Mittal, G.; Jiang, Y. Saponins from edible legumes: Chemistry, processing, and health benefits. J. Med. Food 2004, 7, 67–78. [Google Scholar] [CrossRef] [PubMed]
  87. Wei, W.; Ye, C.; Huang, H.; Yang, M.; Mei, X.; Du, F.; He, X.; Zhu, S.; Liu, Y. Appropriate nitrogen application enhances saponin synthesis and growth mediated by optimizing root nutrient uptake ability. J. Ginseng Res. 2020, 44, 627–636. [Google Scholar] [CrossRef]
  88. Bilalis, D.; Kakabouki, I.; Karkanis, A.; Travlos, I.; Triantafyllidis, V.; Hela, D. Quinoa seed and saponin production of organic quinoa (Chenopodium quinoa Willd.) for different tillage and fertilization. Not. Bot. Horti Agrobot. Cluj-Napoca 2012, 40, 42–46. [Google Scholar] [CrossRef] [Green Version]
  89. Berni, R.; Luyckx, M.; Xu, X.; Legay, S.; Sergeant, K.; Hausman, J.-F.; Lutts, S.; Cai, G.; Guerriero, G. Reactive oxygen species and heavy metal stress in plants: Impact on the cell wall and secondary metabolism. Environ. Exp. Bot. 2019, 161, 98–106. [Google Scholar] [CrossRef]
  90. Liu, M.; Zhu, K.; Yao, Y.; Chen, Y.; Guo, H.; Ren, G.; Yang, X.; Li, J. Antioxidant, anti-inflammatory, and antitumor activities of phenolic compounds from white, red, and black Chenopodium quinoa seed. Cereal Chem. 2020, 97, 703–713. [Google Scholar] [CrossRef]
  91. Aslam, M.; Sultana, B.; Ali, S.; Ur-Rehman, K. Modification in antioxidant potential of Coriandum sativum using selected plant growth regulators. Asian J. Chem. 2014, 26, 5105–5109. [Google Scholar] [CrossRef]
  92. Rabie, K.A.E.; El-Sherif, M.H.; El-Shahat, R.M.; Ali, F.S.I. Azolla as an alternative of mineral nitrogen for chamomile plant (Matricaria chamomilla L.) fertilization in sandy soil. Asian J. Soil Sci. Plant Nutr. 2020, 5, 1–13. [Google Scholar]
  93. El-Sadek, A.N. Multi-environmental evaluation for grain yield and its components of quinoa genotypes across the northwestern coast of Egypt. Egypt. J. Desert Res. 2017, 67, 65–82. [Google Scholar] [CrossRef]
Figure 1. Effect of Azolla extract, moringa leaf extract, and their combination on (a) plant height (cm), (b) inflorescences number plant−1, and (c) 1000-seed weight (g) of three quinoa cultivars. C1 = KVL−SRAZ, C2 = Chipaya, C3 = Q−37, WE = without extract, AE = Azolla extract, MLE = moringa leaf extract. Data are mean value ± SE, n = 3. Different letters denote significant differences at p ≤ 0.05 level.
Agronomy 11 02186 g001
Figure 2. Effect of Azolla extract, moringa leaf extract, and their combination on (a) seed yield (kg ha−1), (b) straw yield (kg ha−1), (c) biological yield (kg ha−1), and (d) harvest index (%) of three quinoa cultivars. C1 = KVL−SRAZ, C2 = Chipaya, C3 = Q-37, WE = without extract, AE = Azolla extract, MLE = moringa leaf extract. Data are mean value ± SE, n = 3. Different letters denote significant differences at p ≤ 0.05 level.
Agronomy 11 02186 g002
Figure 3. Effect of Azolla extract, moringa leaf extract, and their combination on (a) total chlorophyll (mg g−1 FW), and (b) carotenoids (mg g−1 FW) of three quinoa cultivars. C1 = KVL−SRAZ, C2 = Chipaya, C3 = Q−37, WE = without extract, AE = Azolla extract, MLE = moringa leaf extract. Data are mean value ± SE, n = 3. Different letters denote significant differences at p ≤ 0.05 level.
Agronomy 11 02186 g003
Figure 4. Effect of Azolla extract, moringa leaf extract, and their combination on (a) fats (%), (b) protein (%), and (c) carbohydrates (%) of three quinoa cultivars. C1 = KVL−SRAZ, C2 = Chipaya, C3 = Q−37, WE = without extract, AE = Azolla extract, MLE = moringa leaf extract. Data are mean value ± SE, n = 3. Different letters denote significant differences at p ≤ 0.05 level.
Agronomy 11 02186 g004
Figure 5. Effect of Azolla extract, moringa leaf extract, and their combination on (a) ash (%), (b) fiber (%), and (c) nutritional energy (kcal) of three quinoa cultivars. C1 = KVL−SRAZ, C2 = Chipaya, C3 = Q−37, WE = without extract, AE = Azolla extract, MLE = moringa leaf extract. Data are mean value ± SE, n = 3. Different letters denote significant differences at p ≤ 0.05 level.
Agronomy 11 02186 g005
Figure 6. Effect of Azolla extract, moringa leaf extract, and their combination on (a) saponin (mg g−1 DW), and (b) tannins (mg TAE g−1 DW) of three quinoa cultivars. C1 = KVL−SRAZ, C2 = Chipaya, C3 = Q−37, WE = without extract, AE = Azolla extract, MLE = moringa leaf extract. Data are mean value ± SE, n = 3. Different letters denote significant differences at p ≤ 0.05 level.
Agronomy 11 02186 g006
Figure 7. Effect of Azolla extract, moringa leaf extract, and their combination on (a) phenolics (mg GAE g−1 DW), and (b) flavonoids (mg CAE g−1 DW) of three quinoa cultivars. C1 = KVL−SRAZ, C2 = Chipaya, C3 = Q−37, WE = without extract, AE = Azolla extract, MLE = moringa leaf extract. Data are mean value ± SE, n = 3. Different letters denote significant differences at p ≤ 0.05 level.
Agronomy 11 02186 g007
Figure 8. Matrix of Pearson’s correlation coefficients and correlation plots for studied traits. Pearson’s correlation coefficients are presented in the bottom-left half. The correlation plots are presented in the upper right half. The colors of the boxes represent positive or negative correlations according to a color scale. P-values below 0.05 and 0.01 are expressed as * and **, respectively. Seed yield (SY), plant height (PH), inflorescences number plant (Info), 1000-seed weight (TSW), straw yield (StY), biological yield (BY), harvest index (HI), total chlorophyll (Chlo), carotenoids (Caro), fats (Fa), ash (As), fiber (Fi), nutritional energy (NE), saponin (Sa), tannins (Ta), phenolics (Ph), and flavonoids (Fl).
Agronomy 11 02186 g008
Figure 9. Scree plot of principal component analysis components of quinoa cultivars subjected to foliar application of Azolla (AE) and moringa (MLE) extracts.
Agronomy 11 02186 g009
Figure 10. The plot of correlation between traits and components in PCA.
Agronomy 11 02186 g010
Figure 11. Biplot of the principal component analysis (PCA) of Chenopodium quinoa foliar sprayed with Azolla (AE), moring (MLE) extracts, and their combination. The first and second principal components (PC1 and PC2) presented 60.8%. The vectors show the studied traits, and the colored shapes explained various treatments.
Agronomy 11 02186 g011
Table 1. Temperature, relative humidity (RH), rainfall, and wind speed (WS) of Cairo, Egypt, (30°03′12″ N and 31°19′05.2″ E) in the winter seasons of 2018/2019 and 2019/2020.
SeasonTemperature (°C)RH
(%)
RainfallWS
(m s−1)
MaximumMinimumAverage(mm/day)
Season 2018/2019
2018 year
November26.1314.6220.3764.320.520.24
December21.2111.1316.1765.120.560.28
2019 year
January19.218.1913.7150.900.440.33
February22.158.2515.2056.820.660.32
March23.7312.3318.0356.290.850.64
April27.3914.8321.1148.430.150.65
Season 2019/2020
2019 year
November27.7016.0318.3657.090.210.32
December21.4811.7216.661.650.670.43
2020 year
January18.509.0013.7562.740.870.57
February20.9410.1115.5264.180.960.40
March23.7912.4518.1263.561.890.65
April27.8315.3221.5754.350.150.68
Table 2. Azolla and moringa chemical constituents (mg g−1 DW).
NPKCaMgZn
Azolla19.61.9111.320.67.90.17
Moringa23.63.814.116.39.31.5
Table 3. Mean squares of source of variation for combined analysis of variance on studied traits of quinoa cultivars (C) and the organic extracts (OE) tested for two seasons (S).
TraitsSR (S)CS × CError (I)OES × OEC × OES × C × OEError (II)
df14228336636
SY35,79383,8002,196,667 **368011,5221,182,889 **22,87656,415 *21,80020,624
PH126.9162.4358.7 **2.119.0323.3 **4.524.2 **2.76.9
Info0.0040.32516.08 **0.4110.2413.7 **0.1610.777 *0.2740.30
TSW0.0310.0110.562 **0.0130.0050.664 **0.0010.017 **0.0040.004
StY136,643106,5697,396,168 **17,19814,5971,596,958 **69,064 *109,584 **47,788 *17,819
BY312,310 **261,231 **17,224,209 **657718,8855,517,462 **271,247 **177,146 *45,71553,809
HI0.1513.4928.62 **2.123.5224.86 **6.887.85 *6.253.45
Chlo0.010.0150.0360.040.0120.586 **0.0190.010.0120.021
Caro0.0020.0000.015 **0.0000.0000.035 **0.0000.0000.001 *0.000
Fa0.0270.0921.77 **0.0080.0184.24 **0.0520.832 **0.0270.029
Pro0.0040.0646.31 **0.0250.0321.50 **0.0080.059 **0.0090.013
Carb0.263.3611.72 **3.031.274.07 **1.192.13 *0.4970.87
As0.0350.0933.33 **0.0070.060.530 **0.0040.0540.0130.029
Fi0.0080.0451.96 **0.030.0280.422 **0.0050.228 **0.0080.017
NE0.69111.68 *129.91 *44.5119.5747.29 *35.3451.54 **7.4414.99
Sa0.000020.000080.139 **0.000100.000020.0067 **0.000110.000050.000050.00001
Ta0.00130.00000.0201 **0.00120.00160.0101 **0.00010.0017 *0.00090.0006
Ph0.1900.0505.52 **0.0250.0230.373 **0.0500.137 **0.0220.031
Fl0.00010.002211.412 **0.01340.0420.405 **0.01200.11 *0.0210.041
Significance differences at 0.05 and 0.01 are expressed as * and **, respectively. Seed yield (SY), plant height (PH), inflorescences number plant (Info), 1000-seed weight (TSW), straw yield (StY), biological yield (BY), harvest index (HI), total chlorophyll (Chlo), carotenoids (Caro), fats (Fa), ash (As), fiber (Fi), nutritional energy (NE), saponin (Sa), tannins (Ta), phenolics (Ph), and flavonoids (Fl).
Table 4. Variance components as the percentage of individual sources of variation in the total for studied traits of quinoa cultivars (C) and the organic extracts (OE) tested for two seasons (S).
TraitsSR (S)CS × CError (I)OES × OEC × OES × C × OEError (II)
df14228336636
SY0.373.4644.290.080.9536.610.713.491.358.69
PH4.1721.3623.580.145.0131.870.444.760.538.14
Info0.001.3733.840.862.0243.400.514.911.7311.36
TSW0.851.1331.700.851.1356.330.082.830.854.25
StY0.621.9366.960.160.5321.680.942.981.302.90
BY0.551.8560.850.020.2729.241.441.880.483.42
HI0.0312.0512.780.946.2916.664.6110.528.3727.75
Chlo0.331.982.312.643.3058.091.981.982.3125.08
Caro1.560.7519.400.961.1165.660.592.542.185.25
Fa0.131.6015.280.090.6554.860.6921.520.694.49
Pro0.021.3867.100.271.3325.220.161.860.272.39
Carb0.2211.5420.145.218.7410.503.0810.992.5627.02
As0.293.5964.530.102.0315.410.103.100.7710.08
Fi0.132.3451.040.782.8616.540.1317.850.657.68
NE0.0021.3012.304.307.506.805.1014.802.1025.80
Sa0.000.2087.900.100.209.300.200.300.301.50
Ta1.050.1332.381.8610.1124.490.288.334.3117.06
Ph1.271.3373.550.331.207.461.005.460.877.53
Fl0.000.0385.500.101.244.550.142.460.475.51
Seed yield (SY), plant height (PH), inflorescences number plant (Info), 1000-seed weight (TSW), straw yield (StY), biological yield (BY), harvest index (HI), total chlorophyll (Chlo), carotenoids (Caro), fats (Fa), ash (As), fiber (Fi), nutritional energy (NE), saponin (Sa), tannins (Ta), phenolics (Ph), and flavonoids (Fl).
Table 5. Mean squares of source of variation for split-plot design for studied traits of quinoa cultivars (C) and the organic extracts (OE) tested at 2018/2019 and 2019/2020 seasons.
Season2018/20192019/2020
SourcesRCError (I)OEC× OEError (II)RCError (I)OEC× OEError (II)
df22436182243618
SY72,350.091,182,504 **16,468.03808,294 **6892.30226,352.8495,249 *1,017,843 **6575454,092 **26,34620,452
PH527.6 **1938 **13.071633 **664.8 **14.06278.43 *154.80 *18.75174.65 **19.96 *7.24
Info0.1378.687 **0.2647.568 **0.578 *0.2150.5147.591 **0.2186.328 **0.872 *0.273
TSW0.01240.371 **0.0070.361 **0.022 *0.0040.0070.205 **0.0030.305 **0.010 *0.004
StY19,9843,575,937 **11,080944,563 **88,362 *24,615193,156 *3,837,433 **18,113721,460 **69,009 **11,024
BY72,761 *8,212,878 **88583,485,758 **199,944 *74,031449,700 *8,667,902 **28,9122,302,954 **139,583 **33,587.
HI15.9444.187 **5.4214.52 **7.57 *3.1411.0410.59 *1.1213.55 **5.85 *2.04
Chlo0.0030.00030.0020.255 **0.0080.0070.0270.0760.0230.349 **0.0140.035
Caro0.00040.0064 **0.00020.0187 **0.00020.00020.00020.0089 **0.00020.0163 **0.00060.0003
Fa0.0521.004 **0.0181.924 **0.388 **0.3090.132 *0.775 **0.0192.364 **0.471 **0.027
Pr0.12 *3.57 **0.0080.81 **0.04 *0.0130.0092.77 **0.0540.778 **0.033 *0.012
Carb4.72 *13.59 **0.392.82 **1.49 *0.561.998.30 *0.905.10 **1.09 *0.35
As0.176 **1.625 **0.0090.281 **0.020.0120.0091.711 **0.0430.253 **0.0460.045
Fi0.066 *0.761 **0.0080.179 **0.137 **0.0170.0241.234 **0.0480.247 **0.099 **0.016
NE143.82 **142.01 **6.4242.37 *34.79 *10.48954.56100.42 *11.25116.93 **24.18 *6.71
Sa0.00040.1426 **0.00030.0116 **0.00020.00020.00020.1365 **0.00010.0087 **0.00040.0004
Ta0.0000020.014836 **0.0016650.00526 **0.001103 *0.0004040.000080.00792 *0.000800.00602 **0.00167 *0.00061
Ph0.0382.312 **0.0270.159 **0.108 **0.0240.0603.184 **0.0190.277 **0.083 *0.031
Fl0.0046.019 **0.0500.266 **0.115 *0.0410.0015.309 **0.0330.151 *0.105 *0.035
Significance differences at 0.05 and 0.01 are expressed as *, and **, respectively. Seed yield (SY), plant height (PH), inflorescences number plant (Info), 1000-seed weight (TSW), straw yield (StY), biological yield (BY), harvest index (HI), total chlorophyll (Chlo), carotenoids (Caro), fats (Fa), ash (As), fiber (Fi), nutritional energy (NE), saponin (Sa), tannins (Ta), phenolics (Ph), and flavonoids (Fl).
Publisher’s Note: MDPI stays neutral with regard to jurisdictional claims in published maps and institutional affiliations.

