Article

Modelling the Kinetics of Color and Texture Changes of Dabai (Canarium odontophyllum Miq.) during Blanching

by
Rosnah Shamsudin
1,2,*,
Siti Hajar Ariffin
1,
Wan Nor Zanariah Zainol @ Abdullah
3,
Nazatul Shima Azmi
1 and
Arinah Adila Abdul Halim
1
1
Department of Process and Food Engineering, Faculty of Engineering, Universiti Putra Malaysia, Serdang 43400, Selangor, Malaysia
2
Laboratary of Halal Services, Halal Products Research Intitute, Universiti Putra Malaysia, Serdang 43400, Selangor, Malaysia
3
Department of Basic Science and Engineering, Faculty of Agriculture and Food Sciences, Universiti Putra Malaysia Bintulu Sarawak Campus, Bintulu 97008, Sarawak, Malaysia
*
Author to whom correspondence should be addressed.
Agronomy 2021, 11(11), 2185; https://doi.org/10.3390/agronomy11112185
Submission received: 28 September 2021 / Revised: 26 October 2021 / Accepted: 27 October 2021 / Published: 29 October 2021
(This article belongs to the Special Issue Advances in Fruit Postharvest Physiology and Technology)

Abstract

:
Dabai (Canarium odontophyllum Miq.) is a fruit that is often eaten by first blanching in hot water to make the flesh creamier and softer, before it is served as a snack or side dish. In this study, Dabai fruit was blanched at different temperatures between 60 and 100 °C, with an increment of 10 °C, for up to 10 min, and the kinetics of quality changes (color and texture) were studied. Kinetic models that were assessed for changes of color and texture were zero-order, first-order, and fractional conversion model. The results showed that L parameter had no change throughout the blanching process, while parameters a*, b*, chroma (C), and total color difference (TCD) resulted as significantly increased as the temperature and duration of blanching increased. However, the change of firmness was not significant due to minor changes of firmness as the temperature and time increased. In terms of kinetic models, zero and fractional-conversion order well described the changes of a* parameter; while zero, first and fractional conversion well described parameters b*, C and TCD. Change of firmness did not fit with zero or first-order. All of the kinetic models obeyed the Arrhenius equation. Thus, the fitted kinetic models can be used to design the blanching process of Dabai fruit.

Graphical Abstract

1. Introduction

Dabai, or its scientific name Canarium odontophyllum Miq., is an underutilized indigenous seasonal fruit that was discovered on Borneo Island, Malaysia, particularly in the Sibu and Kapit regions of Sarawak [1,2,3]. Due to its resemblance to the olive fruit in terms of its physical appearance, texture, and flavor, Dabai was called the ‘Sarawak Olive’ although it is not botanically related to the olive family [3]. Dabai fruit is harvested when the immature white fruit becomes purplish-black. A sickle and net are used to collect falling fruit and branches, due to the cutting of terminal branches of the fruit panicles [4]. Physically, Dabai fruit has an oblong shape, with a thin and edible skin, and either white or yellow flesh. It also has a unique flavor [5]. When ripe, the skin of the Dabai fruit is blue-black in color. The pigment color of the skin is mainly attributed to anthocyanin (cyanine-3-glucoside) [6,7]. Dabai fruits are famous for their high nutrient content, high levels of antioxidants, and richness in minerals such as potassium, phosphorus, calcium and magnesium [8].
The local population always eat Dabai fruit by dipping it in soy sauce or using it as an ingredient in a recipe such as ‘nasi goreng Dabai’. According to Ding [4], one of the most common methods of preparing Dabai fruit is by blanching it for 15 min using lukewarm water. This method improves the smooth, creamy texture and rich flavor of the fruit. According to Xiao et al. [9], blanching is a rapid process of heating vegetables and fruit to a predetermined temperature, making sure that the temperature is constant for a specified amount of time, usually between one, to less than 10 min. Observation of the effects of blanching on the Irish York cabbage that was performed by Abu-Ghannam and Jaiswal [10] indicated that there were reductions in the texture and color of the York cabbage. Color and texture were considered to be the quality attributes of food materials that ensured product acceptability. There is a lack of research conducted on the effect of blanching on Dabai fruit, and the temperature and duration time of blanching that can preserve the quality of Dabai fruits has not been identified.
The common preparation method of Dabai fruit uses blanching in warm or hot water to enhance the texture and creamy taste [11]. However, the locals’ blanching process does not have a predetermined temperature or specific amount of time. Based on locals’ observations in preparing Dabai fruit, cooking was performed only by judging its appearance. There were no specific temperatures or a fixed duration. If the blanching process was not performed properly, two conditions could occur: under-blanching or over-blanching. Under-blanching would speed up enzyme activity, while over-blanching would result in the degradation of texture, color, phytochemicals, and minerals [12]. Hence, determination of the best parameters for the blanching process of Dabai fruit, by studying the kinetics of the quality changes such as the sensory properties and physicochemical properties, is essential. In the blanching process, the Arrhenius equation determines the parameter changes due to dependency on the temperature. The Arrhenius equation is then substituted into kinetic models, such as zero-order and first-order, for quality factors’ prediction.
Modelling the kinetic changes of the effect of blanching on Dabai fruit is important to determine the quality changes in terms of sensory or physicochemical characteristics, especially color and texture. Several models have been proposed to predict color and texture changes. However, there is no established empirical or structured model to explain the changes in color and texture due to blanching. Thus, by referring to other studies conducted on other fruits and vegetables, the best-fit model would be suitable to be applied. The following quality change values were evaluated: L* for whiteness or brightness, a* for redness or greenness, b* for yellowness or blueness, C* for chroma, and TCD for total color difference. Kinetic data will help predict the quality losses resulting from the blanching process and also improve the determination of the optimal processing conditions of fruit [13]. The rate equations for zero, first and fractional-conversion orders show the effect mathematically [14]. Therefore, the orders of reaction are a part of the rate equation. Recent research on the effect of blanching on fruit reported that the texture and color of the blanching of pumpkin followed fractional conversion model kinetics [15]. Furthermore, for blanching of mangosteen pericarp, Ziabakhsh Deylami et al. [7] reported that the a*, C* and TCD values followed the zero-order model, while the L* value followed the first-order model. As stated in Gonçalves et al. [16], most of the published studies showed that texture changes followed the first-order kinetic model; and color changes were well described by zero or first-order kinetic models. However, every sample had different mathematical models to predict the degradation of the reaction rates in food. The parameters studied depended on temperature changes, and were described by Arrhenius equation. Furthermore, the rate constant, normally described by Arrhenius behavior, found that blanching’s most important parameters were temperature and duration. The effect of temperature was substituted in quality factors prediction by inserting the Arrhenius into the kinetic models. This work investigates the effects of blanching on the degradation kinetics of color and texture of Dabai fruit. In addition, the model can be used to determine the trend changes of the color and texture of blanched Dabai fruits according to different temperatures and durations of the blanching process.

2. Materials and Methods

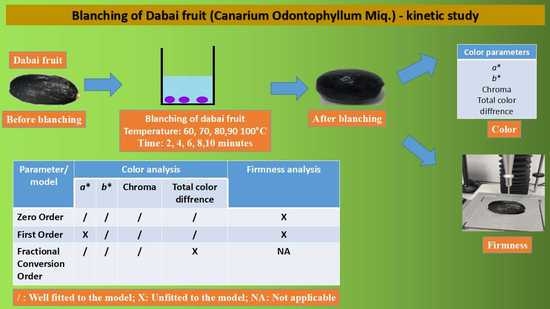
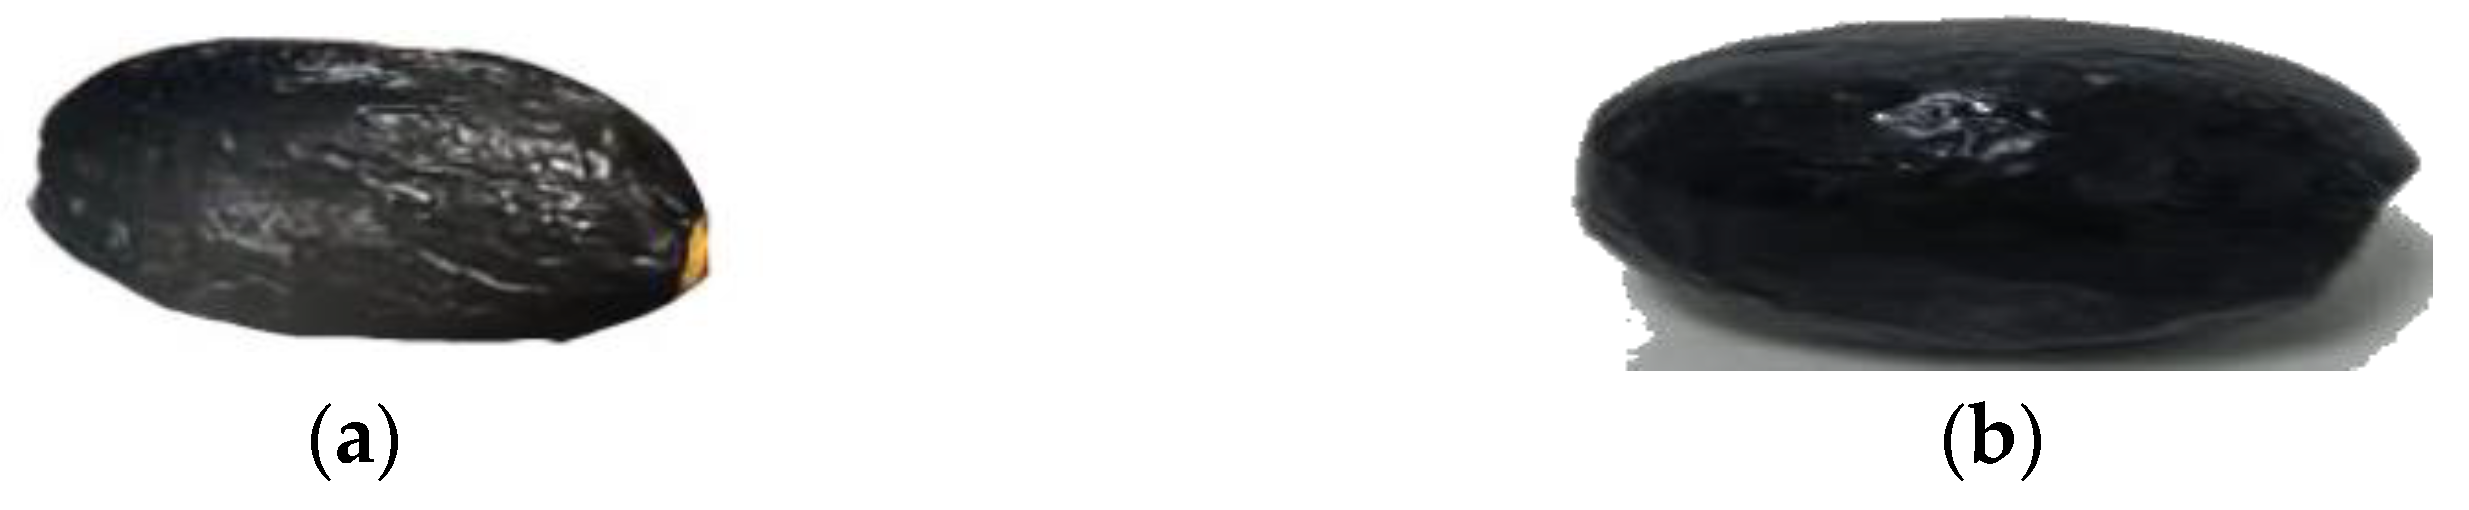
2.1. Plant Materials and Their Preparation

Dabai fruit of the Ngemah variety were obtained from a Dabai fruit supplier in Sibu, Sarawak, Malaysia. The fruit was packed in an icebox and transported on the same day to the University of Putra Malaysia, Serdang, Selangor, Malaysia. As soon as the fruit arrived, they were placed in the freezer (SJC218, Sharp, Selangor, Malaysia) at a temperature of −4 °C. Dabai fruit that were free from damages and pests were taken (in triplicate) as raw material for blanching evaluation.

2.2. Blanching

Before blanching treatment, Dabai fruit were defrosted for 5 min at room temperature. Blanching was carried out by immersing the fruit in a beaker filled with distilled water, and heated using a water bath (JSSB, Laft Technologies, Melbourne, Australia) at a temperature between 60 and 100 °C, with an increment of 10 °C. For all temperatures, samples were blanched for up to 10 min, with 2 min intervals. After that, the samples were drained off and analyzed for color and texture properties.

2.3. Color Analysis

The color of the blanched Dabai samples was determined by a colorimeter (Miniscan EZ Spectrophotometer, HunterLab, Reston, VA, USA). The colorimeter was first calibrated with a white and black tile. The color parameters measured were L* for whiteness or brightness, a* for redness or greenness, and b* for yellowness or blueness. The quantitative attribute of colorfulness, also known as chroma, C*, and total color difference, TCD, were calculated using Equations (1) and (2) respectively [17]:
C = a * 2 + b * 2
T C D = ( L * L o * ) + ( a * a o * ) 2 + ( b * b o * ) 2    

2.4. Texture Analysis

Texture analysis of blanched Dabai fruit was performed using a Texture Analyzer (TA-XT plus, Stable Micro Systems, Surrey, UK), where the parameter measured was firmness (N). A 500 g load cell was used for energy and firmness measurements, and was equipped with a 5 mm diameter probe [15]. A single puncture measurement of 10 mm depth of penetration with a velocity of 1.0 mm s−1 was made on each sample. Force formation curves were recorded, and firmness was observed by reading the area under the curves and the slope newton (N/mm). The analysis was conducted in triplicate.

2.5. Mathematical Models and Kinetics Analysis for Color and Texture of Blenched Dabai Fruits

The kinetics of the blanched Dabai fruit color change were described by their fit to the three models of zero-order, first-order and fractional order. The zero-order model equation is shown in Equation (3) below:
P = P 0 k t
where P is the parameter to be estimated, the subscript 0 is the parameter’s initial value, t is the blanching time, and k is the rate constant at temperature. To plot the graph of the first-order equation, the equation was then converted into Equation (4) [18]:
1 P P 0 = k t
where the y axis is (1 − P/P0), the x axis is the duration of blanching in minutes (t), and the slope of the graph is determined as the kinetic reaction rate.
As for the first-order equation model, it is shown below in the Equation (5) [19]:
P P 0 = e k t
where it is converted into Equation (6) for graph plotting, where the y axis is identified as ln (P/P0), the x axis is determined as the duration of blanching in minutes (t), and the slope of the graph is identified as the kinetic reaction rate in (−k).
l n ( P P 0 ) = k t
The fractional conversion model is based on a first-order model and is used when the quality parameters vary from the initial value; it is shown in Equation (7) below according to Gonçalves et al. [15]:
P P e q P 0 P e q = e k t
The fractional conversion equation is then simplified into Equation (8) for the plotting of the graph. Where the y axis is identified as ln (P − Peq)/(P0 − Peq), the x axis is identified as the duration of blanching in minutes (t), and the slope is identified as the kinetic reaction rate (−k) [18]:
l n ( P P e q P 0 P e q ) = k t
The reaction rate temperature dependence follows the Arrhenius equation where the activation energy (Ea) is determined. The activation energy is determined by the slope of the graph (ln k) versus (1/T). The Arrhenius equation is shown in Equation (9) [18]:
k = A exp [ E a R ( 1 T ) ]
where A is the reaction constant of the infinite temperature, Ea is activation energy, R is the gas constant at 8.3145 J/mol K, and T is the absolute temperature (in Kelvin).
The Arrhenius equation is then simplified into Equation (10) where the y axis is identified as the logarithm of kinetic reaction rate (ln k), the x axis is identified as the inverse of temperature of blanching in Kelvin (1/T), and the slope is determined (−Ea/R):
l n   k = l n   A + E a R ( 1 T )

2.6. Statistical Analysis

All experiments were conducted in triplicate. All the statistical analyses and data were fitted to models using analysis of variance (ANOVA) carried out by Minitab (Minitab 12.0 InfinityQS, Bethlehem, PA, USA). Results are expressed as mean values ± standard deviation. The differences in analysis of variance (ANOVA) were judged by significance at the p < 0.05 level.

3. Results and Discussion

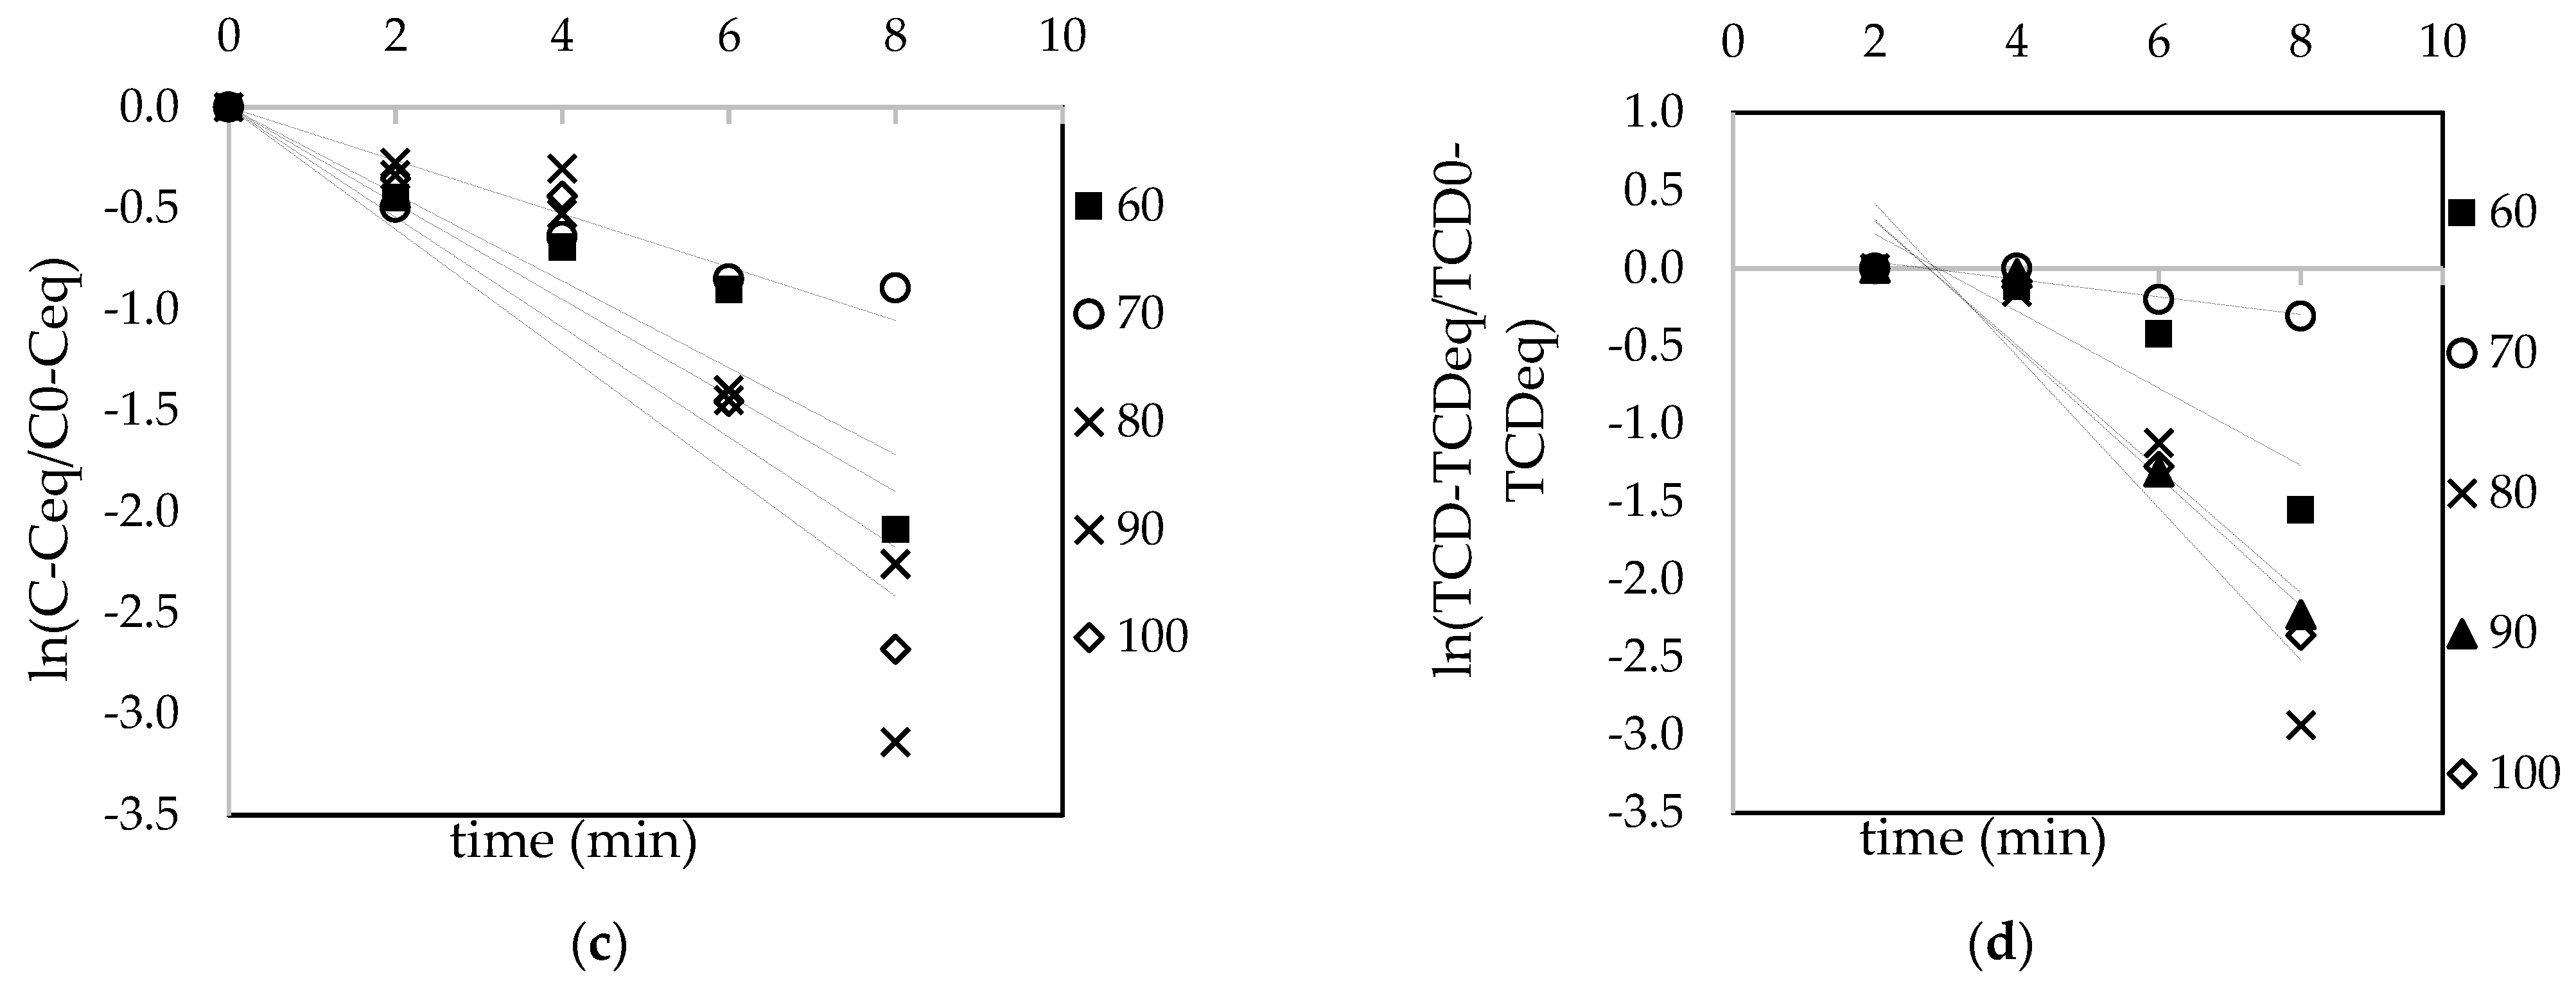
3.1. Mathematical Model and Kinetic Analysis for Color of Blenched Dabai Fruit

By using CIE scale parameters, several co-ordinates were identified: a* (indicating redness or greenness), b* (indicating yellowness or blueness), L (indicating whiteness or brightness), chroma, and total color difference (TCD). Figure 1 shows a photograph of Dabai fruit before and after blanching treatment. By the naked eye, it was seen that the physical appearance of Dabai fruit, in terms of color, changed after blanching treatment. Figure 2a–d, Figure 3a–c and Figure 4a–d, display the zero-order, first-order and fractional first-order, respectively, of the kinetic model for the effect of blanching temperatures (60, 70, 80, 90 and 100 °C) on the color parameters of Dabai fruit, being: (a) *a, (b) *b, (c) chroma and (d) TCD. Table 1 presents the reaction rate (k) and coefficient of determination (R2) of the zero-order kinetic model, first-order kinetic model and fractional conversion order model, of changes of color parameter (a*, b*, C and TCD) of blanched Dabai fruit, respectively.
Figure 2a shows that the experimental data of a* data fitted in the zero-order kinetic model. The slope of the graph indicated that the kinetic constants became steeper as the temperature increased. For the first-order kinetic model, parameter a* was not suitable to be used due to the negative initial value of −0.2573, which resulted in an error in the calculation of the equation. Thus the modified version of the first-order kinetic, known as the fractional conversion model, was used to describe the changes of the a* parameter value due to blanching. According to Table 1, the k values of a* parameter in fractional conversion order were 0.003 (60 °C), 0.001 (70 °C), 0.005 (80 °C), 0.005 (90 °C), and 0.005 (100 °C), respectively. Figure 4a shows that the slope became steeper as the temperature increased, indicating higher k as the temperature increased. This result was in agreement with Dini et al. [19], where the roasting process of pistachio nuts resulted in changes of a* where it gained redness, and the kinetic constants (k) also increased as temperature increased using the zero-order kinetic model. Additionally, in another study, a* parameter was well fitted with the fractional conversion model for the color changes of pumpkin due to blanching [15]. The high value of coefficient determination (R2) of the a* parameter fitted into zero-order (0.853–0.989) and fractional conversion (0.876–0.931) models, proving that both models described the a* value changes well.
For b* parameter, based on Table 1, in the zero-order kinetic model, the values of k were −0.025 (60 °C), −0.037 (70 °C), −0.071 (80 °C), −0.242 (90 °C), and −0.366 (100 °C). Figure 2b shows the slope indicating the value of k became steeper as temperature increased, which indicated higher k as temperature increased. A similar trend could be seen in the first-order kinetic model where the k values were −0.004 (60 °C), −0.0005 (70 °C), −0.001 (80 °C), and −0.0013 (100 ℃), and it can be seen in Figure 3b that the slope became steeper as temperature increased. The modelling of b* parameter in the fractional conversion model also showed the same trend, where the k values were 0.003 (60 ℃), 0.003 (70 ℃), 0.009 (80 ℃), 0.004 (90 °C), and 0.006 (100 °C). In Table 1, the result indicated the increasing trend of k as temperature increased as significantly different (p < 0.05) to b* parameter, in zero, first, and fractional conversion order, where the value of R2 was between 0.912 and 0.978, 0.916 and 0.984, and 0.841 and 0.980, respectively. High coefficient determination (R2) for the three models proved that the b* parameter changes were well fitted to them. These findings were similar to findings of other literature using various samples where the b* parameter greatly fit the zero, first, and fractional first-order kinetic models [7,18,19].
For the chroma value parameter, the value of k in zero-kinetic order was −0.037 (60 °C), −0.071 (70 °C), −0.242 (80 °C), −0.349 (90 °C), and −0.366 (100 °C). In Figure 2c, a similar trend could be observed in the first-order kinetic model, where the k value obtained was −0.007 (60 °C), −0.0009 (70 °C), −0.0023 (80 °C), −0.0028 (90 °C), and −0.0029 (100 °C), showing a steeper slope as temperature increased. The trend of the chroma changed in the fractional conversion kinetic model, which also showed a similar trend of steeper slopes as blanching temperatures increased, with k values of 0.004 (60 °C), 0.002 (70 °C), 0.005 (80 °C), 0.004 (90 °C), and 0.005 (100 °C), as shown in Figure 3b. Table 1 shows that the coefficient of determination (R2) for the chroma parameter ranged from 0.961 to 0.986, 0.935 to 0.979, and 0.899 to 0.956, for zero, first, and fractional conversion order, respectively. The high R2 indicated the high suitability of changes of parameter chroma with increasing temperature and time, during blanching. The increasing kinetic reaction rates for the chroma showing the color saturation of Dabai fruit was greatly influenced by the blanching temperature. The vividness or saturation of color occurred as the temperature and duration of blanching treatment increased [20,21,22].
As for the TCD kinetic reaction rates, the k values were −0.485 (60 °C), −0.309 (70 °C), −0.356 (80 °C), −0.315 (90 °C), and −0.292 (100 °C), for zero-order. For first-order, the k values were −0.0034 (60 °C), −0.0026 (70 °C), −0.0029 (80 °C), −0.0028 (90 °C), and −0.0026 (100 °C). The k values for the fractional conversion model of TCD changes were 0.004 (60 °C), 0.001 (70 ℃), 0.008 (80 °C), 0.007 (90 °C), and 0.007 (100 °C). The three models showed inconsistent k values as temperature and duration of blanching increased, as shown in Figure 2d, Figure 3c and Figure 4d, for zero, first, and fractional conversion order, respectively. However, the three models showed that the high value of R2 described the changes of TCD due to blanching, which was in the range of 0.750 to 0.961, 0.866 to 0.982, and 0.816 to 0.913, for zero, first and fractional conversion order model, respectively. The high R2 translated to well-described TCD changes of the model. Thus, the three models—zero, first, and fractional conversion model—described the changes of TCD of Dabai fruit due to blanching.
The kinetic reaction rates increased as temperature increased for most of the color parameters. As temperature increased, the reaction rate increased the average kinetic energy of molecules and more collisions per unit time with high temperature [23].

3.2. Mathematical Model and Kinetic Analysis for Texture of Blenched Dabai Fruit

Table 2 shows the kinetic reaction rate of firmness changes of Dabai fruit due to blanching for zero-order. The k values for firmness changes in zero-order were 0.0006 (60 °C), 0.001 (70 °C), 0.001 (80 °C), 0.001 (90 °C), and 0.094 (100 °C). The k values for firmness changes in first-order kinetic were 0.0007 (60 °C), 0.0014 (70 °C), 0.0016 (80 °C), 0.0016 (80 °C), 0.0016 (90 °C), and 0.0027 (100 °C). In Figure 5 and Figure 6, the slope indicated that the Ea of the change of firmness was steeper as the temperature increased. The coefficient of determination (R2) for the firmness of Dabai fruit is shown in Table 2 for zero-order as between 0.712 to 0.810, and for first-order as in the range of 0.692 to 0.774. The zero-order model explained 71% to 81% of the variability in the outcome data, while 69% to 77% of the variability in the outcome data was explained by the first-order model. However, the changes of firmness did not fit in both zero-order and first-order models, as can be seen in Figure 5 and Figure 6. This was due to the non-significant changes of firmness between all temperatures and duration of blanching, based on the results in Table 2.

3.3. Activation Energy Analysis

The Arrhenius equation was used to find the activation energy of the reactions that occurred in a process. Due to the changes of firmness of Dabai fruit not fitting with zero- and first-order models, the Arrhenius study for the firmness parameter was not included. To find out the activation energy (Ea) of the changes of parameters, the natural log (ln) of the kinetic reaction rates (k) was plotted against the inverse temperature (60, 70, 80, 90, and 100 °C) of the blanching process. The slope of the graph identified the activation energy (Ea). Table 3 shows the activation energy and coefficient of determination (R2) of the kinetic models (zero, first, and fractional conversion) according to the changes of color parameters (a*, b*, C, and TCD) and texture (firmness) of Dabai fruit due to blanching.
Ea indicates the sensitivity of the parameters to temperature [24]. The higher the Ea of the parameter, the more sensitive it is to temperature. For instance, for the total color difference (TCD), the Ea values for zero-order, first-order and fractional conversion models, were 13.419 kJ/mol, 6.792 kJ/mol, and 6.688 kJ/mol, respectively. Eyarkai Nambi et al. [25] reported that the Ea values for the color change for beetroot, green pea, eggplant and green pepper were 28.19, 32.48, 35.41, and 22.89 kJ/mol. This current study showed that the color changes of Dabai fruit from its initial color were less sensitive than the vegetables in [25].
Based on Table 3, the coefficient determination values for all the parameters in the zero order kinetic model were 0.889, 0.963, 0.904, 0.986 and 0.600, for a*, b*, C, and TCD. The high coefficient of determination for all the color parameters proved that reaction rates of the zero order kinetic models fitted well with the Arrhenius equation. The coefficient determination for the parameters b*, C, and TCD showed high values of 0.993, 0.993, and 0.989, respectively. This proved that the first order kinetic model’s kinetic reaction rates for a*, b*, C, and TCD, obeyed the Arrhenius equation. Furthermore, the coefficient determination for the color parameters (a*, b*, C, and TCD) showed the values of 0.710, 0.837, 0.892, and 0.742, respectively, for the fractional-conversion kinetic model.

4. Conclusions

The present study confirms that blanching caused quality changes for the color and texture of Dabai fruit. The kinetic modelling of color changes resulted in showing that a* color parameter fitted well with zero-order modelling (R2: 0.853–0.989) and fractional conversion order modelling (R2: 0.876–0.931). Furthermore, changes of b* parameter were well fitted with zero- (R2: 0.912–0.931), first- (R2: 0.916–0.984), and fractional conversion order (R2: 0.902–0.984) models. The C parameter fitted well with zero- (R2: 0.961–0.989), first- (R2: 0.935–0.979) and fractional conversion order (R2: 0.899–0.956), while changes of TCD parameter were well fitted with zero- (R2: 0.750–0.956) and first-order (R2: 0.855–0.982). For kinetic modelling of texture changes, the change of firmness did not well fit with zero- (R2: 0.712–0.810) and first-order (R2: 0.692–0.794). This data and information will increase the knowledge impacting consumer food selection, and enhance the ability to find the right blanching conditions for thermal processing Dabai fruits in the future.

Author Contributions

R.S. supervised the research and revised the manuscript; S.H.A. and W.N.Z.Z.A. supervised the experiments; N.S.A. wrote the manuscript; A.A.A.H. conducted the experiments, collected and analyzed the result data. All authors have read and agreed to the published version of the manuscript.

Funding

The authors would like to thank the Ministry of Higher Education of Malaysia, for providing financial support under the Fundamental Research Grants Scheme (FRGS) (project number: FRGS/1/2019/WAB01/UPM/02/30); and the Sarawak Biodiversity Centre, who approved and issued the R&D permit.

Institutional Review Board Statement

Not applicable.

Informed Consent Statement

Not applicable.

Data Availability Statement

All data was provided in this paper.

Conflicts of Interest

The authors declare no conflict of interest.

References

  1. Rukayah, A. Buah-buahan eksotik dari Sabah dan Sarawak di Mardi, Serdang. Agromedia 2009, 22, 28–34. [Google Scholar]
  2. Chua, H.P.; Nicholas, D. Dabai—Speciality fruit of Sarawak. Agromedia 2009, 30, 28–30. [Google Scholar]
  3. Chua, H.P.; Nicholas, D.; Adros Yahya, M.N. Physical properties and nutritional values of Dabai fruit (Canarium odontophyllum) of different genotypes. J. Trop. Agric. Food Sci. 2015, 43, 1–10. [Google Scholar]
  4. Ding, P. Dabai (Canarium odontophyllum Miq.). In Postharvest Biology and Technology of Tropical and Subtropical Fruits; Woodhead Publishing Limited: Milton Keynes, UK, 2011; Volume 3. [Google Scholar] [CrossRef]
  5. Basri, D.F.; Fudholi, A.; Ruslan, M.H. Drying characteristics of the Borneo Canarium Odontophyllum (Dabai) fruit. Am. J. Agric. Bio. Sci. 2012, 7, 347–356. [Google Scholar] [CrossRef] [Green Version]
  6. Khoo, H.E.; Azlan, A.; Tang, S.T.; Lim, S.M. Antocyanidins and anthocyanins:colored pigments as food, pharmaceutical ingredients, and the potential helath benefits. Food Nutr. Res. 2017, 61, 1812. [Google Scholar] [CrossRef] [Green Version]
  7. Deylami, M.Z.; Rahman, R.A.; Tan, C.P.; Bakar, J.; Olusegun, L. Effect of blanching on enzyme activity, color changes, anthocyanin stability and extractability of mangosteen pericarp: A kinetic study. J. Food Eng. 2016, 178, 12–19. [Google Scholar] [CrossRef]
  8. Shakirin, F.H.; Prasad, K.N.; Ismail, A.; Yuon, L.C.; Azlan, A. Antioxidant capacity of underutilized Malaysian Canarium odontophyllum (Dabai) Miq. fruit. J. Food Compos. Anal. 2010, 23, 777–781. [Google Scholar] [CrossRef]
  9. Xiao, H.W.; Pan, Z.; Deng, L.Z.; El-Mashad, H.M.; Yang, X.H.; Mujumdar, A.S.; Gao, Z.J.; Zhang, Q. Recent developments and trends in thermal blanching—A comprehensive review. Inf. Process. Agric. 2017, 4, 101–127. [Google Scholar] [CrossRef]
  10. Abu-Ghannam, N.; Crowley, H. The effect of low temperature blanching on the texture of whole processed new potatoes. J. Food Eng. 2006, 74, 335–344. [Google Scholar] [CrossRef] [Green Version]
  11. Ding, P.; Tee, Y.K. Physicochemical characteristics of Dabai (Canarium odontophyllum Miq.) fruit. Fruits 2011, 66, 47–52. [Google Scholar] [CrossRef]
  12. Ruiz-Ojeda, L.M.; Peñas, F.J. Comparison study of conventional hot-water and microwave blanching on quality of green beans. Innov. Food Sci. Emerg. Tech. 2013, 20, 191–197. [Google Scholar] [CrossRef]
  13. Jaiswal, A.K.; Gupta, S.; Abu-Ghannam, N. Kinetic evaluation of colour, texture, polyphenols and antioxidant capacity of Irish York cabbage after blanching treatment. Food Chem. 2012, 131, 63–72. [Google Scholar] [CrossRef] [Green Version]
  14. Azman, P.N.M.A.; Shamsudin, R.; Che Man, H.; Ya’acob, M.A. Kinetics of Quality Changes in Soaking Water during Retting Process of Pepper Berries (Piper nigrum L.). Processes 2020, 8, 1255. [Google Scholar] [CrossRef]
  15. Gonçalves, E.M.; Pinheiro, J.; Abreu, M.; Brandão, T.R.S.; Silva, C.L.M. Modelling the kinetics of peroxidase inactivation, colour and texture changes of pumpkin (Cucurbita maxima L.) during blanching. J. Food Eng. 2007, 81, 693–701. [Google Scholar] [CrossRef]
  16. Gonçalves, E.M.; Pinheiro, J.; Abreu, M.; Brandão, T.R.S.; Silva, C.L.M. Carrot (Daucus carota L.) peroxidase inactivation, phenolic content and physical changes kinetics due to blanching. J. Food Eng. 2010, 97, 574–581. [Google Scholar] [CrossRef]
  17. Cruz, R.M.S.; Vieira, M.C.; Silva, C.L.M. Modelling kinetics of watercress (Nasturtium officinale) colour changes due to heat and thermosonication treatments. Innov. Food Sci. Emerg. Technol. 2007, 8, 244–252. [Google Scholar] [CrossRef]
  18. Dini, A.; Falahati-Pour, S.K.; Behmaram, K.; Sedaghat, N. The kinetics of colour degradation, chlorophylls and xanthophylls loss in pistachio nuts during roasting process. Food Qual. Saf. 2019, 3, 251–263. [Google Scholar] [CrossRef]
  19. Gupta, R.K.; Kumar, P.; Sharma, A.; Patil, R.T. Color kinetics of aonla shreds with amalgamated blanching during drying. Int. J. Food Prop. 2011, 14, 1232–1240. [Google Scholar] [CrossRef]
  20. Manjunatha, S.S.; Mathews, A.T.; Patki, P.E. Modelling the kinetics of mass transfer and change in colour during deep fat frying of green peas (Pisum sativum L.) at different frying temperatures. Heat Mass Transf. 2019, 55, 3087–3102. [Google Scholar] [CrossRef]
  21. Demirhan, E.; Özbek, B. Color Change Kinetics of Tea Leaves during Microwave Drying. Int. J. Food Eng. 2015, 11, 255–263. [Google Scholar] [CrossRef]
  22. Onwude, D.; Nawi, N.M.; Hashim, N.; Abdan, K. Color Change Kinetics and Total Carotenoid Content of Pumpkin as Affected by Drying Temperature. Ital. Food Sci. 2016, 28, 744–748. [Google Scholar] [CrossRef]
  23. Sodiqovna, O.M.; Qizi, I.G.O. The Rate of A Chemical Reaction Factors Affecting It. EPRA Int. J. Res. Dev. 2020, 5, 261–263. [Google Scholar]
  24. Inheiro, J.O.P.; Legria, C.A.A.; Breu, M.A.A. Degradation Kinetics of Peroxidase Enzyme Phenolic Content and Physical and Sensorial Characteristics in Broccoli (Brassica oleracea L. ssp. Italica) during Blanching. J. Agric. Food Chem. 2009, 57, 5370–5375. [Google Scholar] [CrossRef]
  25. Eyarkai Nambi, V.; Gupta, R.K.; Kumar, S.; Sharma, P.C. Degradation kinetics of bioactive components, antioxidant activity, colour and textural properties of selected vegetables during blanching. J. Food Sci. Tech. 2016, 53, 3073–3082. [Google Scholar] [CrossRef] [Green Version]
Figure 1. Dabai fruit (a) before (b) after blanching.
Agronomy 11 02185 g001
Figure 2. Zero-order kinetic model of the effect of blanching (60, 70, 80, 90 and 100 °C) on the color parameters of Dabai fruit: (a) a*, (b) b*, (c) chroma and (d) TDC.
Agronomy 11 02185 g002
Figure 3. First-order kinetic model of the effect of blanching (60, 70, 80, 90 and 100 °C) on the color parameters of Dabai fruit: (a) b*, (b) chroma, and (c) TDC.
Agronomy 11 02185 g003
Figure 4. Fractional first-order kinetic model of the effect of blanching (60, 70, 80, 90 and 100 °C) on the color parameters of Dabai fruit: (a) a*, (b) b*, (c) chroma and (d) TDC.
Agronomy 11 02185 g004aAgronomy 11 02185 g004b
Figure 5. Zero-order kinetic model of the effect of blanching (60, 70, 80,90 and 100 °C) on the firmness of Dabai fruit.
Agronomy 11 02185 g005
Figure 6. First-order kinetic model of the effect of blanching (60, 70, 80, 90 and 100 °C) on the firmness of Dabai fruit.
Agronomy 11 02185 g006
Table 1. The reaction rate (k) and coefficient of determination (R2) of the zero-order kinetic model, first-order kinetic model and fractional conversion order kinetic model of changes of color parameter (a*, b*, C and TCD) of Dabai fruit, due to blanching.
Parameter Temperature (℃)kR2
a*Zero-order600.5320.989
701.1890.853
805.6040.986
907.8740.979
1007.9830.980
Fractional conversion-order600.0030.915
700.0010.931
800.0050.876
900.0050.923
1000.0050.908
b*Zero-order60−0.0250.978
70−0.0370.972
80−0.0710.912
90−0.0850.934
100−0.1080.965
First-order60−0.00040.984
70−0.00050.965
80−0.0010.902
90−0.00110.916
100−0.00130.948
Fractional conversion-order600.0030.915
700.0010.931
800.0050.876
900.0050.923
1000.0050.908
CZero-order60−0.0370.977
70−0.0710.961
80−0.2420.989
90−0.3490.981
100−0.3660.986
First-order60−0.00070.979
70−0.00090.935
80−0.00230.971
90−0.00280.958
100−0.00290.964
Fractional-conversion order600.0040.946
700.0020.956
800.0050.899
900.0040.920
1000.0050.923
TCDZero-order60−0.4850.961
70−0.3090.750
80−0.3560.931
90−0.3150.889
100−0.2920.906
First-order60−0.00340.982
70−0.00260.866
80−0.00290.907
90−0.00280.855
100−0.00260.879
Fractional conversion-order600.0040.816
700.0010.900
800.0080.874
900.0070.908
1000.0070.913
Table 2. The reaction rate (k) and coefficient of determination (R2) of the zero-order kinetic model, first-order kinetic model and fractional conversion order model, of changes of firmness of Dabai fruit due to blanching.
ParameterKinetic ModelTemperature (℃)kR2
FirmnessZero-order600.00060.712
700.0010.757
800.00110.788
900.00110.784
1000.0940.810
First-order600.00070.692
700.00140.732
800.00160.774
900.00160.767
1000.00270.794
Table 3. The activation energy and coefficient of determination (R2) of the kinetic models (zero, first, and fractional conversion) according to the changes of color parameters (a*, b*, C, and TCD) and texture (firmness) of Dabai fruit due to blanching.
Kinetic ModelsParameterEa (kJ/mol)R2
Zeroa*1.1050.889
b*39.1170.963
C62.2730.904
TCD13.4190.986
Firstb*32.7610.923
C3.4790.993
TCD6.7920.989
Fractional Conversiona*27.3430.710
b*18.0760.837
C10.7440.892
TCD6.6880.742
Publisher’s Note: MDPI stays neutral with regard to jurisdictional claims in published maps and institutional affiliations.

