Article

Organic Amendments Alter Long-Term Turnover and Stability of Soil Carbon: Perspectives from a Data-Model Integration

1
State Key Laboratory of Atmospheric Boundary Layer Physics and Atmospheric Chemistry, Institute of Atmospheric Physics, Chinese Academy of Sciences, Beijing 100029, China
2
College of Environmental and Resource Sciences, Zhejiang University, Hangzhou 310058, China
*
Author to whom correspondence should be addressed.
Agronomy 2021, 11(11), 2134; https://doi.org/10.3390/agronomy11112134
Submission received: 15 September 2021 / Revised: 18 October 2021 / Accepted: 22 October 2021 / Published: 25 October 2021

Abstract

:
Organic amendment (OA) additions may profoundly regulate the turnover behaviours of soil organic carbon (SOC). Explicit understanding of such role of OA is crucial for accurately assessing the potential of carbon sequestration in agricultural soils. To explore the effects of OA additions on the detailed SOC stabilization and destabilization processes, we collected SOC measurements from 29 trials with experimental duration ranging from 14 to 85 years across the globe. Using these datasets, we constrained a soil carbon model to analyse SOC turnover and built-up processes as impacted by OA additions. We found that OA generally decreases microbial carbon use efficiency (CUE) and the fraction of inert SOC that is resistant to decomposition (finert), but has divergent effects on the decay rate of humic SOC (khum). Across the sites, there was great variability in the effects of OA on CUE, khum, and finert, which can be largely explained by local soil and climate conditions and the quantity and quality of OA. Long-term simulations suggested that, without considering the effects of OA on CUE, khum, and finert, the effectiveness of OA additions for carbon sequestration could be largely overestimated. Our results suggest that the strong site-specific regulations of OA on SOC dynamics as demonstrated in this study must be properly considered and better constrained by observational data when assessing SOC sequestration in agricultural soils under the management of OA additions.

1. Introduction

Agricultural soils are on the frontline of sequestering carbon to mitigate climate change and maintain soil fertility. The international initiative “4 per 1000” targets a yearly 4‰ increase of soil organic carbon (SOC) in global agricultural soils to ensure soil fertility and mitigate climate change [1,2]. To meet this target, increasing efforts have been made to identify suitable management practices that benefit SOC sequestration. In these management practices, increasing carbon input into soil, mainly organic amendments (OA, e.g., crop residue retention, manure and biochar application), has been widely recommended [3,4,5] for its direct contribution to the SOC pool. However, the effectiveness of OA for carbon sequestration depends not only on the fate of OA itself, but also on how OA affects SOC stability. Both processes are highly variable depending on local soil and climate conditions. Consequently, elucidating the effects of OA management on SOC turnover and stabilization processes is of great importance for evaluating the feasibility of the “4 per 1000” goal.
Carbon (C) input (e.g., OA) has substantial effects on some key processes controlling SOC dynamics, e.g., the microbial C use efficiency (CUE)—the ratio of microbial growth to total C uptake [6]. As a key parameter affecting SOC turnover, changes of CUE induced by OA additions may have significant consequences on long-term SOC dynamics [7]. It has been suggested that CUE increases with decreasing carbon: nitrogen (N) ratios of C inputs [8], demonstrating the importance of substrate quality. Apart from substrate quality, CUE is also dependent on environmental conditions such as temperature [9], resource availability, and microbial community structure [10]. However, limited data on CUE are available due to the difficulty of simultaneous measuring of microbial growth rate and respiration rate in situ together with complexities added by soil environment and climate. Given the importance of CUE in regulating the overall SOC turnover, the effect of OA on CUE must be properly addressed in order to provide reliable predictions of SOC dynamics under different OA quantities and qualities.
OA additions could also lead to diverse consequences on overall SOC sequestration through altering some other detailed SOC formation and decomposition processes (e.g., decay rates of different SOC fractions, and the accessibility for microbial utilization). For example, Kuzyakov [11] reported that OA management can lead to positive or negative changes in SOC decomposition rates (e.g., khum), i.e., the priming effect (PE). If the PE is positive, increased khum will offset the positive effect of C inputs on SOC sequestration [12]. In addition, continuous organic matter inputs may liberate the initial physically protected SOC (which is defined as inert carbon) to decomposition [13,14], thus it can potentially change the overall fraction of inert C (finert). Understanding these detailed soil C turnover processes is propitious to manage SOC sequestration in a more effective way.
The turnover processes (e.g., decay rates and CUE) of SOC are regulated by complex interplays between management practices and environmental variables. Exploring detailed SOC dynamics and their interactions with management and environmental conditions via conducting field experiments are difficult, if not impossible, particularly across large scales. Process-based SOC models, however, can capture the dynamic interactions between these attributes. Once the process-based SOC models are properly constrained by high quality observational data, they can provide valuable information on SOC decomposition processes and long-term SOC dynamics that otherwise are difficult to be detected in the field [15].
In this study, we used long-term records (14~85 years) and field measurements of C inputs and SOC observations (Figure 1) to constrain a modified version of the RothC model (sourced from Rothamsted Research, Herts, UK) [16] to capture SOC dynamics under different OA treatments. The RothC model is one of the most classic SOC models and it can represent well most of the existing pool-based SOC models [17,18]. More importantly, the structure of the RothC model is relatively concise and this facilitates model modifications and predictions across large spatiotemporal scales. In general, most long-term experiments were conducted with contrasting treatments of OA additions, i.e., OA addition (i.e., +OA) vs. zero (or less) OA addition (i.e., −OA). To constrain the key model parameters using these datasets and explore the effects of OA additions on the parameters, we modified the RothC model. Specifically, in model complexity-reduction, we firstly relaxed the control of soil and climate over CUE and decomposition rate of pools. Then, in order to mediate the widely debated stability of inert organic matter (IOM) [19,20], we re-defined the model’s structure on IOM by assuming that its fraction in total SOC (finert) can vary in response to environmental changes. These modifications allowed us to assess whether and how CUE and finert correlate to soil and climate conditions and OA treatments. Using the data from each treatment (i.e., OA addition (+OA) vs. zero (or less) OA addition (−OA)), we optimized the modified RothC model focusing on the most important model parameters regulating SOC predictions (see Section 2.2). Based on these optimized parameters, we analysed whether and how these influential parameters change in response to −OA and +OA under different climate and soil conditions. Finally, we evaluated uncertainties in SOC projections across sites and under different OA treatments considering the uncertainty in model parameters. Specifically, this study aimed to: (1) assess how OA additions influence model parameters regarding SOC turnover and stabilization processes, focusing mainly on microbial C use efficiency (CUE), the decay rate of humic organic C (khum), and the fraction of inert (finert); (2) investigate the variability of these parameters across sites under different climate and soil conditions and detect the underlying drivers; and (3) quantify the consequences of different SOC turnover and stabilization processes under different OA treatments on long-term (e.g., 30 years) SOC predictions.

2. Materials and Methods
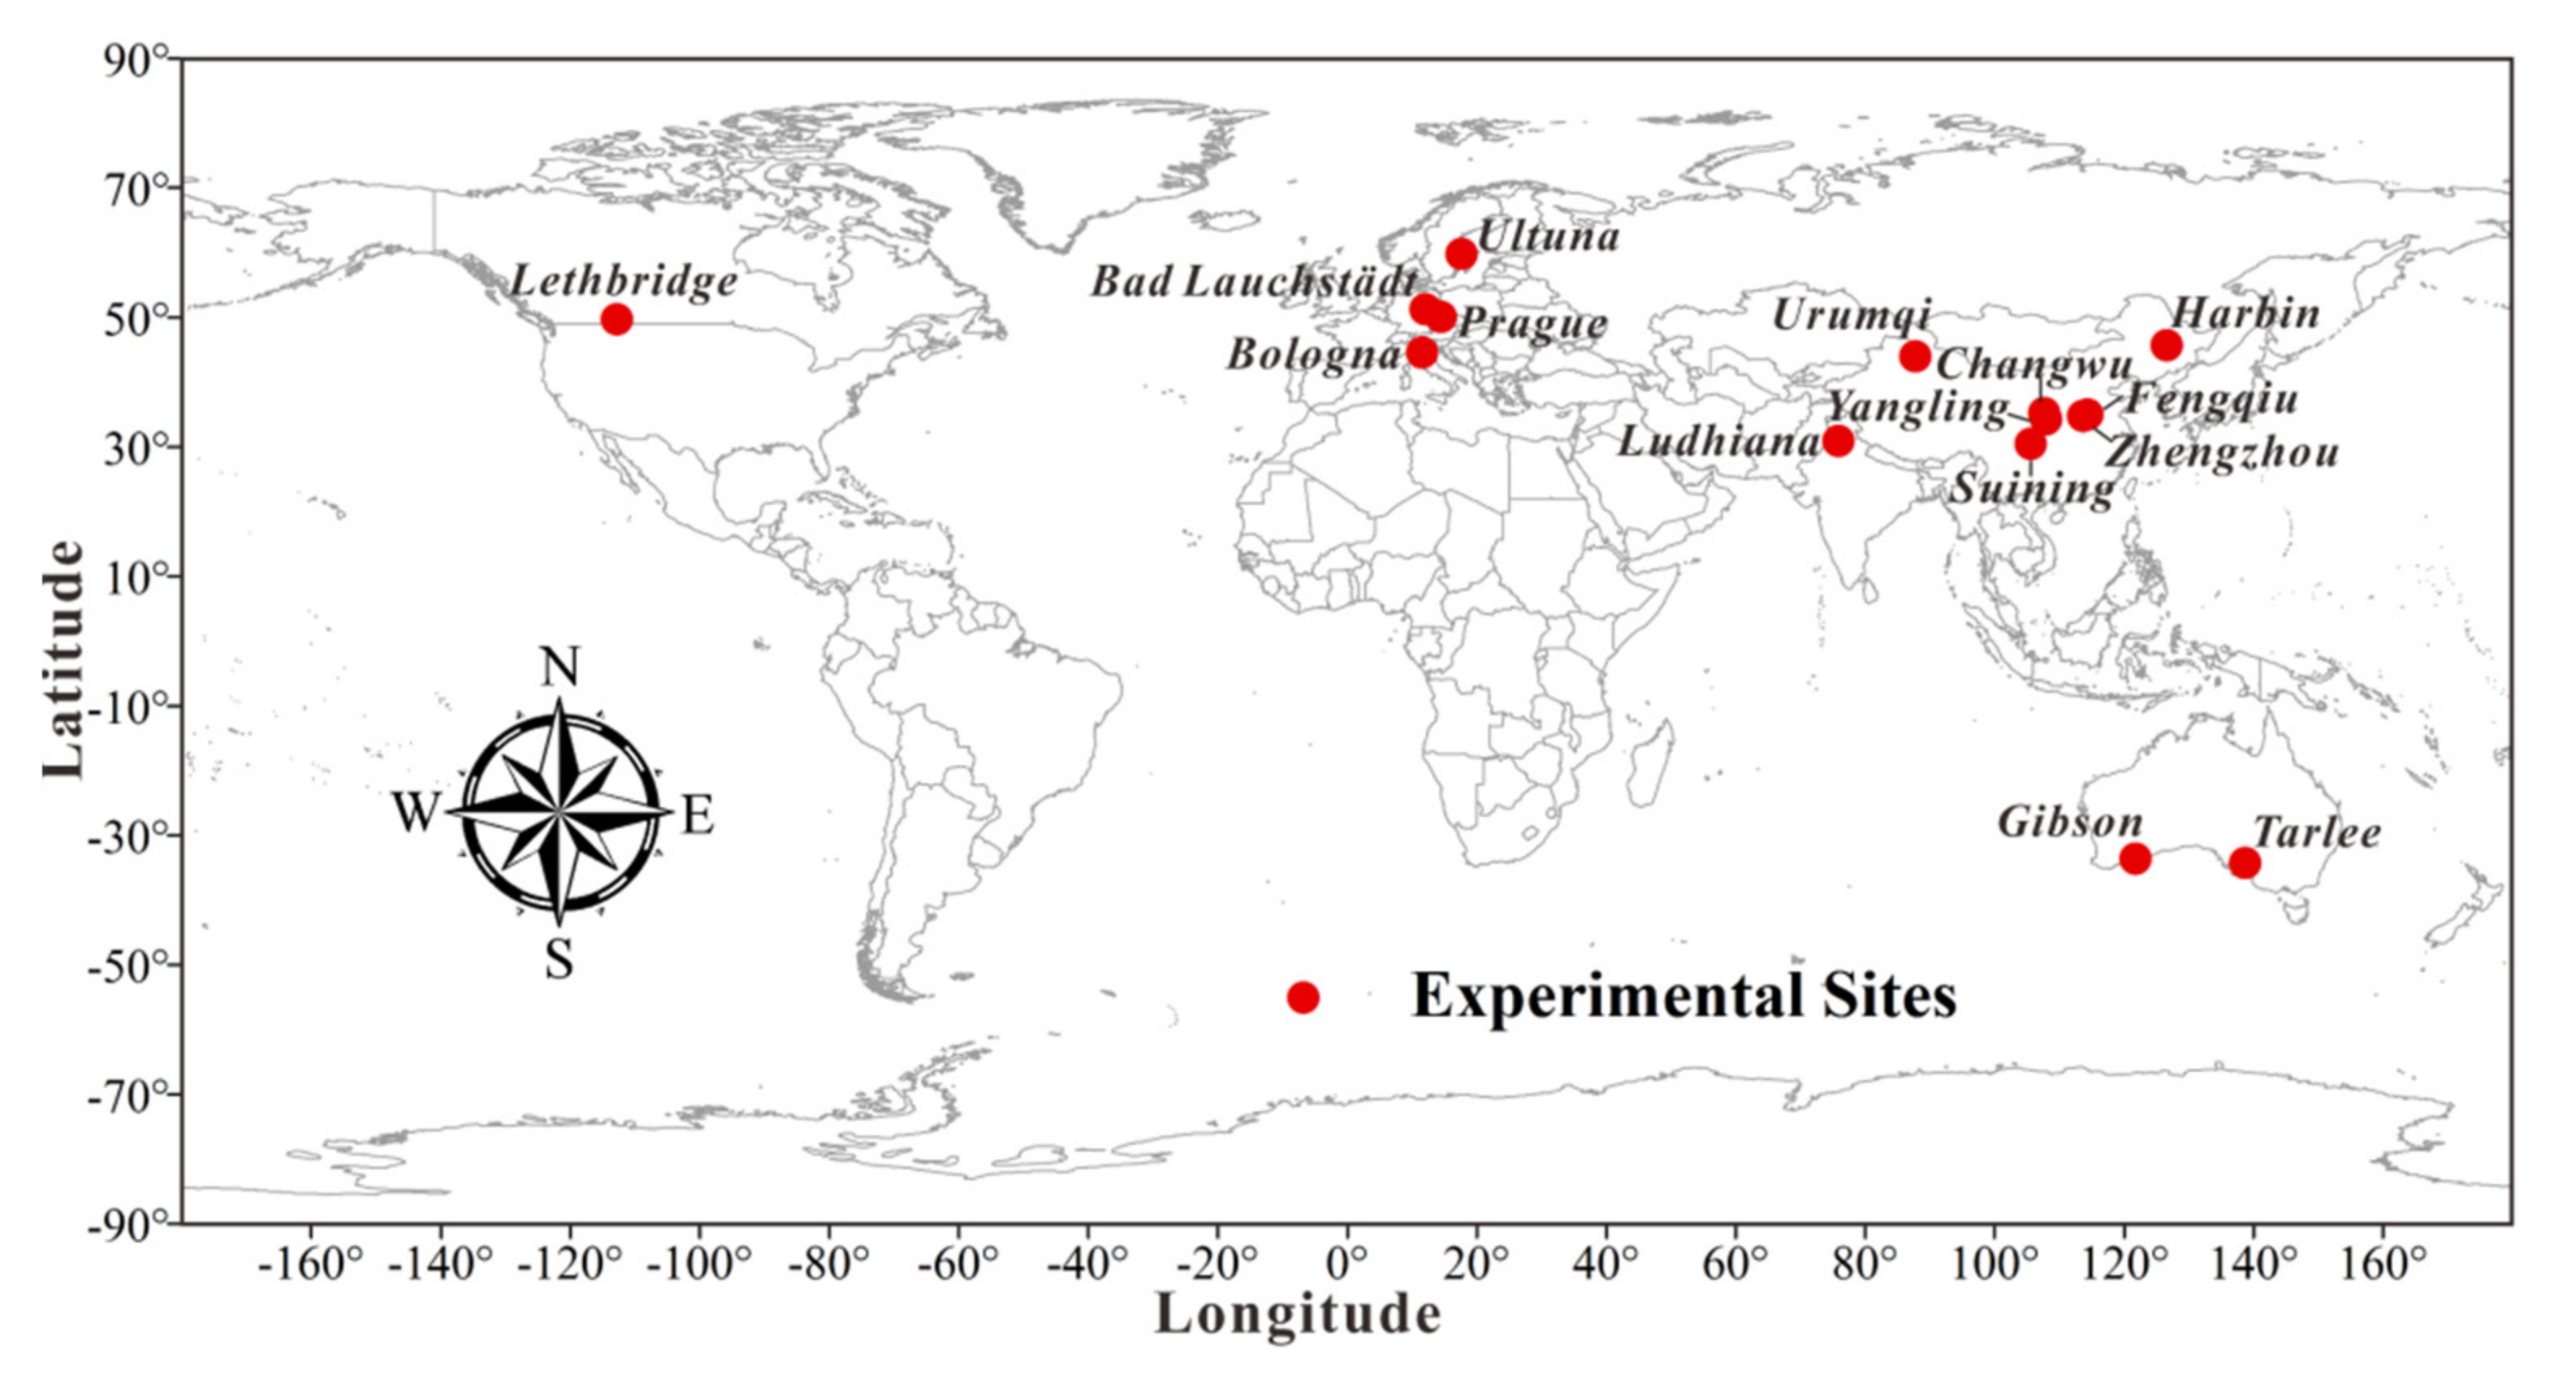
2.1. Datasets

We obtained SOC observations from 29 long-term trials at 15 sites across global agricultural regions (Table 1 and Figure 1). These sites cover a wide range of soil and climate conditions, with annual mean temperature and precipitation ranging from 3.5 to 24.5 °C and from 310 to 1014 mm, respectively. The initial SOC stocks range from 17.7 to 111 Mg C ha−1 in the 0–30 cm soil layer. The soil clay fractions range from 3% to 37%. The duration of all trials is longer than ten years, with an average of 29 years ranging from 14 to 85 years. Depending on the trial, the frequency and time of SOC measurements were variable, but there were three SOC measurements at least. Across sites, there were generally two contrasting treatments with (i.e., +OA) and without or with less organic amendments (i.e., −OA) incorporated into the soil (Table 1). The +OA treatment in these experiments had an average annual C input rate ranging from 0.7 to 6.5 Mg C ha−1 yr−1 across different sites. Table 1 shows the detailed climate and soil conditions and mean annual C input rates for all experiments.
Some trials reported only SOC concentration (%, SOCC), and we converted SOCC to SOC density (SOCD, Mg ha−1) by using the reported bulk density and soil sampling depth in the source literatures. In some experiments, SOC was only measured in the top 10 or 20 cm soil layer. In this case, following Jobbagy and Jackson [35], the SOC density in the top 30 cm soil layer was estimated based on the SOC vertical distribution assumption.
At each site, we assumed that C enters soil through crop straw and root residues and/or the application of organic manure. Here, we roughly classified the OA treatments to four groups according to the type of OA applied: S—crop straw only; NPKS—crop straw with N, P, and K fertilizers; MS—manure plus crop straw; NPKMS—manure plus crop straw with N, P, and K fertilizers. These four OA groups to some extent reflect the overall OA quality. In determining the C input rates, for the sites reporting annual crop yield only, we first calculated the quantity of aboveground biomass using the reported harvesting index for the crop (i.e., dividing yield by harvesting index). In the next step, the amount of crop straw was estimated as the difference between aboveground biomass and yield. The harvesting indices for different crops (e.g., wheat and maize) were derived from Huang et al. [36]. Root mass was estimated based on the belowground to aboveground biomass ratio, which was also obtained from Huang et al. [36]. Following Skjemstad et al. [37], C content in residue and root mass was assumed to be 45% of total mass. The amount of C entering to the soil from organic manure was estimated from the rate of manure application and C content in the manure [38]. It should be noted that both the quantity and quality of C input under −OA and +OA treatments were different across different sites. Specifically, −OA represents that treatment without or with less organic amendment, e.g., control (CK) at Bad Lauchstädt (BL), Bologna (BG), Changwu (CW), Fengqiu (FQ), Gibson (GB), Harbin (HR), Ludhiana (LH), Prague (PG), Suining (SN), Ultuna (UT), Urumqi (UQ), Yangling (YL), and Zhengzhou (ZZ); fallow-wheat (FW) at Lethbridge (LB) and Tarlee (TL). On the contrary, +OA indicates the treatment with or with more organic amendment, e.g., inorganic fertilization plus manure application at BL, CW, SN, UQ, and ZZ; manure application (M) at BG, FQ, HR, LH, and PG; straw return at Ultuna and YL; and continuous wheat (CW) at LB and TL.

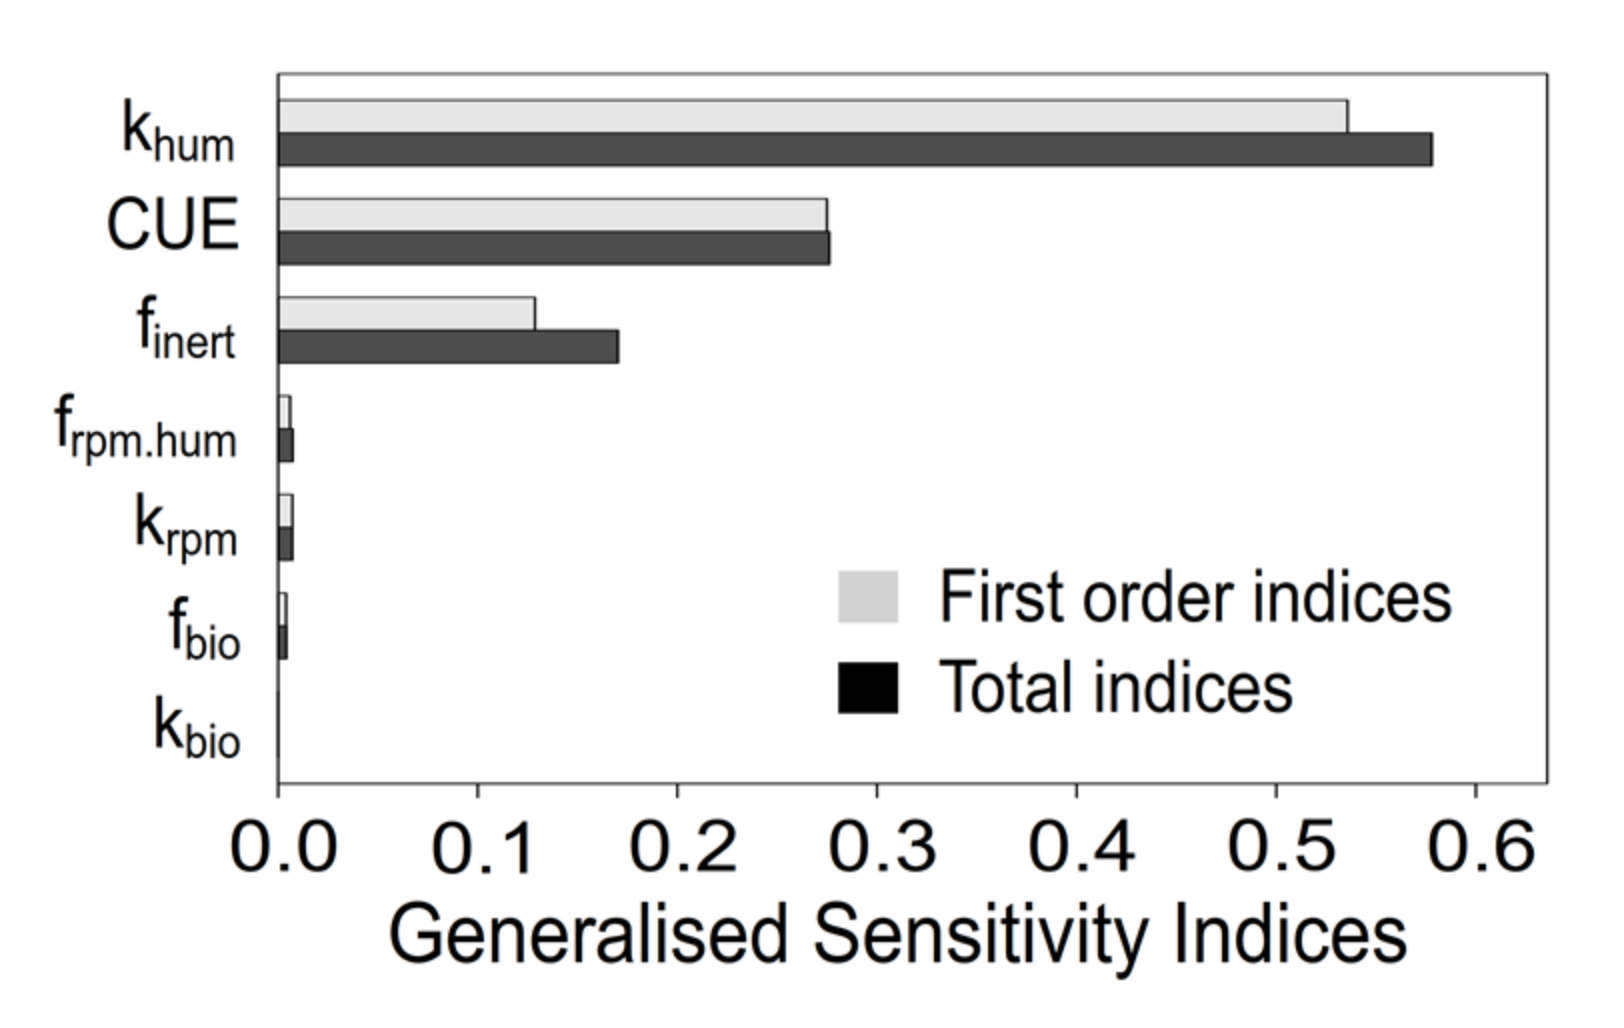
2.2. The RothC Model and Sensitivity Analysis

The RothC model [16] is a widely used SOC decomposition model simulating SOC changes in agricultural soils under various environmental conditions, crop rotation regimes, and management practices [37,39,40,41]. In the RothC model, SOC is partitioned into five conceptual pools, i.e., decomposable plant material (DPM), resistant plant material (RPM), microbial biomass carbon (BIO), humified organic carbon (HUM), and inert organic carbon (IOM). Except IOM, the decomposition of each pool follows a first-order decay process at a decay rate modified by climatic variables (e.g., temperature and moisture) and clay content.
Before conducting the simulations, a global sensitivity analysis was performed to identify the most influential model parameters on simulated SOC dynamics. In total, seven parameters were selected for the sensitivity analysis, i.e., the fraction of initial microbial biomass pool (fbio, i.e., the fraction of BIO in total SOC) and its decomposition rate (kbio), the fraction of inert carbon pool (finert, i.e., the fraction of IOM to total SOC), the ratio of resistant plant material (RPM) to humified organic carbon (HUM) (frpm.hum), the decomposition rates of HUM (khum) and RPM (krpm), and microbial C use efficiency (CUE, the ratio of microbial growth to total carbon uptake). Here, it should be noted that the original RothC model does not directly define CUE. Rather, it defines the partitioning of C between that lost from the soil and that remaining during decomposition (i.e., CO2-C/(BIO+HUM)). To ease interpretation, we focused on CUE and recalculated it as (BIO+HUM)/(CO2−C+BIO+HUM). As the relative importance of those model parameters is independent of climate and soil [42], the data from a long-term field experiment under continuous wheat cropping at Broadbalk, UK [16] were used to conduct the sensitivity analysis. The R package multisensi was used to perform the sensitivity analysis; the first order (which measures the effect of varying a typical model parameter on model outputs while keeping other parameters constant) and total-effect (which measures the contribution to the model output variance of a typical model parameter, including all variance caused by its interactions with other model parameters) sensitivity indices were calculated. Both first-order and total-effect indices were further normalized by the total variance, which suggested that CUE, khum, and finert are the three most important model parameters influencing soil C dynamics in the model (Figure 2).

2.3. Model Modification and Complexity Reduction

Focused on the three most influential parameters (i.e., CUE, khum, and finert; Figure 2), we reduced the complexity of the RothC model by simplifying the formulation of model parameterisation while maintaining the core model structure. It should be noted that a complexity-reduced model can help to improve the computational efficiency and remove the impacts of other interacting model parameters, and similar approaches have already been widely adopted in other studies [43,44]. Specifically, in the original RothC model, CUE ranges from 0.15 to ~0.24 depending on soil clay content. However, increasing evidences indicate that CUE might have a much larger variability ranging from less than 0.2 to more than 0.8 [6,42], although studies using the isotopic labelling of soil water generally report a much smaller viability in CUE [45] than those based on the labelling of the C substrate [6]. More importantly, a series of environmental factors rather than clay content alone regulate CUE [6,7]. Consequently, in this study, we removed the effect of soil clay content on CUE originally used in the model and determined site- and treatment-specific CUE (see Model optimization section). This modification implicitly assumed that CUE could vary across space and treatments due to variable soil and climate conditions, and energy and substrate availability for microbial growth.
Moreover, the fraction of inert C in total SOC (finert) is one of the key parameters determining long-term soil C dynamics (Figure 2). IOM is traditionally defined as the C with chemical structure that is resistant to decomposition, i.e., chemical recalcitrance [16]. However, growing evidences show that physical protections of SOC also play a significant role in controlling the accessibility of SOC to microbial attack [13,46]. As pools in the RothC model are conceptual, here, we define IOM as the fraction of organic matter that is protected from decomposition due to any reasons. With the change of the environment, this protection would be lost and parts of the previous IOM would become decomposable.
The third modification on the model was to dismiss environmental scalars modifying khum (one of the identified three most influential parameters on SOC dynamics; Figure 2), i.e., an apparent khum was used in this study, which is totally different from the maximum potential decay rates of HUM as defined in the default RothC model. In the original RothC model, soil moisture (a key factor determining actual khum) has to be determined, which is usually estimated by considering the potential evapotranspiration (PET). In arid regions, however, it had been suggested that the RothC model underestimates decomposition and thus overestimates soil C accumulation, resulting in unrealistic high SOC stocks because of very small khum [47]. The study sites in our study distribute across the globe (Figure 1), and the climates at some sites are much drier than the marine humid climate in Rothamsted where the experimental data were used to develop/test the RothC model. To avoid this possible bias, we used the apparent khum in this study, rather than the pre-defined potential decay rates further modified by environmental attributes as widely used in the traditional researches. Another reason is that functions modifying decay rates in the RothC model may not precisely capture their responses to climate and/or soil attributes. Overall, the complexity reduction of the RothC model provides an opportunity to explicitly quantify how the optimized CUE, khum, and finert (see the Model optimization section) correlate to local climate and soil conditions, as well as to OA treatments.
The original model structure of RothC have been described in [16] and the equations in the model have been documented and coded (as an example of SOC turnover models) by Sierra et al. [48] in the R software (i.e., SoilR package). The modifications on RothC in this study are based on the codes included in SoilR package.

2.4. Model Optimization

Focusing on the three most influential model parameters, we used the observed SOC data obtained from the 29 long-term trials to constrain them. Default values were adopted for other parameters. The prior distributions of the three parameters were assumed to be uniformly distributed within a range based on current knowledge. We adopted similar ranges used by Luo et al. [42], namely 0.20 to 0.80 for CUE, 0.002 year−1 to 0.2 year−1 for khum (equivalent to residence time of 5 to 500 years), and 0.1 to 0.8 for finert. We optimized the three parameters using a Bayesian approach at each site and under each treatment (i.e., optimized site- and treatment-specifically). In brief, the optimization performed a random walk through the multi-dimensional parameter space to find the parameter set that can produce the best match between predicted and observed SOC by minimizing the rooted mean squared error (RMSE). The optimization was performed in R 3.6.1 using high-performance computers in State Key Laboratory of Atmospheric Boundary Layer Physics and Atmospheric Chemistry, Institute of Atmospheric Physics, Chinese Academy of Sciences. For all trials, the modified RothC model was run for 100,000 times using 100,000 ensembles of parameters randomly sampled from their prior distributions. The top 100 ensembles of parameters with the lowest RMSE were chosen as optimized parameters.

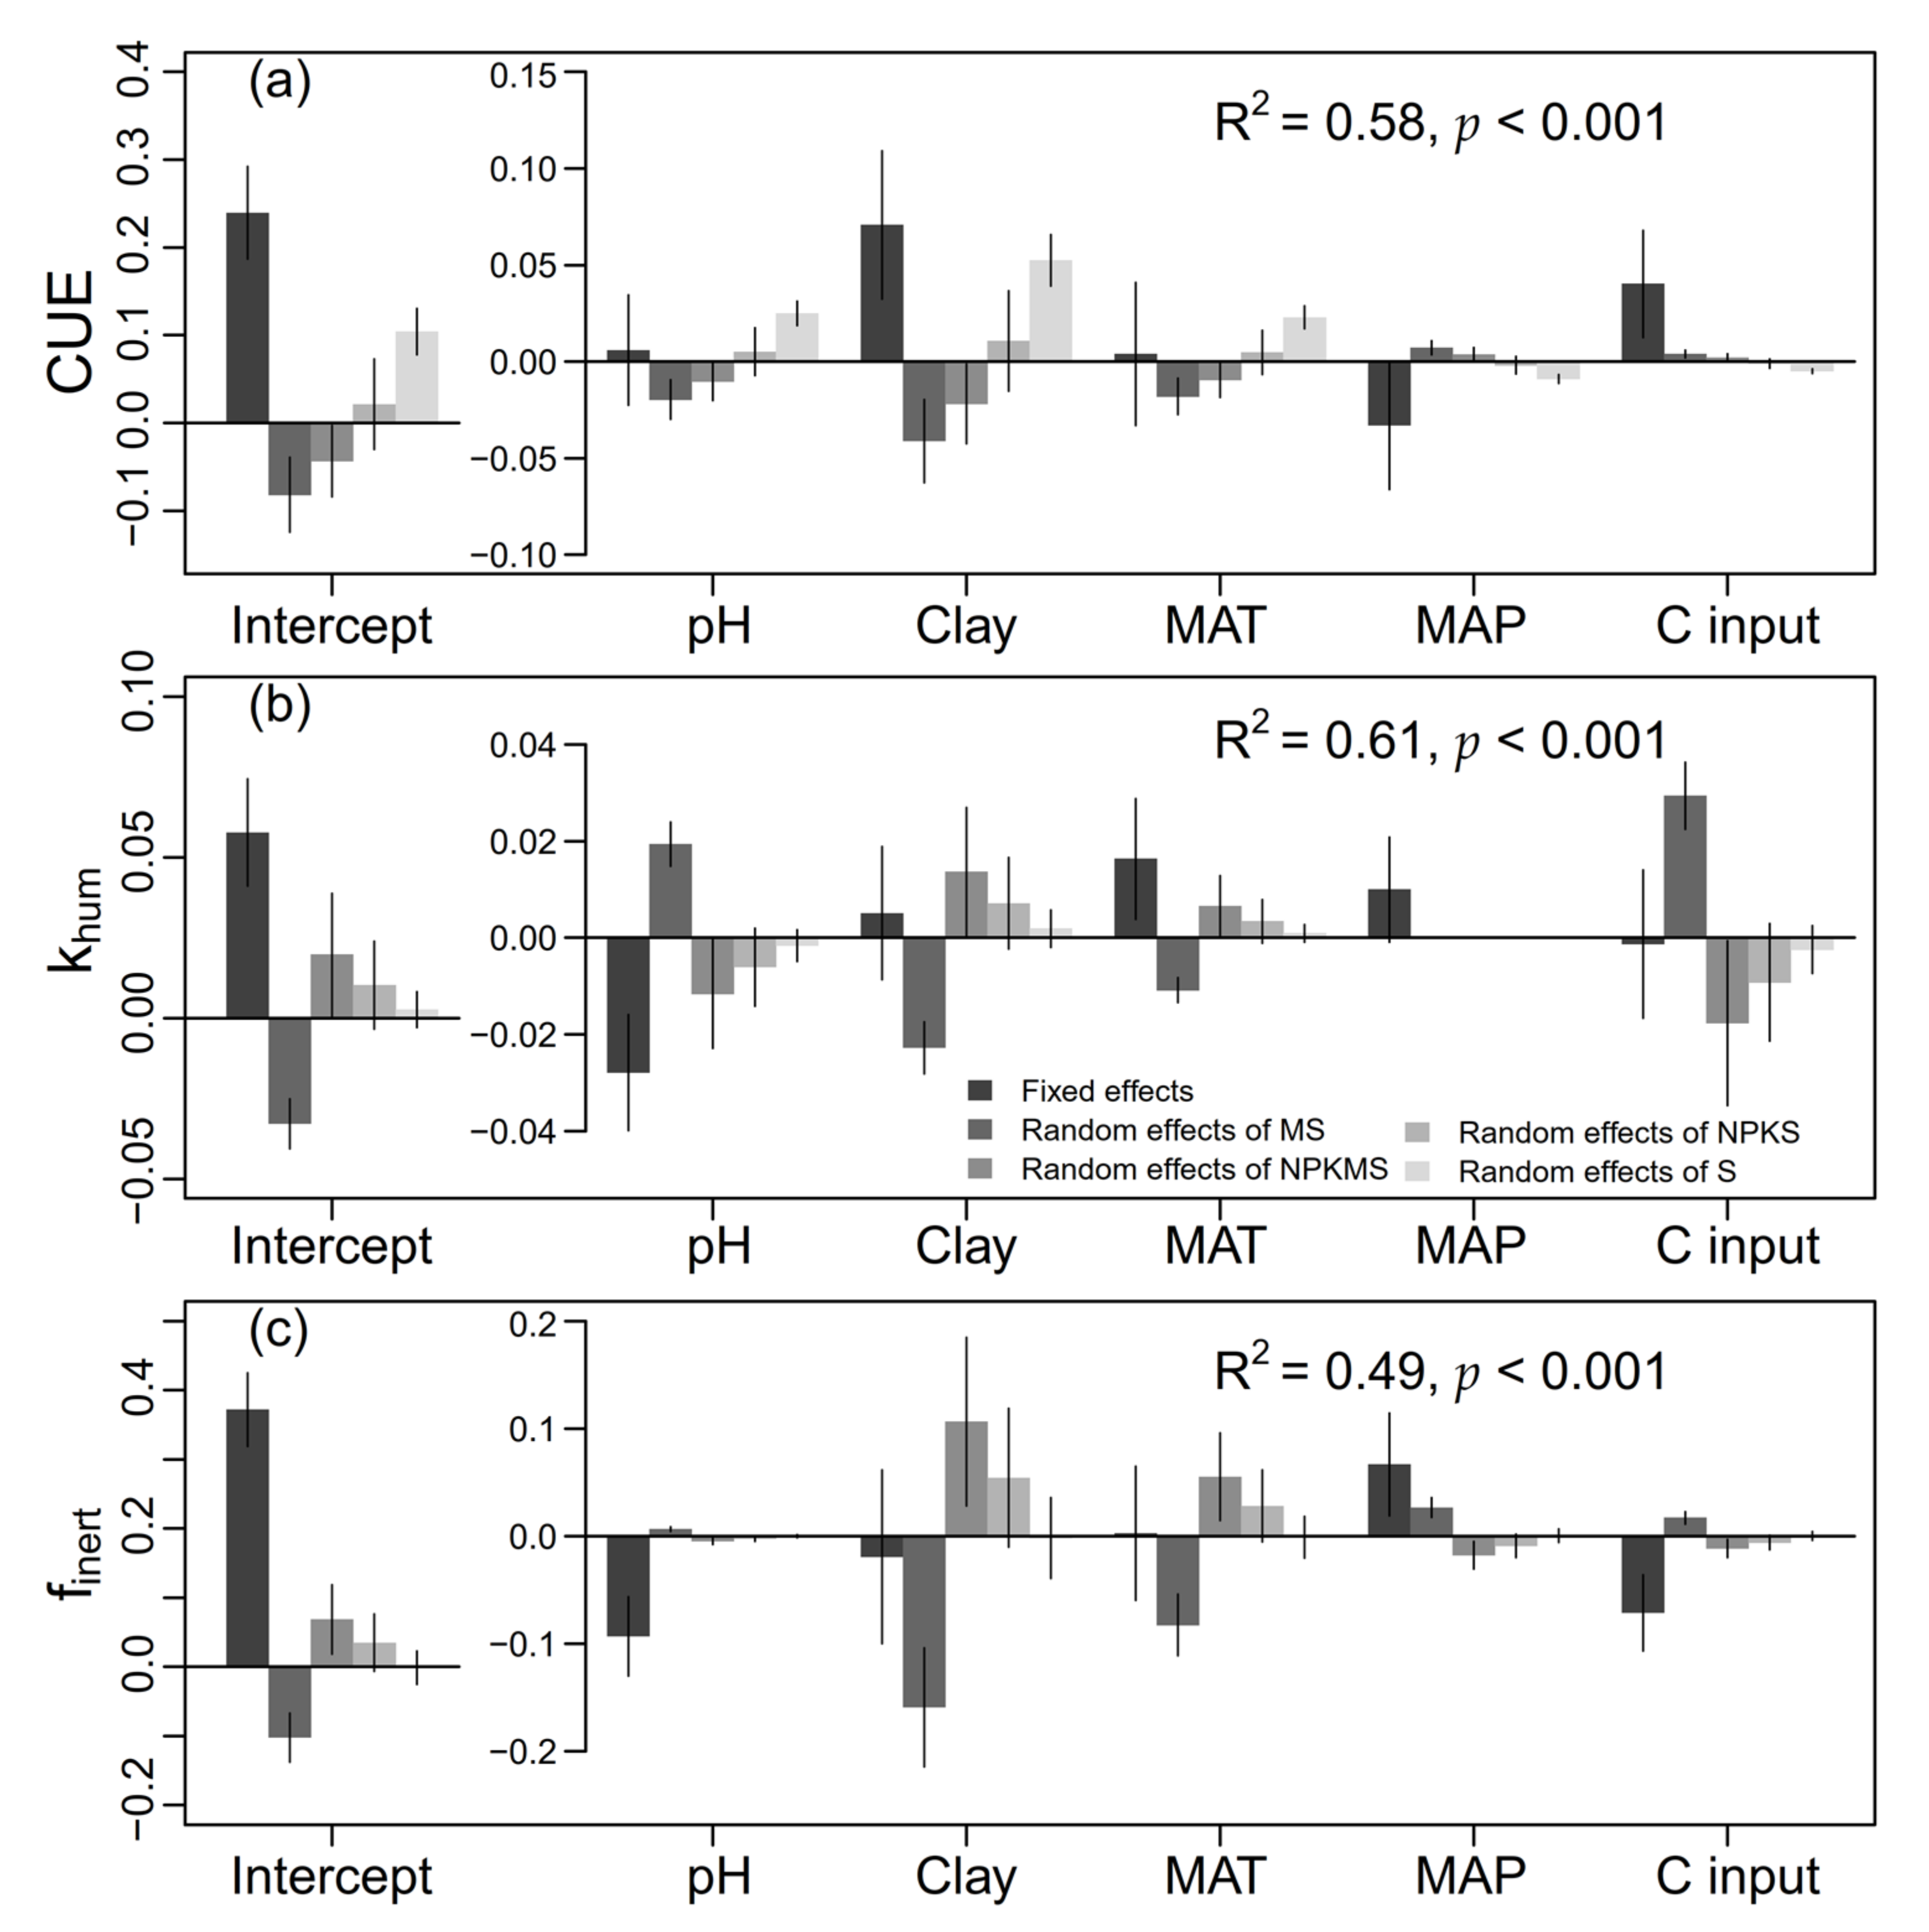
2.5. Drivers of CUE, khum, and finert Changes

A one-way ANOVA was used to test the treatment effect (grouping variable is treatment, i.e., −OA and +OA) on the mean of each of the three parameters (i.e., CUE, khum, and finert) at each trial. Then, a pairwise multiple comparison (Tukey test) was used to compare the treatment effects of +OA and −OA at each site. Meanwhile, a two-way ANOVA was used to test the variability of CUE, khum, and finert under +OA and −OA treatments across different sites. These assessments allow us to address that whether the variability of optimized CUE, khum, and finert is treatment- and/or site-dependent.
Furthermore, we assessed the impacts of some key soil and climate variables and management practices on the variations in CUE, khum, and finert using linear mixed-effect regression. Soil properties included soil pH (pH) and clay content (Clay), and climatic attributes included mean annual temperature (MAT) and mean annual precipitation (MAP) during the trial. C input rate was calculated as the multi-year average (C input) during the trial and was also assumed to influence CUE, khum, and finert. In the linear mixed-effects regression, pH, Clay, MAT, MAP, and C input were treated as fixed effects, while OA treatments (i.e., S, NPKS, MS, and NPKMS) were treated as a random effect (a random slope + random intercept model was fitted). Before fitting the model, all predictor variables were standardized, and the median of the optimized CUE, khum, and finert was used in the modelling (see the Model optimization section). The linear mixed-effect regression was performed using the lmer function in the arm package in R 3.6.1 [49].

2.6. Consequences of OA Addition on Long-Term SOC Dynamics

The potential distinct long-term SOC dynamics under different OA treatments have been rarely assessed taking into account the effect of OA additions on SOC turnover processes. A normal modelling practice is that the same set of model parameters is shared when predicting SOC dynamics under different management scenarios. The data and modelling in this study provide the opportunity to test the credibility of this type of modelling practices. More importantly, based on the constrained model parameters, we can assess the long-term consequence of OA additions on SOC sequestration and the relevant uncertainties induced by model parameter equifinality and collinearity [50]. To do so, we specifically focused on +OA treatments in the trials in order to assess the consequence of OA additions on soil C sequestration, but using optimized parameters under both +OA and −OA treatments. At each site, the model was run for 30 years using the two groups of parameters (i.e., the model parameters constrained by +OA and −OA treatments, respectively), resulting in a total of 200 simulations (i.e., 100 parameter ensembles × 2 groups of parameters (+OA and −OA)). The SOC density at the start of the simulation was assumed the same as that at the beginning of each trial. The long-term yearly C input data were produced by averaging historical annual C input rate under +OA treatment. The changes in SOC at the end of the simulation relative to initial SOC at the start of the simulation were calculated (i.e., relative soil C changes).

3. Results

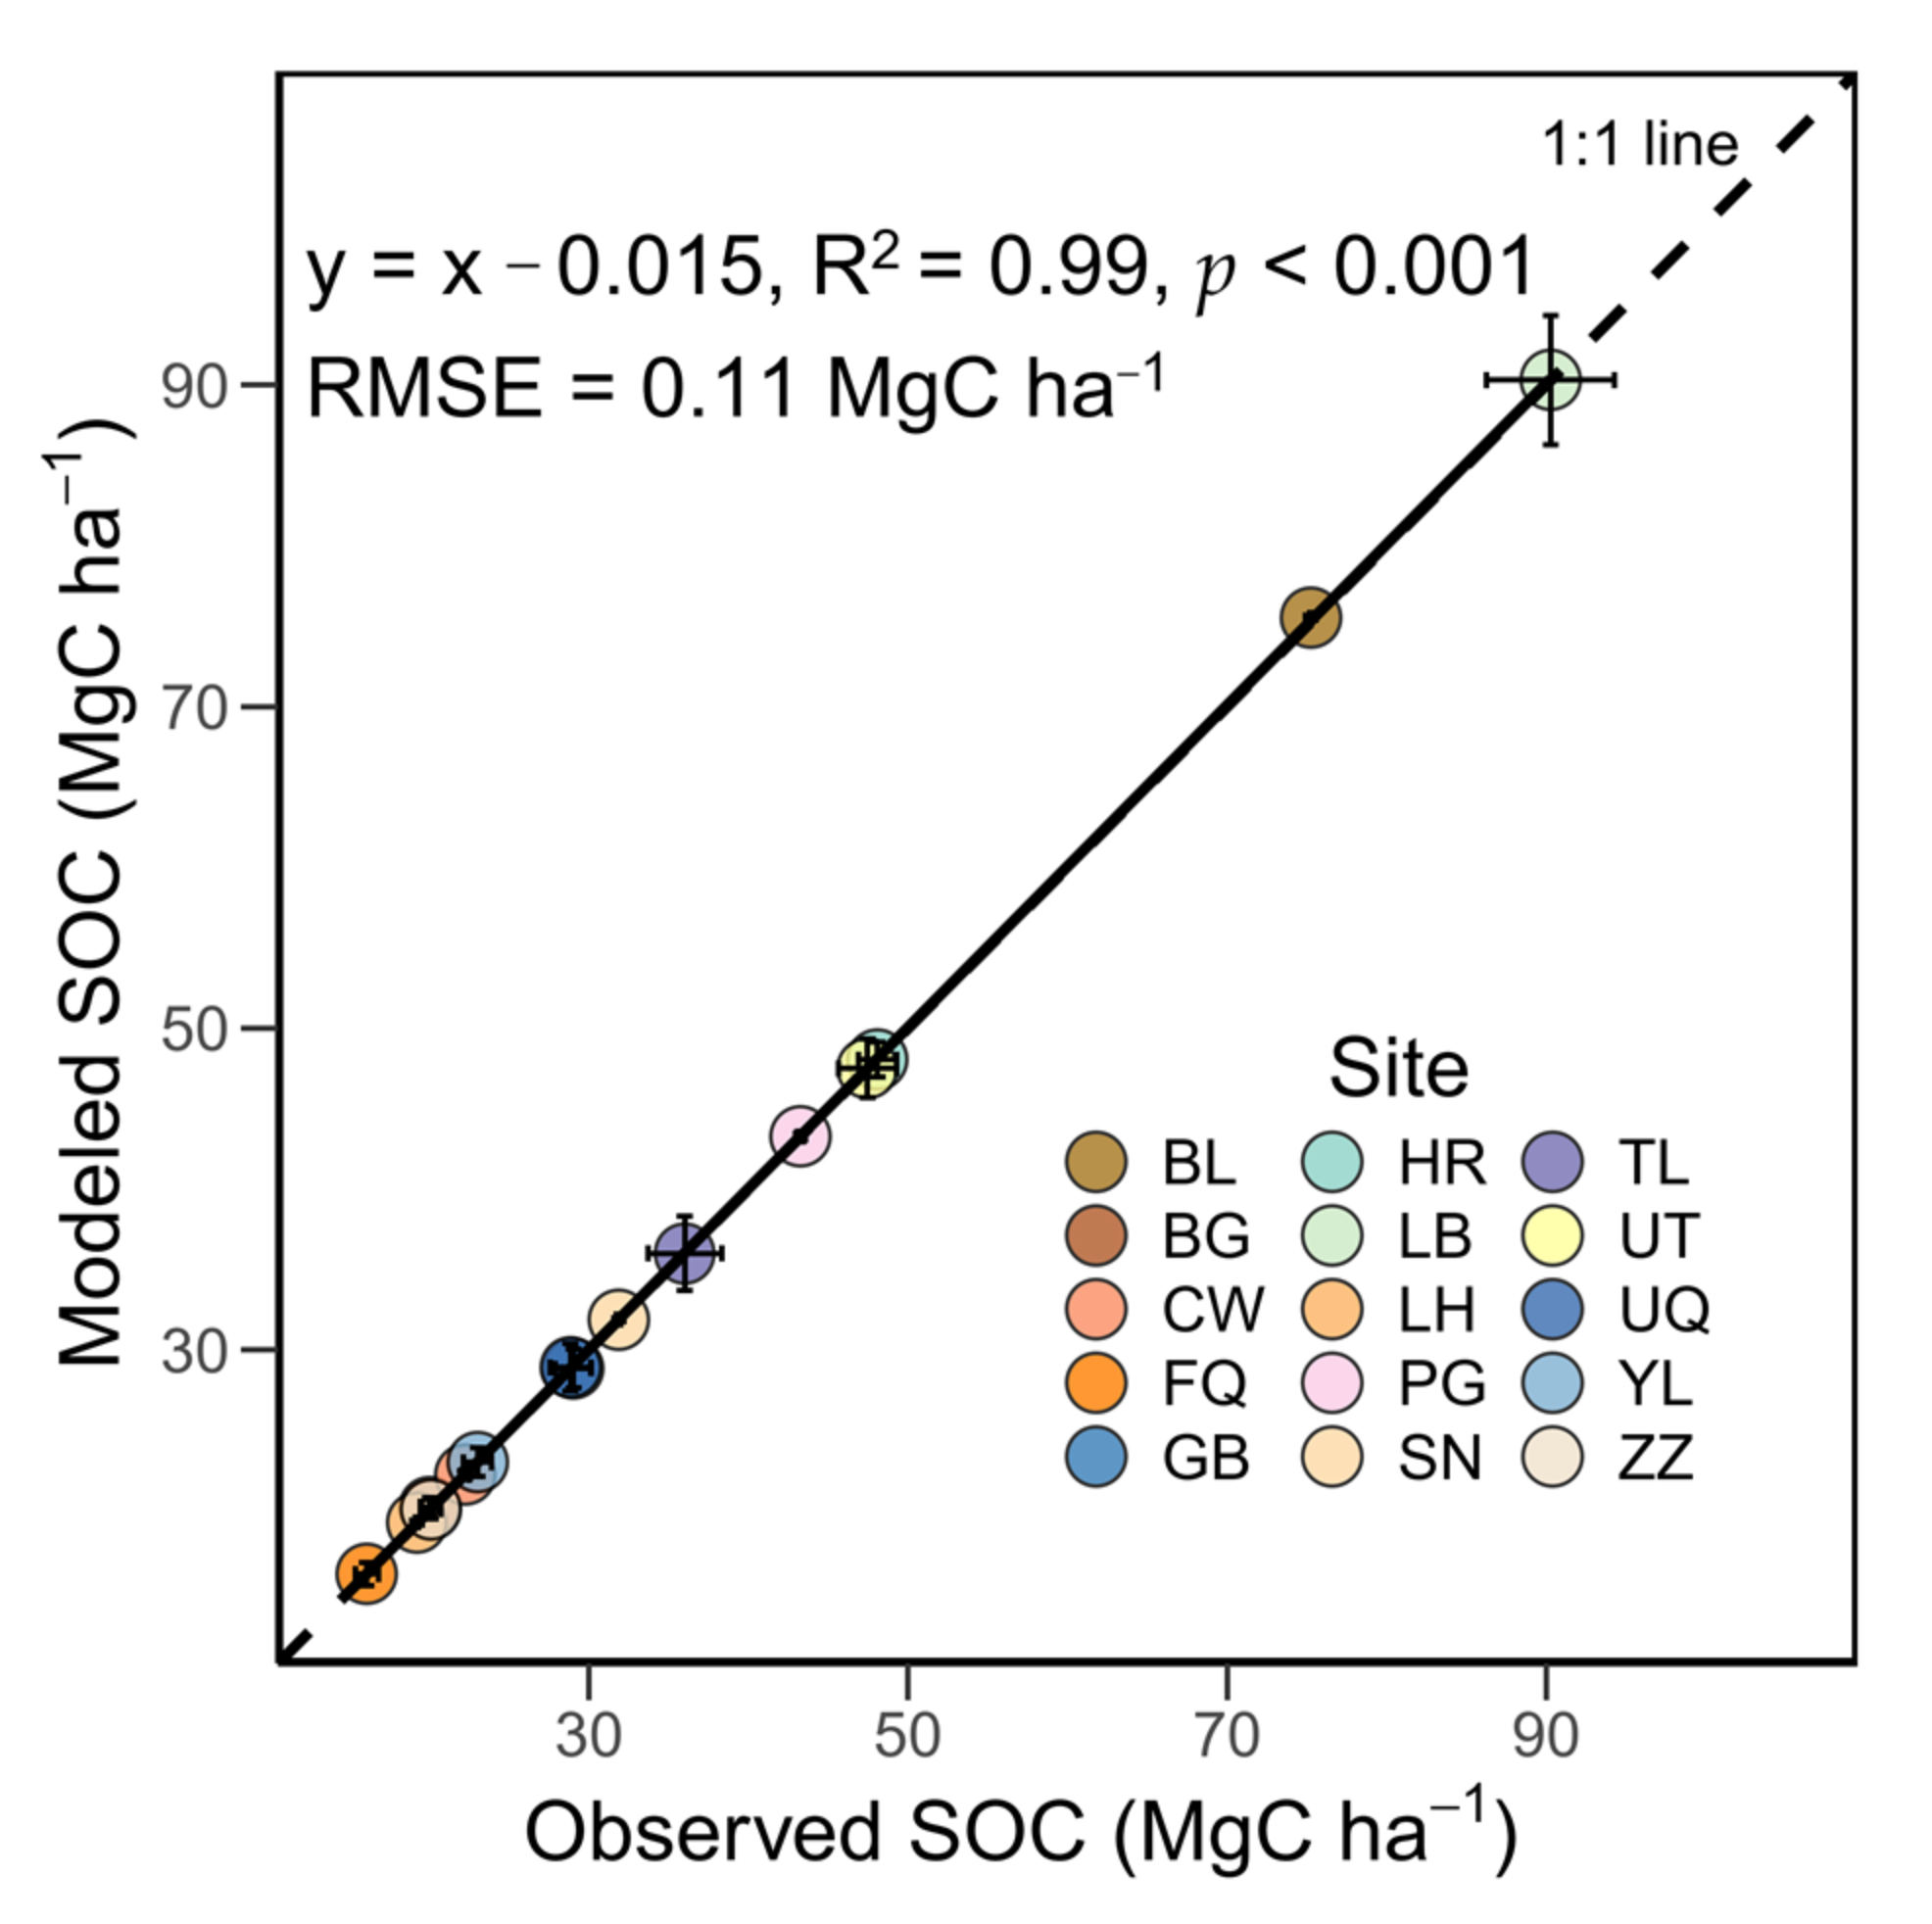
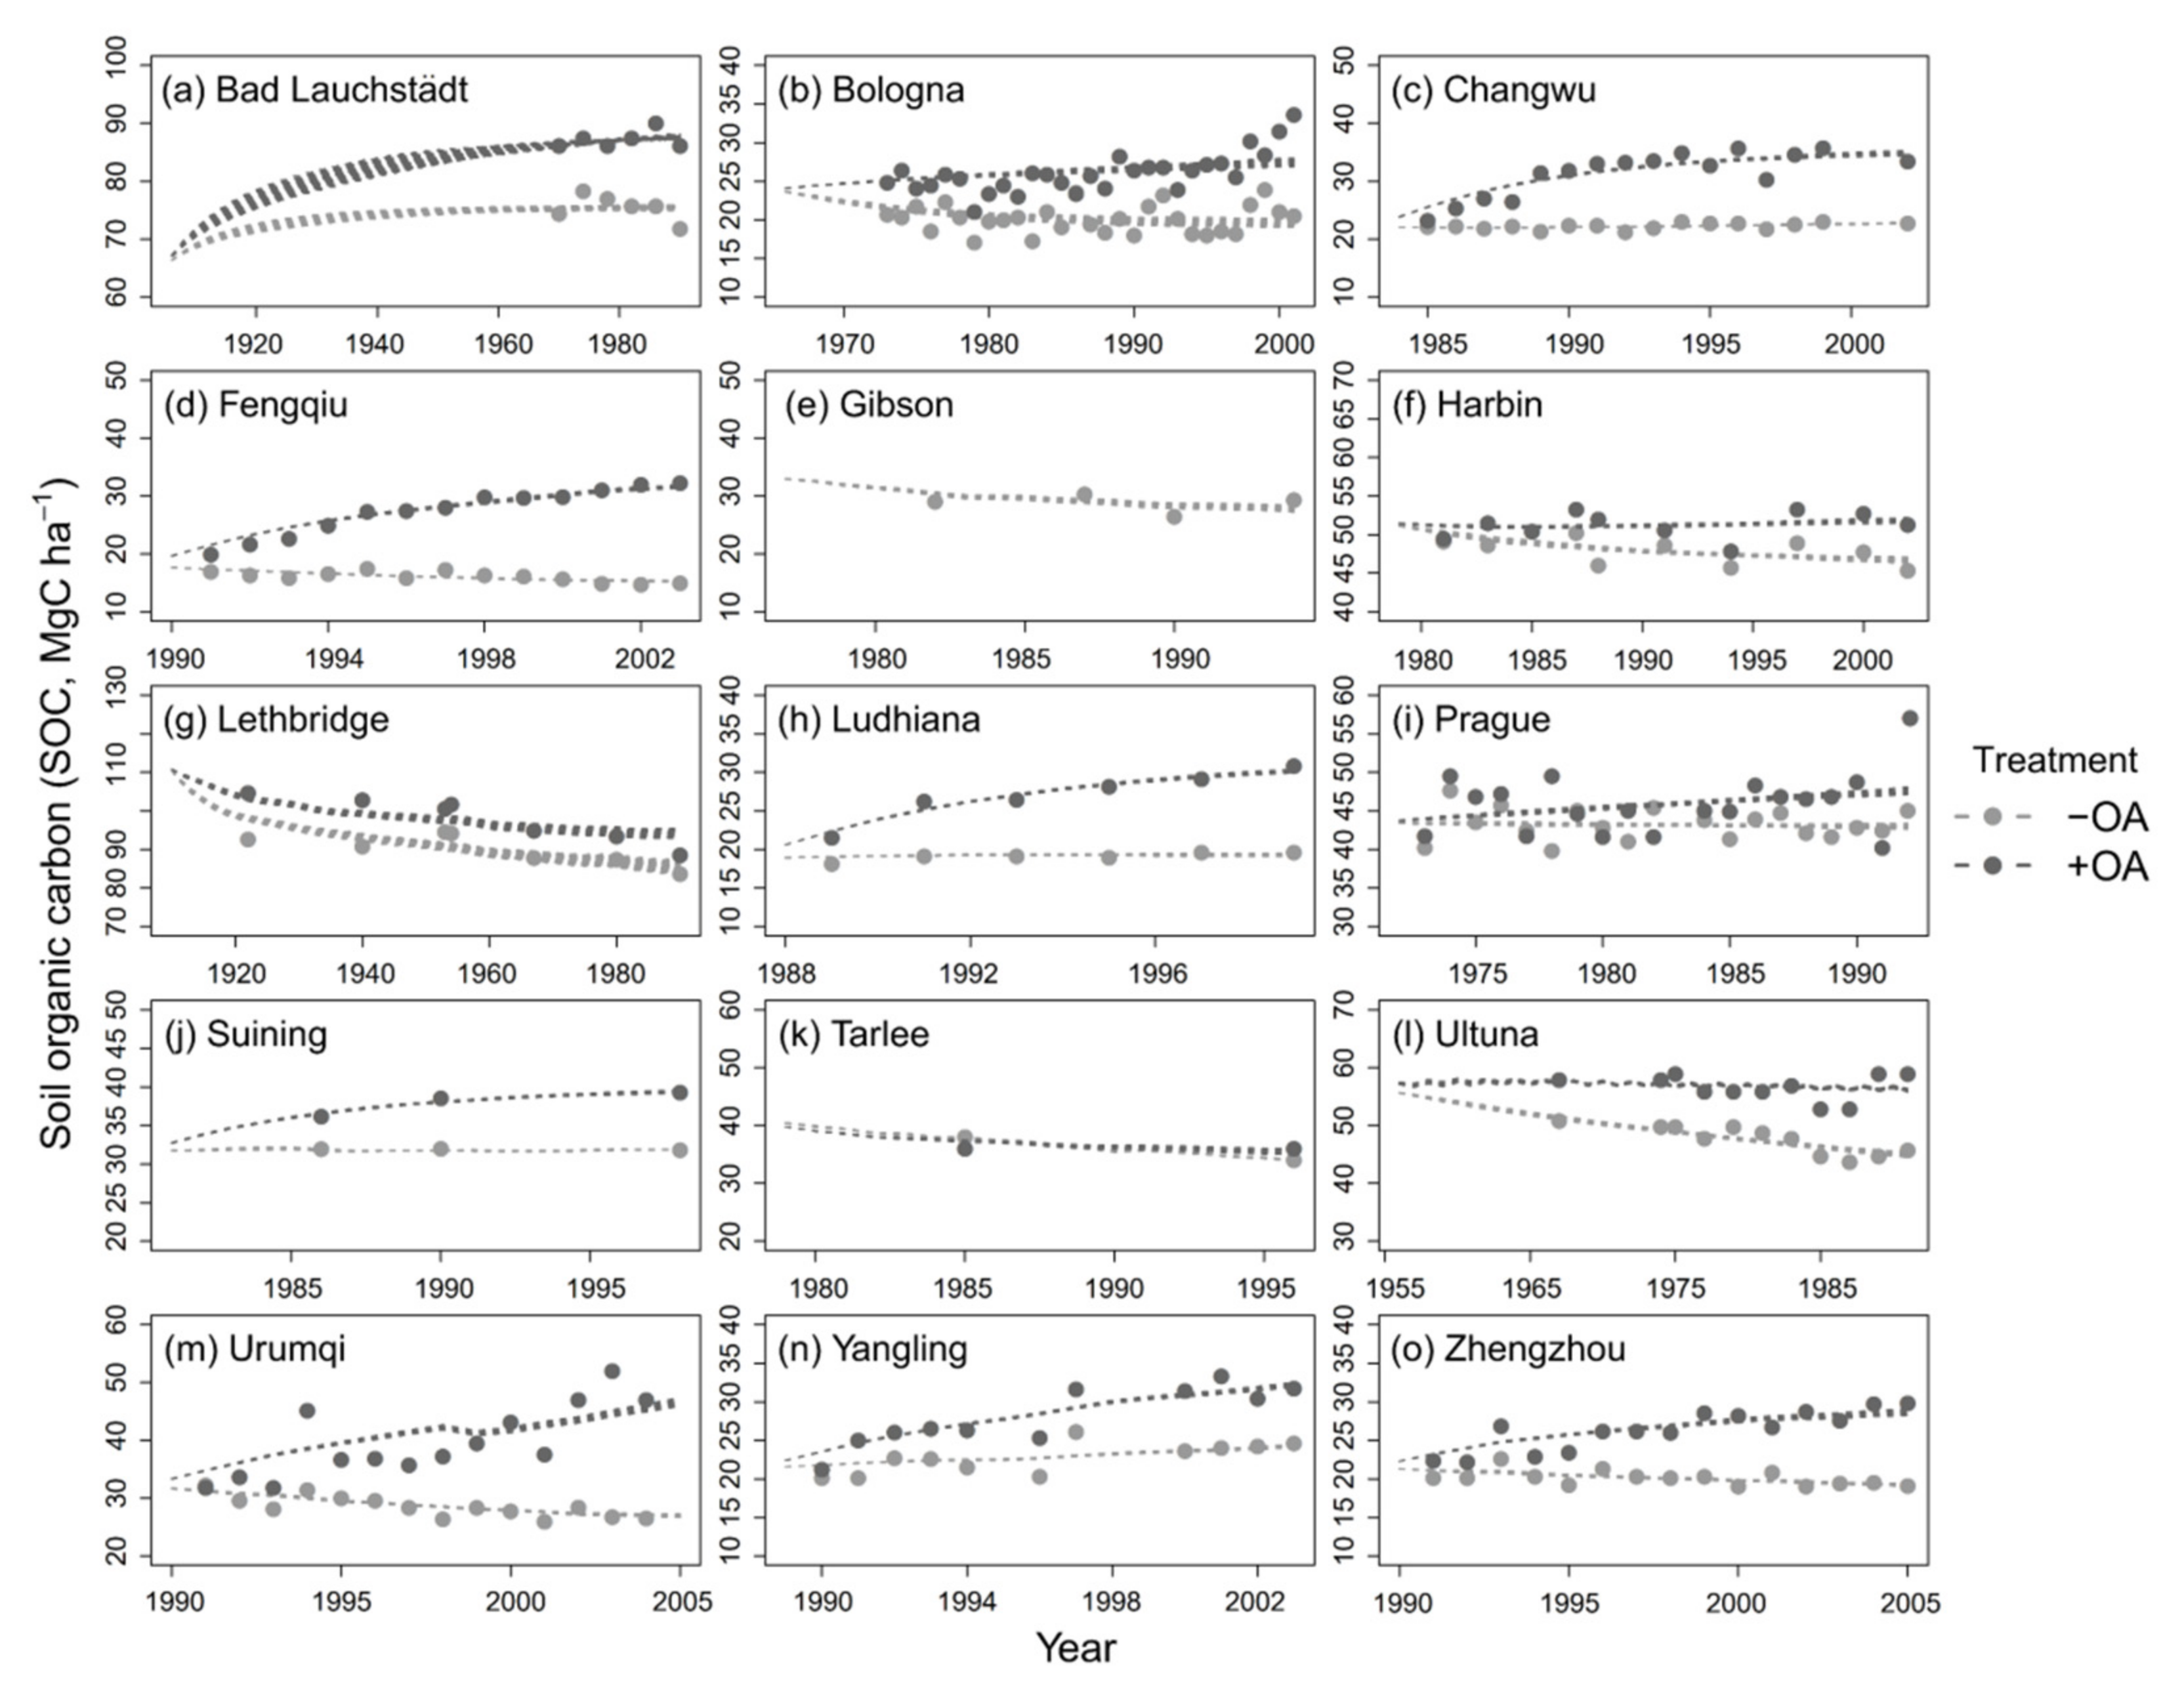
3.1. Performance of the Modified RothC Model

The modified RothC model captured the variation in SOC dynamics under different treatments at each site using the optimized CUE, khum, and finert (Figure 3). Pooling all data together, the RMSE between simulated and observed SOC was 0.11 Mg ha−1. The site- and treatment-specifically optimized parameters enabled the model to explain ~99% of the variance of SOC measurements. At each site, simulated temporal SOC dynamics were also consistent with the dynamics of the long-term field measurements under different treatments (Figure 4). Under the −OA treatment, SOC generally decreased (Figure 4b,d,f,l,m,o) or kept relatively stable (Figure 4c,h–j,n). On the contrary, soil generally accumulated C under +OA (Figure 4a–c,f,h–j,m–o). Although failed to increase soil C at Harbin (Figure 4f) and Ultuna (Figure 4l), +OA reduced SOC losses compared with −OA. At Lethbridge and Tarlee, SOC under both treatments generally decreased due to the relatively low C input rates at the two sites (Figure 4g,k, Table 1).

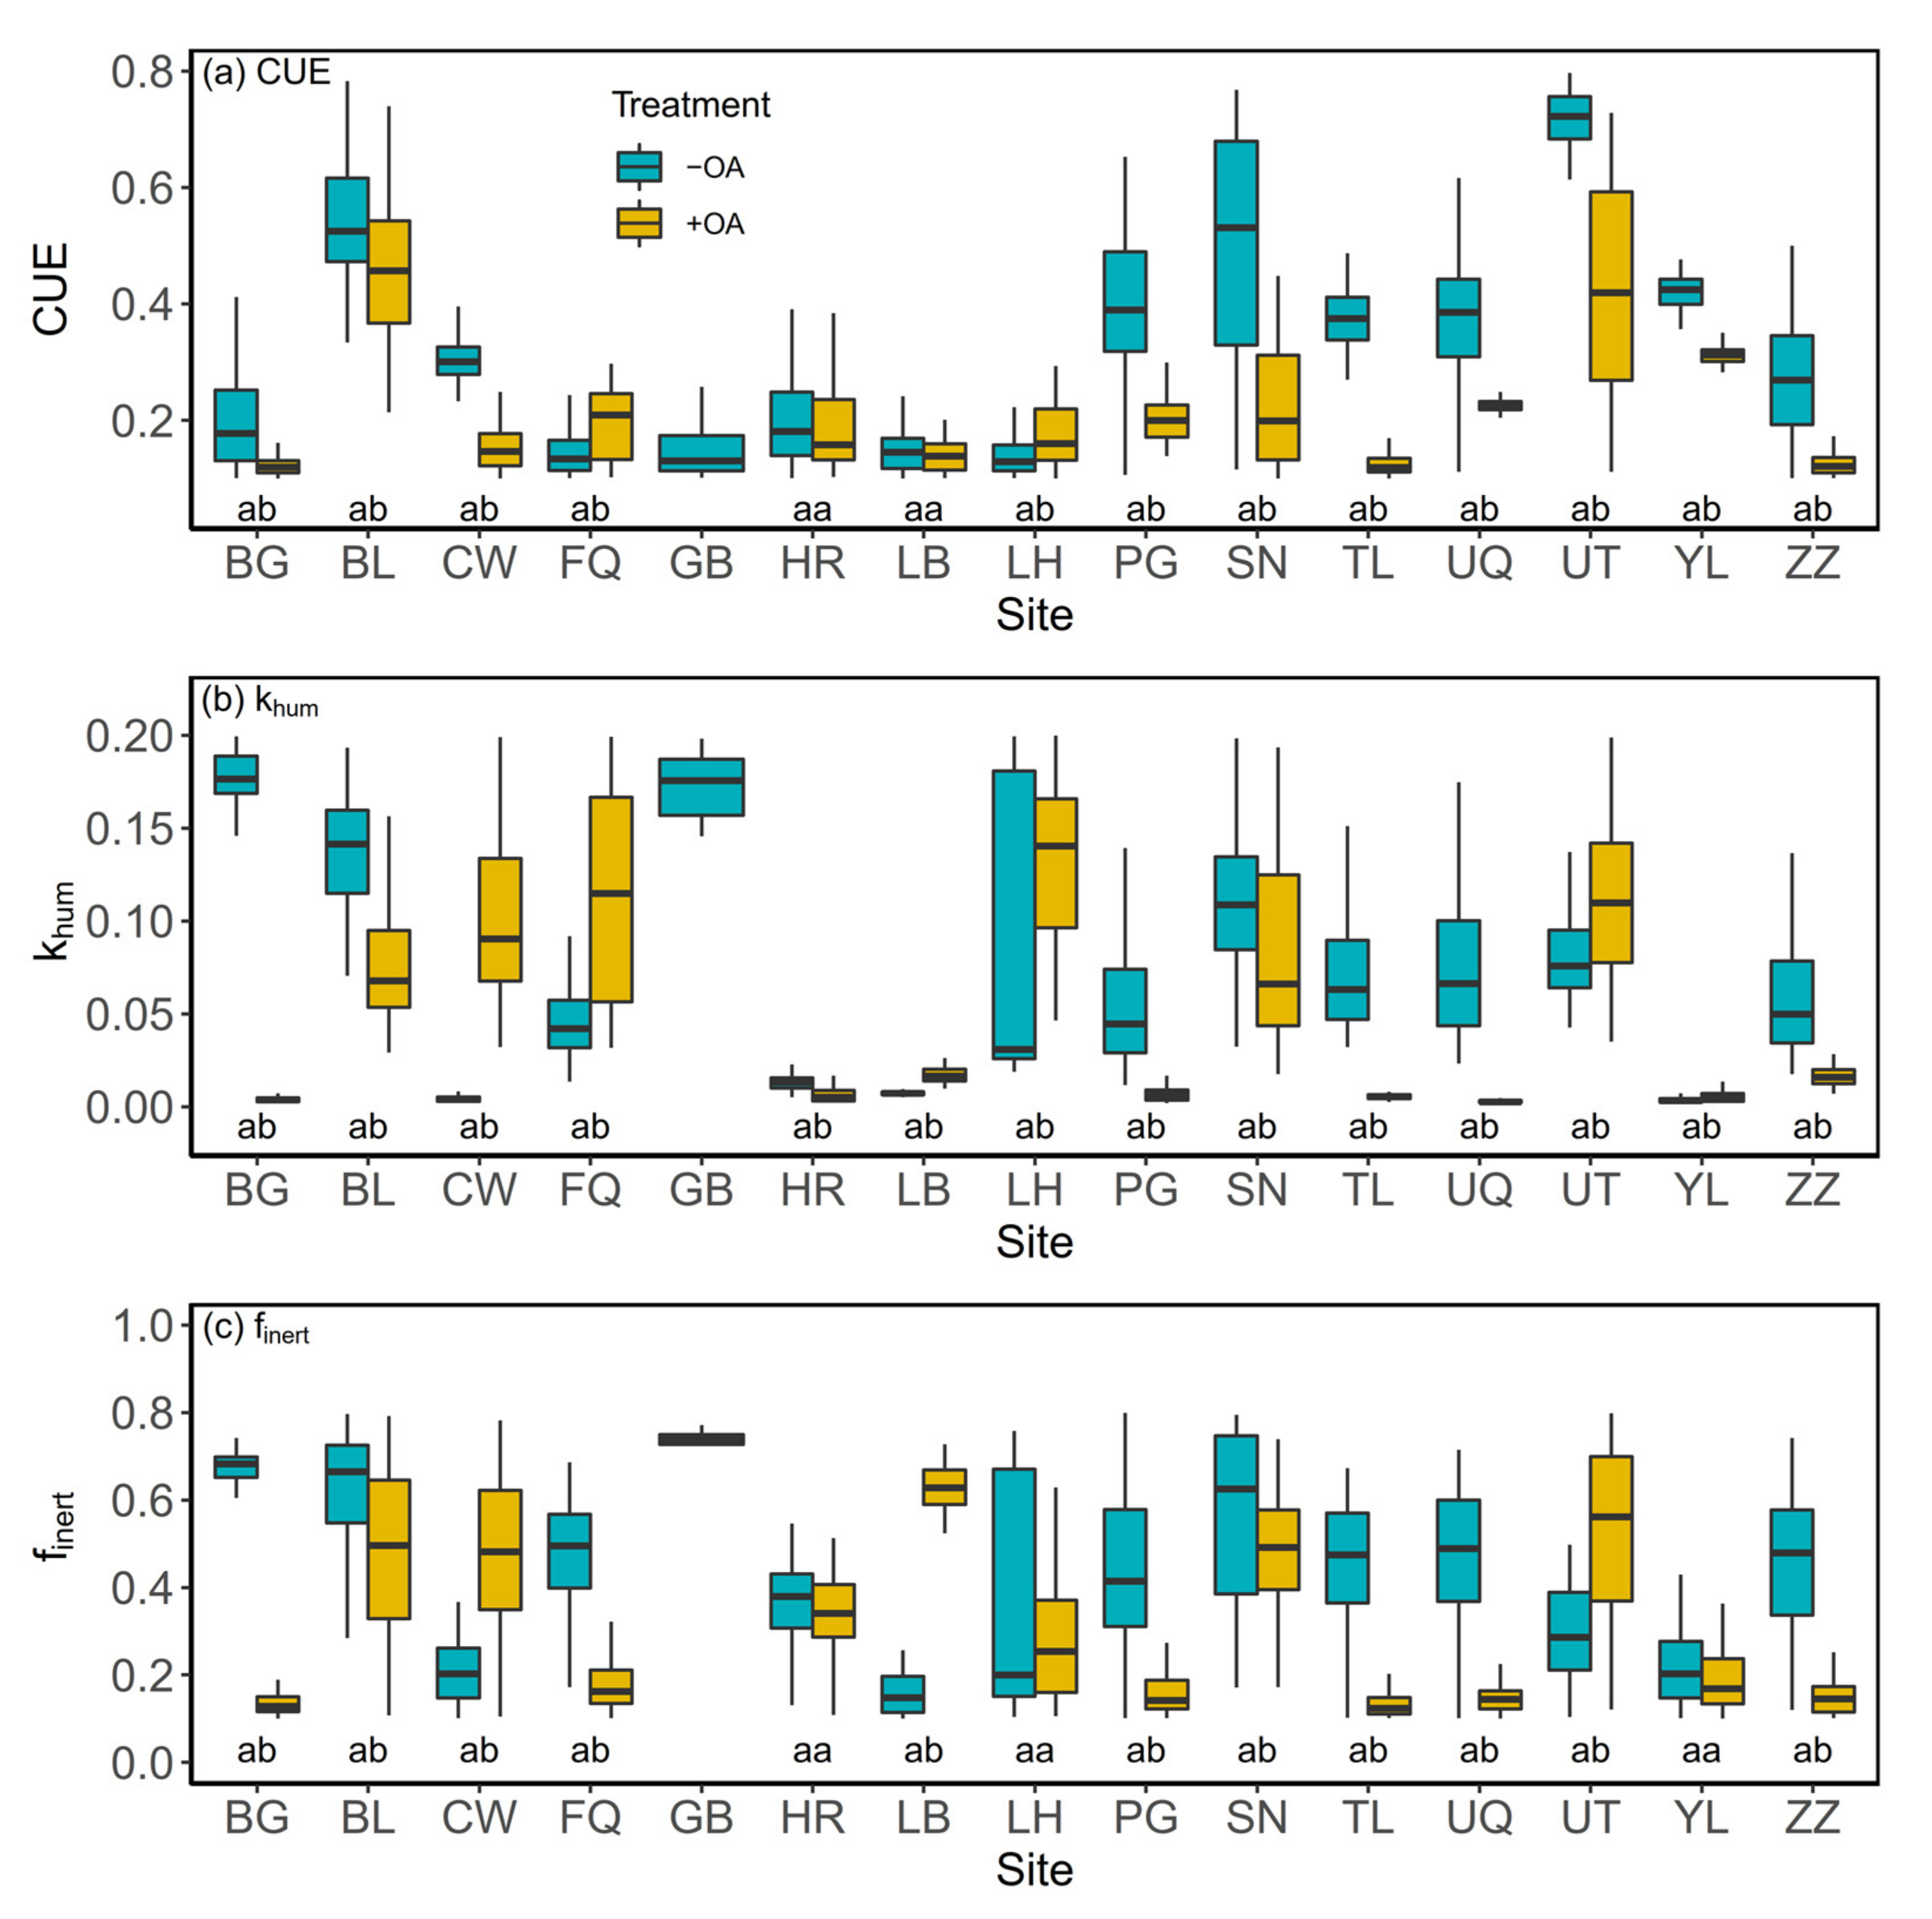
3.2. Microbial Carbon Use efficiency (CUE)

The optimized parameters under OA treatments across the sites showed different distributions (Figure 5). The optimized CUE was significantly different between +OA and −OA, and across the studied sites (Table 2). Across the sites, CUE under +OA at 12 of the 14 sites was lower than that under −OA (Figure 5a). For example, at Ultuna (UT) and Yangling (YL), +OA significantly decreased CUE from 0.72 and 0.42 to 0.42 and 0.31 under −OA, respectively. At two other sites (FQ and LH), however, +OA increased CUE compared with those under −OA. Averaged across all sites, +OA decreased CUE by ~30% (from 0.33 under −OA to 0.22 under +OA) relative to −OA. Focusing on the median of the optimized CUE, the linear mixed-effects regression suggested that soil pH, clay content, MAT, MAP, and the quantity and quality (which is represented by the four OA groups) of OA could explain 58% of the variance in CUE under all treatments and across all sites (Figure 6a). Specifically, soil clay content exerted the largest effect, positively influencing CUE. The fixed-effects coefficients of soil pH, MAT, MAP, and OA amount (i.e., carbon input) were generally insignificant. However, the quality of OA (i.e., the four OA groups) significantly modulated the effects of all five predictor variables to higher or lower magnitudes (Figure 6a).

3.3. Decomposition Rate of Humic Organic Matter (khum)

Similar to CUE, the decomposition rate of humic organic matter (khum) was also significantly different between OA treatments and across the studied sites (Table 2). Across the sites, khum at eight of the 14 sites under +OA was generally lower than that under −OA (Figure 5b). The linear mixed-effects regression showed that soil pH, clay content, MAT, MAP, and the quantity and quality of OA could explain 61% of the variance in khum under all treatments and across all sites (Figure 6b). Although, on average (i.e., the fixed effects), only soil pH had significant effect on khum, the fixed effects of clay, MAT, and C input were significantly modulated by the quality of OA (i.e., the four OA groups, Figure 6b).

3.4. The Fraction of Inert Organic Matter (finert)

The results indicated that finert was also significantly different between OA treatments as well as across the studied sites (Table 2). Similar to CUE, finert under +OA in 11 of the 14 sites was lower than that under −OA (Figure 5c). On average, finert decreased from 0.42 under −OA to 0.31 under +OA. The linear mixed-effects regression showed that soil pH, clay content, MAT, MAP, and the quantity and quality of OA could explain 49% of the variance of finert under all treatments and across all sites (Figure 6c). Among these variables, on average, soil pH and C input had the largest influence, negatively affecting finert. The effects of clay, MAT, and MAP were dependent on the quality of OA (i.e., the four OA groups, Figure 6c).

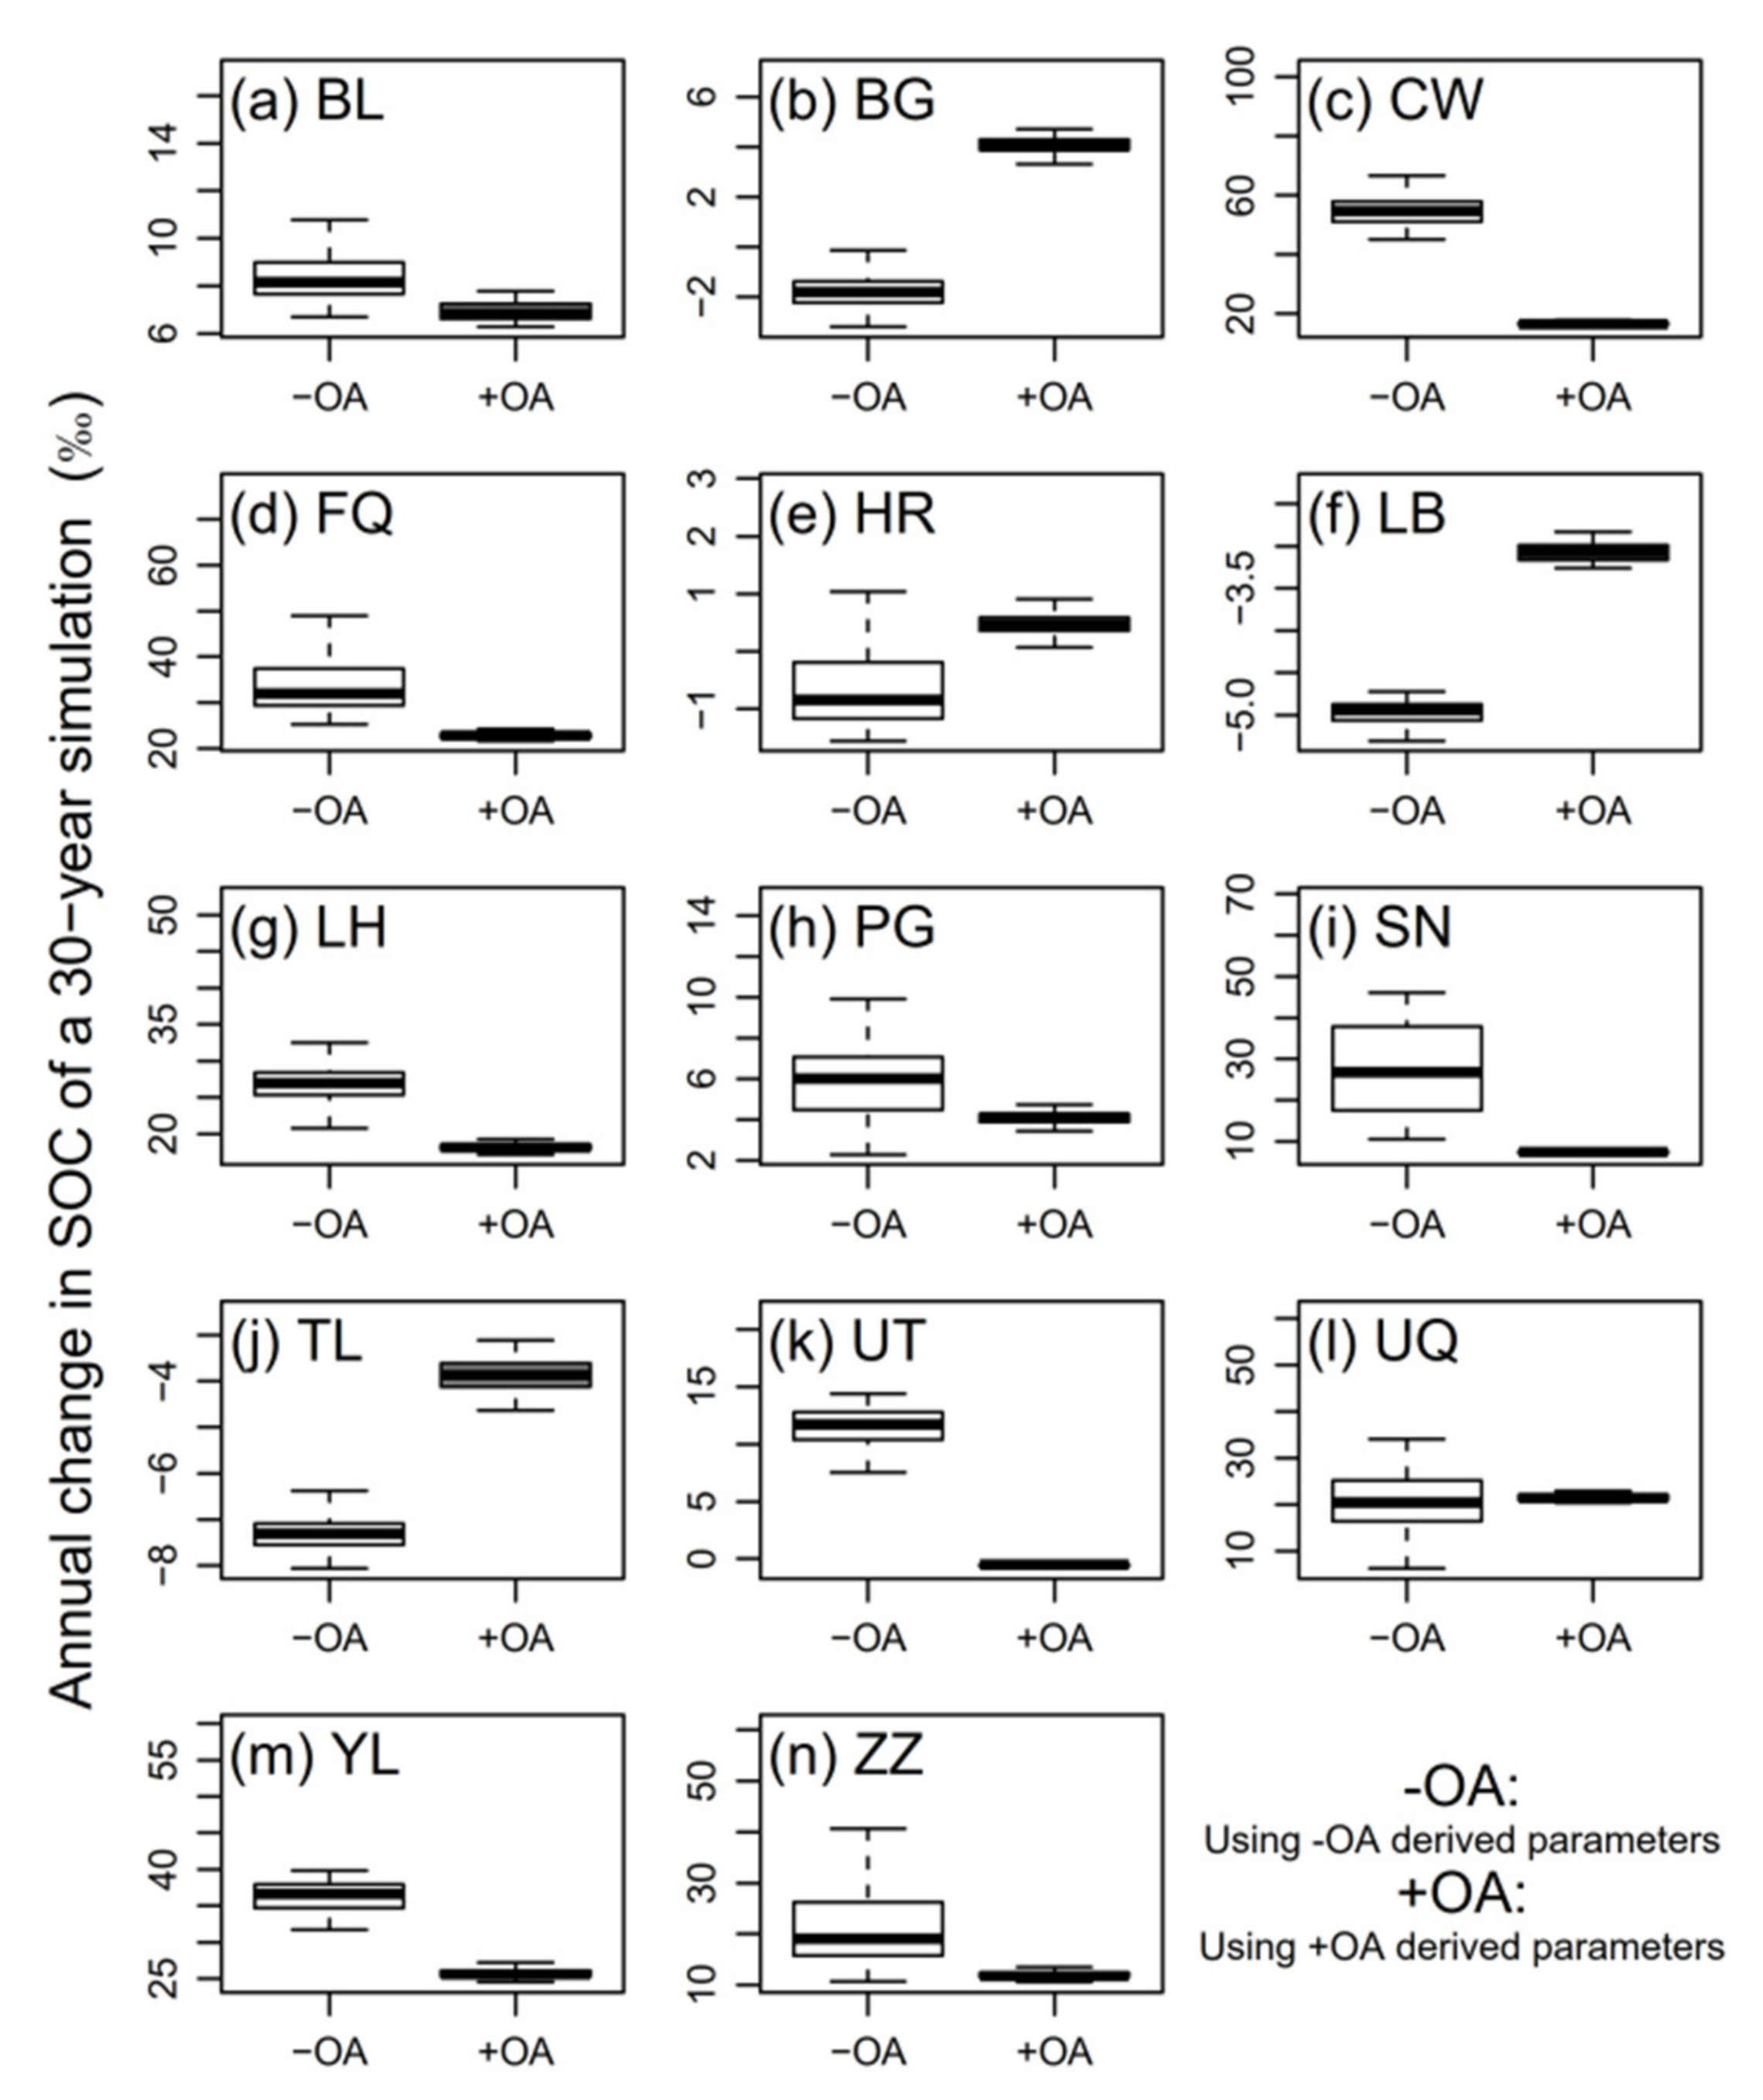
3.5. Long-Term SOC Dynamics under + OA

Using the optimized two groups of model parameters under −OA and +OA respectively, the modified RothC model projected significantly different SOC changes at most sites during a 30-year simulation using C input rate of +OA treatment (Figure 7). Using model parameters derived from −OA, on average, the projected annual SOC change rate across the 14 sites (excluding Gibson because there was no +OA treatment) was 16.6‰ (i.e., SOC accumulation), while it was 9.4‰ if using parameters derived for +OA treatment (Figure 7). Despite the general overestimation of SOC accumulation rate using model parameters derived from −OA treatment, there was large variability across different sites. Specifically, at nine sites, the predicted SOC change rate using parameters derived from −OA treatment was higher than that using parameters derived from +OA treatment (Figure 7a,c,d,g–i,k,m,n), while it was lower in four other sites (Figure 7b–f,j).

4. Discussion

4.1. Effects of OA on CUE

Our results indicated that +OA in general has consistent, negative, and significant effects on microbial C use efficiency (CUE). This may be explained by the stoichiometric controls on CUE [6,7]. In general, OA usually has a much higher C to nutrient (e.g., nitrogen) ratio, i.e., poor quality for microbial utilization, than soil organic matter in the soil. Considering that microbial community has a conservative C to nutrient ratio of microbial biomass, microbes therefore have to respire more C as CO2 to the atmosphere when utilizing OA to keep stoichiometric balance, thus decreasing CUE. On the contrary, if the quality of OA is high or under application of fertilizers, nutrient limitation for microbial growth will be decreased, resulting in higher CUE [51]. Indeed, some experiments have revealed that the application of inorganic N fertilizers can increase CUE [52,53].
Despite the general negative effect of +OA on CUE, the magnitude of the changes in CUE induced by +OA varied among the studied sites. A major reason would be that the background soil nutrient availability may be different across different sites. If the soil has reserved sufficient nutrients (e.g., due to fertilizer application), microbes would take nutrients directly from the soil pool to compensate the nutrient requirement when assimilating C substrates with low nutrient content (e.g., crop residues) [51]. Another reason may be related to the difference in nutrient content in OA at different sites. For example, some OA were applied together with inorganic fertilizers while some others were not. In fact, our results suggested that the responses of CUE to several environmental and management variables were further modified by OA types (Figure 6a). For example, our results demonstrated that clay content has a significant effect on CUE, and the effects of almost all predictor variables (including Clay) were significantly modulated by the quality of OA applied (i.e., the random effects represented by four OA groups) (Figure 6a). Overall, our results demonstrated the importance of environmental and stoichiometric factors for controlling CUE [7]. In agricultural soils, the effects of OA on CUE should be systematically considered with those environmental factors such as soil physiochemical properties and climate, taking into account soil nutrient availability as well as nutrient content in OA itself. Moreover, it should be noticed that the RothC model does not explicitly define CUE, which in this study is calculated as (BIO + HUM)/(CO2-C + BIO + HUM) to ease interpretation. Here, the quantification of CUE is model-dependent, because different models may have distinct structures. As such, our findings may not be universally applicable and different CUE values and their responses to OA additions could be obtained if a different soil C model is used.

4.2. Effects of OA on khum

Our results showed that OA treatments have significant effects on the decomposition rate of humic organic matter (i.e., khum). This phenomenon may be largely explained by the priming effect (PE) [51]. However, in situ quantification of the PE was rare. We inferred the PE by comparing khum constrained under different OA treatments. We found that both positive (i.e., OA stimulates khum) and negative (i.e., OA inhibits khum) PE are possible (Figure 5b). This result is consistent with a data synthesizing study using incubation datasets [12], which revealed that the magnitude and direction of the PE are mainly controlled by the quantity and quality of added fresh C substrate and soil properties which determine baseline energy and nutrient availability for microbial decomposition. In this study, indeed, half of the PE induced by +OA involving manure application were negative (Figure 5b). This may be mainly attributed to the fact that manure includes a significant amount of nutrients, resulting in that microbial decomposition is more likely limited by energy rather than nutrient. For this reason, microbes do not need to mine nutrient from the nutrient-rich humic organic matter (which is one of the key reasons for positive PE) to meet stoichiometric balance. Rather, microbes may shift their preferential substrates to added fresh substrates which are usually energy-rich. This kind of shifting of preferential substrate consequently leads to positive, neutral, or negative PE, depending on the energy and nutrient content in the added substrates as well as in the soil.

4.3. Effects of OA on finert

At most sites, OA had a significant, negative effect on finert—the fraction of organic C resistant to decomposition (Figure 5c). Based on its definition, inert C at a certain site should be the same among OA treatments, because they share the same initial soil. The requirement to adjust finert between treatments at a site (Figure 5c) suggested that the inert fraction has been altered by OA treatments. The significant and negative correlation between C input and finert (Figure 6c) supports our assumption that some of the inert C could become decomposable with the change of environment (e.g., −OA and +OA in this study). It has been reported that continuous organic matter inputs may liberate initially physically protected SOC (which is inaccessible for microbial attack and thus can be considered as inert organic carbon) to decomposition [14,46]. A modelling study using global incubation datasets also found that fresh C input results in the liberation of initially physically protected SOC to decomposition [13]. In addition, our linear mixed-effects regression indicated that the type of OA regulates the association of finert with soil and climate conditions, suggesting the importance of interactions between OA and soil properties for regulating SOC stability, accessibility, and thus, decomposability. We also noticed that the finert decrease accompanies decreased khum in some cases (Figure 5b,c). Except the collinearity between the two parameters, another possible explanation could be that the liberated inert C might be reassigned into a pool with very slow decaying rate. In addition, although the IOM is assumed to be biochemically recalcitrant, it has been reported that all soil C components (including IOM) are actually decomposable [54], which contradicts the default settings of the RothC model (i.e., decay rate of IOM equals to zero). In this study, we have actually included the possible changes of IOM turnover by modifying the fraction of IOM (finert). This is to consider the possible changes in the accessibility of IOM induced by OA treatments [20]. The decay rate of IOM (kiom), however, is not modified, because the time span of most experimental studies lasts only for several years or a few decades. Considering that the possible turnover time of IOM can reach tens of thousands of years, constraining kiom using such relatively short-term observations may lead to large uncertainties.

4.4. Implications for Management Practices

The dependence of CUE, khum, and finert on OA treatments has significant consequences on long-term SOC predictions. Our 30-year simulation using parameters derived from −OA and +OA, respectively, showed large discrepancies in projected SOC under +OA (Figure 7), highlighting that the detailed effects of OA on SOC decomposition processes and thus, SOC changes must be considered. Otherwise, the prediction of SOC changes could be largely biased. For example, a study focusing on the long-term effects of management practices on SOC dynamics in Swiss reports that those practices (e.g., reside retention) previously expected to stimulate SOC accumulation do not always work [55]. We indeed found that the annual average change in our assessed sites under +OA using the correspondingly derived model parameters under −OA is 16.6‰, while the annual average change using +OA parameters is 9.4‰. However, it must be highlighted that there are great variabilities in the annual SOC changes across the sites. Six sites in this study have an initial SOC of lower than 30 Mg ha−1 (Table 1). As expected, SOC accumulated in these sites, supporting the idea that soil with lower initial SOC content may have higher SOC sequestration potential [56]. Another phenomenon has to be highlighted. At most sites, using parameters constrained under −OA, the model predicted much greater SOC stock compared to that predicted using parameters constrained under +OA (Figure 7c,d,h n,o). Consequently, we argue that, if we do not consider the effects of OA management on SOC dynamics, the SOC sequestration potential under OA additions may be largely overestimated.
Our results have important implications for understanding SOC dynamics in agricultural soils. The ‘4 per 1000’ initiative has been launched to increase global SOC stocks by 4‰ per year in the next 30 years as a compensation for the global anthropogenic emissions of greenhouse gases [1,2]. Our simulations suggested that this 4‰ target can be reached on average under the OA inputs assessed in this study, albeit some variability exists across different sites. Indeed, the average SOC accumulation rate during the 30-year simulation was 9.4‰, which is two times more than the target of 4‰. However, it must be noted that the OA amount under +OA treatment in our dataset is high, up to 6.5 Mg C ha−1, which is much higher than the estimated average C input rate of~2 Mg C ha−1 across global croplands [57]. Considering the large spatial variability in C input across space and possible SOC saturation in certain areas with initially high soil C, achieving the target of ‘4 per 1000’ initiative under actual farming management could be very challenging.

4.5. Limitations and Uncertainties

It should be noted that we did not empirically verify the modelled responses of CUE, khum, and finert to OA management. Evidences from in situ observations on detailed soil C turnover processes (e.g., CUE and soil C decay rates) in response to OA management are required. We suggest that future studies should combine process-based modelling with detailed in situ measurements to enhance the credibility of findings concluded by a modelling approach. In addition, we used a complexity-reduced RothC model which does not directly take into account some critical mechanisms underpinning SOC dynamics such as microbial decomposition processes and physical protection of SOC against decomposition. For example, microbial-explicit models may better represent processes influencing CUE [58,59]. However, it should be noted that complex models usually need more detailed input information for model initialization and parameterization. This detailed model input information is normally not readily obtainable across large spatiotemporal scales. Besides, complex models such as microbial-explicit models usually have much more parameters that are difficult to empirically determine, resulting in great uncertainties in model outputs. Overall, we choose to use a simplified RothC model rather than a more complex model (e.g., microbial-explicit model), because we must carefully consider the trade-off between model complexity and data availability.
We admit that our approach (using site- and treatment-specific parameterization strategies) would sacrifice the model’s capability for large-scale applications, although large-scale application is not the intention of this study. Taking advantage of process-based modelling, our intention is to infer the potential effects of OA on soil C turnover processes such as CUE, soil C decay rates, and the fraction of inert C across different sites and under different trials, which otherwise are impossible to detect. To do so, we used site- and treatment-specific parameterization strategies. Our findings provide valuable insights into reliable SOC predictions across large scales. Models usually have to use the same set of model parameters to facilitate large-scale application. Our results demonstrate that this would be questionable and unrealistic. Here, we propose one potential implication of our approaches/findings across large extents. Distinct sets of model parameters for different management treatments (e.g., +OA and −OA in this study), soil types, OA qualities (stoichiometry), and climate can be firstly obtained. Then, during large-scale simulations across space, different model parameters can be used for different management and environmental conditions. This modelling strategy would reduce the uncertainty induced by model parameters, but more data is absolutely required to constrain the model parameters under different conditions, as demonstrated in this study.
It has been reported that the collinearity among model parameters could be a major source of uncertainty [50,60,61] and lead to unrealistic and biased model predictions of future soil C dynamics [62]. Here, we found that correlation coefficients between the constrained three parameters are all lower than 0.6 (data not shown), suggesting a limited influence of collinearity on the model predictions [63]. Moreover, rather than splitting the dataset into training and testing sub-datasets, in this study, we constrained the model parameters using all observed data to maximally constrain parameters. This can reduce uncertainty in model parameters as well as in model predictions [50]. In fact, the uncertainty in model predictions is quite small, particularly at sites with more available measurements (Figure 4), consisting with the inference by Luo et al. [50]. To limit collinearity- and/or parameter equifinality-induced uncertainties, we only performed a 30-year simulation which is in general aligned with the average duration of the observed data (i.e., 29 years, Table 1). We admit that the parameter equifinality and collinearity, common challenges faced by modellers, do exist in our study. Rather than solving the collinearity and equifinality issues (which need close collaborations between modellers and experimentalists), we quantified their consequences on the simulation results.

5. Conclusions

Organic amendments have significant effects on microbial C use efficiency, the decomposition rate of humic organic carbon, and the fraction of inert soil C resistant to microbial attack, and these effects are site- and treatment-dependent. Local soil and climate conditions as well as the quantity and quality of organic amendments could partially explain such dependence. In order to provide a more reliable assessment of the SOC sequestration potential in agricultural soils, the effects of organic amendments on SOC turnover and stability must be properly addressed, taking into account the quantity and quality of added organic amendments as well as local soil and climate conditions. Otherwise, the soil C sequestration offered by improving the management of organic amendments would be overestimated.

Author Contributions

Conceptualization, Z.L.; Data curation, G.W.; Funding acquisition, Z.L. and G.W.; Investigation, G.W.; Methodology, Z.L.; Writing—original draft, G.W.; Writing—review & editing, Z.L. All authors have read and agreed to the published version of the manuscript.

Funding

This research was funded by National Natural Science Foundation of China (Grant No. 41930754, 41775156).

Data Availability Statement

Data are available upon request.

Acknowledgments

Yongqiang Yu and Penfei Han from Institute of Atmospheric Physics, Chinese Academy of Sciences are acknowledged for their contributions in data collections.

Conflicts of Interest

The authors declare no conflict of interest.

References

  1. Minasny, B.; Malone, B.P.; McBratney, A.B.; Angers, D.A.; Arrouays, D.; Chambers, A.; Chaplot, V.; Chen, Z.-S.; Cheng, K.; Das, B.S.; et al. Soil carbon 4 per mille. Geoderma 2017, 292, 59–86. [Google Scholar] [CrossRef]
  2. Rumpel, C.; Amiraslani, F.; Chenu, C.; Garcia Cardenas, M.; Kaonga, M.; Koutika, L.S.; Ladha, J.; Madari, B.; Shirato, Y.; Smith, P.; et al. The 4p1000 initiative: Opportunities, limitations and challenges for implementing soil organic carbon sequestration as a sustainable development strategy. Ambio 2020, 49, 350–360. [Google Scholar] [CrossRef] [PubMed] [Green Version]
  3. Liu, C.; Lu, M.; Cui, J.; Li, B.; Fang, C. Effects of straw carbon input on carbon dynamics in agricultural soils: A meta-analysis. Glob. Chang. Biol. 2014, 20, 1366–1381. [Google Scholar] [CrossRef]
  4. Lu, F.; Wang, X.K.; Han, B.; Ouyang, Z.Y.; Duan, X.N.; Zheng, H.; Miao, H. Soil carbon sequestrations by nitrogen fertilizer application, straw return and no-tillage in China’s cropland. Glob. Chang. Biol. 2009, 15, 281–305. [Google Scholar] [CrossRef]
  5. Wang, G.; Luo, Z.; Wang, E.; Zhang, W. Reducing greenhouse gas emissions while maintaining yield in the croplands of Huang-Huai-Hai Plain, China. Agric. For. Meteorol. 2018, 260–261, 80–94. [Google Scholar] [CrossRef]
  6. Manzoni, S.; Čapek, P.; Porada, P.; Thurner, M.; Winterdahl, M.; Beer, C.; Brüchert, V.; Frouz, J.; Herrmann, A.M.; Lindahl, B.D. Reviews and syntheses: Carbon use efficiency from organisms to ecosystems–definitions, theories, and empirical evidence. Biogeosciences 2018, 15, 5929–5949. [Google Scholar] [CrossRef] [Green Version]
  7. Manzoni, S.; Taylor, P.; Richter, A.; Porporato, A.; Ågren, G.I. Environmental and stoichiometric controls on microbial carbon-use efficiency in soils. New Phytol. 2012, 196, 79–91. [Google Scholar] [CrossRef]
  8. Devêvre, O.C.; Horwáth, W.R. Decomposition of rice straw and microbial carbon use efficiency under different soil temperatures and moistures. Soil Biol. Biochem. 2000, 32, 1773–1785. [Google Scholar] [CrossRef]
  9. Qiao, Y.; Wang, J.; Liang, G.; Du, Z.; Zhou, J.; Zhu, C.; Huang, K.; Zhou, X.; Luo, Y.; Yan, L.; et al. Global variation of soil microbial carbon-use efficiency in relation to growth temperature and substrate supply. Sci. Rep. 2019, 9, 5621. [Google Scholar] [CrossRef]
  10. Frey, S.D.; Lee, J.; Melillo, J.M.; Six, J. The temperature response of soil microbial efficiency and its feedback to climate. Nat. Clim. Chang. 2013, 3, 395. [Google Scholar] [CrossRef]
  11. Kuzyakov, Y. Priming effects: Interactions between living and dead organic matter. Soil Biol. Biochem. 2010, 42, 1363–1371. [Google Scholar] [CrossRef]
  12. Luo, Z.; Wang, E.; Smith, C. Fresh carbon input differentially impacts soil carbon decomposition across natural and managed systems. Ecology 2015, 96, 2806–2813. [Google Scholar] [CrossRef]
  13. Luo, Z.; Baldock, J.; Wang, E. Modelling the dynamic physical protection of soil organic carbon: Insights into carbon predictions and explanation of the priming effect. Glob. Chang. Biol. 2017, 23, 5273–5283. [Google Scholar] [CrossRef] [PubMed]
  14. Rovira, P.; Vallejo, V.R. Labile, recalcitrant, and inert organic matter in Mediterranean forest soils. Soil Biol. Biochem. 2007, 39, 202–215. [Google Scholar] [CrossRef]
  15. Smith, P.; Soussana, J.-F.; Angers, D.; Schipper, L.; Chenu, C.; Rasse, D.P.; Batjes, N.H.; van Egmond, F.; McNeill, S.; Kuhnert, M.; et al. How to measure, report and verify soil carbon change to realize the potential of soil carbon sequestration for atmospheric greenhouse gas removal. Glob. Chang. Biol. 2020, 26, 219–241. [Google Scholar] [CrossRef] [Green Version]
  16. Jenkinson, D.S.; Andrew, S.P.S.; Lynch, J.M.; Goss, M.J.; Tinker, P.B. The turnover of organic carbon and nitrogen in soil. Philos. Trans. R. Soc. Lond. Ser. B-Biol. 1990, 329, 361–367. [Google Scholar]
  17. Keating, B.; Carberry, P.; Hammer, G.; Probert, M.; Robertson, M.; Holzworth, D.; Huth, N.; Hargreaves, J.; Meinke, H.; Hochman, Z. An overview of APSIM, a model designed for farming systems simulation. Eur. J. Agron. 2003, 18, 267–288. [Google Scholar] [CrossRef] [Green Version]
  18. Parton, W.J.; Scurlock, J.M.O.; Ojima, D.S.; Gilmanov, T.G.; Scholes, R.J.; Schimel, D.S.; Kirchner, T.; Menaut, J.C.; Seastedt, T.; Moya, E.G. Observations and modeling of biomass and soil organic matter dynamics for the grassland biome worldwide. Glob. Biogeochem. Cycles 1993, 7, 785–809. [Google Scholar] [CrossRef] [Green Version]
  19. Conant, R.T.; Ryan, M.G.; Ågren, G.I.; Birge, H.E.; Davidson, E.A.; Eliasson, P.E.; Evans, S.E.; Frey, S.D.; Giardina, C.P.; Hopkins, F.M. Temperature and soil organic matter decomposition rates–synthesis of current knowledge and a way forward. Glob. Chang. Biol. 2011, 17, 3392–3404. [Google Scholar] [CrossRef]
  20. Dungait, J.A.; Hopkins, D.W.; Gregory, A.S.; Whitmore, A.P. Soil organic matter turnover is governed by accessibility not recalcitrance. Glob. Chang. Biol. 2012, 18, 1781–1796. [Google Scholar] [CrossRef]
  21. Coleman, K.; Jenkinson, D.; Crocker, G.; Grace, P.; Klir, J.; Korschens, M.; Poulton, P.; Richter, D. Simulating trends in soil organic carbon in long-term experiments using RothC-26.3. Geoderma 1997, 81, 29–44. [Google Scholar] [CrossRef]
  22. Plaza, C.; Gollany, H.T.; Baldoni, G.; Polo, A.; Ciavatta, C. Predicting long-term organic carbon dynamics in organically amended soils using the CQESTR model. J. Soils Sediments 2012, 12, 486–493. [Google Scholar] [CrossRef]
  23. Guo, S.; Wu, j.; Dang, T. Effects of crop rotation and fertilization on aboveground biomass and soil organic C in semi-arid region (in Chinese with English abstract). Sci. Agric. Sin. 2008, 41, 744–751. [Google Scholar]
  24. Xin, X.L.; Zhang, J.B.; Yin, S.W.; Zhu, A.N. Fertility evolution and fertilization technology of alluvial fluvo-aquic soils under long-term fertilization (in Chinese). In Evolution of Soil Fertility in China; Xu, M., Zhang, W., Huang, S., Eds.; China Agricultural Science and Technology Press: Beijing, China, 2015. [Google Scholar]
  25. Wang, G.; Huang, Y.; Wang, E.; Yu, Y.; Zhang, W. Modeling soil organic carbon change across Australian wheat growing areas, 1960–2010. PLoS ONE 2013, 8, e63324. [Google Scholar] [CrossRef]
  26. Hao, X.Y.; Zhou, B.K.; Ma, X.Z.; Gao, Z.C.; Zhang, X.L. Fertility evolution and fertilization technology of thick balck soils under long-term fertilization (in Chinese). In Evolution of Soil Fertility in China; Xu, M., Zhang, W., Huang, S., Eds.; China Agricultural Science and Technology Press: Beijing, China, 2015; pp. 67–100. [Google Scholar]
  27. Monreal, C.; Janzen, H. Soil organic-carbon dynamics after 80 years of cropping a Dark Brown Chernozem. Can. J. Soil Sci. 1993, 73, 133–136. [Google Scholar] [CrossRef]
  28. Bhattacharyya, T.; Pal, D.; Easter, M.; Williams, S.; Paustian, K.; Milne, E.; Chandran, P.; Ray, S.; Mandal, C.; Coleman, K. Evaluating the Century C model using long-term fertilizer trials in the Indo-Gangetic Plains, India. Agric. Ecosyst. Environ. 2007, 122, 73–83. [Google Scholar] [CrossRef]
  29. Whitmore, A.; Klein-Gunnewiek, H.; Crocker, G.; Klír, J.; Körschens, M.; Poulton, P. Simulating trends in soil organic carbon in long-term experiments using the Verbeme/MOTOR model. Geoderma 1997, 81, 137–151. [Google Scholar] [CrossRef]
  30. Fan, H.Z.; Feng, W.Q.; Qin, Y.S.; Chen, Q.; Tu, S.H.; Sun, X.F. Fertility evolution and fertilization technology of calcium purple soils under long-term fertilization (in Chinese). In Evolution of Soil Fertility in China; Xu, M., Zhang, W., Huang, S., Eds.; China Agricultural Science and Technology Press: Beijing, China, 2015. [Google Scholar]
  31. Karhu, K.; Gärdenäs, A.I.; Heikkinen, J.; Vanhala, P.; Tuomi, M.; Liski, J. Impacts of organic amendments on carbon stocks of an agricultural soil—comparison of model-simulations to measurements. Geoderma 2012, 189, 606–616. [Google Scholar] [CrossRef]
  32. Liu, Y.; Wang, X.H.; Wang, B.; Lin, Y.H.; Zhang, H.M.; Xie, L.J. Fertility evolution and fertilization technical model of grey desert soils under long-term fertilization (in Chinese). In Evolution of Soil Fertility in China; Xu, M., Zhang, W., Huang, S., Eds.; China Agricultural Science and Technology Press: Beijing, China, 2015; pp. 563–614. [Google Scholar]
  33. Sun, B.H.; Yang, X.Y.; Zhang, S.L. Fertility evolution and fertilization technology of cinnamon soils under long-term fertilization (in Chinese). In Evolution of Soil Fertility in China; Xu, M., Zhang, W., Huang, S., Eds.; China Agricultural Science and Technology Press: Beijing, China, 2015; pp. 434–473. [Google Scholar]
  34. Zhang, W.J.; Wang, X.J.; Xu, M.G.; Huang, S.M.; Liu, H.; Peng, C. Soil organic carbon dynamics under long-term fertilizations in arable land of northern China. Biogeosciences 2010, 7, 409–425. [Google Scholar] [CrossRef] [Green Version]
  35. Jobbagy, E.G.; Jackson, R.B. The vertical distribution of soil organic carbon and its relation to climate and vegetation. Ecol. Appl. 2000, 10, 423–436. [Google Scholar] [CrossRef]
  36. Huang, Y.; Zhang, W.; Sun, W.J.; Zheng, X.H. Net primary production of Chinese croplands from 1950 to 1999. Ecol. Appl. 2007, 17, 692–701. [Google Scholar] [CrossRef] [PubMed]
  37. Skjemstad, J.; Spouncer, L.; Cowie, B.; Swift, R. Calibration of the Rothamsted organic carbon turnover model (RothC ver. 26.3), using measurable soil organic carbon pools. Soil Res. 2004, 42, 79–88. [Google Scholar] [CrossRef]
  38. Tittonell, P.; Rufino, M.C.; Janssen, B.H.; Giller, K.E. Carbon and nutrient losses during manure storage under traditional and improved practices in smallholder crop-livestock systems—evidence from Kenya. Plant Soil 2010, 328, 253–269. [Google Scholar] [CrossRef] [Green Version]
  39. Bhattacharyya, T.; Pal, D.K.; Deshmukh, A.S.; Deshmukh, R.R.; Ray, S.K.; Chandran, P.; Mandal, C.; Telpande, B.; Nimje, A.M.; Tiwary, P. Evaluation of RothC model using four Long Term Fertilizer Experiments in black soils, India. Agric. Ecosyst. Environ. 2011, 144, 222–234. [Google Scholar] [CrossRef]
  40. Falloon, P.; Smith, P. Simulating SOC changes in long-term experiments with RothC and CENTURY: Model evaluation for a regional scale application. Soil Use Manag. 2002, 18, 101–111. [Google Scholar] [CrossRef]
  41. Smith, J.; Smith, P.; Wattenbach, M.; Zaehle, S.; Hiederer, R.; Jones, R.J.; Montanarella, L.; Rounsevell, M.D.; Reginster, I.; Ewert, F. Projected changes in mineral soil carbon of European croplands and grasslands, 1990–2080. Glob. Chang. Biol. 2005, 11, 2141–2152. [Google Scholar] [CrossRef]
  42. Luo, Z.; Wang, E.; Zheng, H.; Baldock, J.A.; Sun, O.J.; Shao, Q. Convergent modelling of past soil organic carbon stocks but divergent projections. Biogeosciences 2015, 12, 4373–4383. [Google Scholar] [CrossRef] [Green Version]
  43. Todd-Brown, K.E.O.; Randerson, J.T.; Hopkins, F.; Arora, V.; Hajima, T.; Jones, C.; Shevliakova, E.; Tjiputra, J.; Volodin, E.; Wu, T.; et al. Changes in soil organic carbon storage predicted by Earth system models during the 21st century. Biogeosciences 2014, 11, 2341–2356. [Google Scholar] [CrossRef] [Green Version]
  44. Nicholls, Z.R.J.; Meinshausen, M.; Lewis, J.; Gieseke, R.; Dommenget, D.; Dorheim, K.; Fan, C.S.; Fuglestvedt, J.S.; Gasser, T.; Golüke, U.; et al. Reduced Complexity Model Intercomparison Project Phase 1: Introduction and evaluation of global-mean temperature response. Geosci. Model Dev. 2020, 13, 5175–5190. [Google Scholar] [CrossRef]
  45. Canarini, A.; Wanek, W.; Watzka, M.; Sandén, T.; Spiegel, H.; Šantrůček, J.; Schnecker, J. Quantifying microbial growth and carbon use efficiency in dry soil environments via 18O water vapor equilibration. Glob. Chang. Biol. 2020, 26, 5333–5341. [Google Scholar] [CrossRef]
  46. Keiluweit, M.; Bougoure, J.J.; Nico, P.S.; Pett-Ridge, J.; Weber, P.K.; Kleber, M. Mineral protection of soil carbon counteracted by root exudates. Nat. Clim. Chang. 2015, 5, 588–595. [Google Scholar] [CrossRef]
  47. Heikkinen, J.; Kurganova, I.; de Gerenyu, V.L.; Palosuo, T.; Regina, K. Changes in soil carbon stock after cropland conversion to grassland in Russian temperate zone: Measurements versus model simulation. Nutr. Cycl. Agroecosyst. 2014, 98, 97–106. [Google Scholar] [CrossRef]
  48. Sierra, C.A.; Müller, M.; Trumbore, S.E. Models of soil organic matter decomposition: The SoilR package, version 1.0. Geosci. Model Dev. 2012, 5, 1045–1060. [Google Scholar] [CrossRef] [Green Version]
  49. R Development Core Team R: A Language and Environment for Statistical Computing; R Foundation for Statistical Computing: Vienna, Austria, 2021.
  50. Luo, Z.; Wang, E.; Sun, O. Uncertain future soil carbon dynamics under global change predicted by models constrained by total carbon measurements. Ecol. Appl. 2017, 27, 1001–1009. [Google Scholar] [CrossRef]
  51. Blagodatskaya, Е.; Kuzyakov, Y. Mechanisms of real and apparent priming effects and their dependence on soil microbial biomass and community structure: Critical review. Biol. Fertil. Soils 2008, 45, 115–131. [Google Scholar] [CrossRef]
  52. Cagnarini, C.; Renella, G.; Mayer, J.; Hirte, J.; Schulin, R.; Costerousse, B.; Della Marta, A.; Orlandini, S.; Menichetti, L. Multi-objective calibration of RothC using measured carbon stocks and auxiliary data of a long-term experiment in Switzerland. Eur. J. Soil Sci. 2019, 70, 819–832. [Google Scholar] [CrossRef]
  53. Spohn, M.; Pötsch, E.M.; Eichorst, S.A.; Woebken, D.; Wanek, W.; Richter, A. Soil microbial carbon use efficiency and biomass turnover in a long-term fertilization experiment in a temperate grassland. Soil Biol. Biochem. 2016, 97, 168–175. [Google Scholar] [CrossRef]
  54. Sanderman, J.; Baisden, W.T.; Fallon, S. Redefining the inert organic carbon pool. Soil Biol. Biochem. 2016, 92, 149–152. [Google Scholar] [CrossRef]
  55. Keel, S.G.; Anken, T.; Büchi, L.; Chervet, A.; Fliessbach, A.; Flisch, R.; Huguenin-Elie, O.; Mäder, P.; Mayer, J.; Sinaj, S.; et al. Loss of soil organic carbon in Swiss long-term agricultural experiments over a wide range of management practices. Agric. Ecosyst. Environ. 2019, 286, 106654. [Google Scholar] [CrossRef] [Green Version]
  56. Wang, G.; Huang, Y.; Zhang, W.; Yu, Y.; Sun, W. Quantifying carbon input for targeted soil organic carbon sequestration in China’s croplands. Plant Soil 2015, 394, 57–71. [Google Scholar] [CrossRef]
  57. Wang, G.; Luo, Z.; Han, P.; Chen, H.; Xu, J. Critical carbon input to maintain current soil organic carbon stocks in global wheat systems. Sci. Rep. 2016, 6, 19327. [Google Scholar] [CrossRef] [PubMed] [Green Version]
  58. Moyano, F.E.; Vasilyeva, N.; Menichetti, L. Diffusion limitations and Michaelis–Menten kinetics as drivers of combined temperature and moisture effects on carbon fluxes of mineral soils. Biogeosciences 2018, 15, 5031–5045. [Google Scholar] [CrossRef] [Green Version]
  59. Manzoni, S.; Moyano, F.; Kätterer, T.; Schimel, J. Modeling coupled enzymatic and solute transport controls on decomposition in drying soils. Soil Biol. Biochem. 2016, 95, 275–287. [Google Scholar] [CrossRef] [Green Version]
  60. Marschmann, G.L.; Pagel, H.; Kügler, P.; Streck, T. Equifinality, sloppiness, and emergent structures of mechanistic soil biogeochemical models. Environ. Model. Softw. 2019, 122, 104518. [Google Scholar] [CrossRef]
  61. Sulman, B.N.; Moore, J.A.M.; Abramoff, R.; Averill, C.; Kivlin, S.; Georgiou, K.; Sridhar, B.; Hartman, M.D.; Wang, G.; Wieder, W.R.; et al. Multiple models and experiments underscore large uncertainty in soil carbon dynamics. Biogeochemistry 2018, 141, 109–123. [Google Scholar] [CrossRef] [Green Version]
  62. Sierra, C.A.; Malghani, S.; Müller, M. Model structure and parameter identification of soil organic matter models. Soil Biol. Biochem. 2015, 90, 197–203. [Google Scholar] [CrossRef]
  63. Dormann, C.F.; Elith, J.; Bacher, S.; Buchmann, C.; Carl, G.; Carré, G.; Marquéz, J.R.G.; Gruber, B.; Lafourcade, B.; Leitão, P.J.; et al. Collinearity: A review of methods to deal with it and a simulation study evaluating their performance. Ecography 2013, 36, 27–46. [Google Scholar] [CrossRef]
Figure 1. The location of field experiments at 15 sites across the globe.
Agronomy 11 02134 g001
Figure 2. Generalized sensitivity of soil C dynamic to model parameters in the RothC model. The climate and soil data from a long-term field experiment under continuous wheat cropping at Broadbalk, UK were used to perform the sensitivity analysis. CUE, microbial C use efficiency; khum, decomposition rate of humified organic carbon; finert, the fraction of inert organic C and physio-chemically protected soil organic carbon; frpm.hum, the proportion of initial resistant plant material (RPM) to humified organic matter (HUM); fbio, the initial fraction of microbial biomass (BIO) to total soil organic carbon; kbio, the decomposition rate of microbial biomass (BIO).
Agronomy 11 02134 g002
Figure 3. The performance of the RothC model. The site- and treatment-specific model parameters constrained against the observations were used. R2 is the coefficient of determination, p shows the associated significance level, and RMSE is the rooted mean squared error. Solid and dashed lines show the linear regression and 1:1 line, respectively. A dot with error bars shows the mean and standard deviations of data for a given site. BL: Bad Lauchstädt; BG: Bologna; CW: Changwu; FQ: Fengqiu; GB: Gibson; HR: Harbin; LB: Lethbridge; LH: Ludhiana; PG: Prague; SN: Suining; TL: Tarlee; UT: Ultuna; UQ: Urumqi; YL: Yangling; ZZ: Zhengzhou.
Agronomy 11 02134 g003
Figure 4. The temporal changes in soil organic C (SOC) simulated using the optimized best 100 combinations of model parameters. −OA: treatments without or with less organic amendment; +OA: treatments with or with more organic amendment. Dashed lines are the predicted temporal changes in SOC using the 100 optimized combinations of model parameters (see Model optimization section). Dots show the observations.
Agronomy 11 02134 g004
Figure 5. Distribution of CUE (a), khum (b), and finert (c) under two OA treatments. CUE, microbial C use efficiency; khum, the decomposition rate of humic organic carbon; and finert, the fraction of inert organic C that physically or chemically protected against decomposition. Boxplots show the median and interquartile range, with whiskers extending to the most extreme data point within 1.5 × (75–25%) data range. Lower-case letters under the boxplots show that the difference between the means of parameters under different treatments at each site is significant (ab) or is not significant (aa) at p < 0.05. −OA, without or with less organic amendment; +OA, with or with more organic amendment. See Table 1 for the site abbreviations.
Agronomy 11 02134 g005
Figure 6. Coefficients of the fitted linear mixed model for predictions of the constrained median CUE (a), khum (b), and finert (c). Intercept, the intercept of the linear mixed regression model; pH, soil pH; Clay, soil clay content; MAT, mean annual temperature; MAP, mean annual precipitation; Input C, the average annual C input rate. Error bars show the standard errors. R2 is the coefficient of determination and p shows the associated significance level.
Agronomy 11 02134 g006
Figure 7. Relative changes of SOC stock in the last year of simulation to that in the first year under +OA treatment predicted using parameters derived from the two OA treatments (i.e., −OA- and +OA-derived parameters, respectively). At each site, the only difference for the two simulations is the use of different parameter ensembles derived from the two OA treatments. Boxplots show the median and interquartile range of 100 simulations using the 100 optimized model parameter ensembles for each OA treatment, with whiskers extending to the most extreme data point within 1.5 × (75–25%) data range. −OA, without or with less organic amendment; +OA, with or with more organic amendment. See Table 1 for the site abbreviations.
Agronomy 11 02134 g007
Table 1. Summary of soil, climate, and experimental information at each study site.
SiteInitial Soil PropertiesClimatic AttributesTime SpanCarbon InputSource
SOC0pHClayMATMAP(Mg C ha−1 year−1)
(Mg ha−1) (%)(°C)(mm) −OA+OA
Bad Lauchstädt (BL)65.57.0219.04581906–19902.94.0[21]
Bologna (BG)23.76.92813.77521966–20010.81.7[22]
Changwu (CW)22.08.42411.45891984–20020.65.8[23]
Fengqiu (FQ)17.78.7913.56501990–20030.26.5[24]
Gibson (GB)33.15.6316.64671977–19940.5-[25]
Harbin (HR)51.37.2253.55331979–20020.81.5[26]
Lethbridge (LB)111.07.0105.33621910–19900.9 1.0[27]
Ludhiana (LH)18.77.61324.56951988–19991.66.4[28]
Prague (PG)43.26.2278.74771972–19921.42.4[29]
Suining (SN)31.68.62417.410141981–19981.04.0[30]
Tarlee (TL)39.98.51416.94641979–19960.60.7[25]
Ultuna (UT)55.86.6375.65191956–19910.52.5[31]
Urumqi (UQ)31.28.1217.73101990–20050.44.4[32]
Yangling (YL)21.48.61713.05751989–20030.82.7[33]
Zhengzhou (ZZ)21.38.31314.36321990–20050.53.6[34]
Note: The capital letters in brackets are abbreviations for the site names. SOC0 is the initial soil organic C density at the start of the experiment. MAT and MAP are the mean annual temperature and precipitation, respectively.
Table 2. ANOVA analysis of three optimized model parameters under different treatments at different sites.
ParametersSource of VariationSSdfMSF
CUESites (S)46.90(56%)143.350518.0 ***
Treatments (T)14.41(17%)72.059319.0 ***
S × T3.82(5%)70.54684.7 ***
Residuals18.5328710.006
khumSites (S)4.466(41%)140.3190312.4 ***
Treatments (T)1.319(12%)70.1885184.6 ***
S × T2.102(27%)70.3003294.2 ***
Residuals2.93128710.0010
finertSites (S)28.03(22%)142.002118.9 ***
Treatments (T)28.27(22%)74.038239.8 ***
S × T25.90(20%)73.700219.7 ***
Residuals48.3428710.017
Note: SS = sum of squares; df = degree of freedom; MS = mean square; F = the value of the Fisher statistic test, *** indicate p < 0.001. Percentage values in the parenthesis show the proportion of variance explained by the corresponding variation source.
Publisher’s Note: MDPI stays neutral with regard to jurisdictional claims in published maps and institutional affiliations.

