Article

Effects of White LED Lighting with Specific Shorter Blue and/or Green Wavelength on the Growth and Quality of Two Lettuce Cultivars in a Vertical Farming System

1
Department of Horticultural Science, Gyeongsang National University, Jinju 52725, Korea
2
Department of Food Science, Gyeongsang National University, Jinju 52725, Korea
3
Lighting Marketing Group, Samsung Electronics, 1, Samsung-ro, Giheung-gu, Yongin-si 17113, Korea
4
Lighting/Automotive Development Group, Samsung Electronics, 1, Samsung-ro, Giheung-gu, Yongin-si 17113, Korea
*
Author to whom correspondence should be addressed.
These authors contributed equally to this work.
Agronomy 2021, 11(11), 2111; https://doi.org/10.3390/agronomy11112111
Submission received: 19 September 2021 / Revised: 15 October 2021 / Accepted: 18 October 2021 / Published: 21 October 2021

Abstract

:
White (W) light-emitting diode (LED) light has been used as an efficient light source for commercial plant cultivation in vertical farming. This study aimed to examine the effect of W LED light sources on the growth and quality of butterhead and romaine lettuce. Three W LED light sources including normal W light (NWL) which has 450 nm as its pumping wavelength and two specific W lights (SWL1 and SWL2) with shorter blue peak wavelength (437 nm) were used to grow lettuce in comparison to a red (R) and blue (B) LED combination. As a result, SWL1 and SWL2 treatments with the same electrical power or photosynthetic photon flux density (PPFD) resulted in more growth of both lettuce cultivars compared to RB treatment. Some phenolic and flavonol contents were increased in the RB treatment, whereas SWL2 treatment stimulated the accumulation of other phenolic and flavonol compounds. Meanwhile, neither NWL nor SWL1 treatments increased the individual phenolic and flavonol contents in either cultivar (except for some flavonols in romaine lettuce in the SWL1 group). In addition, light and energy use efficiencies were also highest in the SWL1 and SWL2 treatments. These results illustrate the positive effects of specific W LED light on lettuce growth and quality, and suggest that the specific W LED light sources, especially SWL2, could be preferably used in vertical farming.

1. Introduction

Modern agriculture is facing shortages in resources, such as land area, irrigation water, fertilizers, etc. Moreover, crops and vegetables are traditionally grown in soil-based wild areas or open field systems, and in most regions, it is impossible to grow most crops stably year-round with high quality because of seasonality, environmental extremes, and soil-borne diseases. This results in the unsustainability of current agriculture systems and unstable prices of vegetables in the market. Modern and commercial greenhouses possess many advantages over traditional outdoor farming, providing the control of environmental parameters (temperature, light, humidity, etc.), highly efficient resource utilization (water, fertilizer, etc.), and the application of high-technology systems (hydroponics, automation, IoT, etc.) for cultivating leafy and fruiting vegetables [1]. As a recent development in controlled environment systems, vertical farming systems inherits advanced greenhouse technologies for growing vegetables and valuable plants in fully controlled environmental conditions and in multiple shelf layers to increase crop yield per unit area. These systems enable the stable year-round production of high-quality plants with less resource consumption [2]. Plants grown in vertical farming systems are surrounded by walls and receive no sunlight; therefore, artificial lamps provide the only light source. However, conventional light sources have drawbacks to their use, causing excessive heat on leaf surfaces and leading to undesirable effects on plant growth [3]. Thus, there is a need for the development of innovative artificial lighting for optimizing the light environment. Light-emitting diodes (LEDs) have seen great development with many technological advancements and have incomparable advantages, and their application to lighting in plant cultivation has increased rapidly [4]. The price of LEDs has decreased remarkably over the past several years, and many studies have been concentrated on defining the optimal light environments to enable the high-quality, high-speed production of various plant species [5]. This makes LED lighting systems a cost-effective solution for controlled environment agriculture systems.
Natural sunlight contains a wide continuum of wavelength and fluence and is optimal for plants [6]. Therefore, manipulating the light conditions of artificial light sources is essential for growing plants in vertical farming to obtain electricity cost savings and balance the yield and quality of plants [7]. It is well documented that the various regions of light spectra have different efficiencies in enhancing the plant photosynthetic process and plant morphological, physiological, and biochemical responses [8]. Within the visible light spectral range (400–700 nm), many researchers have focused on studying the role of red (R) (600–700 nm) and blue (B) (400–500 nm) light and on defining their optimal combination ratios because their wavelengths are close to the absorbance of photosynthetic pigments that effectively drive photosynthesis [9]. Many studies have confirmed the role of R LEDs in increased biomass accumulation, stem elongation, and leaf expansion, as well as the effect of B LEDs in chlorophyll production, stomata opening, and photosynthesis [10,11,12,13,14]. Therefore, monochromatic R or B LEDs and combined RB LEDs have been widely used in scientific research and commercial vertical farming [15]. However, plants exposed to combination R and B lights normally appear purplish-grey to the human eye, which leads to difficulties in the visual assessment of plant health (e.g., disease symptoms, nutritional deficiencies, and physiological disorders) [16]. The addition of green (G) (500–600 nm) light is considered a possible solution to this limitation. It is reported that G light has little impact on plant photosynthesis and photomorphogenesis, but it has a greater ability to penetrate the folded layers of leaves and the lower canopy, which can increase photosynthesis in the lower parts of leaves as well as carbon assimilation [17]. However, supplementary G LED light is not widely applied in practical plant cultivation due to the inefficiency in converting electricity into photons. Hence, another strategy is the application of white (W) light that contains G light.
Advanced LED technology enables broad-spectrum W LED light that consists of R, G, and B lights. This could be effective for use in vertical farming to improve plant growth and provide desirable lighting for human vision. Several approaches have been used to achieve W LED light. The most common and successful approach is the use of a B LED chip with phosphors to convert a part of the B light to R and G lights. The B light from the LED chip and the R and G lights converted by phosphors create W light, leading to the steady increase in the efficiency of B LEDs and consequently improving the W LED efficiency [18]. W LED light can also be created by combining several LED chips that emit monochromatic R, B, and G lights [19], enabling control of the ratios of R, B, and G lights desirable for human vision and plant growth responses. This approach has become feasible with the highly efficient use of B and G LEDs and possesses high reliability and durability as well as low energy consumption [20]. The impacts of W LED light have been pronounced, with mixed results [21,22]. In addition, the plant growth responses also vary according to different W LED light sources [23]. Lettuce has been widely cultivated in controlled environment systems for commercial production, and many studies have focused on evaluating the influence of light quality with broad and narrow wavelengths on lettuce growth and nutritional quality. The significant effects of R, B, and G lights on lettuce have been pronounced in previous studies [10,24]. W LED light has also been reported to increase growth and the content of phenolic compounds in lettuce [25,26]. In this study, we applied various W LED light sources, referred to as normal W LED light (NWL) and newly developed specific W LED light (SWL), to grow lettuce and compared the results to those obtained growing lettuce under combined RB LEDs. Our purpose was to investigate the effects of these W LED light sources on lettuce growth and quality production.

2. Materials and Methods

2.1. Plant Materials and Growth Condition

The experiment was conducted at Gyeongsang National University. Butterhead lettuce ‘Asia Butter Head’ and romaine lettuce ‘Asia Heuk Romaine’ seeds (Asia Seed, Seoul, Korea) were sown in growing media (Terra Plug; Smithers-Oasis, Kent, OH, USA) and placed in a cultivation room under cultivation conditions at 25 °C, W LEDs, 150 ± 5 µmol m2 s1 photosynthetic photon flux density (PPFD), and 12 h photoperiod for 11 days. After 11 days of sowing, the seedlings were transplanted into a deep flow technique with a plastic container (12 plants of each cultivar per container; container dimensions 52 cm × 37 cm × 9 cm, L × W × H; two containers used for growing each cultivar in each treatment) and grown in a vertical farming system (Smart Farm Cube, Dream PF, Jinju, Korea) equipped with four LED light sources. The growing conditions were maintained at 20 ± 3.0 °C air temperature and 80 ± 2% relative humidity. Hoagland nutrient solution (pH 6.0, EC 1.25 dS m−1) was used for growing lettuce and was periodically replaced during the cultivation period.

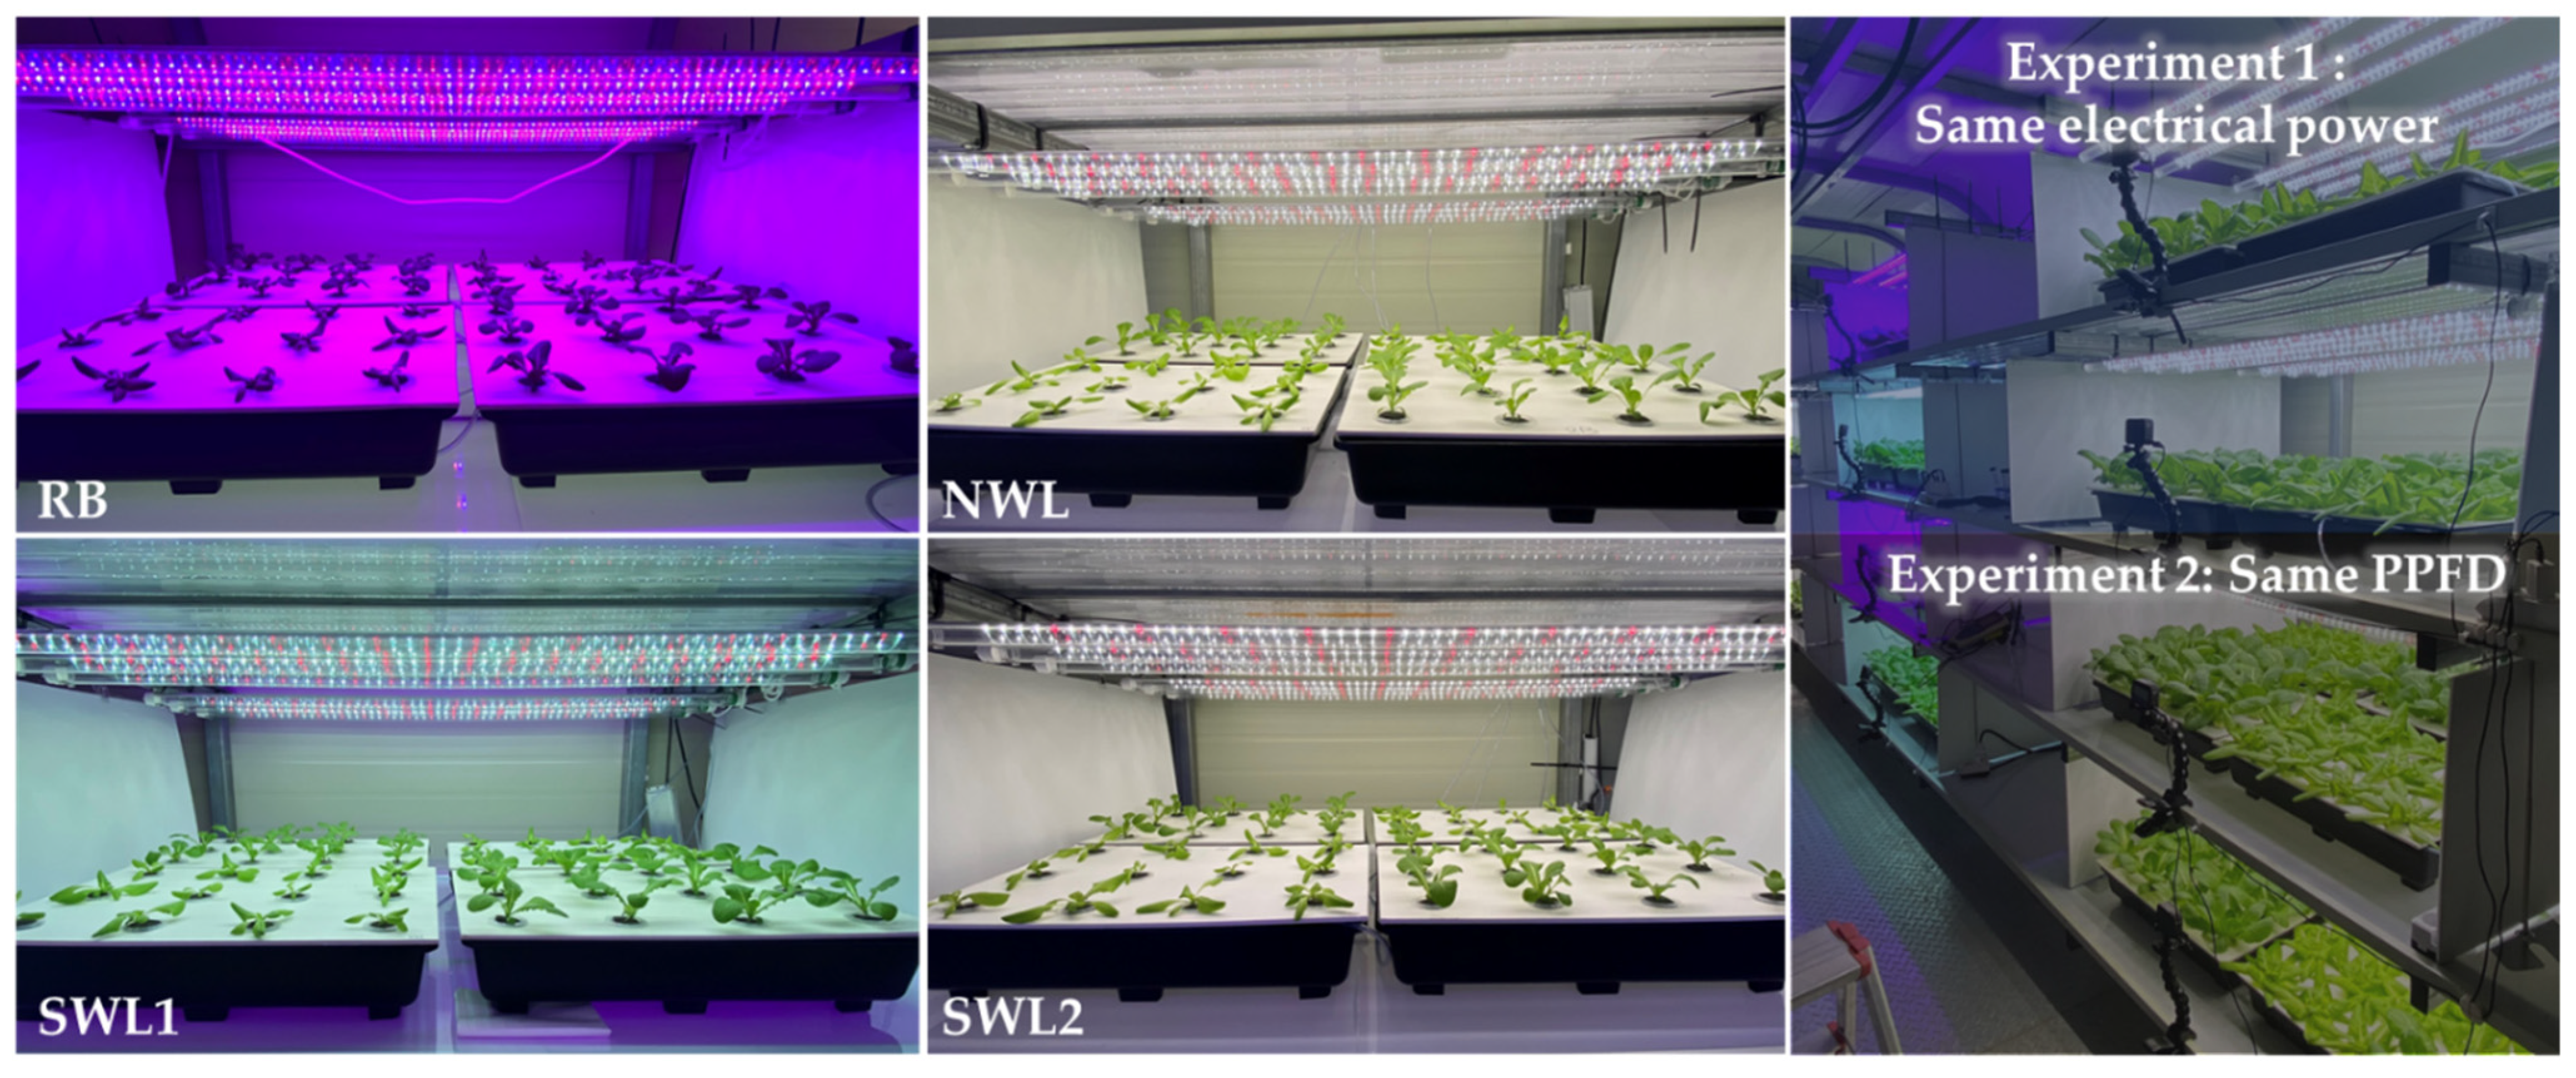
2.2. Light Treatments

To evaluate the effect of the newly developed specific W LEDs, four different LED light sources were applied: combined RB LEDs (Wooree E&L, Ansan, Korea) were used as the control and three W LEDs lights (NWL, model LM301D; SWL1, model LM301H EVO Mint; SWL2, model LM301H EVO; Samsung LED, Samsung, Seoul, Korea) were used as the treatment sources. The spectral distribution was measured on a horizontal plane at a vertical distance from the light source of 25 cm at five positions (center and four corners of the tray) using a spectroradiometer (LI-180; Li-Cor, Lincoln, NE, USA) (Table 1, Figure 1). A switched-mode power supply was used to control the electrical power, current, and thus PPFD, of light sources. We conducted two experiments related to the electrical power and PPFD of different light sources, in which the same electrical power was set at 80 W for all light sources in experiment 1, while the same PPFD of 147.50 ± 2.89 µmol m−2 s−1 was maintained in all treatments in experiment 2 (Table 2, Figure 1).

2.3. Growth Characteristics

After 4 weeks of treatment, plants were harvested, and the growth characteristics were measured, including fresh and dry weights of shoot and root, leaf number, and leaf area. The fresh weights of shoots and roots were measured using an electronic scale (PAG214C; Ohaus Corp, Parsippany, NJ, USA) and were then dried in an oven (WOF-155; Daihan, Wonju, Korea) at 70 °C for 3 days to weigh dry mass. Leaf area was measured using ImageJ software. The specific leaf weight was expressed as shoot dry weight per leaf area.

2.4. Absorbance and Transmittance

Leaf transmittance was measured using an LI-180 spectrometer (Li-Cor). After 4 weeks of treatment, the leaf transmittance at each LED treatment was obtained by scanning the light spectrum from 300 to 800 nm at an interval of 1 cm below a fully expanded leaf. The transmittance was recorded with spectrometer operating software. The absorbance was calculated as 100 − transmittance (%).

2.5. Individual Phenolic Acid and Flavonol Analysis

The contents of individual phenolic acids were analyzed by reverse-phase HPLC (Perkin-Elmer 200 series, Perkin-Elmer Corp., Norwalk, CT, USA) equipped with an XTerra™ RP C8 column (4.6 mm × 250 mm, 5 μm, Waters Corp., Milford, MA, USA). Solvent A was aqueous 0.5% glacial acetic acid, and solvent B was 100% methanol. A gradient of 60–100% of solvent A was linear for 40 min, and the flow rate was 1 mL min−1 at 30 °C. Twenty microliters of sample was injected into the column, and the absorbance of individual phenolic acids was measured at 280 nm. The standard stock solutions of each phenolic acid were used to quantify the content of each compound.
The individual flavonol contents were analyzed by reverse-phase HPLC with a TSKgel ODS-100Z column (4.6 mm × 250 mm, 5 μm, Tosoh Corp., Tokyo, Japan). Solvent A was aqueous 10 mM KH2PO4 (pH 2.5), and solvent B was 100% methanol. A linear gradient of 60–100% of solvent A was performed for 15 min using (solution A) with a flow rate of 1 mL min−1 at 30 °C. Twenty microliters of sample was injected into the column, and the absorbance of flavonols was recorded at 270 nm. The flavonol stock solutions were used as the standards for quantifying the content of each flavonol.

2.6. Light and Energy Use Efficiency

Light use efficiency (LUE) was expressed as shoot fresh weight per unit PPFD (g FW PPFD−1), while energy use efficiency (EUE) was expressed as shoot fresh weight per electricity consumption (g FW W−1). The relative levels of these parameters were expressed as the percentages of the values in the RB treatment.

2.7. Statistical Analysis

The experiments were repeated twice, and all the recorded measurements and analyses were obtained from four harvested plants (n = 4). Statistical analysis was performed using SAS 9.2 program (SAS Institute Inc., Cary, NC, USA) with analysis of variance, and Duncan’s multiple range test was used to determine the significant differences in all treatments, verified at p < 0.05.

3. Results

3.1. Experiment 1

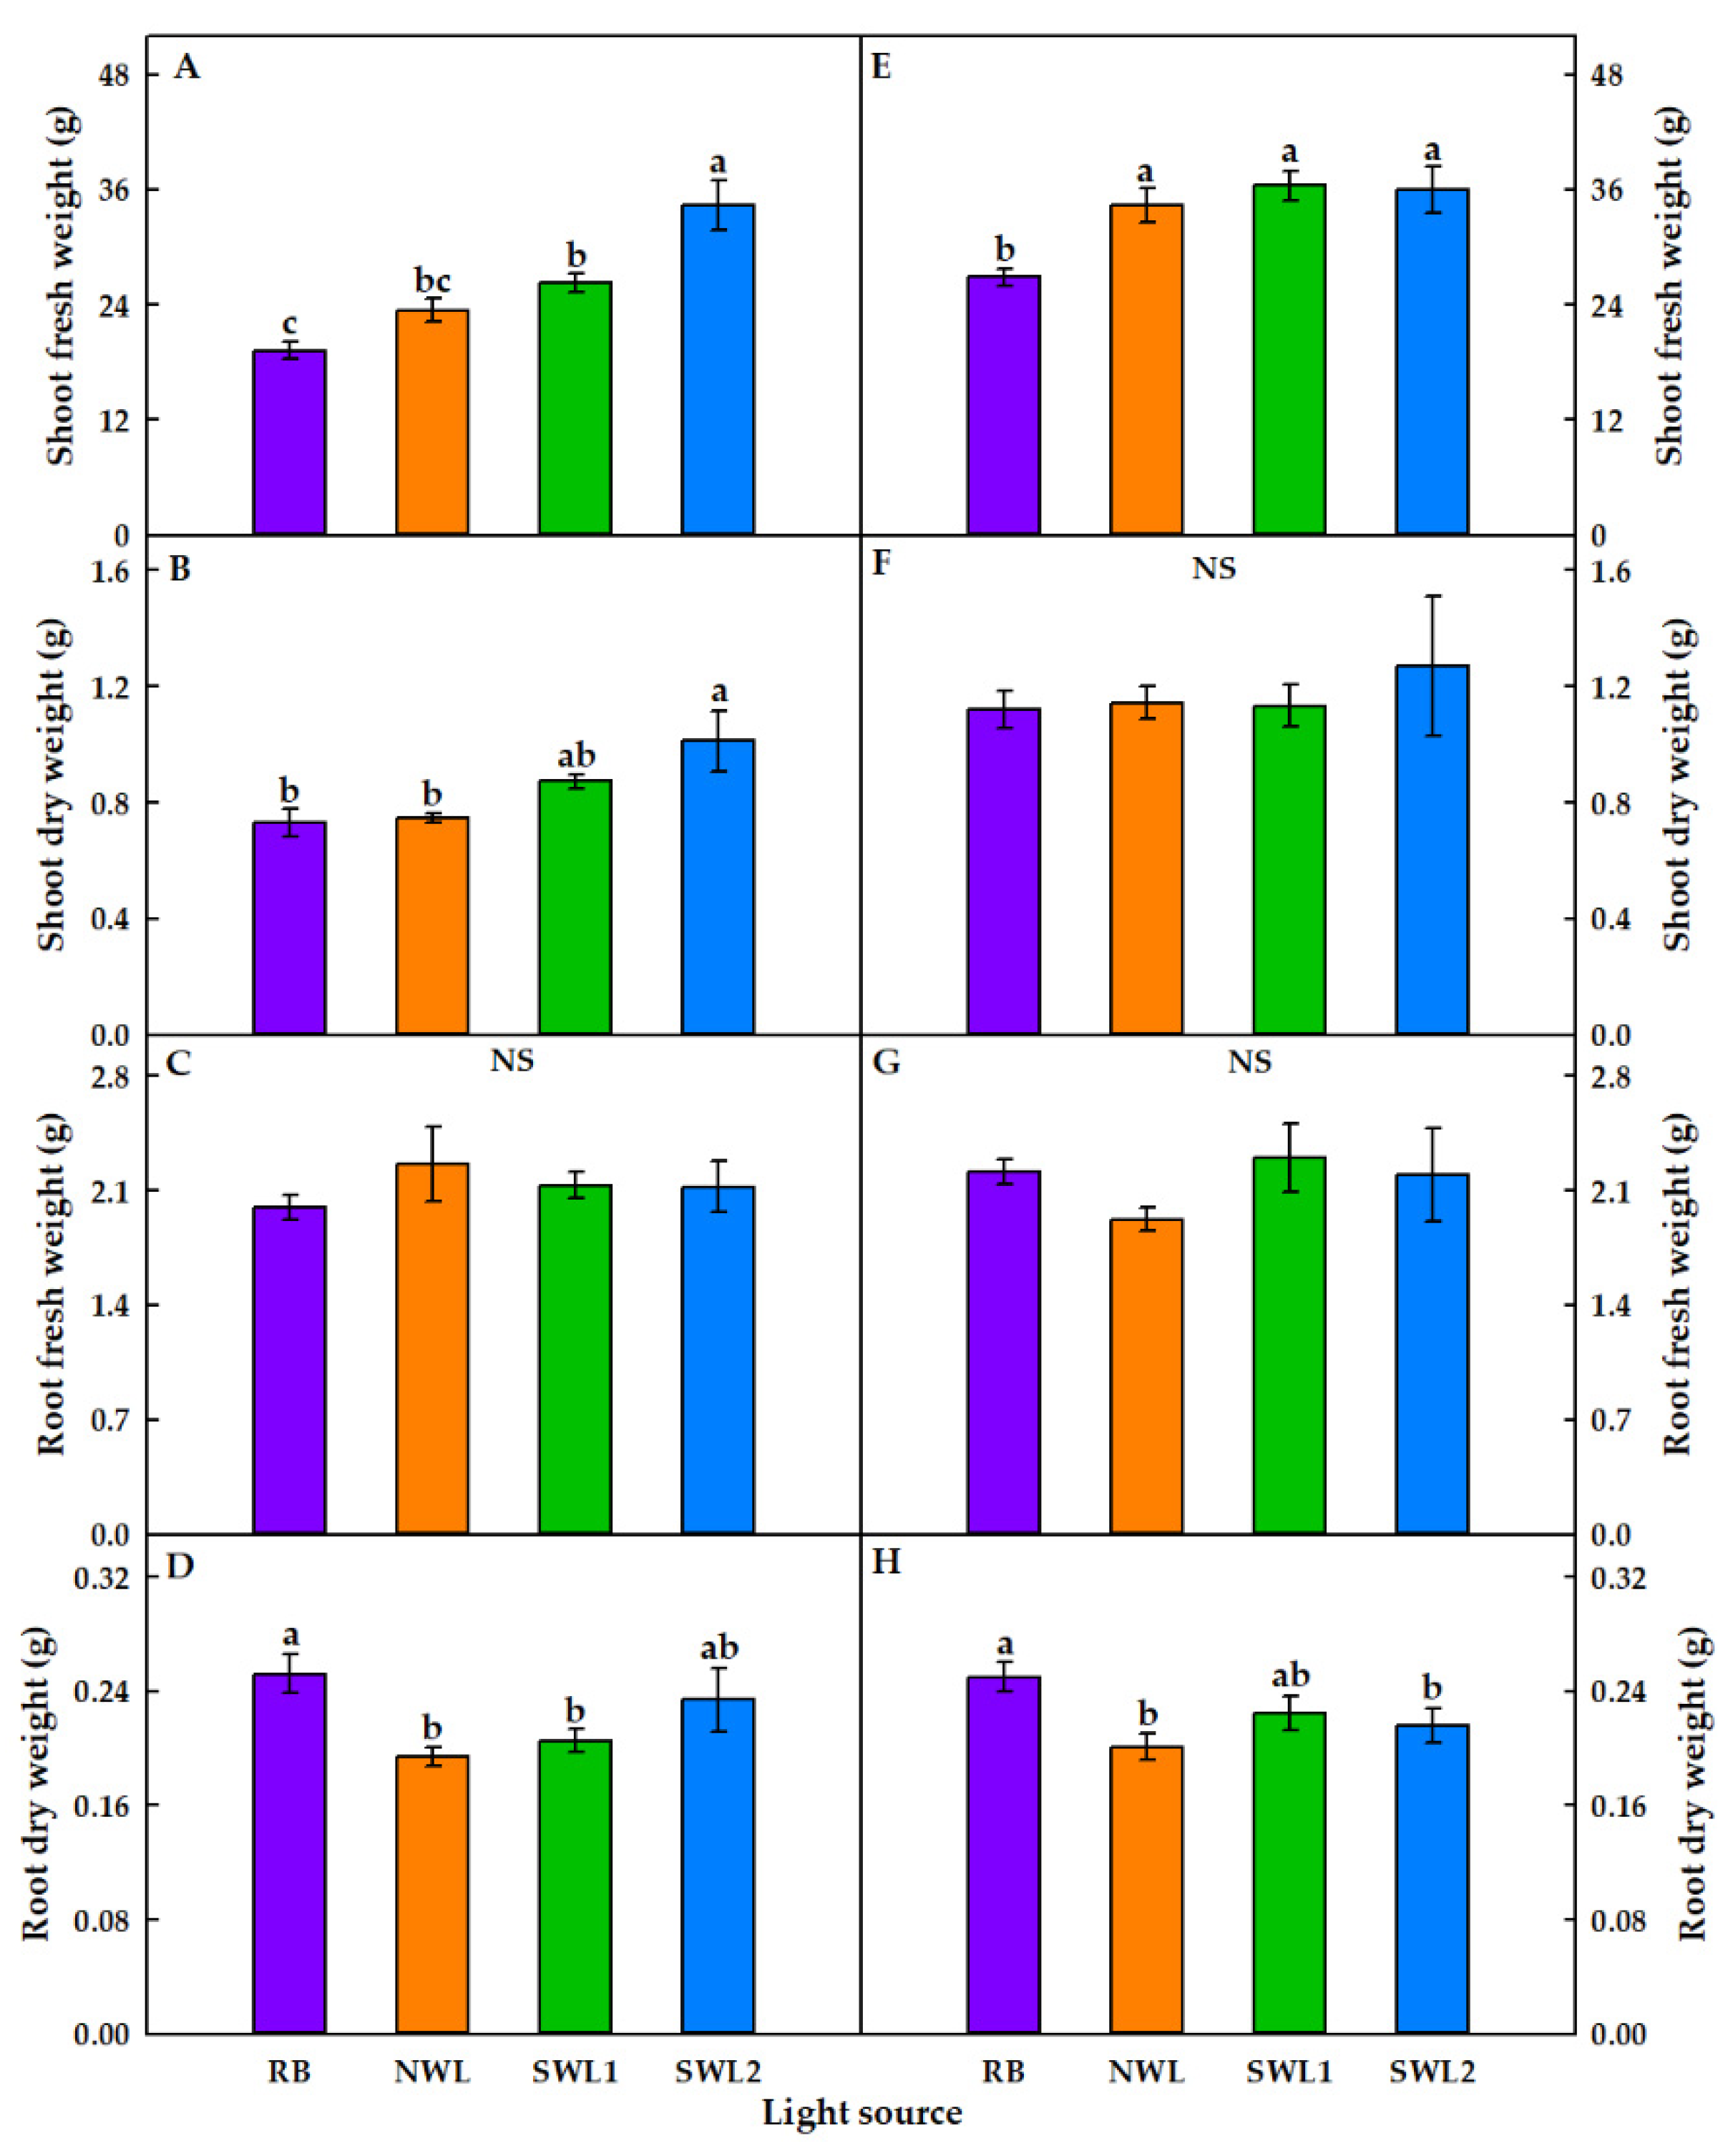
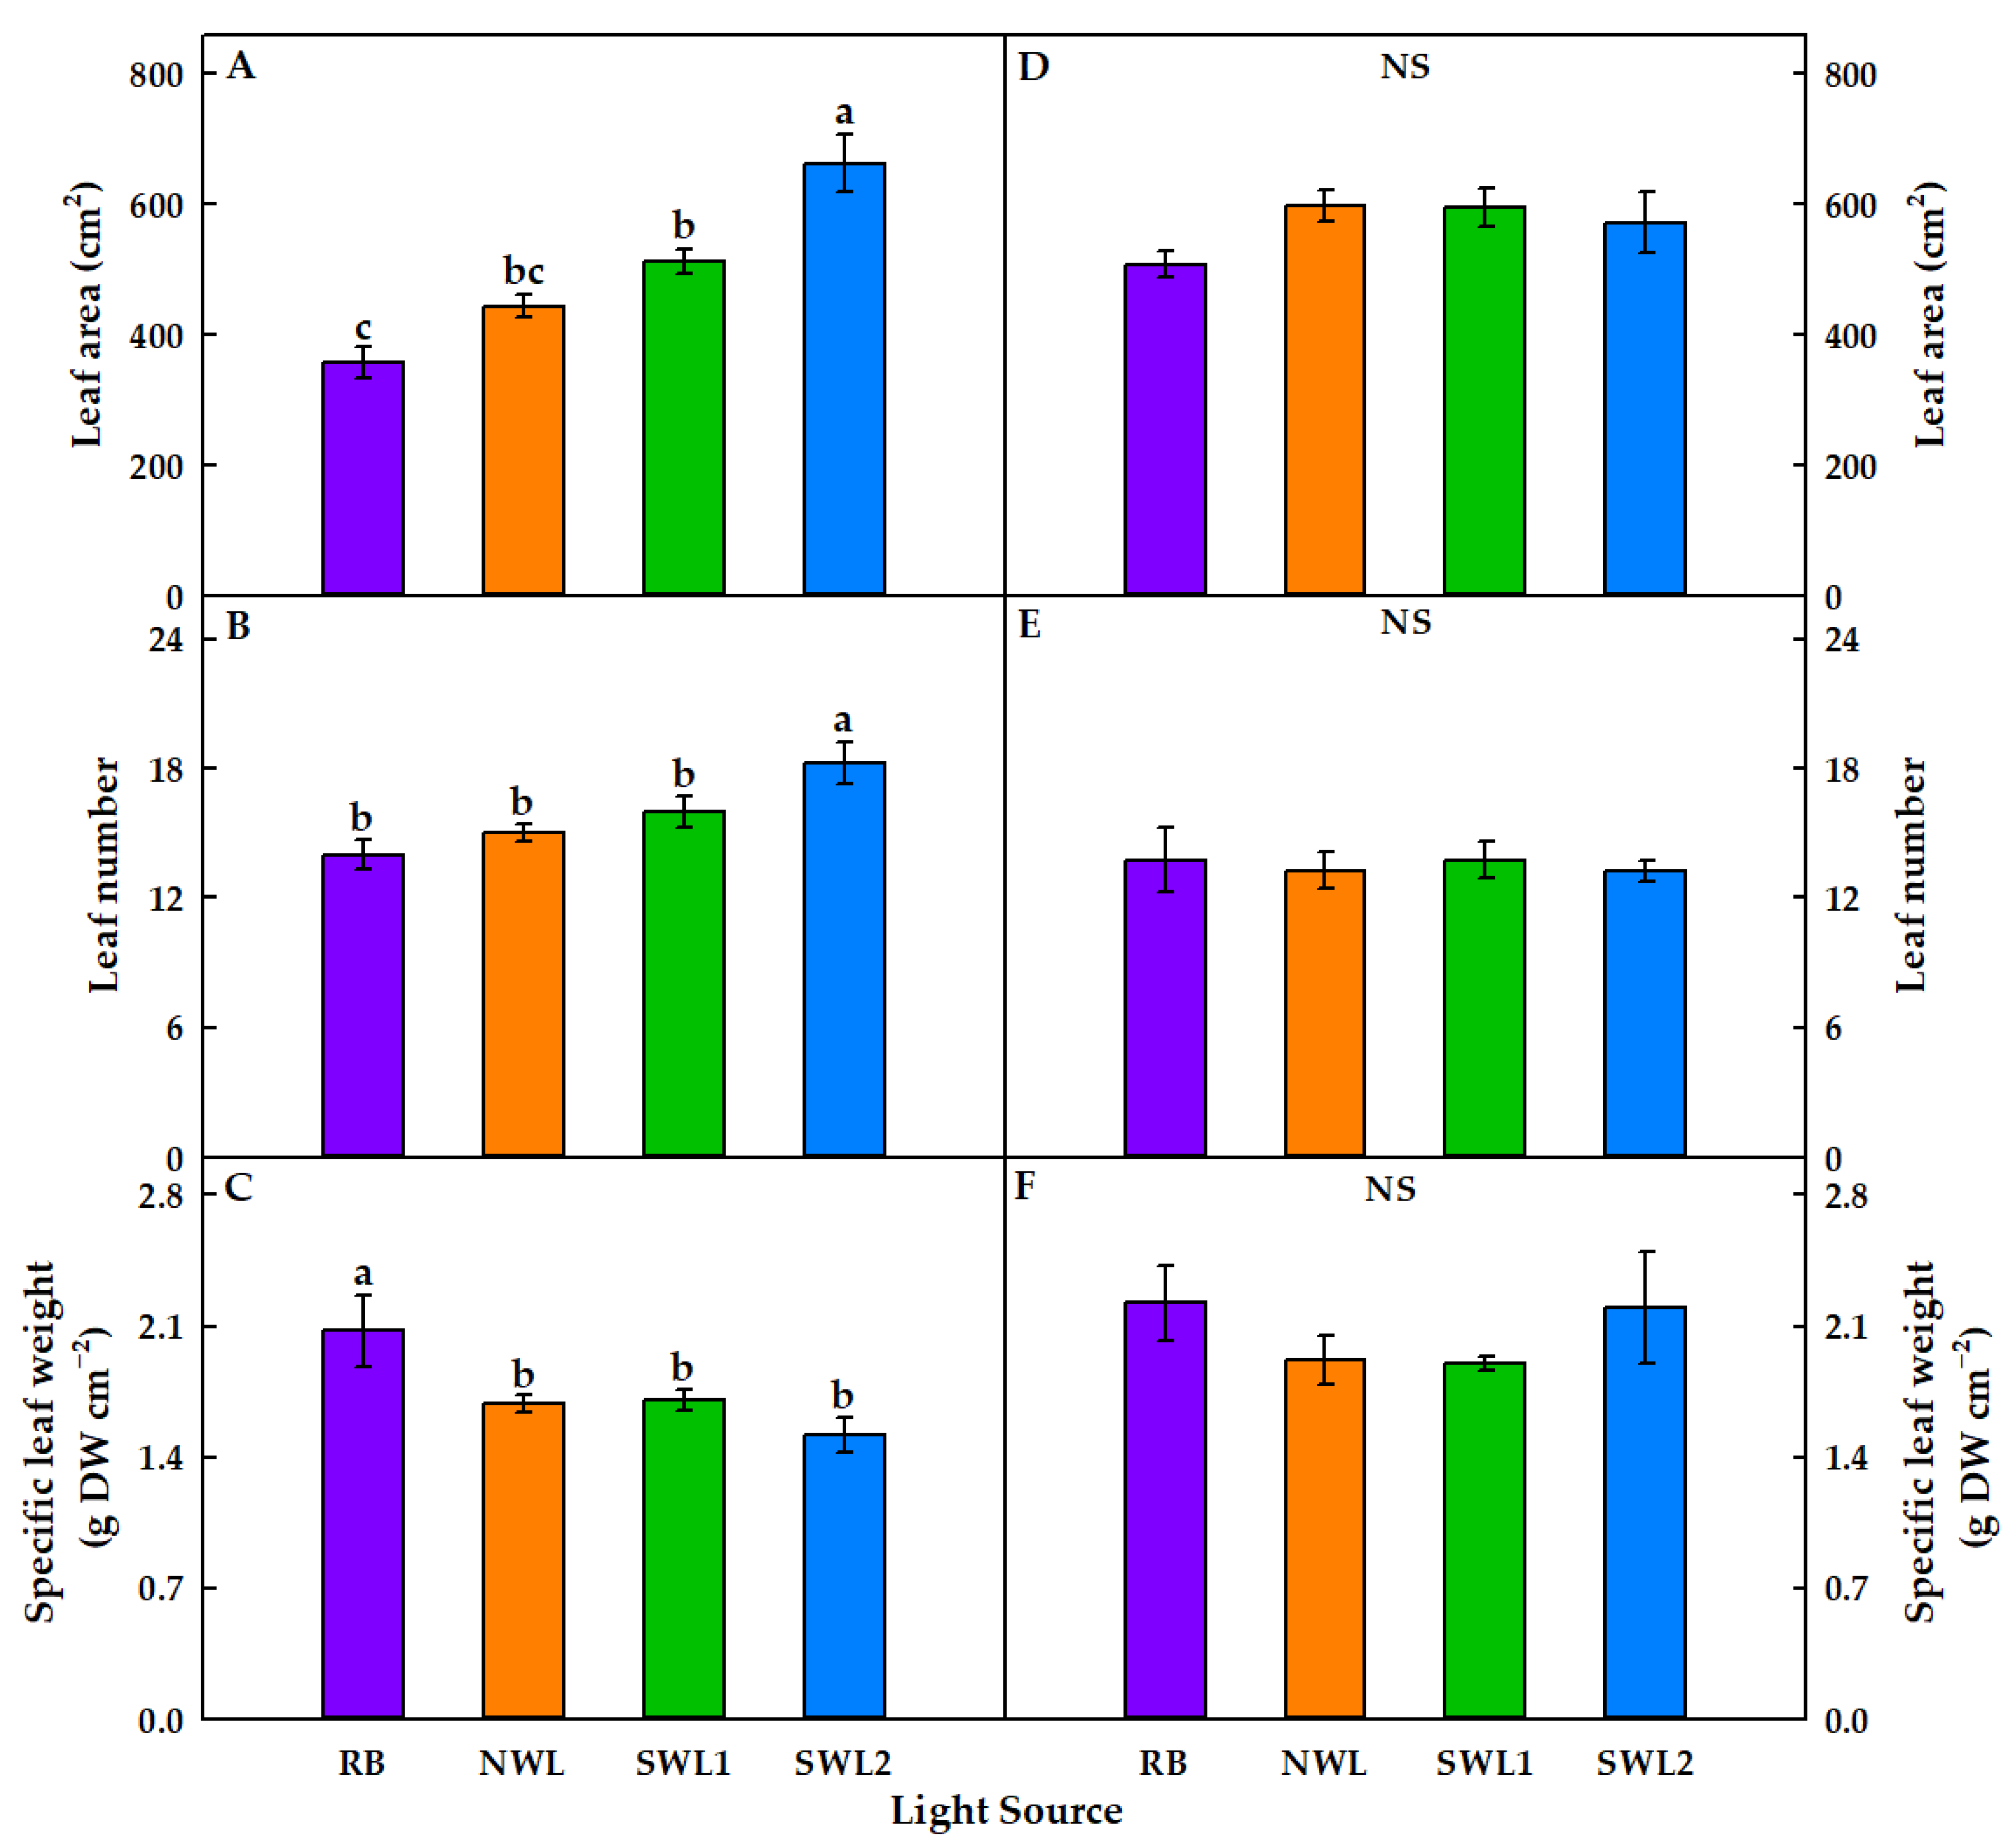
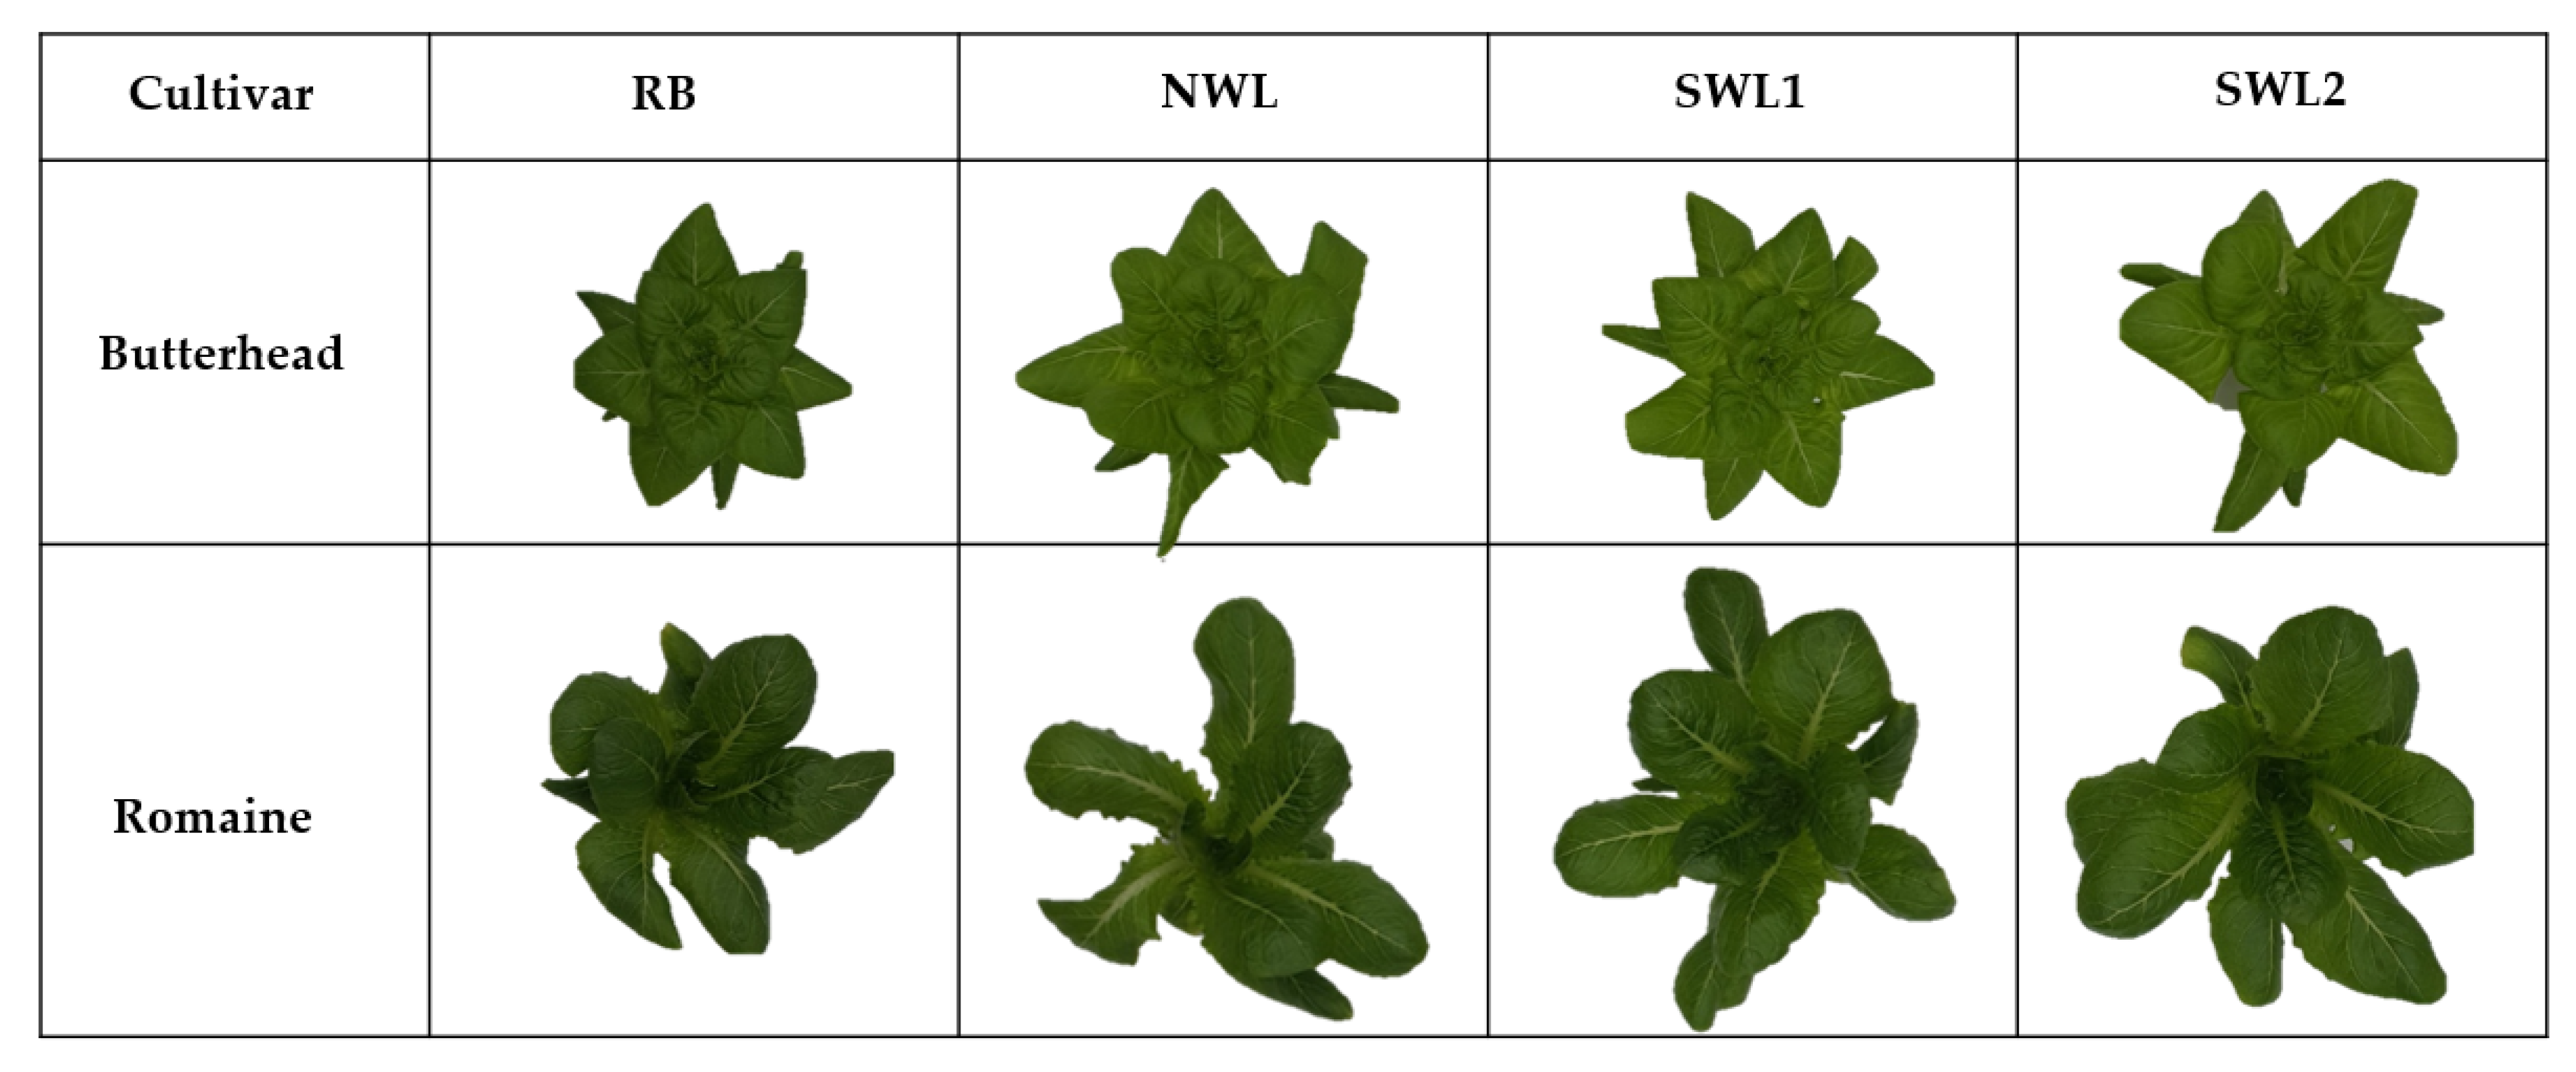
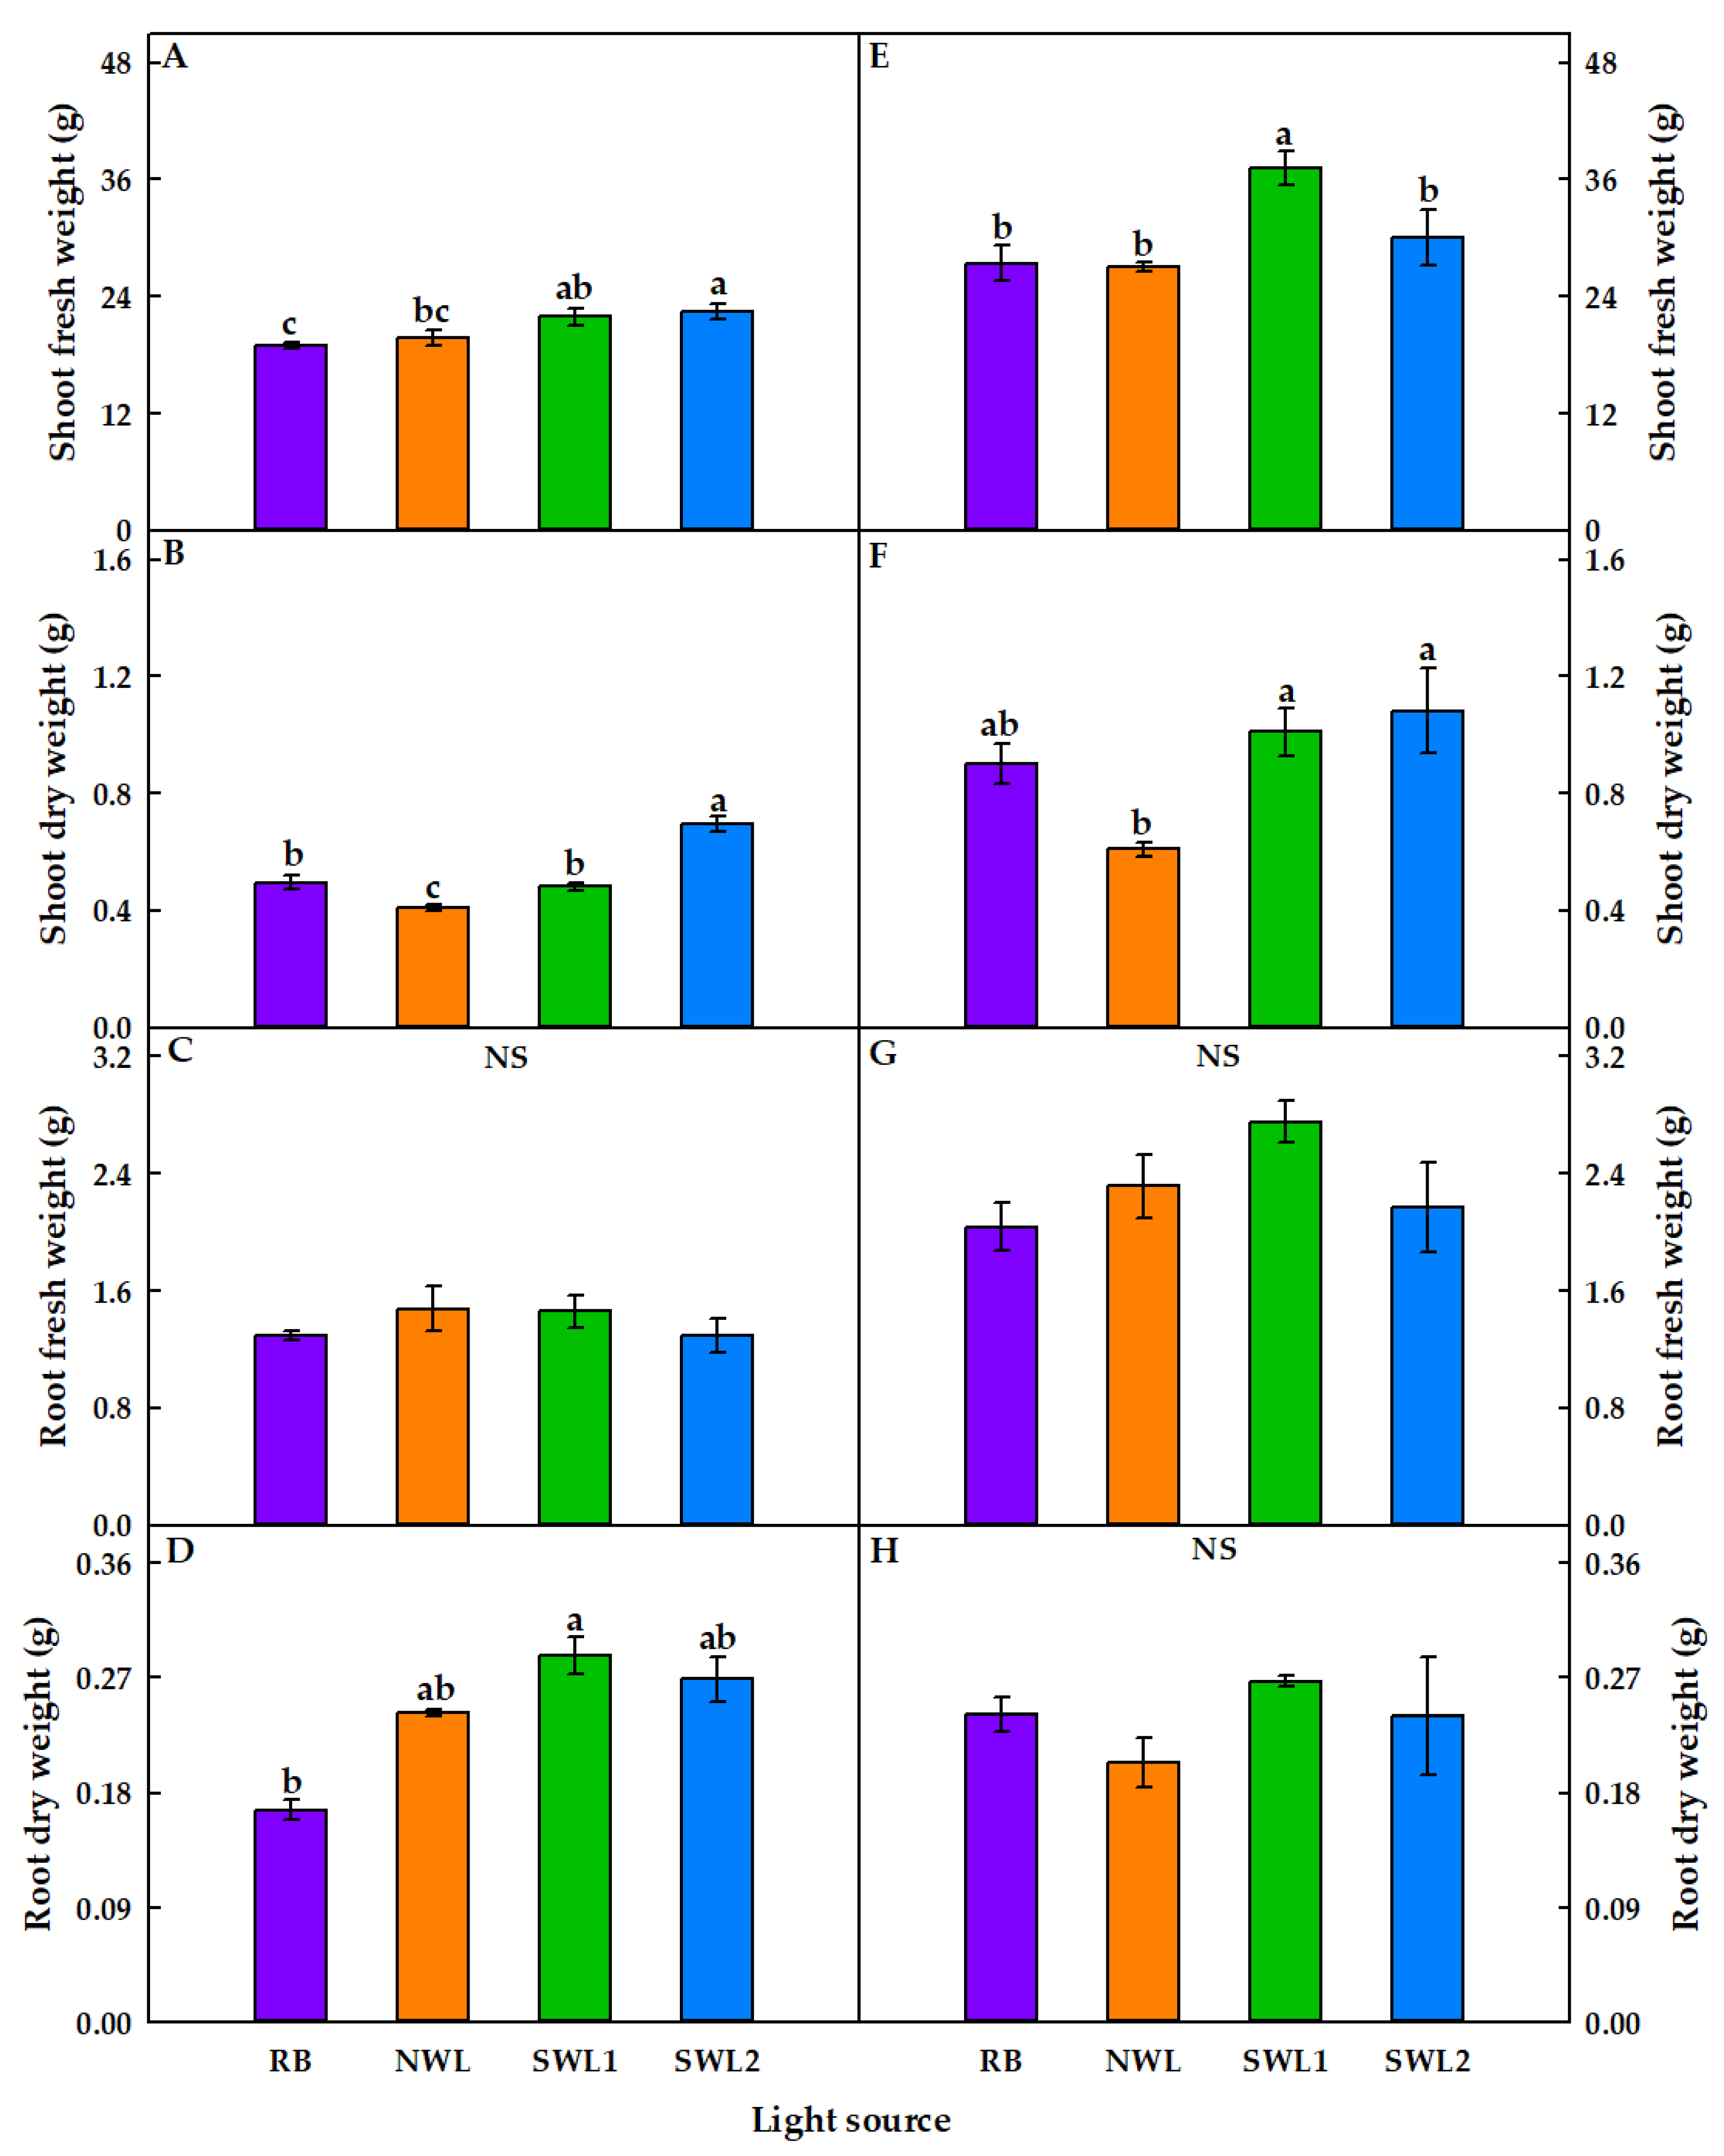
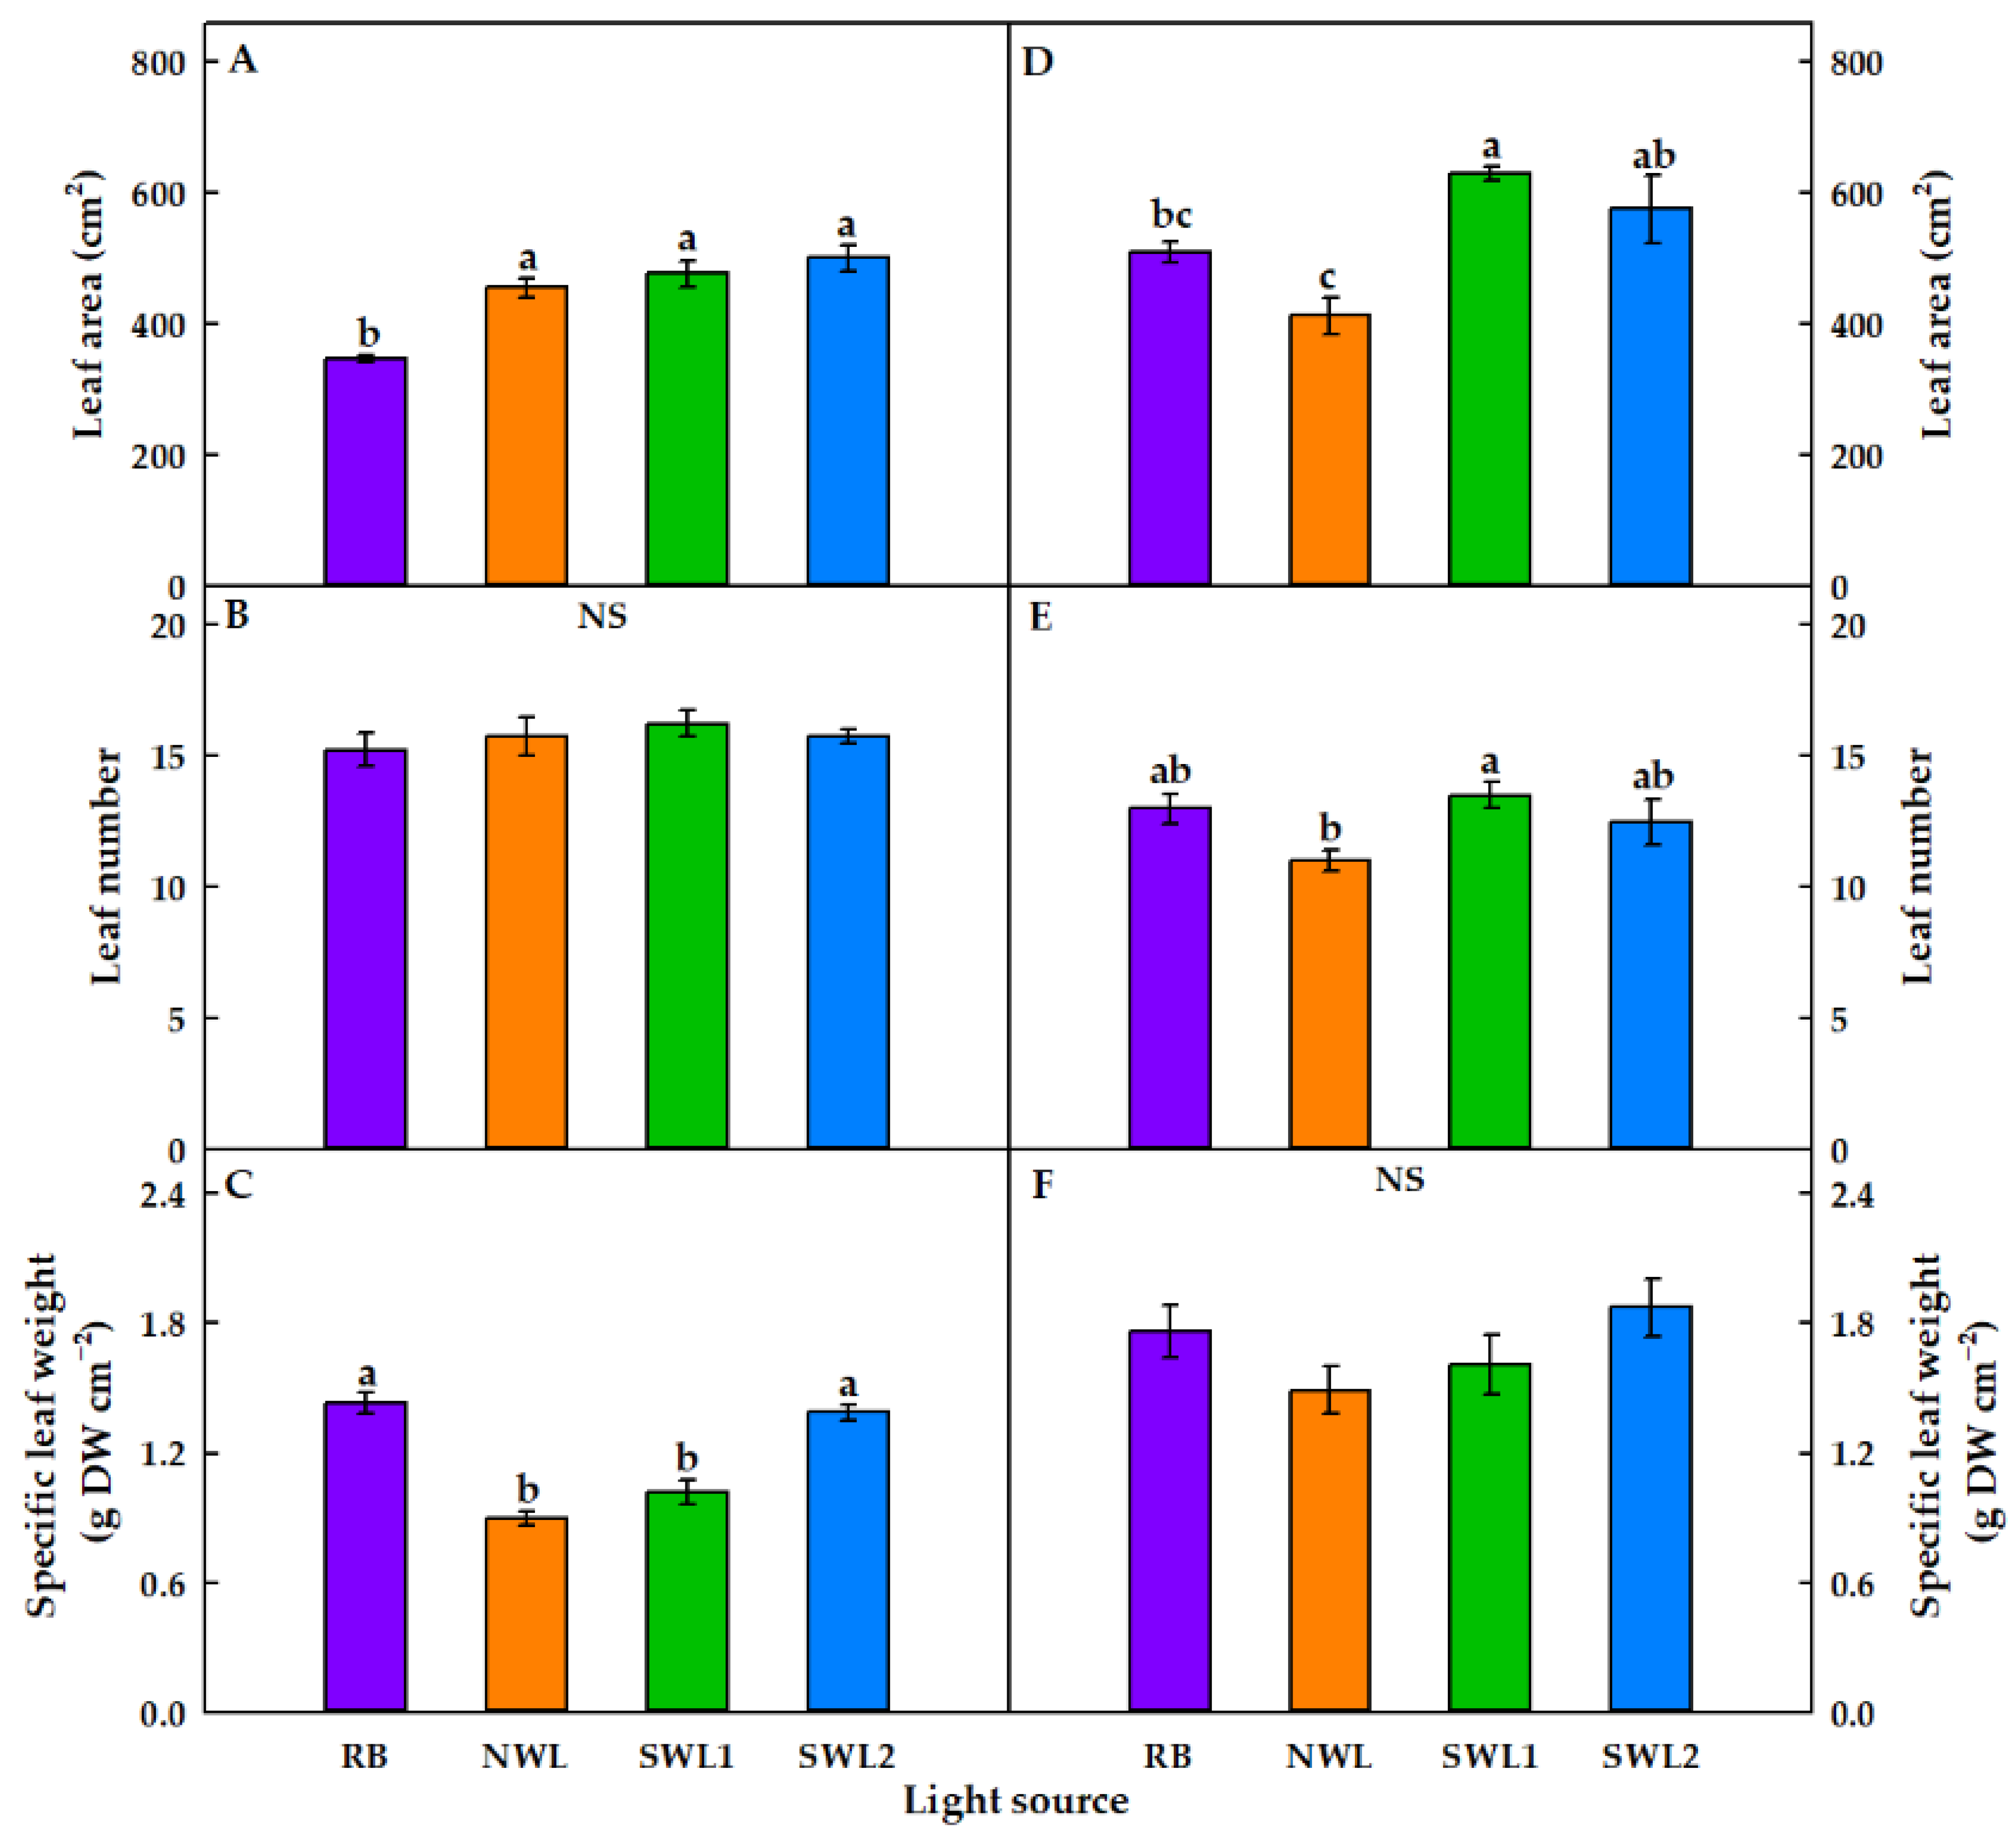
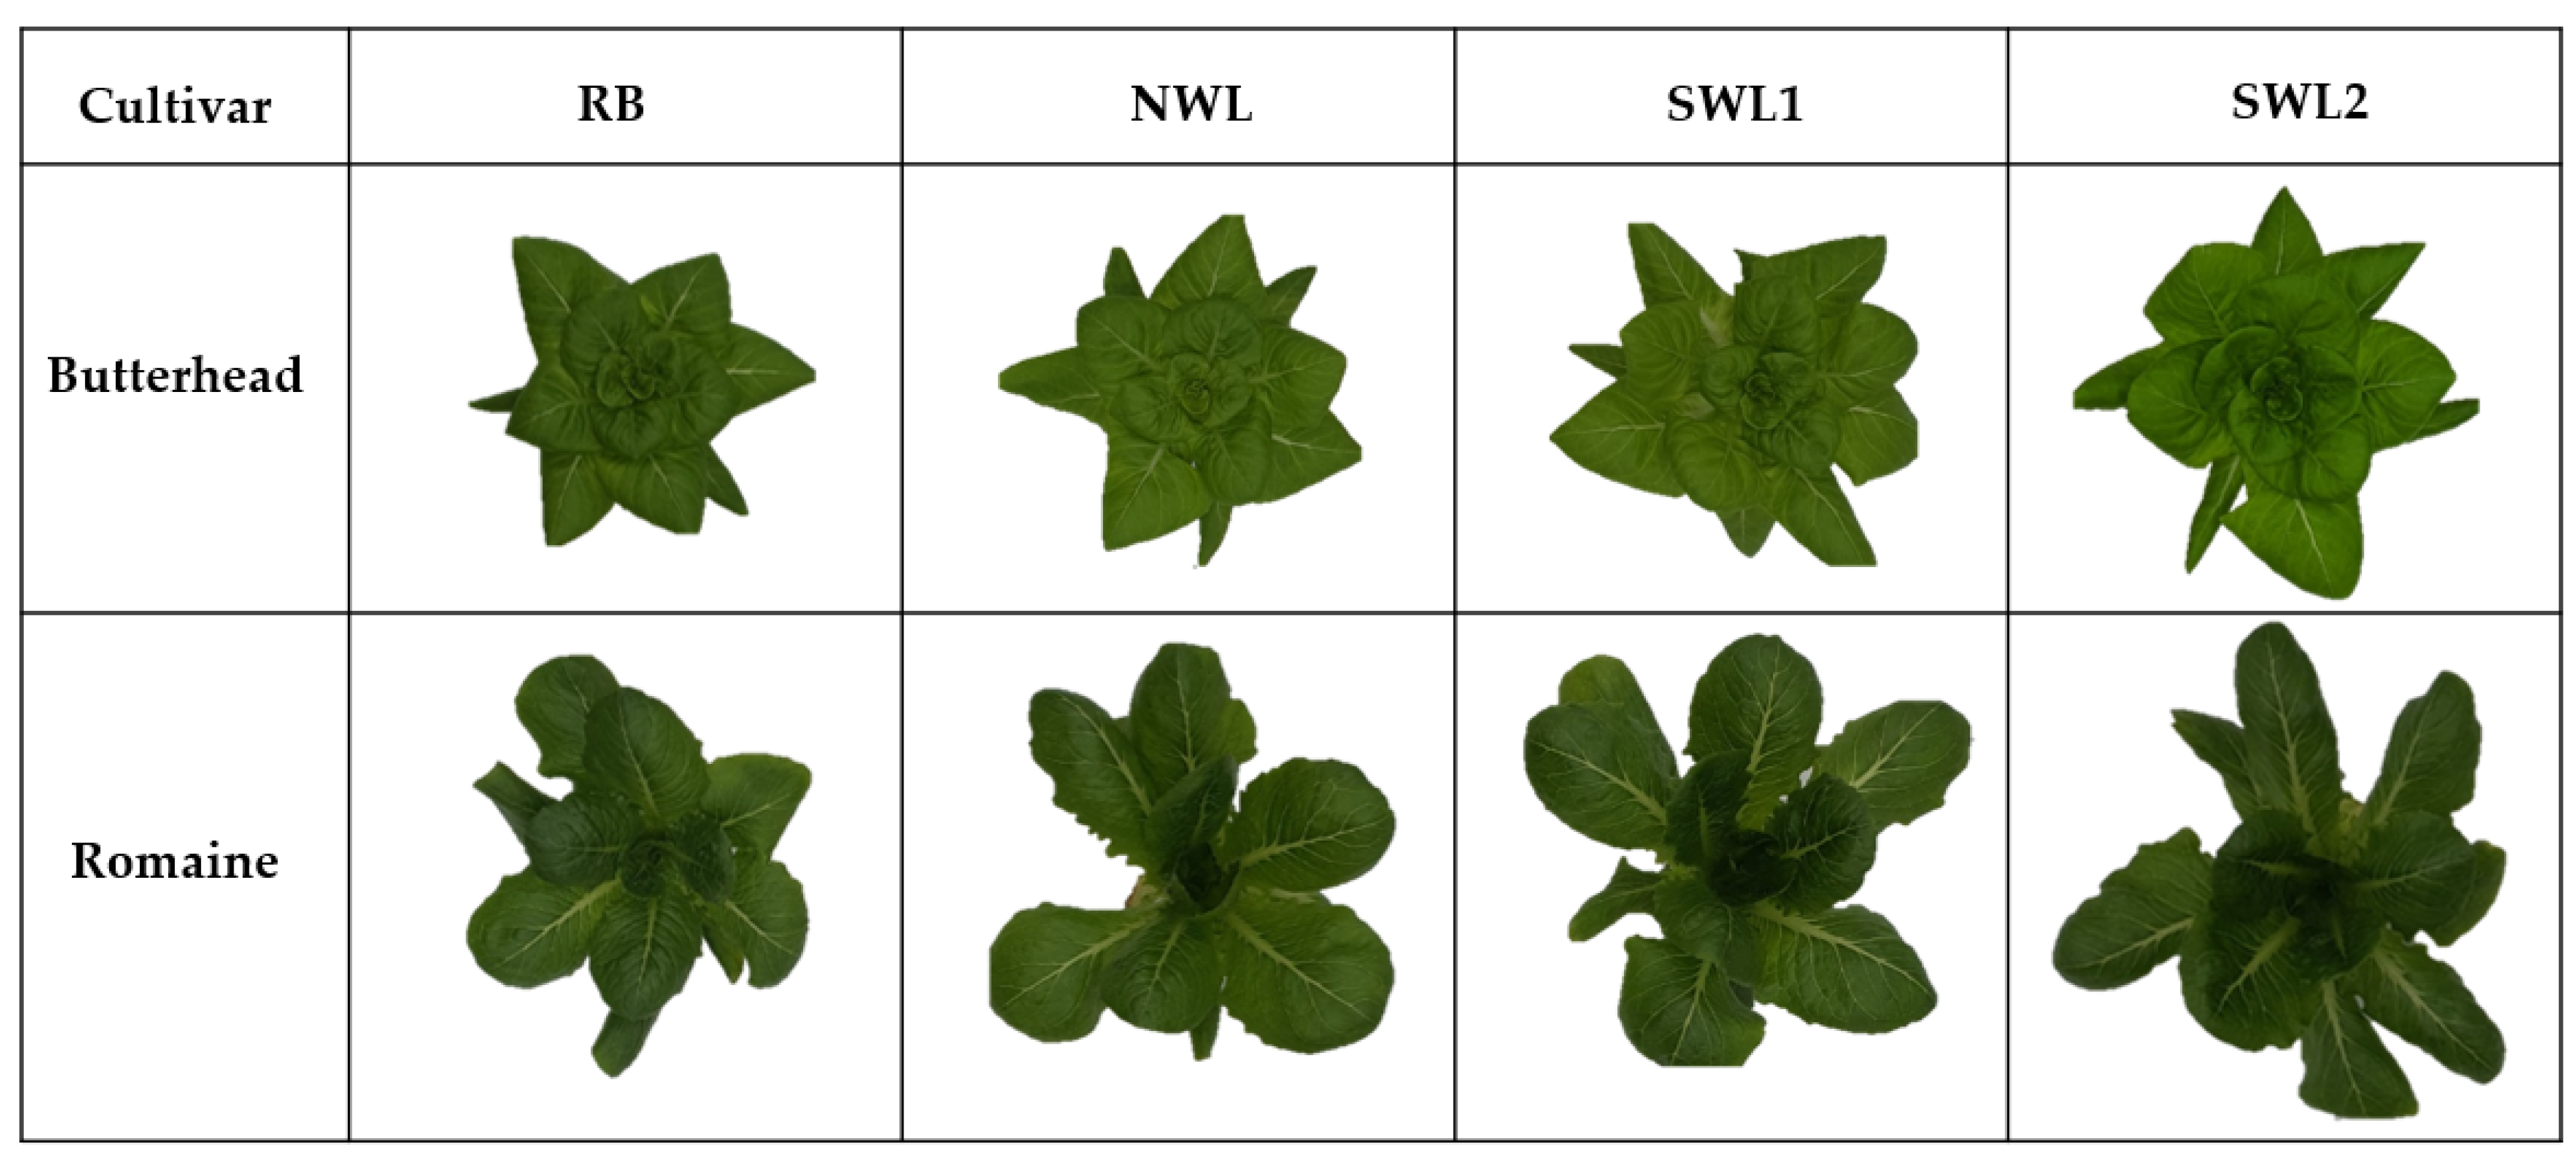
3.1.1. Growth Characteristics

Different light treatments including RB and W (NWL, SWL1, SWL2) had significant effects on the growth of butterhead and romaine lettuce plants (Figure 2). For butterhead lettuce, the shoot fresh weight of plants grown in the SWL1 and SWL2 treatments was about 1.4 and 1.7 times higher than that of RB-treated plants, respectively, while no significant difference in this value was observed between the NWL and RB treatments (Figure 3A). Plants grown in the SWL2 treatment also had the highest shoot dry weight among the treatments (Figure 3B). Root fresh weight was not significantly affected by light treatments, while root dry weight in the NWL and SWL1 treatments was slightly lower than that in the RB treatment (Figure 3C,D). Leaf area and leaf number of plants in the SWL2 treatment was increased by approximately 80% and 28%, respectively, compared to those of plants in the RB treatment (Figure 4A,B). In contrast, the specific leaf weight of this cultivar was slightly decreased in all W treatments relative to the RB treatment group (Figure 4C). Regarding romaine lettuce, shoot fresh weight in all W treatments was considerably enhanced by 30~37% compared to that of plants in the RB treatment (Figure 3E). No significant differences were observed in shoot dry weight or root fresh weight (Figure 3F,G) among the treatments, whereas root dry weight in all W treatments was slightly decreased (Figure 3H). W treatments also had no effect on leaf number, leaf area, or specific leaf weight (Figure 4D–F).

3.1.2. Absorbance and Transmittance

The absorbance and transmittance of each spectrum region in various light treatments are presented in Table 3. In both cultivars, plants grown in the RB treatment showed a higher absorbance and lower transmittance compared to plants grown in all W treatments. Among the spectral ranges, both cultivars absorbed the most B light, followed by R light, and then G light. The absorbance of B light by plants grown in W treatments was similar to that of plants in the RB treatment, while R absorbance was decreased for plants treated by W LED light. In contrast, G light was deeply transmitted to the leaf compared to B and R lights. Romaine lettuce showed higher absorbance and lower transmittance compared to butterhead lettuce.

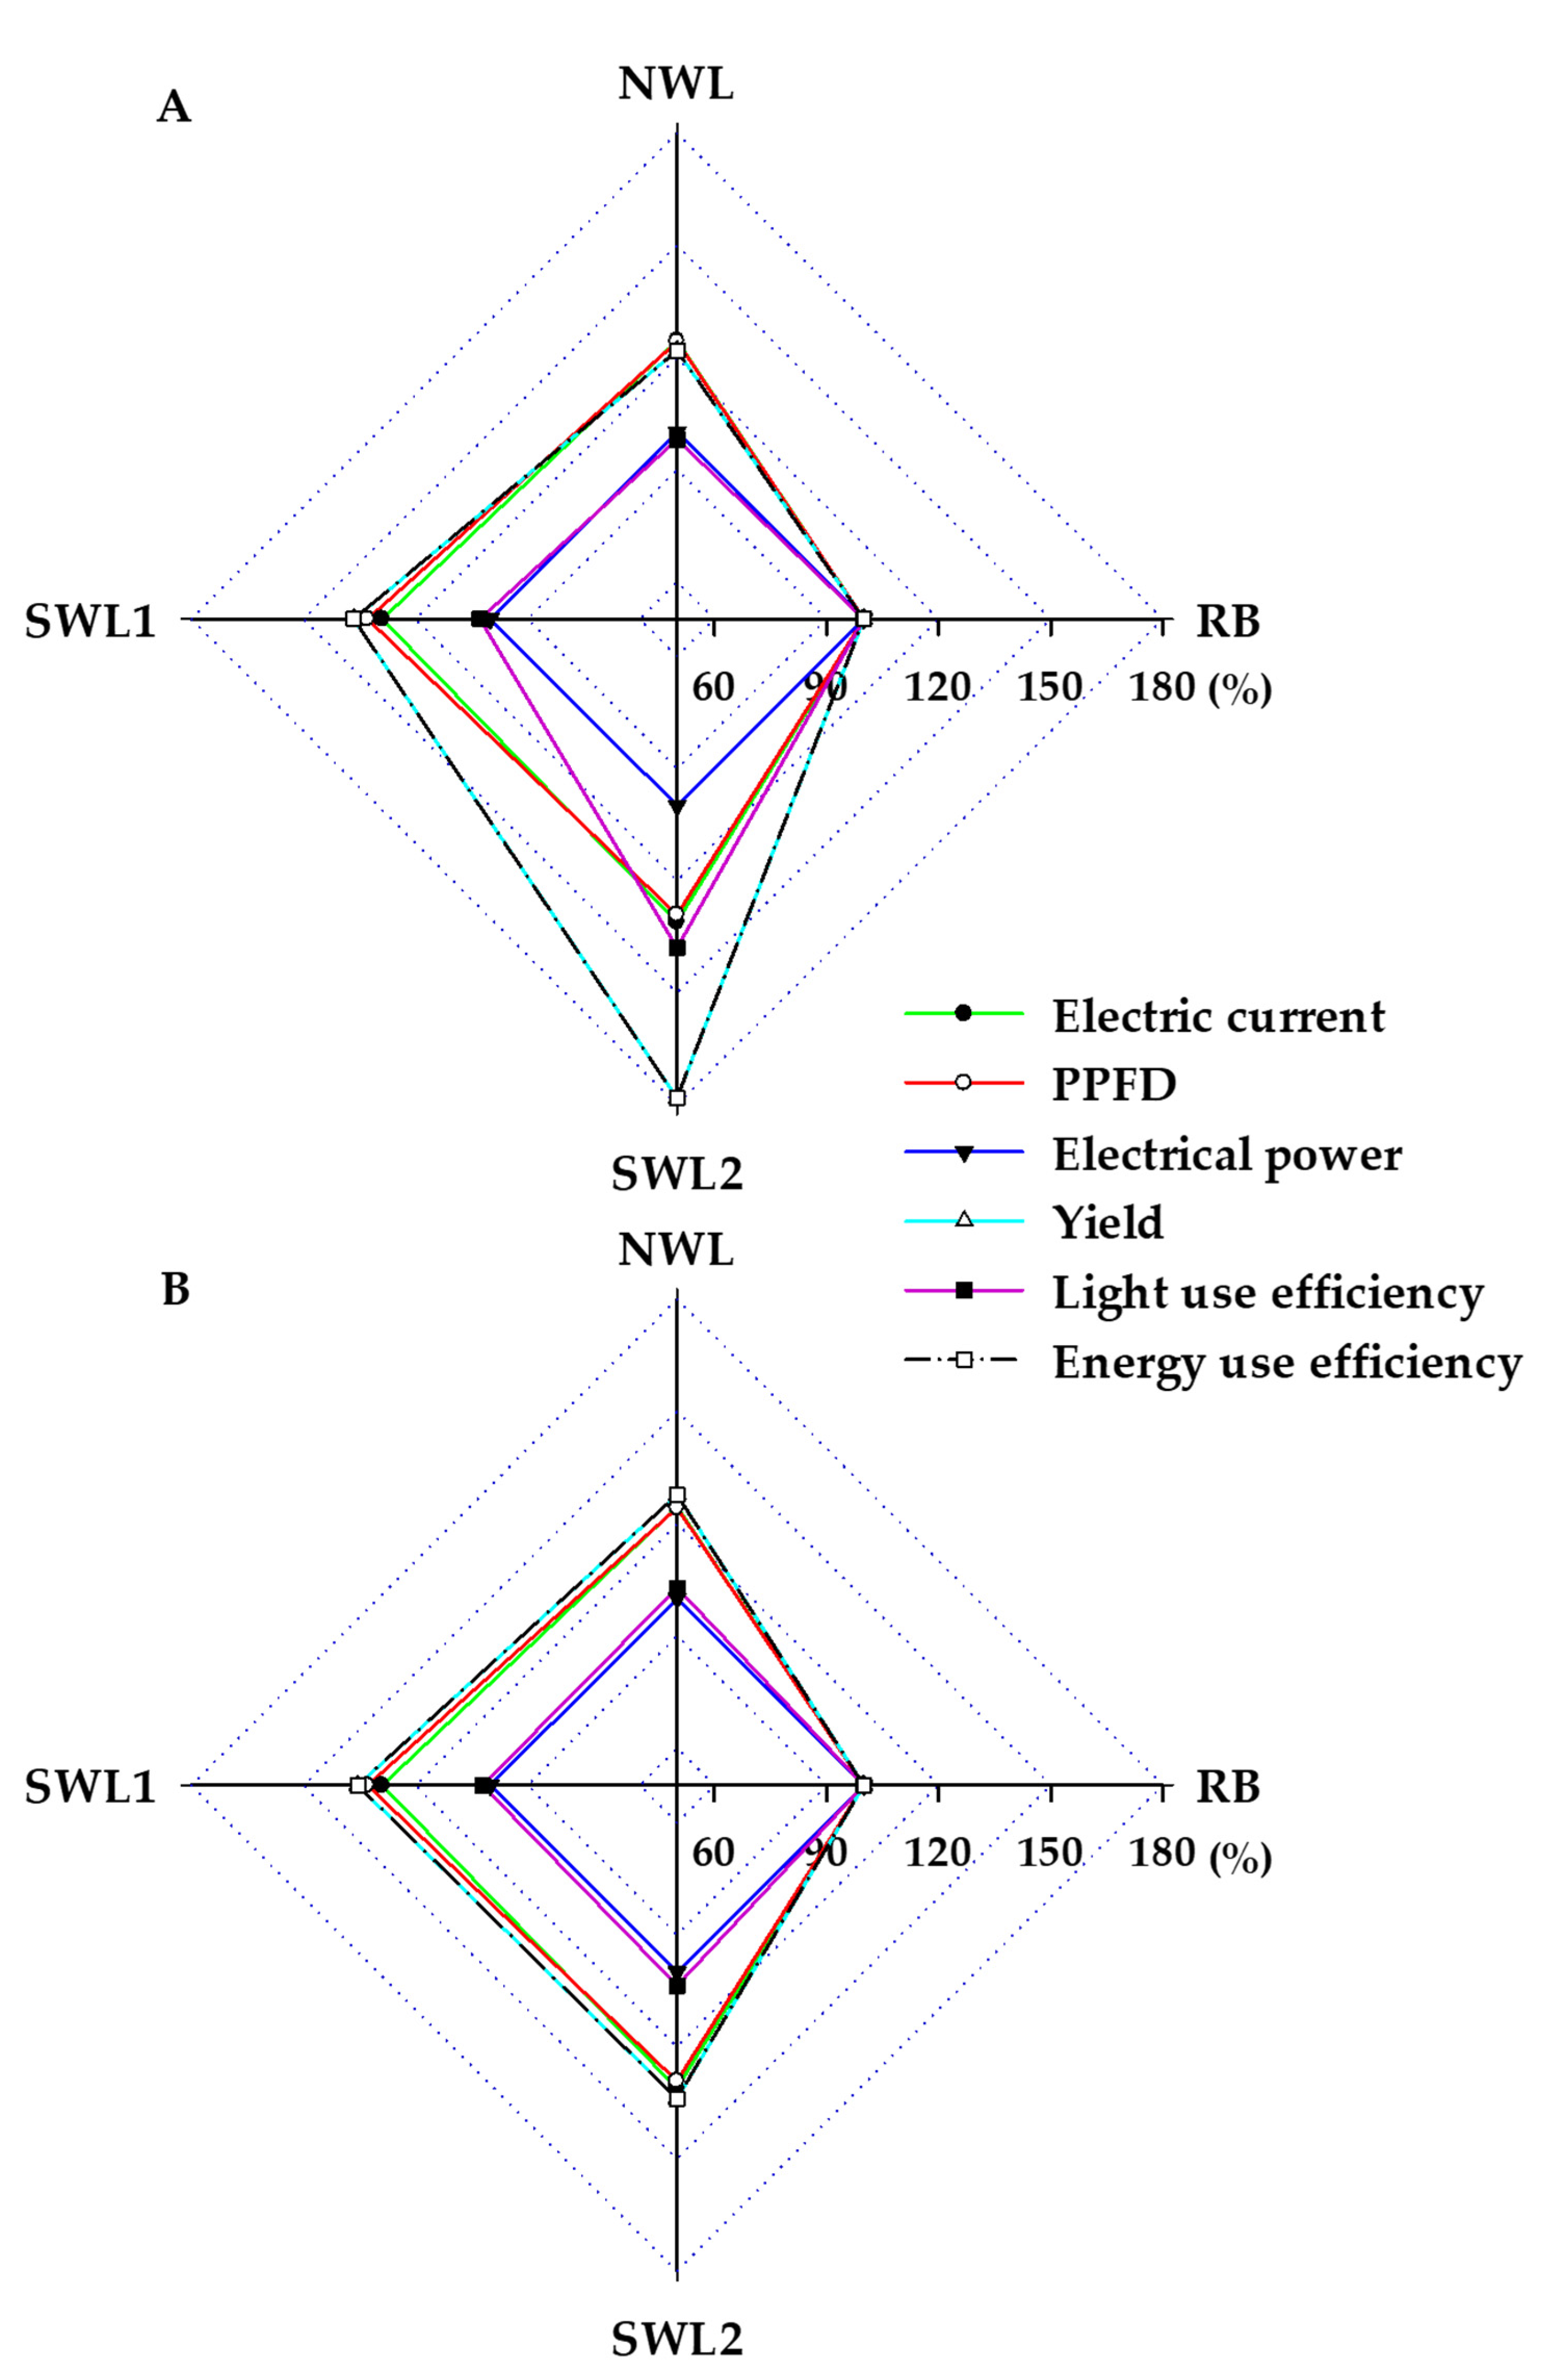
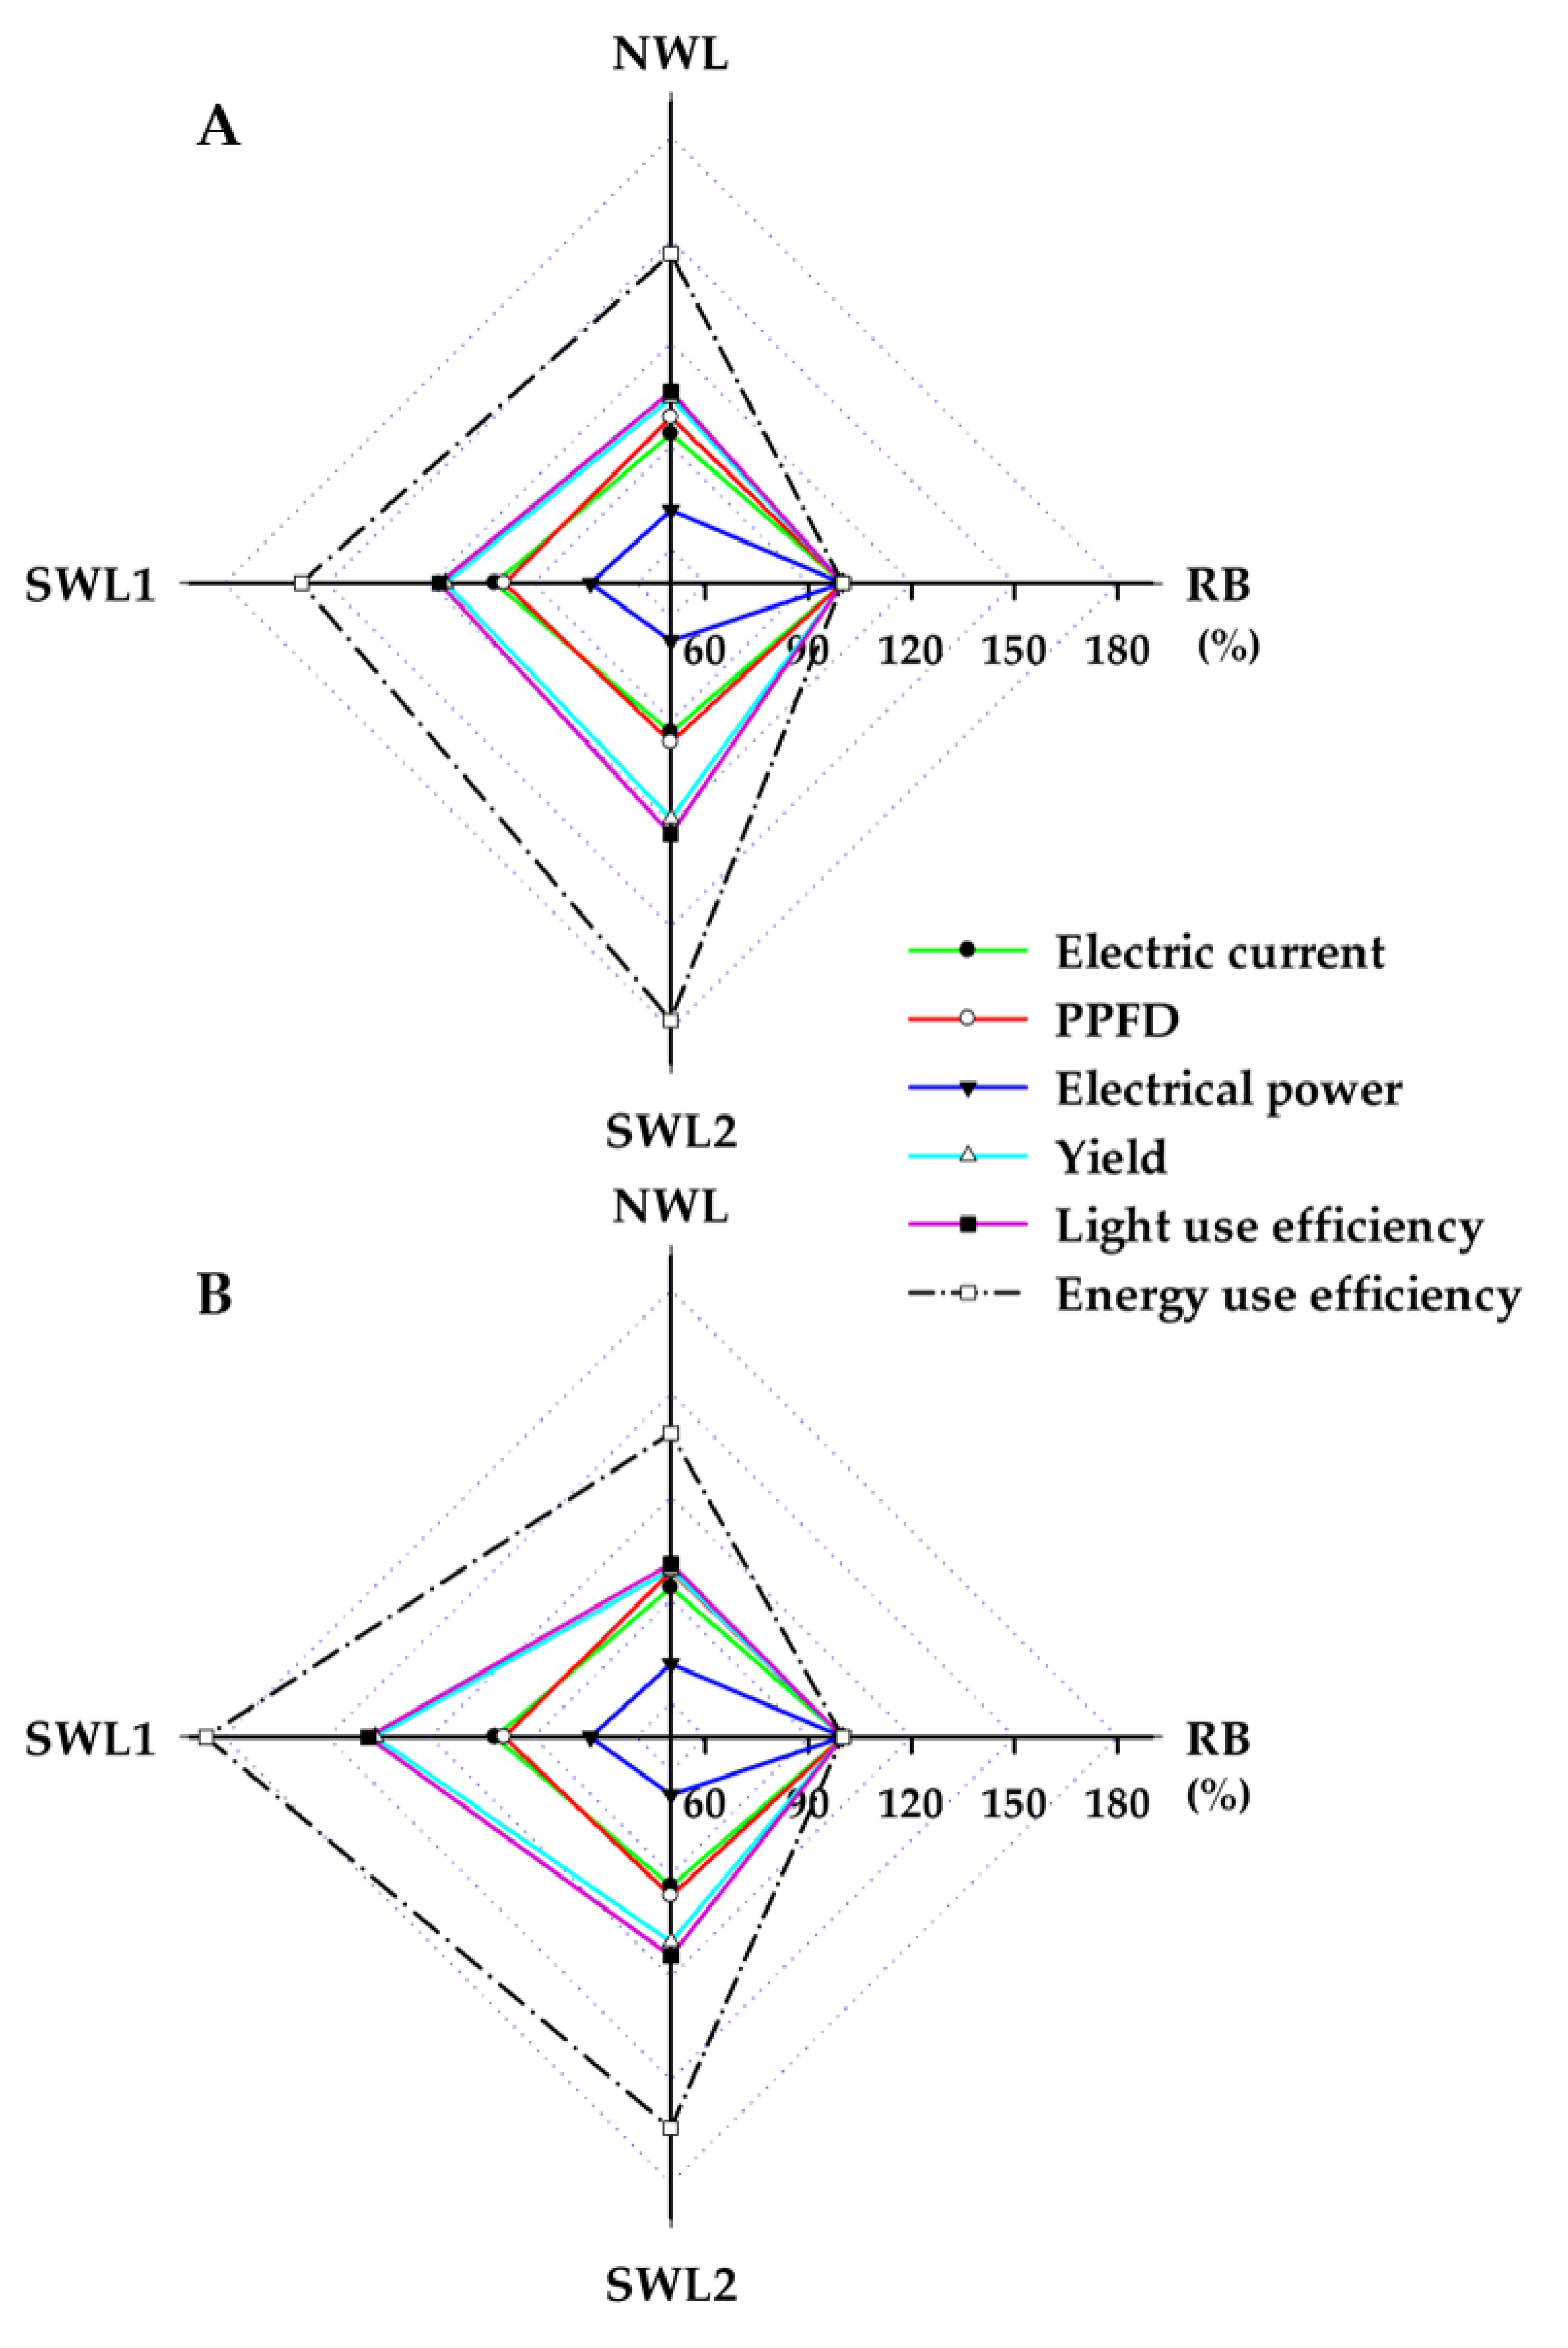
3.1.3. Light and Energy Use Efficiency

We calculated the relative percentages of electric current, electrical power, PPFD of light sources, as well as LUE and EUE in all W treatments at the same electrical power based on those in the RB treatment (Figure 5). The relative electric current was increased by 24~31% for all W treatments to provide the same electrical power of 80 W as in the RB treatment, and the PPFD of the three W treatments was increased by 1.2~1.3 times compared to that of the RB treatment. For butterhead lettuce, compared to the RB treatment, the LUE in the NWL treatment was lower, while the SWL1 treatment had a slightly higher value, and this value in the SWL2 treatment was considerably increased, by 38% (Figure 5A). Meanwhile, the LUE of romaine lettuce in all W treatments was slightly increased compared to the RB treatment (Figure 5B). The EUE of butterhead in the SWL2 treatment was highest among the treatments, while this value of romaine in all W treatments was about 1.3 times higher than that in the RB treatment (Figure 5).

3.2. Experiment 2

3.2.1. Growth Characteristics

The irradiation of different light treatments with the same PPFD significantly affected the growth of butterhead and romaine lettuce plants (Figure 6). Shoot fresh and dry weights of butterhead lettuce plants grown in the SWL2 treatment were respectively 1.2 and 1.4 times higher than those of RB-treated plants (Figure 7A,B). There was no significant difference in root fresh weight, whereas the root dry weight of plants in the SWL1 treatment was about 1.6 times greater than that of plants in the RB treatment (Figure 7C,D). All W treatments had markedly increased leaf area, whereas no significant difference was observed in leaf number among the treatments (Figure 8A,B). In contrast, the specific leaf weight of plants in the SWL2 treatment was similar to that in the RB treatment, whereas this value in the NWL and SWL1 treatments was slightly lower than that in the RB treatment (Figure 8C). For romaine lettuce, the shoot fresh weight of plants in the SWL1 treatment was highest among treatments (Figure 7E). Shoot dry weight in the SWL1 and SWL2 treatments was not significantly different from that in the RB treatment, although this value was higher than in the RB treatment (Figure 7F). The RB and W treatments did not affect root fresh or dry weights (Figure 7G,H). No significant differences in leaf area and leaf number were observed between the W treatments and RB treatment, except for the higher leaf area of the plant in the SWL1 treatment (Figure 8D,E). Specific leaf weight was not affected by light treatments (Figure 8F).

3.2.2. Absorbance and Transmittance

The absorbance and transmittance were lower in all W treatments than in the RB treatment (Table 4). The B absorbance and transmittance of butterhead lettuce were almost unchanged in the three W treatments, while the R and G absorbance and transmittance in the SWL2 treatment were lower and higher, respectively, than those in the NWL and SWL1 treatments. Meanwhile, romaine lettuce grown in the SWL1 and SWL2 treatments absorbed more R, G, and B lights and transmitted less of these lights compared to plants in the NWL treatment.

3.2.3. Individual Phenolic Acid and Flavonol Contents

Different light treatments showed various effects on individual phenolic and flavonol contents of both cultivars. In butterhead lettuce, most individual phenolic contents were lowest in the NWL and SWL1 treatments (Table 5). Plants grown in the RB treatment significantly increased protocatechuic, chlorogenic, ferulic, veratric, and benzoic acids. Meanwhile, the SWL2 treatment stimulated the accumulation of gallic, chlorogenic, p-hydrobenzoic, vanillic, and t-cinnamic acids. Among individual phenolic acids, chlorogenic acid had the highest content. Most individual flavonol contents were also highest in the RB and SWL2 treatments (Table 5), in which the contents of epicatechin and epigallocatechin gallate significantly increased in these treatments. The RB treatment enhanced catechin, rutin, catechin gallate, naringin, and formononetin contents, while epigallocatechin and quercetin contents were highest among individual flavonols and were considerably increased in the SWL2 treatment. The NWL and SWL1 treatments did not positively affect individual flavonol contents.
In romaine lettuce, the individual phenolic and flavonol contents of this cultivar showed similar trends to those of butterhead lettuce, in which the RB and SWL2 treatments showed a positive effect on the individual contents (Table 6). In addition, plants grown in the SWL1 treatment also had enhanced contents of some phenolic compounds (e.g., gallic, chlorogenic, p-hydrobenzoic, and t-cinnamic acids) and some flavonols (e.g., epigallocatechin, catechin, epigallocatechin gallate, and naringenin). Chlorogenic acid was the phenolic acid present at the highest levels in this cultivar, and was increased in the RB, SWL1, and SWL2 treatments; meanwhile, quercetin was the flavonol with the highest content, and was significantly increased in the SWL1 and SWL2 treatments. The NWL treatment resulted in the lowest contents of individual phenolic acids and flavonols.

3.2.4. Light and Energy Use Efficiency

Figure 9 summarized the relative percentages of electric current, electrical power, and PPFD of light sources as well as the yield, LUE, and EUE of both lettuce cultivars grown in different W treatments with the same PPFD. To provide the same PPFD in all treatments, the electric current used in all W treatments (except for the SWL1 treatment) was slightly decreased, and the electricity used in all W treatments was also reduced by 29~34% compared to the RB treatment. In both cultivars, LUE was higher in the SWL1 and SWL2 treatments than in the NWL and RB treatments. The EUE of butterhead lettuce in all W treatments was increased by 45~77%, while this value of romaine lettuce in all W treatments was 38~85% higher than that in the RB treatment. The LUE and EUE of butterhead were highest in the SWL2 treatment, while these values of romaine lettuce were greatest in the SWL1 treatment.

4. Discussion

In both of this study’s experiments, four light sources were applied to investigate the effect of W LED light on the growth of two lettuce cultivars compared to the same cultivars grown under RB LEDs. The three W LEDs lights were produced by the combination of different wavelengths and ratios of R, G, and B LED lights. The R wavelength at 664~665 nm was used in the three W LED lights and in RB LED light. The NWL treatment was considered as normal W light that contained longer B and G wavelengths at 453 nm and 586 nm, respectively. Meanwhile, the SWL1 and SWL2 treatments were specific W lights developed by Samsung and had shorter B (437 nm) and G wavelengths (526 nm in SWL1 and 578 nm in SWL2) compared to the NWL treatment. In addition, the ratios of R, B, and G lights were also slightly different among these W LED lights; in the NWL and SWL2 treatments the ratio was about R:G:B = 2:4:4 and in SWL1 it was R:G:B = 3:4:3. Generally speaking, the differences in spectral wavelengths and compositions among RB and all W treatments significantly affected the growth and secondary metabolite contents of both lettuce cultivars and could be manipulated to result in higher LUE and EUE.
The present study found certain growth responses of both lettuce cultivars to the different light sources with the same electrical power or PPFD. In experiment 1, the SWL1 and SWL2 treatments (especially the SWL2 treatment) significantly increased the shoot growth of butterhead lettuce, while romaine lettuce was minimally affected, which indicates the different responses of cultivars to light. The SWL1 and SWL2 treatments with the same electrical power exhibited about 24~32% higher PPFD compared to the RB treatment, which contributed to the increase in the growth of both cultivars. Light intensity or PPFD is well known as one of the most vital factors for plant growth and development, in which high light intensity leads increases photosynthesis and subsequently enhances plant biomass, whereas low light intensity normally causes photoinhibition and affects plant photomorphogenesis [27]. Woltering and Witkowska reported that higher PPFD increased the dry matter content of lettuce, indicating higher carbohydrate levels and better postharvest quality [28], while the lettuce biomass was found to increase linearly with PPFD [29]. This is consistent with the findings of the present study, in which both SWL1 and SWL2 treatments enhanced shoot fresh and dry weights of butterhead lettuce, while only the shoot fresh weight of romaine lettuce was positively affected. However, lettuce plants grown in indoor conditions face a severe problem of tip burn due to the excessive light intensity. Sago reported the frequent development of tip burn in butterhead lettuce under high light intensity from 150 to 300 µmol m−2 s−1, which may have been caused by the deficiency of calcium in inner leaves [30]. In the present study, both lettuce cultivars grown in the SWL1 and SWL2 treatments with the higher PPFD of 172 and 167 µmol m−2 s−1, respectively, did not demonstrate the tip burn phenomenon, indicating that these PPFDs were not excessive for lettuce growth. The increased leaf area and leaf number of butterhead lettuce in these treatments contributed to the higher biomass of these cultivars, whereas these values of romaine were not affected. In contrast, the specific leaf area was decreased in all W treatments. A clear and significant reduction in the specific leaf area was observed in lettuce and pepper grown in a higher light intensity in [31], which could lead to decreased light energy absorption [32]. Meanwhile, it was reported that a low light intensity caused an increase in specific leaf weight in [32,33], which is consistent with the present study, where there was a higher specific leaf weight in the RB treatment grown under low light intensity.
The results of experiment 2 had a similar pattern to those of experiment 1. Although both lettuce cultivars were grown at the same PPFD among light sources, the SWL1 and SWL2 sources still tended to increase the plant growth compared to the RB treatment. Therefore, in addition to the effect of PPFD, the differences in the spectral wavelengths and ratios might also have influenced the growth of both lettuce cultivars. RB LEDs have been reported to have a positive effect on plant biomass accumulation. R and B lights are effectively absorbed by photosynthetic pigments, and leaf absorption of R and B lights was reported to be 90% [34]; this is consistent with the R and B absorbance rates of both lettuce cultivars in the RB treatments in the present study. The importance of R light and combined RB light for improving the biomass of lettuce has been reported [11,35]. However, some studies have illustrated that W LED light has equal or superior effects on improving plant growth compared to RB LED light because W LED light containing G light had a higher transmittance into the leaves compared to RB LED light [5,36]. Leaves can absorb about 70 to 80% of G light [34], which was reflected in the absorbance rates for G light in both lettuce cultivars in the three W treatments in the present study. Moreover, G light can deeply transmit into the leaf layers compared to R and B lights, allowing accesses to deeper photosynthetic tissues [37]. Previous studies suggest the positive use of G light at high intensity, especially shorter G wavelength, for growing lettuce [10,24]. Lin et al. reported the reduction of the dry mass in lettuce grown without G light compared to those grown under RWB LED and fluorescent lamps at the same PPFD [38]. In the present study, both lettuce cultivars grown in all W treatments had a high transmittance of G light through the leaf; therefore, R and B lights in W treatments can drive the photosynthesis in the upper leaf layers, whereas G light can drive the photosynthesis in the lower leaf layers and in the canopy, leading to enhanced whole-plant photosynthesis and subsequently improved the plant growth.
Balance in growth improvement and secondary metabolites accumulation is an ideal goal of cultivating plants in vertical farming. Many studies have reported the influence of light quality on the accumulation of plant metabolites [39]. In the present study, the contents of individual phenolic acids and flavonols were determined for both lettuce cultivars grown under different light sources with the same PPFD. Therefore, the spectral wavelengths and their ratios in the light sources mainly caused the variations in individual compound accumulation. The RB treatment significantly enhanced the contents of most phenolic acids (i.e., protocatechuic, chlorogenic, gallic, ferulic, veratric, and benzoic acids) and flavonols (i.e., catechin, epicatechin, epigallocatechin gallate, rutin, catechin gallate, and naringin) in both cultivars, which is consistent with the results of numerous studies that have demonstrated the effectiveness of R and B lights alone or in combination in stimulating the production of plant secondary metabolites [40,41,42]. B light has generally been reported to be more effective in increasing the biochemical compounds in plants because of the involvement of its photoreceptor (cryptochrome) in the accumulation of phenolic acids and flavonoids [43]. Meanwhile, the role of R light or combined RB light in biochemical accumulation depends on plant species and cultivars [9,42]. Son et al. also reported that a higher proportion of B in combined RB light increased total phenolic acid and flavonoid contents as well as the antioxidant capacity of red and green leaf lettuce [35], whereas the same green leafy variety of lettuce grown under R light was confirmed to demonstrate a relative inefficiency in modifying total phenolic acid and flavonoid contents [22]. Enhanced plant secondary metabolites have been observed in the presence of R and B lights compared to W light [44]. In the present study, the plants in the NWL treatment group with lower B:R ratio lights had the lowest contents of all individual phenolic acids and flavonols compared to the plants in the RB treatment. In contrast, some of these compounds were significantly enhanced in the SWL2 treatment for both lettuce cultivars and even in the SWL1 treatment for romaine lettuce. It is noteworthy that the specific W light treatments (SWL1 and SWL2) contained a shorter B wavelength, which may have contributed to enhance the accumulation of the individual compounds in both cultivars. Some flavonoids are major pigments absorbing B light in the range 400–430 nm [45]; therefore, it is expected that shorter B wavelengths with higher energy can effectively stimulate phenolic acid and flavonoid accumulation. Recently, plant biochemical responses to shorter wavelengths of the B light range have been investigated; for example, the total phenolic acid and flavonoid contents of two pak-choi cultivars and basil were increased when grown under light with the shorter B wavelengths of 420, 430, and 440 nm [43,46]. Increases in caffeic and chlorogenic acids were observed in Crepis japonica plants grown in combined W and B lights below 450 nm [47]. In the present study, the content of chlorogenic acid (the phenolic acid present at the highest levels) was also increased in both RB and SWL2 treatments, whereas the quercetin content was highest in the SWL2 treatment. In contrast, there are few reports on the role of G light in the biosynthesis of bioactive compounds. The addition of supplementary G LEDs to combined RB LEDs did not impact the accumulation of antioxidant phenols of lettuce [25].
LUE is the most useful factor for estimating crop productivity. In the present study, relative LUE expressed as the proportion of shoot fresh weight and PPFD was higher in all W treatments, especially in the SWL1 and SWL2 treatments. The LUE normally increases with increasing PPFD, which is consistent with the results of experiment 1, with the higher PPFD in W LED treatments. Moreover, the W LED treatments with the same PPFD as that of the RB treatment also had greater LUE, indicating the high efficiency of W light sources used in this study. In addition, the relative EUE showed a similar trend to that of LUE in both experiments. In experiment 1, all W LED treatments consumed the same electrical power as the RB treatment but had increased EUE by approximately 1.4 to 1.8 times, whereas the results of experiment 2 showed greater EUE and lower electricity consumption in all W LED treatments. Recently, the evaluation of LUE and EUE based on fresh biomass has attracted increasing attention from growers, and in previous studies has been reported to have a close correlation with both the specific LED spectra and plant cultivars. The EUE of basil leaves decreased with increased R ratio in the RB treatment in [48], while Poulet et al. found that the energy use of the W LED group was similar to that of the RB treatment [49]. Son et al. reported a lower power consumption with the highest EUE in the lettuce group grown under the light source containing the highest proportion of W LEDs [25]. These studies indicate that determining suitable lighting conditions for each plant species and cultivar is an important way to improve the LUE and EUE.

5. Conclusions

This study demonstrated the positive effects of W LED light on improving the growth and quality of two lettuce cultivars grown in a vertical farming setup. At the same electrical power, the new specific W LEDs with shorter blue peak wavelength (437 nm) provided a higher PPFD, increasing the growth and development of lettuce compared to the plants grown under normal W LEDs and combined RB LEDs. The application of new specific W LED light sources with the same PPFD consumed less electrical power and stimulated the accumulation of biomass and individual phenolic acid and flavonol contents in lettuce. In addition, these W light sources resulted in the highest LUE and EUE in both cases with the same electrical power and PPFD. The results of this study suggest that these specific W LED lights can be favorably used to grow lettuce as well as other leafy vegetables in vertical farming for year-round production. Moreover, the results encourage the development of new W LED light sources to decrease the lighting costs and further production costs in vertical farming.

Author Contributions

Conceptualization, methodology, software, formal analysis, investigation, resources, data curation, writing—original draft preparation, T.K.L.N. and K.M.C.; data curation, formal analysis, investigation, methodology, G.O.L., S.N.J., H.Y.L., and D.Y.C.; supporting device, technical assistance, Y.L. and D.K.; supervision, validation, funding acquisition, writing—review and editing, K.-H.S. All authors have read and agreed to the published version of the manuscript.

Funding

This research was supported by Samsung Electronics.

Institutional Review Board Statement

Not applicable.

Informed Consent Statement

Not applicable.

Data Availability Statement

All data are available in the paper.

Conflicts of Interest

The authors declare no conflict of interest.

References

  1. Golzar, F.; Heeren, N.; Hellweg, S.; Roshandel, R. A comparative study on the environmental impact of greenhouses: A probabilistic approach. Sci. Total Environ. 2019, 675, 560–569. [Google Scholar] [CrossRef]
  2. SharathKumar, M.; Heuvelink, E.; Marcelis, L.F. Vertical Farming: Moving from Genetic to Environmental Modification. Trends Plant Sci. 2020, 25, 724–727. [Google Scholar] [CrossRef]
  3. Martineau, V.; Lefsrud, M.; Naznin, M.T.; Kopsell, D. Comparison of Light-emitting Diode and High-pressure Sodium Light Treatments for Hydroponics Growth of Boston Lettuce. HortScience 2012, 47, 477–482. [Google Scholar] [CrossRef] [Green Version]
  4. Xu, Y. Nature and Source of Light for Plant Factory. In Plant Factory Using Artificial Light; Elsevier: Amsterdam, The Netherlands, 2019; pp. 47–69. [Google Scholar]
  5. Massa, G.D.; Kim, H.-H.; Wheeler, R.M.; Mitchell, C.A. Plant Productivity in Response to LED Lighting. HortScience 2008, 43, 1951–1956. [Google Scholar] [CrossRef]
  6. Darko, E.; Heydarizadeh, P.; Schoefs, B.; Sabzalian, M.R. Photosynthesis under artificial light: The shift in primary and secondary metabolism. Philos. Trans. R. Soc. B Biol. Sci. 2014, 369, 20130243. [Google Scholar] [CrossRef]
  7. Dou, H.; Niu, G.; Gu, M.; Masabni, J.G. Responses of Sweet Basil to Different Daily Light Integrals in Photosynthesis, Morphology, Yield, and Nutritional Quality. HortScience 2018, 53, 496–503. [Google Scholar] [CrossRef]
  8. Folta, K.M.; Maruhnich, S.A. Green light: A signal to slow down or stop. J. Exp. Bot. 2007, 58, 3099–3111. [Google Scholar] [CrossRef] [PubMed]
  9. Sabzalian, M.R.; Heydarizadeh, P.; Zahedi, M.; Boroomand, A.; Agharokh, M.; Sahba, M.R.; Schoefs, B. High performance of vegetables, flowers, and medicinal plants in a red-blue LED incubator for indoor plant production. Agron. Sustain. Dev. 2014, 34, 879–886. [Google Scholar] [CrossRef] [Green Version]
  10. Son, K.-H.; Park, J.-H.; Kim, D.; Oh, M.-M. Leaf Shape Index, Growth, and Phytochemicals in Two Leaf Lettuce Cultivars Grown under Monochromatic Light-emitting Diodes. Korean J. Hortic. Sci. Technol. 2012, 30, 664–672. [Google Scholar] [CrossRef]
  11. Johkan, M.; Shoji, K.; Goto, F.; Hashida, S.-N.; Yoshihara, T. Blue Light-emitting Diode Light Irradiation of Seedlings Improves Seedling Quality and Growth after Transplanting in Red Leaf Lettuce. HortScience 2010, 45, 1809–1814. [Google Scholar] [CrossRef] [Green Version]
  12. Muneer, S.; Kim, E.J.; Park, J.S.; Lee, J.H. Influence of Green, Red and Blue Light Emitting Diodes on Multiprotein Complex Proteins and Photosynthetic Activity under Different Light Intensities in Lettuce Leaves (Lactuca sativa L.). Int. J. Mol. Sci. 2014, 15, 4657–4670. [Google Scholar] [CrossRef] [PubMed] [Green Version]
  13. Miao, Y.-X.; Wang, X.; Gao, L.-H.; Chen, Q.-Y.; Qu, M. Blue light is more essential than red light for maintaining the activities of photosystem II and I and photosynthetic electron transport capacity in cucumber leaves. J. Integr. Agric. 2016, 15, 87–100. [Google Scholar] [CrossRef] [Green Version]
  14. Wang, X.Y.; Xu, X.M.; Cui, J. The importance of blue light for leaf area expansion, development of photosynthetic apparatus, and chloroplast ultrastructure of Cucumis sativus grown under weak light. Photosynthetica 2014, 53, 213–222. [Google Scholar] [CrossRef]
  15. Ouzounis, T.; Rosenqvist, E.; Ottosen, C.-O. Spectral Effects of Artificial Light on Plant Physiology and Secondary Metabolism: A Review. HortScience 2015, 50, 1128–1135. [Google Scholar] [CrossRef] [Green Version]
  16. Kim, H.-H.; Wheeler, R.M.; Sager, J.C.; Yorio, N.C.; Goins, G.D. Light-emitting diodes as an illumination source for plants: A review of research at Kennedy Space Center. Habitation 2005, 10, 71–78. [Google Scholar] [CrossRef] [PubMed]
  17. Smith, H.L.; McAusland, L.; Murchie, E. Don’t ignore the green light: Exploring diverse roles in plant processes. J. Exp. Bot. 2017, 68, 2099–2110. [Google Scholar] [CrossRef]
  18. Cope, K.R.; Bugbee, B. Spectral Effects of Three Types of White Light-emitting Diodes on Plant Growth and Development: Absolute versus Relative Amounts of Blue Light. HortScience 2013, 48, 504–509. [Google Scholar] [CrossRef]
  19. Chang, M.-H.; Das, D.; Varde, P.; Pecht, M. Light emitting diodes reliability review. Microelectron. Reliab. 2012, 52, 762–782. [Google Scholar] [CrossRef]
  20. Pimputkar, S.; Speck, J.S.; Denbaars, S.; Nakamura, S. Prospects for LED lighting. Nat. Photonics 2009, 3, 180–182. [Google Scholar] [CrossRef]
  21. Bian, Z.-H.; Cheng, R.-F.; Yang, Q.-C.; Wang, J.; Lu, C. Continuous Light from Red, Blue, and Green Light-emitting Diodes Reduces Nitrate Content and Enhances Phytochemical Concentrations and Antioxidant Capacity in Lettuce. J. Am. Soc. Hortic. Sci. 2016, 141, 186–195. [Google Scholar] [CrossRef] [Green Version]
  22. Zhang, T.; Shi, Y.; Piao, F.; Sun, Z. Effects of different LED sources on the growth and nitrogen metabolism of lettuce. Plant Cell Tissue Organ Cult. 2018, 134, 231–240. [Google Scholar] [CrossRef]
  23. Cope, K.R.; Snowden, M.C.; Bugbee, B. Photobiological Interactions of Blue Light and Photosynthetic Photon Flux: Effects of Monochromatic and Broad-Spectrum Light Sources. Photochem. Photobiol. 2014, 90, 574–584. [Google Scholar] [CrossRef] [PubMed]
  24. Johkan, M.; Shoji, K.; Goto, F.; Hahida, S.; Yoshihara, T. Effect of green light wavelength and intensity on photomorphogenesis and photosynthesis in Lactuca sativa. Environ. Exp. Bot. 2012, 75, 128–133. [Google Scholar] [CrossRef]
  25. Son, K.-H.; Jeon, Y.-M.; Oh, M.-M. Application of supplementary white and pulsed light-emitting diodes to lettuce grown in a plant factory with artificial lighting. Hortic. Environ. Biotechnol. 2016, 57, 560–572. [Google Scholar] [CrossRef]
  26. Yan, Z.; He, D.; Niu, G.; Zhou, Q.; Qu, Y. Growth, Nutritional Quality, and Energy Use Efficiency of Hydroponic Lettuce as Influenced by Daily Light Integrals Exposed to White versus White Plus Red Light-emitting Diodes. HortScience 2019, 54, 1737–1744. [Google Scholar] [CrossRef] [Green Version]
  27. Fukuda, N.; Fujita, M.; Ohta, Y.; Sase, S.; Nishimura, S.; Ezura, H. Directional blue light irradiation triggers epidermal cell elongation of abaxial side resulting in inhibition of leaf epinasty in geranium under red light condition. Sci. Hortic. 2008, 115, 176–182. [Google Scholar] [CrossRef]
  28. Woltering, E.; Witkowska, I. Effects of pre- and postharvest lighting on quality and shelf life of fresh-cut lettuce. Acta Hortic. 2016, 1134, 357–366. [Google Scholar] [CrossRef]
  29. Kelly, N.; Choe, D.; Meng, Q.; Runkle, E.S. Promotion of lettuce growth under an increasing daily light integral depends on the combination of the photosynthetic photon flux density and photoperiod. Sci. Hortic. 2020, 272, 109565. [Google Scholar] [CrossRef]
  30. Sago, Y. Effects of Light Intensity and Growth Rate on Tipburn Development and Leaf Calcium Concentration in Butterhead Lettuce. HortScience 2016, 51, 1087–1091. [Google Scholar] [CrossRef]
  31. Urrestarazu, M.; Nájera, C.; Gea, M.D.M. Effect of the Spectral Quality and Intensity of Light-emitting Diodes on Several Horticultural Crops. HortScience 2016, 51, 268–271. [Google Scholar] [CrossRef] [Green Version]
  32. Fan, X.; Zang, J.; Xu, Z.; Guo, S.; Jiao, X.; Liu, X.; Gao, Y. Effects of different light quality on growth, chlorophyll concentration and chlorophyll biosynthesis precursors of non-heading Chinese cabbage (Brassica campestris L.). Acta Physiol. Plant. 2013, 35, 2721–2726. [Google Scholar] [CrossRef]
  33. Steinger, T.; Roy, B.A.; Stanton, M.L. Evolution in stressful environments II: Adaptive value and costs of plasticity in response to low light in Sinapis arvensis. J. Evol. Biol. 2003, 16, 313–323. [Google Scholar] [CrossRef] [Green Version]
  34. Terashima, I.; Fujita, T.; Inoue, T.; Chow, W.S.; Oguchi, R. Green Light Drives Leaf Photosynthesis More Efficiently than Red Light in Strong White Light: Revisiting the Enigmatic Question of Why Leaves are Green. Plant Cell Physiol. 2009, 50, 684–697. [Google Scholar] [CrossRef] [Green Version]
  35. Son, K.-H.; Oh, M.-M. Leaf Shape, Growth, and Antioxidant Phenolic Compounds of Two Lettuce Cultivars Grown under Various Combinations of Blue and Red Light-emitting Diodes. HortScience 2013, 48, 988–995. [Google Scholar] [CrossRef]
  36. Phansurin, W.; Jamaree, T.; Sakhonwasee, S. Comparison of Growth, Development, and Photosynthesis of Petunia Grown Under White or Red-blue LED lights. Korean J. Hortic. Sci. 2017, 35, 689–699. [Google Scholar] [CrossRef]
  37. Brodersen, C.R.; Vogelmann, T.C. Do changes in light direction affect absorption profiles in leaves? Funct. Plant Biol. 2010, 37, 403–412. [Google Scholar] [CrossRef]
  38. Lin, K.-H.; Huang, M.-Y.; Huang, W.-D.; Hsu, M.-H.; Yang, Z.-W.; Yang, C.-M. The effects of red, blue, and white light-emitting diodes on the growth, development, and edible quality of hydroponically grown lettuce (Lactuca sativa L. var. capitata). Sci. Hortic. 2013, 150, 86–91. [Google Scholar] [CrossRef]
  39. Bian, Z.H.; Yang, Q.C.; Liu, W.K. Effects of light quality on the accumulation of phytochemicals in vegetables produced in controlled environments: A review. J. Sci. Food Agric. 2015, 95, 869–877. [Google Scholar] [CrossRef] [PubMed]
  40. Iwai, M.; Ohta, M.; Tsuchiya, H.; Suzuki, T. Enhanced accumulation of caffeic acid, rosmarinic acid and luteolin-glucoside in red perilla cultivated under red diode laser and blue LED illumination followed by UV—A irradiation. J. Funct. Foods 2010, 2, 66–70. [Google Scholar] [CrossRef]
  41. Park, S.-Y.; Bae, J.-H.; Oh, M.-M.; Hoon, B.-J. Manipulating light quality to promote shoot growth and bioactive compound biosynthesis of Crepidiastrum denticulatum (Houtt.) Pak & Kawano cultivated in plant factories. J. Appl. Res. Med. Aromat. Plants 2020, 16, 100237. [Google Scholar] [CrossRef]
  42. Nguyen, T.K.L.; Oh, M. Physiological and biochemical responses of green and red perilla to LED -based light. J. Sci. Food Agric. 2021, 101, 240–252. [Google Scholar] [CrossRef] [PubMed]
  43. Taulavuori, K.; Hyöky, V.; Oksanen, J.; Taulavuori, E.; Julkunen-Tiitto, R. Species-specific differences in synthesis of flavonoids and phenolic acids under increasing periods of enhanced blue light. Environ. Exp. Bot. 2016, 121, 145–150. [Google Scholar] [CrossRef]
  44. Yeo, H.J.; Park, C.H.; Lee, K.B.; Kim, J.K.; Park, J.S.; Lee, J.-W.; Park, S.U. Metabolic Analysis of Vigna unguiculata Sprouts Exposed to Different Light-Emitting Diodes. Nat. Prod. Commun. 2018, 13, 1934578X1801301029. [Google Scholar] [CrossRef] [Green Version]
  45. Gitelson, A.; Chivkunova, O.; Zhigalova, T.; Solovchenko, A. In situ optical properties of foliar flavonoids: Implication for non-destructive estimation of flavonoid content. J. Plant Physiol. 2017, 218, 258–264. [Google Scholar] [CrossRef]
  46. Mao, P.; Duan, F.; Zheng, Y.; Yang, Q. Blue and UV-A light wavelengths positively affected accumulation profiles of healthy compounds in pak-choi. J. Sci. Food Agric. 2021, 101, 1676–1684. [Google Scholar] [CrossRef]
  47. Constantino, L.F.D.S.; Nascimento, L.B.D.S.; Casanova, L.M.; Moreira, N.D.S.; Menezes, E.A.; Esteves, R.L.; Costa, S.S.; Tavares, E.S. Responses of Crepis japonica induced by supplemental blue light and UV-A radiation. Photochem. Photobiol. Sci. 2017, 16, 238–245. [Google Scholar] [CrossRef]
  48. Piovene, C.; Orsini, F.; Bosi, S.; Sanoubar, R.; Bregola, V.; Dinelli, G.; Gianquinto, G.P. Optimal red:blue ratio in led lighting for nutraceutical indoor horticulture. Sci. Hortic. 2015, 193, 202–208. [Google Scholar] [CrossRef]
  49. Poulet, L.; Massa, G.; Morrow, R.; Bourget, C.; Wheeler, R.; Mitchell, C. Significant reduction in energy for plant-growth lighting in space using targeted LED lighting and spectral manipulation. Life Sci. Space Res. 2014, 2, 43–53. [Google Scholar] [CrossRef]
Figure 1. Butterhead lettuce and romaine lettuce grown under various light sources: RB, NWL, SWL1, and SWL2. The electrical power was held constant in experiment 1 and the PPFD was held constant in experiment 2.
Agronomy 11 02111 g001
Figure 2. Butterhead lettuce and romaine lettuce grown under various light sources with the same electrical power after 4 weeks of transplanting.
Agronomy 11 02111 g002
Figure 3. Shoot and root fresh and dry weights of butterhead lettuce (AD) and romaine lettuce (EH) plants grown under various light sources with the same electrical power after 4 weeks of transplanting. Different letters indicate significant difference at p < 0.05 (n = 4).
Agronomy 11 02111 g003
Figure 4. Leaf area, leaf number, and specific leaf weight of butterhead lettuce (AC) and romaine lettuce (DF) plants grown under various light sources with the same electrical power after 4 weeks of transplanting. Different letters indicate Scheme 0. (n = 4).
Agronomy 11 02111 g004
Figure 5. Electric current, PPFD, electricity, yield, light use efficiency, and energy use efficiency of butterhead lettuce (A) and romaine lettuce (B) plants grown under various light sources with the same electrical power after 4 weeks of transplanting.
Agronomy 11 02111 g005
Figure 6. Butterhead lettuce and romaine lettuce grown under various light sources with the same PPFD after 4 weeks of transplanting.
Agronomy 11 02111 g006
Figure 7. Shoot and root fresh and dry weights of butterhead lettuce (AD) and romaine lettuce (EH) plants grown under various light sources with the same PPFD after 4 weeks of transplanting. Different letters indicate significant difference at p < 0.05 (n = 4).
Agronomy 11 02111 g007
Figure 8. Leaf area, leaf number, and specific leaf weight of butterhead lettuce (AC) and romaine lettuce (DF) plants grown under various light sources with the same PPFD after 4 weeks of transplanting. Different letters indicate significant difference at p < 0.05 (n = 4).
Agronomy 11 02111 g008
Figure 9. Electric current, PPFD, electrical power, yield, light use efficiency, and energy use efficiency of butterhead lettuce (A) and romaine lettuce (B) plants grown under various light sources with the same PPFD after 4 weeks of transplanting.
Agronomy 11 02111 g009
Table 1. Peak wavelengths and spectral distribution of each light source used in this study.
Light SourceRange (nm)Peak Wavelength (nm)Ratio (%)
RBBlue (400–500)44447
Green (500–600)-2
Red (600–700)66551
NWLBlue (400–500)45321
Green (500–600)58642
Red (600–700)66537
SWL1Blue (400–500)43726
Green (500–600)52641
Red (600–700)66533
SWL2Blue (400–500)43719
Green (500–600)57843
Red (600–700)66438
Table 2. Electrical power and photosynthetic photon flux density (PPFD) of each light source used in this study (experiment 1: same electrical power; experiment 2: same PPFD).
ExperimentLight SourcePPFD (μmol m−2 s−1)Electrical Power (W)
Experiment 1RB129.7380
NWL161.15
SWL1172.28
SWL2167.55
Experiment 2RB147.50 ± 2.8988.59
NWL63.10
SWL165.01
SWL259.24
Table 3. Absorbance and transmittance of butterhead and romaine lettuce at each light source with the same electrical power.
CultivarLight SourceAbsorbance (%)Transmittance (%)
Blue
(380–499 nm)
Green
(500–599 nm)
Red
(600–700 nm)
Blue
(380–499 nm)
Green
(500–599 nm)
Red
(600–700 nm)
ButterheadRB97-923-8
NWL98829021810
SWL196778842312
SWL296738542715
RomaineRB98-962-4
NWL97849031610
SWL19987931137
SWL29883912179
Table 4. Absorbance and transmittance rates of butterhead and romaine lettuce at each light source with the same PPFD.
CultivarLight SourceAbsorbance (%)Transmittance (%)
Blue
(380–499 nm)
Green
(500–599 nm)
Red
(600–700 nm)
Blue
(380–499 nm)
Green
(500–599 nm)
Red
(600–700 nm)
ButterheadRB98-942-6
NWL96778642314
SWL196778642314
SWL296738442716
RomaineRB99-951-5
NWL97839031710
SWL19885922158
SWL29884912169
Table 5. Individual phenolic and flavonol contents of butterhead lettuce grown under various light sources with the same PPFD after 4 weeks of transplanting. Different letters indicate significant difference at p < 0.05 (n = 4).
Individual Compound Content
(μg Plant−1)
Light Source
RBNWLSWL1SWL2
Phenolic acidsGallic acid193.77 b z167.50 c185.05 bc241.56a
Protocatechuic acid69.46 a42.74b44.64 b47.89b
Chlorogenic acid729.54 a433.24c509.25 b691.87a
p-Hydrobenzoic acid98.28 b75.82d86.12c113.50a
Vanillic acid11.45 c20.10b9.78c23.47a
p-Coumaric acid13.70 n.d. n.d. n.d.
Ferulic acid45.52 a16.33 b17.06 b19.42 b
Veratric acid65.10 a28.37 c32.64 c47.34b
Benzoic acid280.00 a174.96 b180.61 b183.77 b
t-Cinnamic acid5.81 b4.13 d4.80 c6.72 a
Total1512.65 963.18 1069.96 1375.56
FlavonolsEpigallocatechin522.10 c637.60 b586.33 bc749.57 a
Catechin390.01 a224.36 c206.86 c270.07 b
Epicatechin156.22 a130.20 b120.18 b152.37 a
Epigallocatechin gallate80.26 a67.96 b63.11 b87.26 a
Vanillinn.d. n.d. n.d. n.d.
Rutin69.59 a8.33 c9.51 c17.92 b
Catechin gallate99.92 a1.85 d70.26 c81.77 b
Quercetin1052.95 b847.18 c977.60 b1422.73 a
Naringin80.62 a27.91 d43.30 c64.00 b
Naringenin101.25 b79.49 c105.93 b148.37 a
Formononetin25.58 an.d. 24.38 a13.64 b
Total2578.512024.882207.463007.69
z Mean separation within rows according to Duncan’s multiple range test at p < 0.05.
Table 6. Individual phenolic acid and flavonol contents of romaine lettuce grown under various light sources with the same PPFD after 4 weeks of transplanting. Different letters indicate significant difference at p < 0.05 (n = 4).
Individual Compound Content
(μg Plant−1)
Light Source
RBNWLSWL1SWL2
Phenolic acidsGallic acid342.04 a z176.88 b346.16 a254.25 b
Protocatechuic acid43.02 a17.35 bn.d. 55.21a
Chlorogenic acid1624.00 a820.43 b1470.84 a1583.90 a
p-Hydrobenzoic acidn.d. 84.44 b151.41 a136.80 a
Vanillic acidn.d. n.d. n.d. n.d.
p-Coumaric acid208.15 a50.95 c 110.53 bn.d.
Ferulic acid198.47 a39.22 c 78.94 b64.94 bc
Veratric acid190.54 a45.46 c 87.44 b87.61 b
Benzoic acid1006.31a301.05 c529.17 b542.88 b
t-Cinnamic acid5.16 b 5.11 b 9.22 a9.11 a
Total3617.681540.892783.612734.70
FlavonolsEpigallocatechin870.92 a484.09 b823.99 a934.25 a
Catechin381.06 a241.71 b395.73 a475.51 a
Epicatechin64.94 c63.73 c133.48 b203.23 a
Epigallocatechin gallate159.13a86.05 b139.56 a152.78 a
Vanillinn.d. n.d. n.d. n.d.
Rutin278.24 a60.85 c115.14 b114.22 b
Catechin gallate367.73 a104.30 c197.29 b182.16 b
Quercetin1578.36 bc1180.10 c2038.07 ab2263.71 a
Naringinn.d. 21.61 c47.49 b110.38 a
Naringenin22.48 c64.18b107.16 a113.49 a
Formononetinn.d. n.d. n.d. n.d.
Total3722.852306.613997.904549.73
z Mean separation within rows according to Duncan’s multiple range test at p < 0.05.
Publisher’s Note: MDPI stays neutral with regard to jurisdictional claims in published maps and institutional affiliations.

