1. Introduction
The EU dairy sector, including Poland, is currently facing several challenges resulting from growing global demand, the volatility of licenses, or the feed crisis caused by climatic changes. EU agricultural policy in the field of the milk market, adopted and implemented after 2015, changed the functioning of entities from this sector of the economy. The abolition of subsidies for the export of dairy products outside the EU, limiting subsidies to the private storage of dairy products and the elimination of milk quotas, has increased competition in the internal EU milk market [
1]. In addition, farmers receiving income support from the EU must comply with a set of basic rules, the so-called cross compliance rules, which include statutory management requirements and GAEC standards. Thus, dairy farmers face the challenge of how to redirect their systems to achieve multidisciplinary goals (e.g., compliance with the EU Nitrates Directive, EU Water Framework Directive, EU-NEC Directive) and in line with EU climate objectives (Green Deal) to become climate friendly by 2050 [
2]. The sector’s problems are likely to exacerbate the effects of the coronavirus pandemic, which has led to further price drops and overproduction in some regions of the EU [
3]. In this situation, only economically strong farms whose production is characterized by low marginal costs will survive on the market [
4]. The challenge for EU agriculture is to maintain and increase agricultural income while minimizing the environmental impact of agricultural production. Growth based on productivity and increasing production for a given number of inputs will be key to the sustainable growth of agricultural income and will constitute the basis for environmental sustainability of agriculture. In order to survive in a complex and constantly evolving market, dairy farms must improve their level of technical efficiency [
5]. The technical efficiency of the inputs used is an important area in animal production. Its decrease leads to an increase in unit costs and a decrease in the value of production.
Milk production is one of the most important branches of the agricultural economy in Poland. It is of great economic importance because it is a source of income for many farms and serves as a raw material base for the domestic dairy industry [
6]. Poland, next to Germany, France, the Netherlands, Spain, and Italy, is one of the main milk producers in the EU. Together, these countries are responsible for 70% of milk produced in the EU, including Poland’s share in EU production of about 8%. In world milk production, Poland ranks twelfth, with a 2% share in global production [
7]. In 2019, the value of commercial milk production in Poland amounted to 16.1 billion (3.58 billion EUR), compared with PLN 7.9 billion (1.8 billion EUR) in the year of Poland’s accession to the EU. The share of commodity milk production in the commodity value of agricultural production remains at the level of 16%–19%. In Poland, dairy cows are kept mainly on individual farms (about 95% of the domestic stock of these animals) [
6]. The condition and development potential of dairy farms has a large impact on Polish agriculture [
8]. Therefore, it is important to analyze technical efficiency and total productivity as the basic conditions of competitiveness, and economic efficiency as the basic condition for the profitability of dairy farms. This study focuses mainly on the prices of the necessary production inputs expressed by individual cost items, which are the key factors building competitive advantage and determines the efficiency of farms.
The reason for taking up the topic is the knowledge gap expressed in the lack of contemporary research on changes in the productivity of Polish agriculture, including dairy farms. The problem of the technical efficiency of these farms is relatively well recognized in Poland [
9,
10,
11,
12], while contemporary research on farm productivity is lacking. Most of the work in this field carried out in Poland concerned the measurement of productivity using the Malmquist index and was carried out before accession to the European Union, e.g., [
13,
14,
15] while contemporary research on the productivity of Polish agriculture is partial and based on macroeconomic data. In the period after 2004, this problem was not researched at the farm level.
Furthermore, our research fills a gap in the research on the measurement and evaluation of the efficiency and productivity of dairy farms. Previous studies in this area have mainly used the DEA method and estimated the Malmquist and Färe–Primont total productivity indices on its basis. There is relatively little research using taxonomic methods. The assessment of effectiveness in such an approach constitutes an original approach to the studied phenomenon.
Relatively few publications that use taxonomic methods, including cluster analysis, can be found in the literature regarding agriculture and agricultural economics. A popular method from this group is the
k-means method, used both in Polish and global research. For example, Pietrzykowski and Kobus [
16] classified selected EU countries on the basis of economic and production results of agricultural holdings. Cluster analysis was performed using three methods: single bond, Ward, and
k-means. The types of rural households were also distinguished by Adamowicz and Nowak [
17]. The
k-means method was used, assuming 5 clusters. This method was used in the work of Głębocki et al. [
18] to identify the characteristics of contemporary types of agriculture occurring in Poland and to check the usefulness of the
k-means method in agricultural research using a large number of variables and territorial units. The
k-means method and PCA were used in the work of Hornowski et al. [
19]. The primary objective of this research was to present the direction of changes in the number of small farms in central and eastern Poland and to indicate the factors determining their functioning and development. Three types of farms were identified: “hobby”, “two-occupation” and “professional” farms. The purpose of the paper by Baer-Nawrocka and Barczak [
20] was to classify FADN macroregions in the European Union into types by production potential of farms specializing in cow milk production in 2008 and 2017. Hellwig’s method of linear ordering, used in the identification of development patterns, was employed in the calculation of the synthetic indicator of production potential of milk holdings for each macroregion in order to determine their types. The paper of Nowak and Różańska-Boczula [
21] contains an evaluation of the differentiation of the production potential and efficiency of farms in the member states of the European Union in 2013–2016. To this end, a taxonomic method—Hellwig’s development measure—was used. The study was based on data from the European Union Farm Accountancy Data Network (FADN). Fourteen diagnostic variables were selected characterizing the production potential, efficiency of utilization, and production and economic results. The method proposed by Hellwig and Ward’s clustering method were used in the manuscript of Reiff et al. [
22]. The main aim of the article was to analyze differences in agricultural performance across the European Union countries in the years 2010–2013. In world literature, one can find many works relating to agriculture, also to agricultural economics, in which the methods of multivariate comparative analysis are used, including classification or ordering. For example, Goswami et al. [
23] used multivariate statistical techniques such as principal component analysis (PCA) and cluster analysis (CA). The manuscript presents a study, conducted in the coastal saline zone in India, that demonstratively established the usefulness of such methodology in the identification of predominant farm types and their characterization. The same methods, i.e., principal component analysis (PCA) and cluster analysis (CA—
k-means method) were used in the work of D’Amico et al. [
24]. The research is focused on the analysis of agricultural features in 247 regional areas (NUTS 2) of all European countries; it has been carried out adopting a principal components analysis (PCA) to identify the main factors that differentiate agricultural systems in EU countries, considering a specific set of social and economic indicators. The purpose of the paper by Hloušková and Lekešová [
25] is to examine the internal structure of Czech agricultural holdings based on a multicriteria evaluation of the five dimensions representing the main functions of agriculture, which include production, economic factors, financial stability, environmental, social and other factors. A cluster analysis was performed to identify two clusters of farms. The classification of agricultural holdings into clusters was carried out using the
k-means vector quantization method. Homogeneous clusters of agro-industrial enterprises, based on certain criteria, function effectively in the relevant market segment of Ukraine as a basis for ensuring effective strategic management [
26]. The research was conducted on the basis of data on the results of the activity of Ukrainian agro-industrial enterprises. Using cluster analysis, the distribution of the main agribusiness enterprises into four clusters was substantiated and the criteria for their classification according to the established indicators were determined. The paper of Weltin et al. [
27] presents the problem concerning different forms of income diversification. The decision to diversify economic activities on or off the farm heavily depends on agricultural business and household characteristics. Factor and cluster analyses depicted six farm types. The typology proved valid across all case studies.
Our research fills a gap in research on measuring and evaluating the efficiency and productivity of dairy farms. Previous studies in this area have mainly used the DEA method and estimated the Malmquist and Färe–Primont total productivity indices on its basis. There has been relatively little research using taxonomic methods. The assessment of effectiveness in such an approach constitutes an original approach to the studied phenomenon. Our research is crucial for dairy farmers as well as policymakers. For farmers, understanding how different factors affect their technical performance is a helpful tool to improve their productivity and profitability. From the point of view of decision-makers, knowing the distribution of technical efficiency and the ultimate productivity of dairy farms, it will be possible to develop an effective policy supporting the competitiveness of this industry [
5].
The presentation of this research is structured as follows. First, the literature on the efficiency of dairy farms and its determinants is presented. Secondly, the material and methods used in the study are described. The third part presents the results of the study, which consist of two main stages. First, relatively homogeneous types of dairy farms in Poland were identified in terms of their economic efficiency based on selected structural and economic factors. In the next stage, the technical efficiency was estimated, and then the total productivity of dairy farms was measured by type. Then, in part four, we try to assess the efficiency and total productivity of dairy farms. In the last part, we present our main conclusions and recommendations.
Literature Review
The production efficiency of dairy farms has been the subject of many studies in the past. Various methods have been used to measure it, but the most common were indicative, non-parametric and parametric methods. The importance of these studies and their practical significance stems from the need to improve the competitiveness of agricultural production, including livestock production. The literature to date shows that various factors affect the technical efficiency and total productivity of dairy farms. Yilmaz et al. [
28], using the StochasticFrontier Analysis (SFA) to analyze the technical efficiency of dairy farms in the western Mediterranean region of Turkey, proved that the most important factors affecting the efficiency of dairy production were: farm size, total cattle population, and the ratio of dairy cows to the total population, technological level, type of barn and production of maize silage. Alem [
29] adopted a dynamic parametric approach to estimate the technical efficiency of Norwegian dairy farms. The study was aimed at assessing the level of efficiency considering the marginal effects of environmental (exogenous) variables. Dynamic production technology was modeled in terms of five inputs: land, labor (total number of working hours used on the farm), materials (feed and energy costs), fixed assets and gross investment. As the research results show, environmental variables such as the ratio of debt to assets and the number of subsidies had a significant negative impact on the technical efficiency of Norwegian milk products. Farmer’s experience had a significant positive effect on productivity, while income from outside the farm had no effect on the efficiency of Norwegian dairy farms. Similar conclusions were drawn by Silva et al. [
30] examining the technical efficiency of dairy farms in Portugal (Azores) using the DEA method. The main findings of the researchers indicate that there are no significant differences in the technical efficiency of dairy farms with or without supplementary income sources. However, more technically efficient farms are those for which the farm is the main source of income. Ma et al. [
31] used the stochastic boundary function model to estimate the factors influencing the technical performance of New Zealand dairy farms. The results indicate that the intensification of the use of complementary feeds, farm size, herd size, farm location, frequency of milking, labor costs, other costs (e.g., fertilizer, machinery, fuel, repair, and maintenance) are important factors influencing the technical efficiency of New Zealand dairy farms. Ma et al. [
32] also proved that the efficiency of dairy production of farms in New Zealand is positively influenced by the intensification of production, irrigation intensity, frequency of milking, cattle breed, and the stocking rate, while the profitability of dairy production is positively influenced by the price of milk, type of activity, milking frequency and stocking ratio. The debt ratio, in turn, significantly reduced the technical efficiency of these farms. Parlakay et al. [
33] conducted a study whose aim was to estimate the technical efficiency of dairy farms in the Hatay province in Turkey using the DEA method. Annual milk production, concentrated feed, roughage, veterinary costs, and human labor were used as variables of the productivity model in the analysis. It has been proved that herd size and doses of concentrated feed as well as the farmer’s experience have a positive effect on the technical efficiency of dairy farms. Increased herd size and the proportion of concentrated feed in the total forage will increase profitability. Excessive use of inputs was associated with veterinary costs and outlays of manpower. Luik-Lindsaar et al. [
34] assessed the technical efficiency of Estonian milk producers using the DEA method and identified factors related to it. The results obtained from the analysis show that the higher income of milk and other products per dairy cow is characteristic of effective farms. The group of effective farms uses less labor and agricultural land per dairy cow. Luik-Lindsaar et al. [
35] also prove that the technical efficiency of Estonian dairy farms was influenced by the following factors: higher total relative breeding value, shorter lifetime of the cow, higher lifetime productivity, better milk hygiene (lower somatic cell count), number of dairy cows, and the cost of purchased feed. Michaličková et al. [
36], assessing the technical efficiency of milk production in Slovakia and its determinants, proved that feed costs have a negative impact on the efficiency of milk production. The negative impact of this factor indicates ineffective use of feeds (balance of feed mixtures, losses during storage, feed substitution) or ineffective use of their production potential in relation to the level of milk production. In contrast, material, repair and service costs, depreciation and overheads did not have a significant effect on the technical efficiency of Slovak dairy farms. Jan et al. [
37], when assessing the long-term technical efficiency of Swiss dairy farms located in mountain areas, while taking into account both social, economic and environmental resources, have shown that technical efficiency is positively influenced by: farm size, a focus on non-agricultural income, milk production intensity and ecological production system, and that negative impacts on the technical efficiency of dairy farms are: part-time work, off-farm work, intensity of feed and concentrate use, age and education of the farmer. Bahta et al. [
38], by analyzing the level and determinants of technical efficiency on dairy farms in Tanzania with the use of SFA, have proven that increasing the number of cattle, additional veterinary and fodder inputs increase the technical efficiency of dairy farms. The efficiency of dairy farms also improves access to credit, training, and membership in producer groups. Kimura and Sauer [
39], comparing the dynamics of productivity growth of dairy farms in Estonia, the Netherlands and the United Kingdom, showed that political factors have a strong influence on the increase in productivity on dairy farms. In Estonia, the increase in the productivity of the dairy farm sector was largely due to the reallocation of resources on larger farms. In the Netherlands, productivity increased through technological adaptation and efficient use of resources, and in the United Kingdom, productivity gains resulted from structural changes such as the departure of smaller farms and the expansion of remaining farms. In addition, the performance of dairy farms is related to farm characteristics such as farm management practices and natural conditions. Regarding farm management practices, high productivity dairy farms have a higher stocking density, they tend to make intensive use of purchased feed and achieve higher dairy yields. Moreover, they are located in more geographically advantageous areas. The use of milking equipment, such as a milking robot and a parlor, has been found to have a significant and positive effect on the level of productivity. More investment in labor-saving technology by increasing herd size determines the productivity growth path at farm level. Adopting organic production technology has been proven to reduce productivity. In general, organic farms are less material-intensive and tend to obtain a higher price of milk. A higher level of non-farm income is also associated with a lower level of technical efficiency. Farms with a higher level of non-agricultural income can reduce the intensity of agricultural inputs and reduce investment in production technology that improves productivity while receiving decoupled payments. Similarly, the share of subsidies in farm income has a significant and negative impact on productivity.
Alvarez and Corral [
40] used a stochastic hidden boundary class model to estimate the technologies of Spanish dairy farms according to the degree of their intensification. The intensification measurement was based on four variables, such as: milk per cow, milk per hectare, purchased feed per cow and cows per hectare. They proved that intensive technology is more efficient than extensive, and that intensive farms are more technically efficient than extensive.
Allendorf and Wettemann [
41] examined whether animal welfare influences the efficiency of German dairy farms. Efficiency was tested using the DEA method. The study assumed five inputs (capital, labor, agricultural area, costs of materials and services, sewing inventory) and two outputs (revenues from milk production per dairy cow, production produced on the farm and changes in the price of animals). The results indicate that, in particular, a higher percentage of cow losses, a higher replacement rate and a longer period between calving, with an appropriate average, had a negatively marginal impact on the technical efficiency of the researched farms. On the other hand, the lower age of first calving, higher milk yield and higher number of somatic cells were positively correlated with technical efficiency. In the context of Poland, the issue of technical efficiency and productivity of dairy farms was raised in the research, among others, by Świtłyk [
42,
43], Marzec et al. [
11], Borecka et al. [
44] and Adamski [
45]. Świtłyk [
42], determining the technical efficiency of dairy farms depending on the size of a herd of cows using the DEA and SFA methods, showed that, according to the BCC model, farms with the smallest (<10 cows) and the largest (>40 cows) herds of cows had the most technical efficiency, while in the SFA model the highest technical efficiency coefficients were characteristic of farms with the largest herds of cows (
<40 and >40 cows). The model assumed the sum of revenues from milk sales and processed products, live cattle, balances of subsidies and taxes, with inputs such as agricultural land area, number of dairy cows, yield costs, purchased feed, other direct costs of animal production, maintenance costs of machinery and equipment, energy costs, and amortization costs. In subsequent studies by Świtłyk [
43], using the DEA method and the CCR and BCC models and adopting the same set of variables, proved that in the CCR model the highest technical efficiency coefficients were characteristic for large farms, while the lowest scale efficiency coefficients were found for medium-small farms. The highest technical efficiency coefficients for the CCR, BCC and scale efficiency models were recorded on farms with the highest milk yield. In the CCR model, the lowest coefficients of technical efficiency and scale efficiency were characteristic for farms with the lowest milk yields. The highest technical efficiency coefficients were recorded on farms with the largest herds of cows, while the lowest technical efficiency coefficients in the CCR, BCC and scale efficiency models were recorded on farms with the smallest herds of cows. It is worth noting that the highest scale efficiency coefficients were found in the case of farms with herds of 30–45 cows. The aim of the study by Marzec et al. [
11] was a comparison of the results on the technical efficiency of dairy farms obtained using the DEA method and Bayesian stochastic border analysis (BSFA). Six production factors were distinguished in the analysis: physical capital, labor, materials (including energy), fodder (concentrated and voluminous, purchased or produced), agricultural land and animals in total. Overall results indicate that in DEA some farms have diminishing returns to scale. On the other hand, the BSFA found that all farms are characterized by increasing economies of scale. Borecka et al. [
44], when analyzing the efficiency of family farms producing milk using the DEA method, took into account, among other things, the cost of their own feed, the cost of purchased feed, the cost of animal purchases, the cost of veterinary services, drugs and insemination, costs of energy carriers directly related to milk production and other costs of milk production. They showed that an important factor determining the efficiency of dairy farms was the production scale. The larger size allowed the generation of higher income, while reducing unit production costs. Farms with a larger scale of production showed a relatively higher degree of technical efficiency, and thus used production techniques that ensured a relatively higher degree of production profitability. Adamski’s paper [
45] was an assessment of the effectiveness of the functioning of Polish dairy farms against the background of similar farms from selected EU countries using the input-oriented Malmquist productivity index, based on the CCR model. Total production value was adopted as an effect for the model, as inputs: labor costs (product of working hours and wage paid for hired labor on the farm), operating costs (total costs less costs of salaries and depreciation) and value of assets. The conducted research showed that a decline in technical progress contributed to a decrease in productivity. On the other hand, technical efficiency increased mainly as a result of the operation of milk quotas in the EU.
On the basis of the review of the research conducted so far in the field of efficiency and total productivity of dairy farms, it may be noticed that efficiency and total productivity are a product of the influence of both economic and non-economic factors. In research on the factors determining the efficiency level of dairy farms, it is difficult to define the role of one factor, because these factors are interrelated and affect the level of efficiency and productivity in a synergistic manner.
2. Materials and Methods
The survey is based on a dataset from the national system for the collection and use of farm accountancy data (FADN). The surveyed group consisted of 730 of the same farms in each surveyed year. The research period covered the years 2008–2017. Three years were analyzed in detail: 2008, 2012 and 2017. The moments selected for the analysis referred to the beginning, the end and one of the middle moments of the analyzed period.
The following methods were used to achieve the goal, i.e., to evaluate the technical efficiency and productivity of dairy farms in Poland in 2008–2017:
nonparametric method—data envelopment analysis (DEA),
aggregated Färe–Primont indices,
classification of objects—iteration-optimization method—k-means.
In the research, to calculate the technical efficiency with the DEA method, the technique presented by Coelli, Rao and Battese in the paper “An introduction to efficiency and productivity analysis” [
46] was used. Efficiency testing using DEA consists in determining reference objects and comparing other objects to them. The DEA method examines the relative efficiency of the compared objects, called decision-making units (DMU). DMUs have an impact on the level of inputs and results obtained, and the optimal weights are calculated on the basis of data and are not determined subjectively [
47]. The applicability of the DEA method is justified and correct only if all DMUs perform the same or similar activity. Only then is it possible to identify a common group of inputs and outputs that are relevant to the analysis [
48]. If
constitute a set of homogeneous units,
is the input matrix and
is the output matrix for an assumption that the efficiency of a given production factor is the quotient of a given input to the intended effect, it can be written that the efficiency is expressed by the following formula:
where:
are the weights matching the
j-th input and
are the weights matching the
k-th output. DEA models maximize the efficiency measure of the analyzed unit
Uq, provided that the efficiency rates of all other units are less than or equal to one. Input and output weights must be greater than zero at the same time to include all considered characteristics in the model.
Depending on the choice of orientation of the built model, i.e., whether the tested efficiency is to be focused on inputs or on effects, the measure can be converted to a linear form. Most often this is done using two models in accordance with the solutions proposed by their creators:
The Charnes, Cooper and Rhodes (CCR) model [
49] is input-oriented, aiming to minimize the input, while maintaining a constant level of effects. The entity is effective when its effectiveness measure is 1, and ineffective when its effectiveness measure is lower than 1.
The Banker, Charnes and Cooper (BCC) model [
50] is results oriented, i.e., the maximization of effects; An effective entity is one that achieves the greatest effects with a constant level of outlays.
CCR models refer to fixed economies of scale and were insufficient to describe variable scale effects issues. Modification through the introduction of a variable scale effect took place in the BCC models. In order to evaluate the effectiveness, a ranking of the studied objects was constructed, using the BCC-I input-oriented model, in which:
subject to:
The constant ε represents an infinitely small number (it plays the role of a lower bound for weights determining the importance of individual effects and inputs, so as to prevent them from assuming zero values).
The Färe–Primont total productivity index was proposed by O’Donnell in 2008 [
50] and it belongs to a group of complete productivity indices, fully multiplicative and enabling multitemporal (over time) and multilateral (between DMU) comparisons. This index was created by combining two indices developed by Färe and Primont and meets the requirements of the axiomatic theory of numerical indexes [
51,
52]. The Färe–Primont total productivity index is defined as the relation of the aggregated indices of the productivity of effects to the aggregated indices of the productivity of inputs. O’Donnell, 2008 [
51] showed that all complete productivity indices can be decomposed into indices of technological change and indices of efficiency changes. Efficiency-change indices, in turn, can be broken down into technical efficiency change indexes, scale efficiency change indexes and mixed efficiency change indexes.
The index of changes in total productivity for DMUs over the period between
t and
t + 1 is as follows:
where:
are the vectors of the number of inputs and outputs and the observation period that was chosen to be representative of the study,
respectively are functions of the distance of effects and inputs.
The first part of the formula to the right of the equation is the effect change measurement index, and the second part of the equation is the input change index. This equation is the relation of the productivity indices of effects and inputs.
Technological changes may be associated with a change in the maximum achievable productivity from one period to another, while a change in efficiency may be due to the difference between the observed and the maximum possible efficiency.
The efficiency component (
TFPE) of the Färe–Primont productivity index can be defined as:
where
TFPt is the observed
TFP, and
TFPt* is the maximum possible
TFP of all DMUs at time
t. The formula for
TFP changes between the period
t and
t + 1 can be derived from the above formula:
In the above equation, the relation is a technological change in the Total Productivity Index (TFP). The quotient of is the change in efficiency (TFPE).
The change in efficiency can be decomposed into a change in technical efficiency and a change in mixed scale efficiency:
where:
OTE—Technical Efficiency of Effects and
OSME is Effect Oriented Mixed Efficiency of Scale.
Based on the components of the Färe–Primont total productivity index outlined above, changes in the
TFP index between
t and
t + 1 can be presented for effects as follows:
where:
/
are technological changes.
It should be emphasized that all of the TFP Färe–Primont decompositions presented also apply to input-oriented calculations. The orientation of the calculations of both the DEA technical efficiency model on input (inputs) and the calculations of the Färe–Primont index assumes that most operational decisions on farms are made in this way.
In the literature, you can find various approaches to the models of dairy farms in which methods of determining efficiency and productivity are used. These models are built on the basis of available data, which most often come from farm accounting and/or breeding documentation. These models have a different degree of data aggregation, which results from their availability. In the study, the results of which are used in this article, the farm model was built on the basis of FADN data and consisted of 1 effect (Y) and 8 inputs (X). The assumption of this model was to consider the main areas of operational decisions made on dairy farms.
The calculation of the Färe–Primont index uses the DEA method based on linear programming to estimate production technology and the level of productivity and efficiency. For each year of research, the technical efficiency coefficients and the value of the Färe–Primont index and its basic components were calculated. The study did not analyze the elements included in the efficiency change index, as this problem will be analyzed separately.
Among the methods belonging to the optimization-iterative group, the
k-means method is very popular. The idea of the
k-means method was developed in the 1950s by Dalenius, who presented an iterative procedure for dividing a population into k groups in order to minimize the amount of within-group variance. Cox [
53] gave a function measuring the number of losses related to the division of objects into k groups according to a one-dimensional variable with normal distribution. A generalization for the multidimensional case was presented by Sebestyen [
54]. MacQueen [
55] considered the effectiveness of the
k-means method from the point of view of the random selection of objects to the selected groups.
The starting point for optimization methods is to determine the desired number of groups of objects. Then, the initial composition of each group is established as follows [
56]:
at random,
using the assessments of experts,
by using an arbitrarily selected variable,
taking as a preliminary breakdown, the grouping obtained by any taxonomic method,
arranging objects according to their distance from the center of gravity of individual groups of objects; the centers of gravity of groups of objects are objects with numbers determined by the formula where r is a consecutive group number, is the total part of the quotient of n units by the number of k groups.
Optimization methods seek to improve the pre-grouping of objects by moving objects between groups to optimize the grouping. Clustering optimization is performed from the point of view of a defined criterion of goodness of clustering. Individual optimization methods differ from each other due to differently defined optimization criteria and different procedures.
One optimization methods is the
k-means method. The
k-means method (KM) can be used to determine the number of different clusters by minimizing the between-cluster sum of squares. An iterative calculation technique is used to determine the cluster centers by relocating subjects from one cluster to another without reducing the sum of squares [
57].
Let
be a given dataset to be analyzed, and
be the set of centers of clusters in
dataset in
p dimensional space (
). Where
n is the number of objects,
p is the number of features, and
k is the number of partitions or clusters. Clusters are described by their member objects and by their centers. Usually, centroids are used as the centers of clusters. The centroid of each cluster is the point to which the sum of distances from all objects in that cluster is minimized. By using a partitioning clustering algorithm,
is partitioned into
k clusters with a goal of obtaining low within-cluster and high between-cluster heterogeneity. That is, a cluster consists of objects which are as close to each other as possible, and as far from objects in other clusters as possible [
58].
A KM algorithm aims at minimizing an objective function known as squared error function given in Equation (8) as follows [
58]:
where:
—the chosen distance measure which is generally in Euclidean norm:
,
represents the number of data points in
ith cluster. KM algorithm involves the following steps [
58]:
Centroids of c clusters are chosen from X randomly.
Distances between data points and cluster centroids are calculated.
Each data point is assigned to the cluster whose centroid is closest to it.
Cluster centroids are updated by using the formula in Equation:
Distances from the updated cluster centroids are recalculated.
If no data point is assigned to a new cluster the run of algorithm is stopped, otherwise the steps from 3 to 5 are repeated for probable movements of data points between the clusters.
For the calculation of technical efficiency with the DEA method, the Frontier Analyst ver. 4.2.0 by Banxia Software was used, while the Färe–Primont total productivity index calculation used the R “Productivity” software package developed by Dakpo et al. [
52] at the French National Institute for Research on Agriculture Food and the Environment. The Statistica 12 program was used to classify farms.
3. Results
Based on the literature review and the availability of data for analysis, 10 variables characterizing the economic efficiency of the functioning of dairy farms were adopted (
Table 1).
In order to present the traits in the form of indicators and obtain their comparability, all traits, excluding AWU, were converted per cow.
By distinguishing the set of final diagnostic features in each examined year, the variability of the features was examined using the coefficient of variation. All the features were characterized by a strong variability—over 10%. In the next step, also in each of the analyzed years, Hellwig’s parametric method for selecting features was used [
59]. The parametric method of selecting Hellwig’s features is based on a matrix of correlation coefficients between the variables. Variables that are strongly correlated with other variables are excluded from the study, so only those variables for which the Pearson correlation coefficient was lower than 0.5 remained in the study.
The basis for determining the set of final diagnostic features was the frequency of the appearance of a given feature in the entire analyzed period. The final set of diagnostic features, which is the basis for further research, is presented in
Table 2.
The values of the basic descriptive parameters of the features adopted for the study are presented in
Table 3.
When analyzing the values of indicators included in
Table 3, one can notice high values of all coefficients of variation, from 31.08% for feature
X2 in 2012 to 62.39% for
X5 in 2012. The analyzed indicators are also characterized by a strong or very strong asymmetry, expressed by the asymmetry coefficient amounting from 1.15 for
X1 in 2017 to 3.32 for
X3 in 2017. Moreover, it may be noticed that the right-hand direction of the asymmetry is maintained in each of the analyzed years. This means that the research is dominated by farms where the values of the indicators have lower values than average. In the case of such traits as
X4,
X5 and
X6, there were significant increases in average values, e.g., where yield costs, being the sum of the costs of fertilizers, seeds, and plant protection products, increased by 31.8% in 2017 compared with the same outlays in 2008.
On the basis of the obtained set of diagnostic features, farms were classified using the k-means iteration-optimization method. The Ward agglomeration method was used to determine the number of classes of farms. Analyzing the course of the non-linear ordering of farms in the form of dendrograms and the connection distances of groups of objects, it was found that the “stop” condition indicates the selection of four classes/types of farms in each surveyed year.
We also checked, using the variance analysis test (Anova), whether the obtained types of farms differ significantly in each examined dimension (significance level was assumed equal to 0.05). It was found that in each examined year the variables X1 and X3–X6 significantly differentiated the types of farms obtained (). Only the X2 variable in 2008 and 2012 did not show statistical significance in differentiating farm types ( and for 2008 and and for 2012). In 2017, statistical significance was noted for the X2 variable ( and ). For this reason and considering the substantive nature of the X2 variable, it was adopted in the study in each year of the analysis.
As a result of the application of the
k-means method, four types of farms were distinguished in terms of efficiency and productivity.
Table 4,
Table 5,
Table 6 and
Table 7 present the number of farms included in each type and their characteristics, indicating the level of each variable as: lowest, low, medium, high or highest, and average values for each variable. The indicated levels of variables were obtained on the basis of numerical values assumed by the variables in individual types of farms.
Type one (I)—dairy farms with an average agricultural area per cow. These farms recorded average labor inputs in operating activities in 2008 and 2012. In 2017 this group had the lowest labor inputs in operating activities. In all analyzed years, these farms were characterized by an average level of energy costs and a high level of depreciation costs. The maintenance costs of machinery and equipment were at an average level, except for 2017, when these farms showed a low level of these costs. On average, 31% of all analyzed dairy farms belonged to this type of farm. The number of farms belonging to this type increased in 2017 by 112.9% compared with 2008.
Type two (II)—dairy farms with the smallest agricultural area per cow and the lowest labor inputs as part of operating activities and the lowest direct costs (fertilizers, seeds and plant protection products and animal feed), energy, depreciation and costs maintenance of machinery and buildings. This group included very small farms. The minimum area of agricultural land was 2.5 ha. On these farms, farmers kept an average of 24 cows, and the average milk yield of cows was 4965 L, which was the lowest among all types of dairy farms. This group contains the highest number of farms, constituting on average 41% of all analyzed dairy farms. The number of farms in this group in 2017, compared with 2008, did not change.
Type three (III)—dairy farms with the highest or medium labor inputs as part of operating activities, a large area of agricultural land per cow, the highest or high maintenance costs of machines and buildings, high direct costs (fertilizers, material and plant protection products and animal feed) and energy. At the same time, these farms showed low or medium depreciation costs. This type of farms included, on average, 16% of all analyzed dairy farms. The number of farms belonging to this type decreased in 2017 by 56.1% compared with 2008.
Type four (IV)—dairy farms with high labor inputs as part of operating activities, the highest average agricultural land per cow and the highest or high direct costs (fertilizers, seeds and plant protection products and animal feed) and energy. At the same time, the group of these farms was characterized by high maintenance costs of machines and buildings and the highest depreciation costs. In this group of dairy farms in the analyzed years, an average of 25 cows were kept, and the milk yield amounted to 5590 L. This group included dairy farms with an area of more than 5 ha of agricultural land. This group also recorded the highest average agricultural area. This type of farms included, on average, 12% of all analyzed dairy farms. The number of farms belonging to this type doubled in 2017 compared with 2008.
Due to the fact that the distributions of most of the studied variables are not normal distributions, the non-parametric Kruskal–Wallis [
60] test and post hoc tests were used to verify the hypothesis regarding whether the obtained types of farms in the studied years differ in terms of the size of the variables.
The type one group of farms differs in terms of each variable ( for all variables). The type two group of farms is differentiated in terms of X1–X5 variables (). On the other hand, the variable X6 does not affect the differentiation of type II farms (). The differentiation of type three farms in the analyzed years was influenced by X1, X2 as well as X4 and X5 (). The X3 and X6 variables had no effect on the differentiation of type three farms in the three examined years ( and ). In the case of the type four group of farms, a similar situation occurred, i.e., the variables X3 and X6 ( and ) had no influence on the differentiation of farms included as type four in the analyzed years.
In the second stage of the study, the effectiveness and productivity of dairy farms were measured according to their types. The research used a dairy farm model, which consisted of one output (effect) and eight inputs (outlays). The output variable (effect) was the sum of revenues from the sale of milk and dairy products, live cattle, live calf, and operating subsidies. Input variables (outlays) were:
total labor input in AWU,
land input (utilized agricultural area in ha),
material costs (seeds and plants, fertilizers, crop protection, other crop specific costs, feed for grazing livestock, feed for pigs and poultry, and other livestock specific costs in PLN),
feed for grazing livestock (purchased concentrates, other direct costs of livestock production) in PLN,
machinery and buildings current costs in PLN,
energy cost (motor fuels and lubricants, electricity, and heating fuels) in PLN,
depreciation cost in PLN,
number of dairy cows (LU).
It was assumed that all input variables (outlays) reflect the most important areas of a farmer’s operational decisions. In the calculation of technical efficiency and the Färe–Primont index, a model aimed at minimizing inputs was used, assuming variable effects of scale (VRS).
Table 8 provide the classification of dairy farms included in each type and the average values of the BCC and TFP indicators.
The information in
Table 8 shows that the highest average BCC value was recorded for the second type of farms in 2008, and the lowest for type four in 2017. Moreover, a downward trend in the value of the technical efficiency coefficient can be observed from year to year, in each type of farm. The opposite situation occurred in the case of TFP values, which, although they did not reach high values, increased year by year.
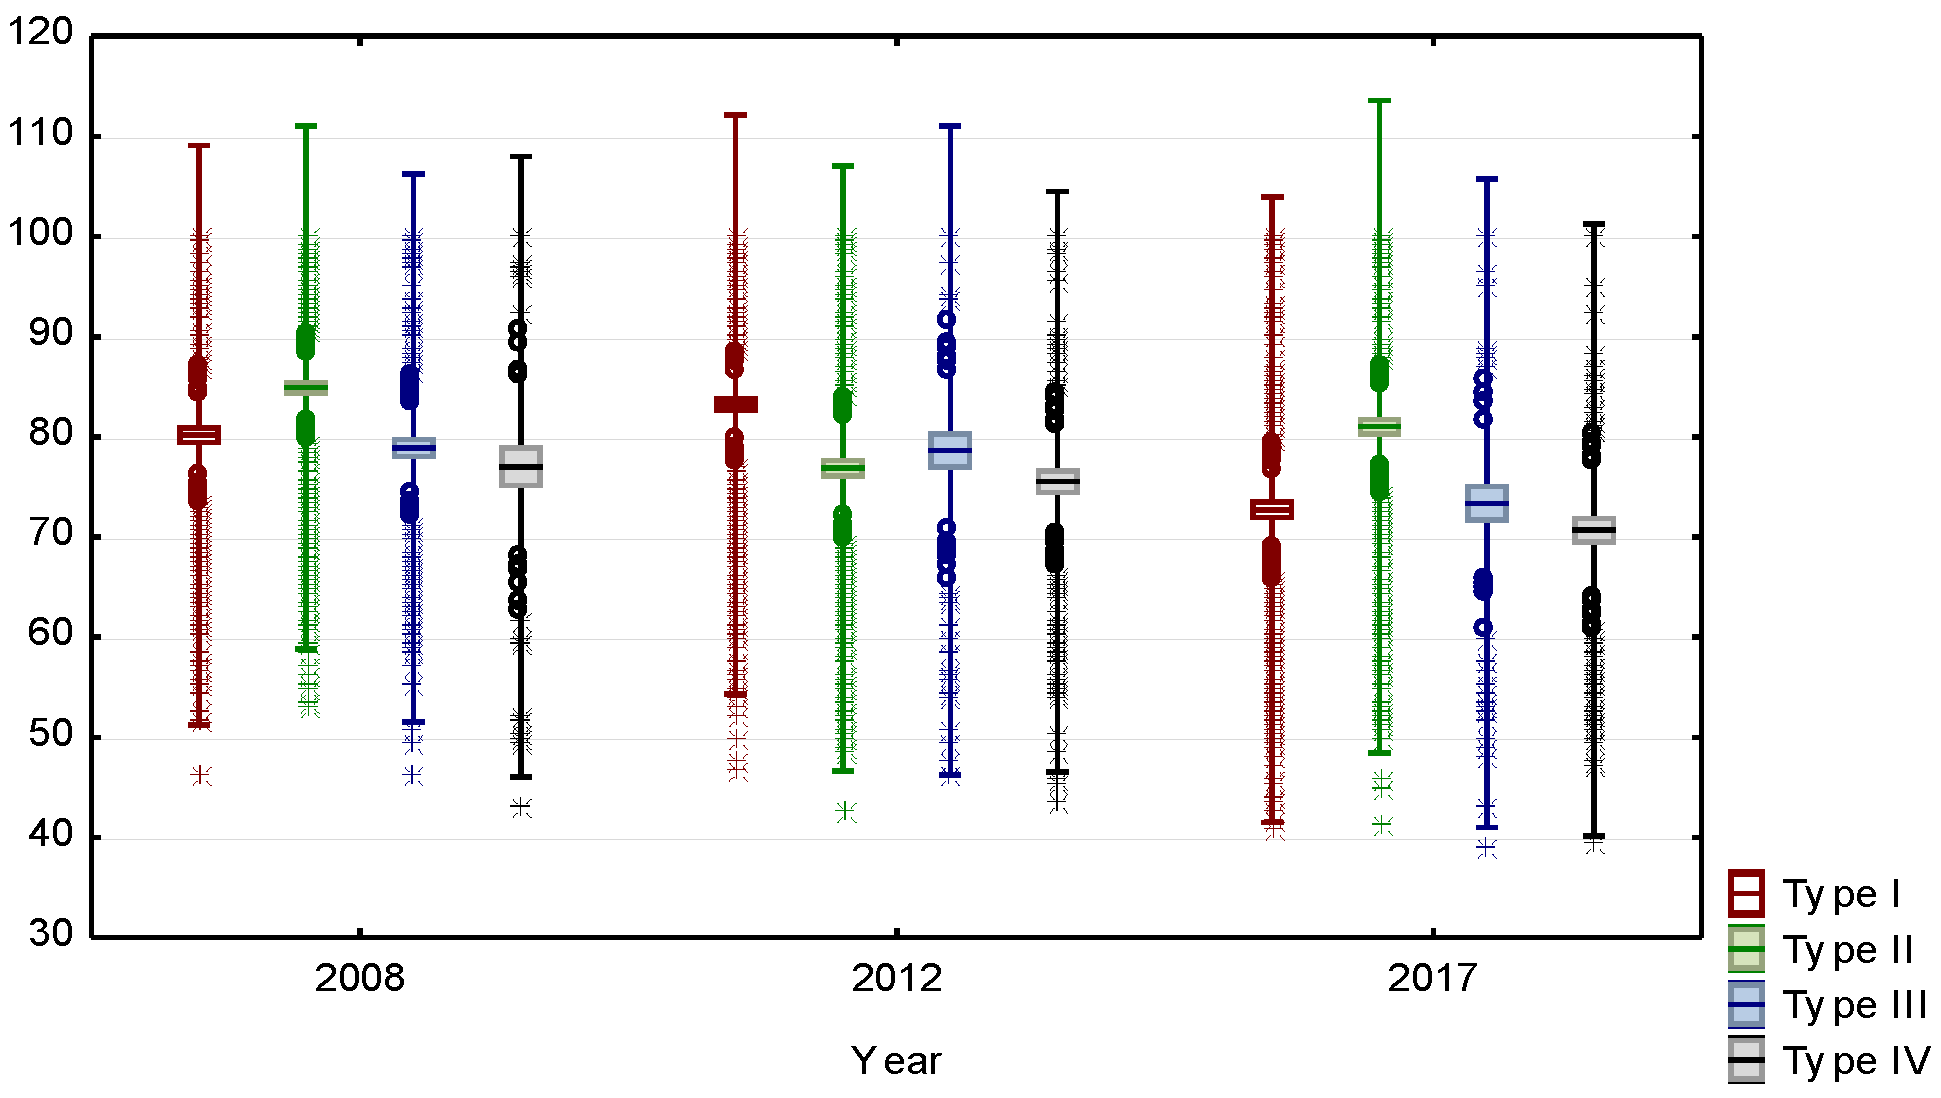
Figure 1 presents the distributions of BCC values in the studied years and in particular types of farms.
The BCC distributions are in most cases characterized by a weak left-hand asymmetry, e.g., in 2008 and 2012 in the type one group of farms, in 2008 and 2017 in type two, in 2012 in type three and in 2008 and 2012 for the type four group of farms. In the remaining cases of distributions, a weak or moderate right-hand asymmetry was noted (e.g., in 2017 in the type four group of farms). The greatest variability, calculated as the difference between the maximum and minimum values, is characteristic for the BCC values in 2017 in type three group of farms, and the lowest in the BCC values in 2008 in type two.
In the case of distributions related to TRF values (
Figure 2), a right-handed, in many cases strong, asymmetry was found. The strongest asymmetry in terms of TRF value was characteristic for the type four group of farms in 2008 and the type one group in the same year. Only for the type four group in 2012 is there a weak negative asymmetry recorded. The distribution of TRF values was characterized by a similar variability, only a higher variability was observed in 2017 in the type one group.
The dominant left-hand direction of asymmetry in the case of the distributions of the BCC coefficient proves that in the researched types of farms the majority of farms with the value of the BCC coefficient is higher than average. On the other hand, the right-hand asymmetry of the distribution of the TRF coefficient value indicates the presence of a greater number of farms characterized by a lower TRF value compared with the average value. However, as previously noted, the values of the TRF coefficient show an upward trend in the selected types of farms.
4. Discussion
Our study provides evidence for the diversification of economic efficiency, technical efficiency, and total productivity of dairy farms in Poland and the influence of a number of factors determining their level.
The
k-means cluster analysis made it possible to identify relatively homogeneous types of dairy farms in Poland in terms of their economic efficiency, based on selected structural and economic factors. The distinguished types of dairy farms were diversified in terms of the agricultural land area owned, labor inputs, or inputs incurred in connection with the conducted production. However, higher production inputs incurred on dairy farms did not translate into higher results of the conducted activity. In all types of analyzed dairy farms, the technical efficiency coefficient was lower than 85%. The results show the relative homogeneity of TFP levels between the particular types of dairy farms in all analyzed years. At the same time, it should be noted that there was an increase in the total productivity of dairy farms in Poland in all types of analyzed farms, with a simultaneous decrease in technical efficiency. As Petrick and Kloss [
61] point out, total factor productivity reveals the common effects of many factors, including new technologies, economies of scale, managerial skills, and changes in the organization of production. Farmers achieved an improvement in productivity; however, they still used the available production technology in a suboptimal manner. Given that higher production can be achieved with better technology, higher input utilization and/or higher technical efficiency, it is possible that dairy farmers achieve high production results simply because of a high level of input consumption rather than an efficient use of inputs. Similar conclusions were made by Alem [
29] when analyzing the performance of dairy farms in Norway. He also indicates that if all dairy farms follow an efficient and sustainable path, it is possible to reduce inputs by 8% to 13% production inputs per cow (type two). The average technical efficiency for this group, calculated for the BCC model, ranged from 81.0% to 84.9% and it was the highest among all types of dairy farms. At the same time, in this group of dairy farms, the highest change in the total productivity of dairy farm factors was recorded in relation to other types of farms. Thus, lower labor inputs, material costs and capital costs (depreciation) contributed to higher technical efficiency, thus improving the overall productivity of production. Type four units formed the least numerous group of dairy farms. This type of dairy farm is characterized by the highest inputs of means of production per one cow. The average technical efficiency for this population, calculated for the BCC model, ranged from 70.7% to 77.0% and it was the lowest among all types of dairy farms. The total productivity of these farms did not differ significantly from the others. It can also be seen that between these two types of farms there is no significant difference in the size of the herd of cows, while the level of milk yield was slightly different. This may result from the difference in the proper use of inputs (the level of technical efficiency of dairy farms) and differences in other socio-economic factors characterizing these units [
62]. It also indicates that milk production on a farm can be increased without the need to incur additional production costs.
In the analyzed period, in the analyzed dairy farms, the average herd size increased by an average of 2.9% year by year. In 2017, the average number of cows increased by 29.7% compared with 2008. An upward trend was also noticed in the case of the average agricultural area, which in the analyzed period increased on average by 1.8% year by year. The average agricultural area in 2017 increased by 17.0% compared with 2008. A reflection of the growing tendencies observed in relation to the size of the herd of cows and the agricultural land area is the increase in milk yield, on average by 2.0% year by year. In 2017, on the other hand, there was an increase of 19.6% in the average milk yield compared with 2008. These changes undoubtedly contributed to the improvement of total productivity in all types of dairy farms, and this increase was not enough to increase the technical efficiency of these farms.


