Article

Combination of Compost and Mineral Fertilizers as an Option for Enhancing Maize (Zea mays L.) Yields and Mitigating Greenhouse Gas Emissions from a Nitisol in Ethiopia

by
Gebeyanesh Worku Zerssa
1,2,
Dong-Gill Kim
3,
Philipp Koal
4 and
Bettina Eichler-Löbermann
1,*
1
Department of Agronomy and Crop Science, Faculty of Agricultural and Environmental Sciences, University of Rostock, J. von Liebig Weg 6, 18059 Rostock, Germany
2
Department of Natural Resources Management, College of Agriculture and Veterinary Medicine, Jimma University, Jimma P.O. Box 307, Ethiopia
3
Wondo Genet College of Forestry and Natural Resources, Hawassa University, Shashemene P.O. Box 128, Ethiopia
4
Forestry Research and Competence Center, Thüringen Forst, Jägerstr. 1, 99876 Gotha, Germany
*
Author to whom correspondence should be addressed.
Agronomy 2021, 11(11), 2097; https://doi.org/10.3390/agronomy11112097
Submission received: 4 September 2021 / Revised: 14 October 2021 / Accepted: 17 October 2021 / Published: 20 October 2021

Abstract

:
Combined application of organic and mineral fertilizers has been proposed as a measure for sustainable yield intensification and mitigation of greenhouse gas (GHG) emissions. However, fertilizer effects strongly depend on the soil type and still no precise information is available for Nitisols in Ethiopia. The study evaluated effects of different ratios of biowaste compost and mineral fertilizers (consisting of nitrogen (N), phosphorus (P), and sulphur (S)) on maize (Zea mays L. Bako-hybrid) yields in a two-year field trial. Soil samples from each treatment of the field trial were used to estimate emissions of nitrous oxide (N2O), carbon dioxide (CO2), methane (CH4), and microbial activity in a 28-day incubation experiment with two moisture levels (40% and 75% water-filled pore space, WFPS). The application of fertilizers corresponded to a N supply of about 100 kg ha−1, whereby the pure application of mineral fertilizers (100 min) was gradually replaced by compost. Maize yields were increased by 12 to 18% (p < 0.05) in the combined treatments of compost and mineral fertilizers compared to the 100 min treatment. The cumulative emissions of N2O and CO2 but not CH4 were affected by the fertilizer treatments and soil moisture levels (p < 0.05). At 75% WFPS, the N2O emissions in the 100 min treatment was with 16.3 g ha−1 more than twice as high as the treatment with 100% compost (6.4 g ha−1) and also considerably higher than in the 50% compost treatment (9.4 g ha−1). The results suggest that a compost application accounting for 40 to 70% of the N supply in the fertilizer combinations can be suitable to increase maize yields as well as to mitigate GHG emissions from Nitisols in Southwestern Ethiopia.

1. Introduction

In the context of climate-smart agriculture (CSA), soil management should balance the three CSA pillars of mitigation, adaptation, and productivity [1]. Considering type and amount of fertilizer as well as application time and technique can improve the productivity while reducing nutrient imbalances and nutrient losses from agricultural fields [2,3]. Applying organic fertilizers was shown to have positive yield effects in a broad range of cropping systems [4,5,6,7,8] and also has environmental benefits, as evaluated in a life cycle assessment study [9]. With regard to soil fertility, among others, organic materials were shown to enhance aggregation and stability of the soil and reduce erosion ([10,11], suppress soil borne diseases [12], store nutrients [13], and improve biological functions [14,15]. Despite the advantages of organic fertilization, various studies agree that the combination of organic and mineral fertilizers can provide even better results concerning CSA than sole organic or mineral fertilizer. For instance, the results of Sileshi [16] from a meta-analysis on studies conducted in sub-Saharan Africa, including Ethiopia, reported higher yields (factor 1.1 to 4.7) of maize when combinations of organic and inorganic fertilizers were applied compared to sole application of manure or inorganic fertilizer.
Although, improper application of organic fertilizers can result in considerable releases of greenhouse gases (GHG) [14,17], combining organic and mineral fertilizers was frequently described as a viable option to reduce nitrogen (N) losses and emissions of GHGs, especially carbon dioxide (CO2) and nitrous oxide (N2O) in different cropping systems [3,18,19,20]. The potential to reduce GHG emissions depends largely on the type of the organic amendments and their effects on soil microbial community structure and functions [14]. Mainly processed amendments, as compost, were found to increase the carbon (C) stocks in soils and to reduce the emissions of N2O [14,21]. In this context, research findings by Das and Adhya [20] showed that combined application of compost (30 kg N ha−1) plus urea (90 kg N ha−1) lowered the N2O emissions by about 18% in comparison to sole application of urea (120 kg N ha−1).
Microorganisms are important components of the C and N cycles in soil and they also affect the emission of GHGs through the decomposition of organic matter and nitrification and denitrification processes [8,9,22,23]. As microbial activity is strongly affected by the availability of N and labile C [14], the activity of dehydrogenase (DH), as an indicator of the intracellular activity of living microorganisms [24,25], was usually found to increase after application of organic amendments [26,27]. In contrast, the sole application of mineral N fertilizer can decrease DH activity in the soil by soil acidification or secondary salinization [28,29]. Furthermore, high rates of microbial activity in soil usually occur when soil moisture is near field capacity, which is equivalent to about 60% water-filled pore space (WFPS) [30]. Raising WFPS to 70 or even 90% increases N2O emissions [19,31].
Reduced emissions of GHGs after combining mineral with organic fertilizers were found for tropical as well as for temperate regions [32]. However, the extent of GHG emissions from soils strongly depends on the climate [33] and soil quality, whereby especially soil type, temperature, and moisture content are decisive [34,35,36]. For example, Sakata et al. [37] found significantly different values of N2O and CO2 emissions in oil palm plantations for three soil types, despite the same N fertilizer management. Consequently, the trade-off between sustainable production, soil quality, and GHG emissions should be taken into account when developing suitable fertilizer strategies.
The southwestern part of Ethiopia is characterized by a mono-modal rainfall pattern with high rainfall intensity during the summer season from June to September [38,39]. This is the main cropping season with WFPS values of about 90% and average temperatures above 20 °C [38], which favor GHG emissions. On a global perspective, Ethiopia emitted relative low amount of GHG with about 150 Mt CO2 equivalents in 2015, of which about 61% came from agriculture, mainly livestock [3,40]. Because of the low amount of N applied to cropping fields in Ethiopia during the last decades, N fertilizers were not a main driver of GHG emissions [40]. However, the government of Ethiopia has planned to increase the mineral fertilizer (mainly urea) dose from about 65 kg ha−1 in 2010 to about 250 kg ha−1 by using a combined N, phosphorus (P), and sulphur fertilizer (S) in 2030 [41]. As a result, based on modeling studies by Worku [40] and FDRE, [37] N2O emissions from mineral fertilizer are expected to increase from 4.3 Mt CO2 eq. in 2010 to 35 Mt CO2 eq. in 2030, which accounts to 58% of the total soil-based emissions. However, these data contain a certain inaccuracy as concrete studies on GHG emissions from crop fields under specific environmental conditions and management practices are widely lacking in Ethiopia.
Combining organic and mineral fertilizers was frequently shown to increase crop yields and to reduce the emissions of GHGs in different cropping systems (see above). However, it was also shown that site conditions have great effects on the efficiency of fertilizer practices and on nutrient losses. Although Nitisol is the major soil type of cereal growing areas in the highlands of Ethiopia [42], so far N fertilizer practices have not been studied with regard to crop yields and GHG emissions. These research gaps encouraged us to investigate different ratios of compost and urea/NPS applied to a Nitisol regarding crop productivity and GHG emissions. In order to take into account the role of microorganisms in this respect, the activity of the DH was analyzed as well.
The concrete objectives of this study were: (I) to quantify GHG emissions of compost and urea/NPS fertilizers as N source, (II) to identify the most suitable ratio of compost and urea/NPS in order to reduce the emissions of GHGs while having positive effects on maize yield, and (III) to evaluate if the ranking of the combinations regarding GHG emissions depends on soil moisture. Considering the state of the art, we hypothesized, that (i) combined N application with compost and urea/NPS to a Nitisol will produce less GHG emissions than the N application with only mineral fertilizers, (ii) the ratio of compost to urea/NPS influences GHG emissions and maize yield, and (iii) the GHG emissions will be higher when the water content in the Nitisol is higher.

2. Materials and Methods

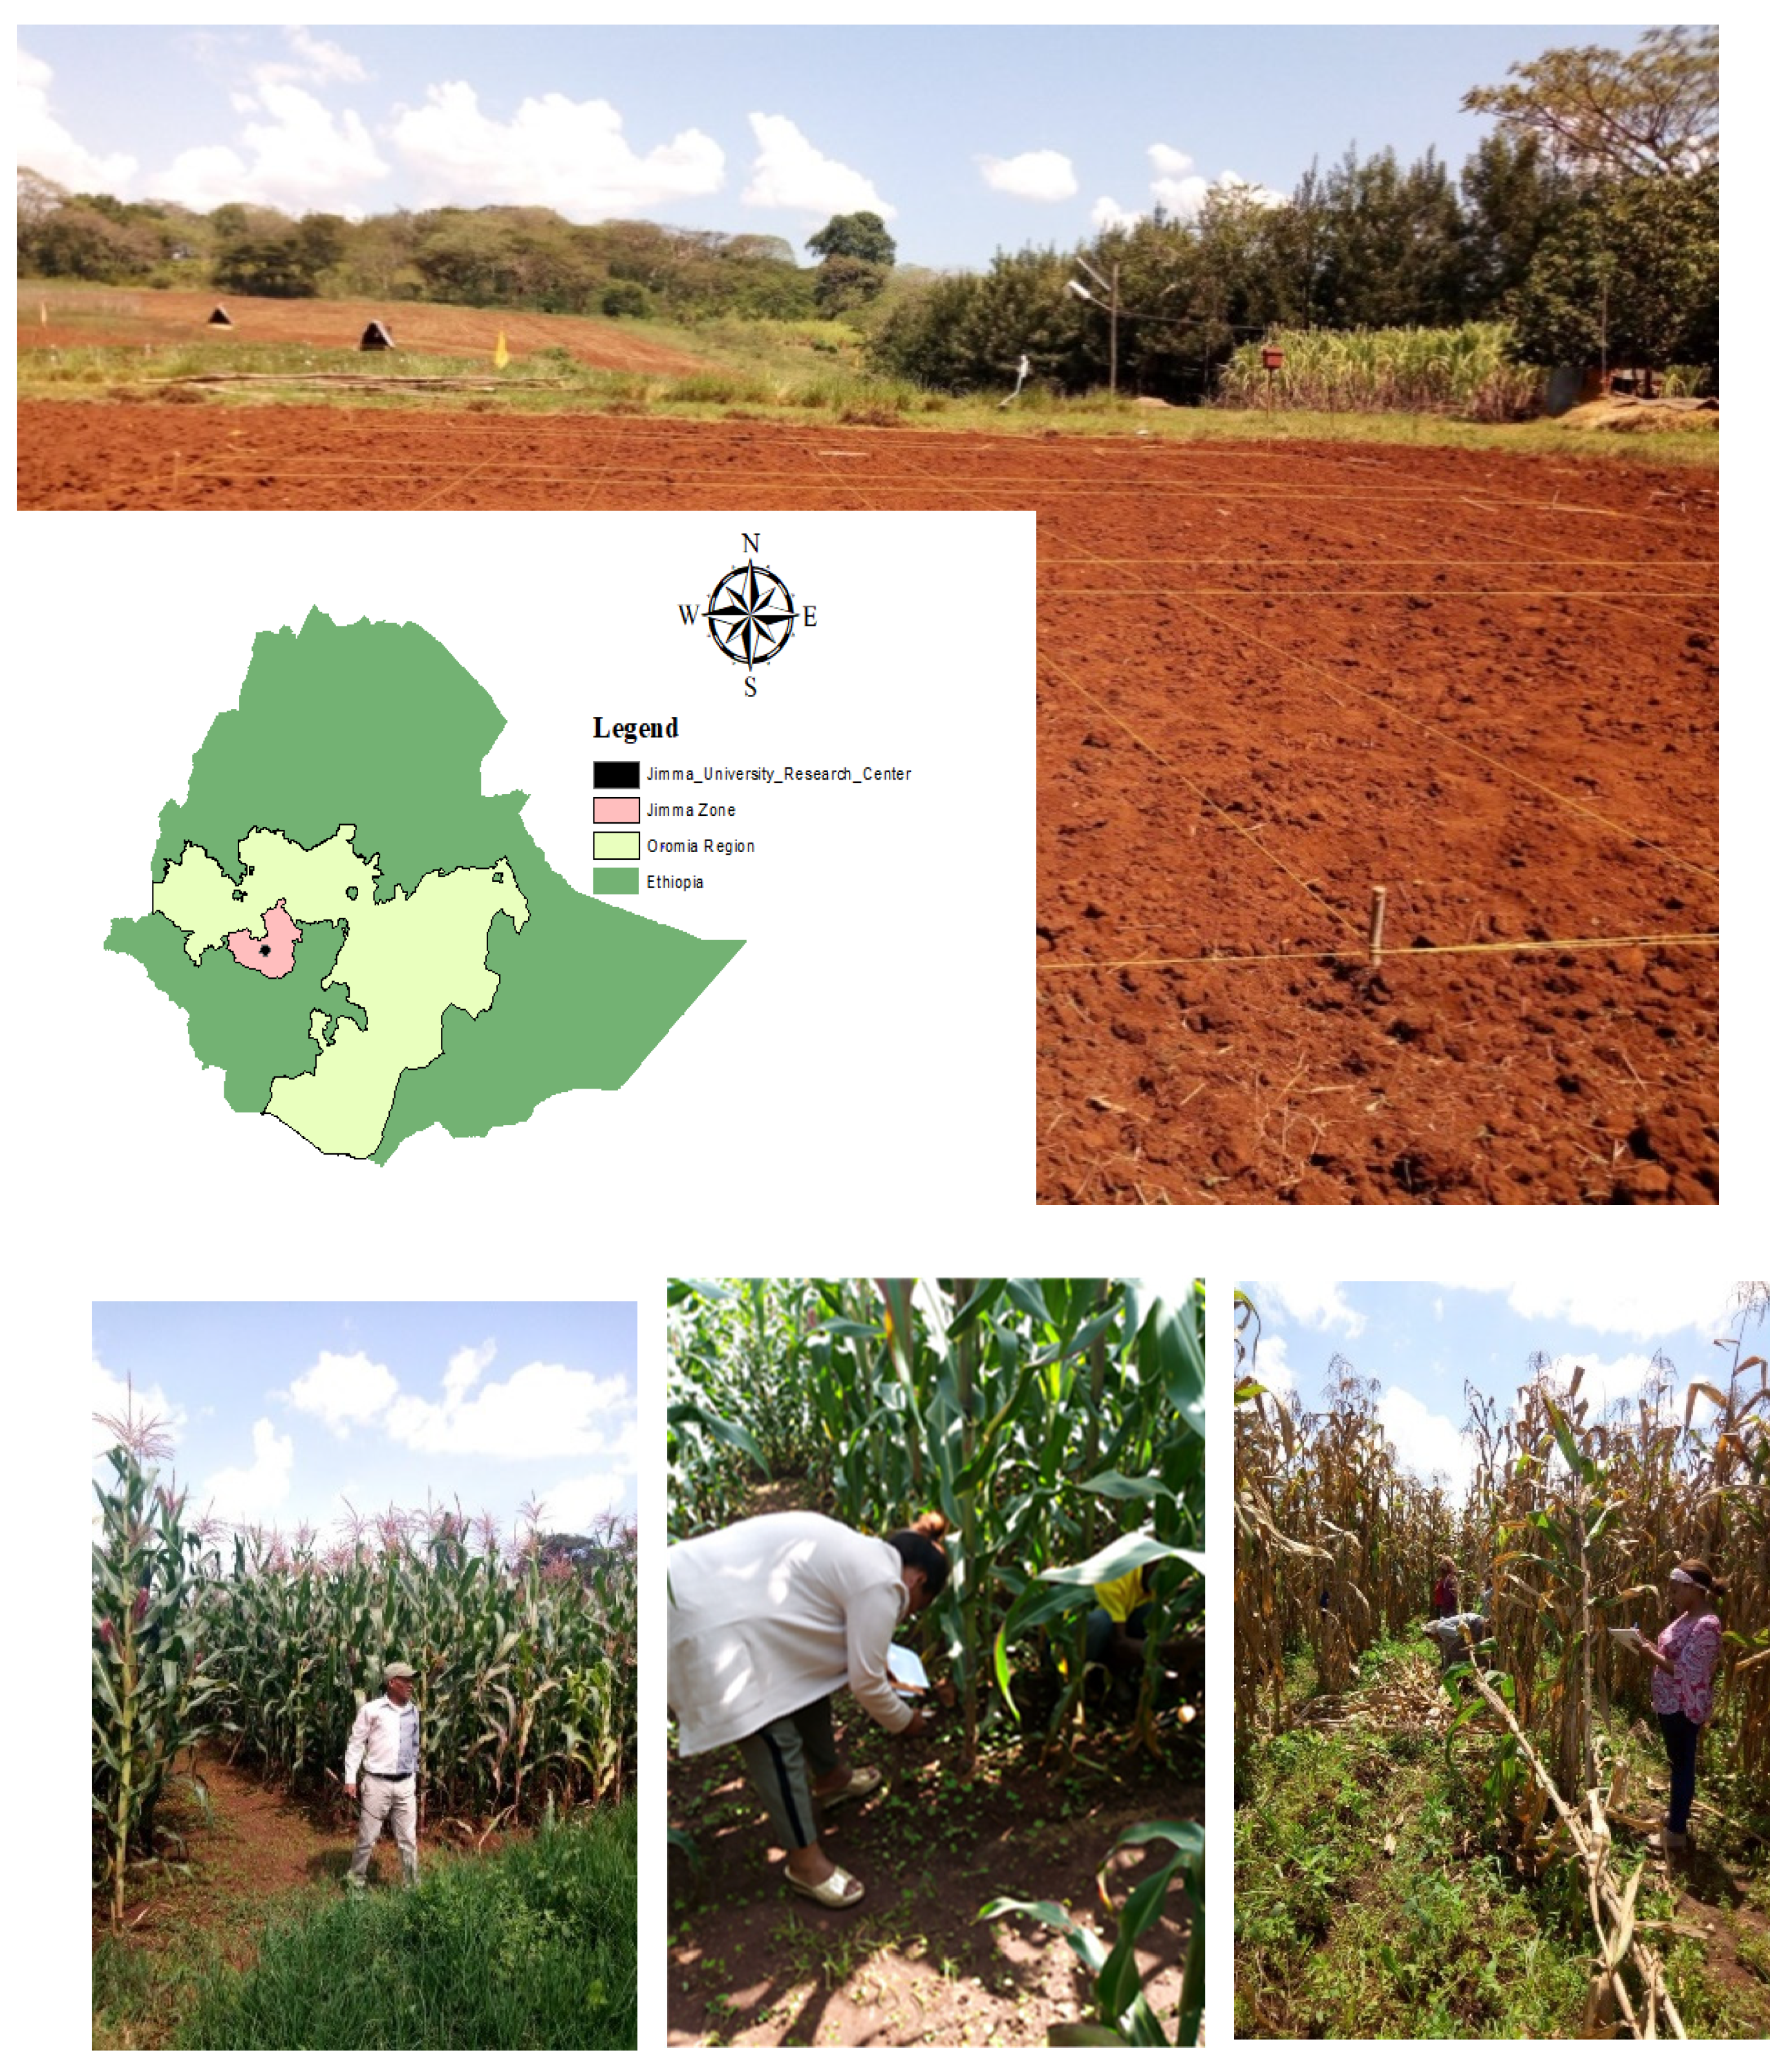
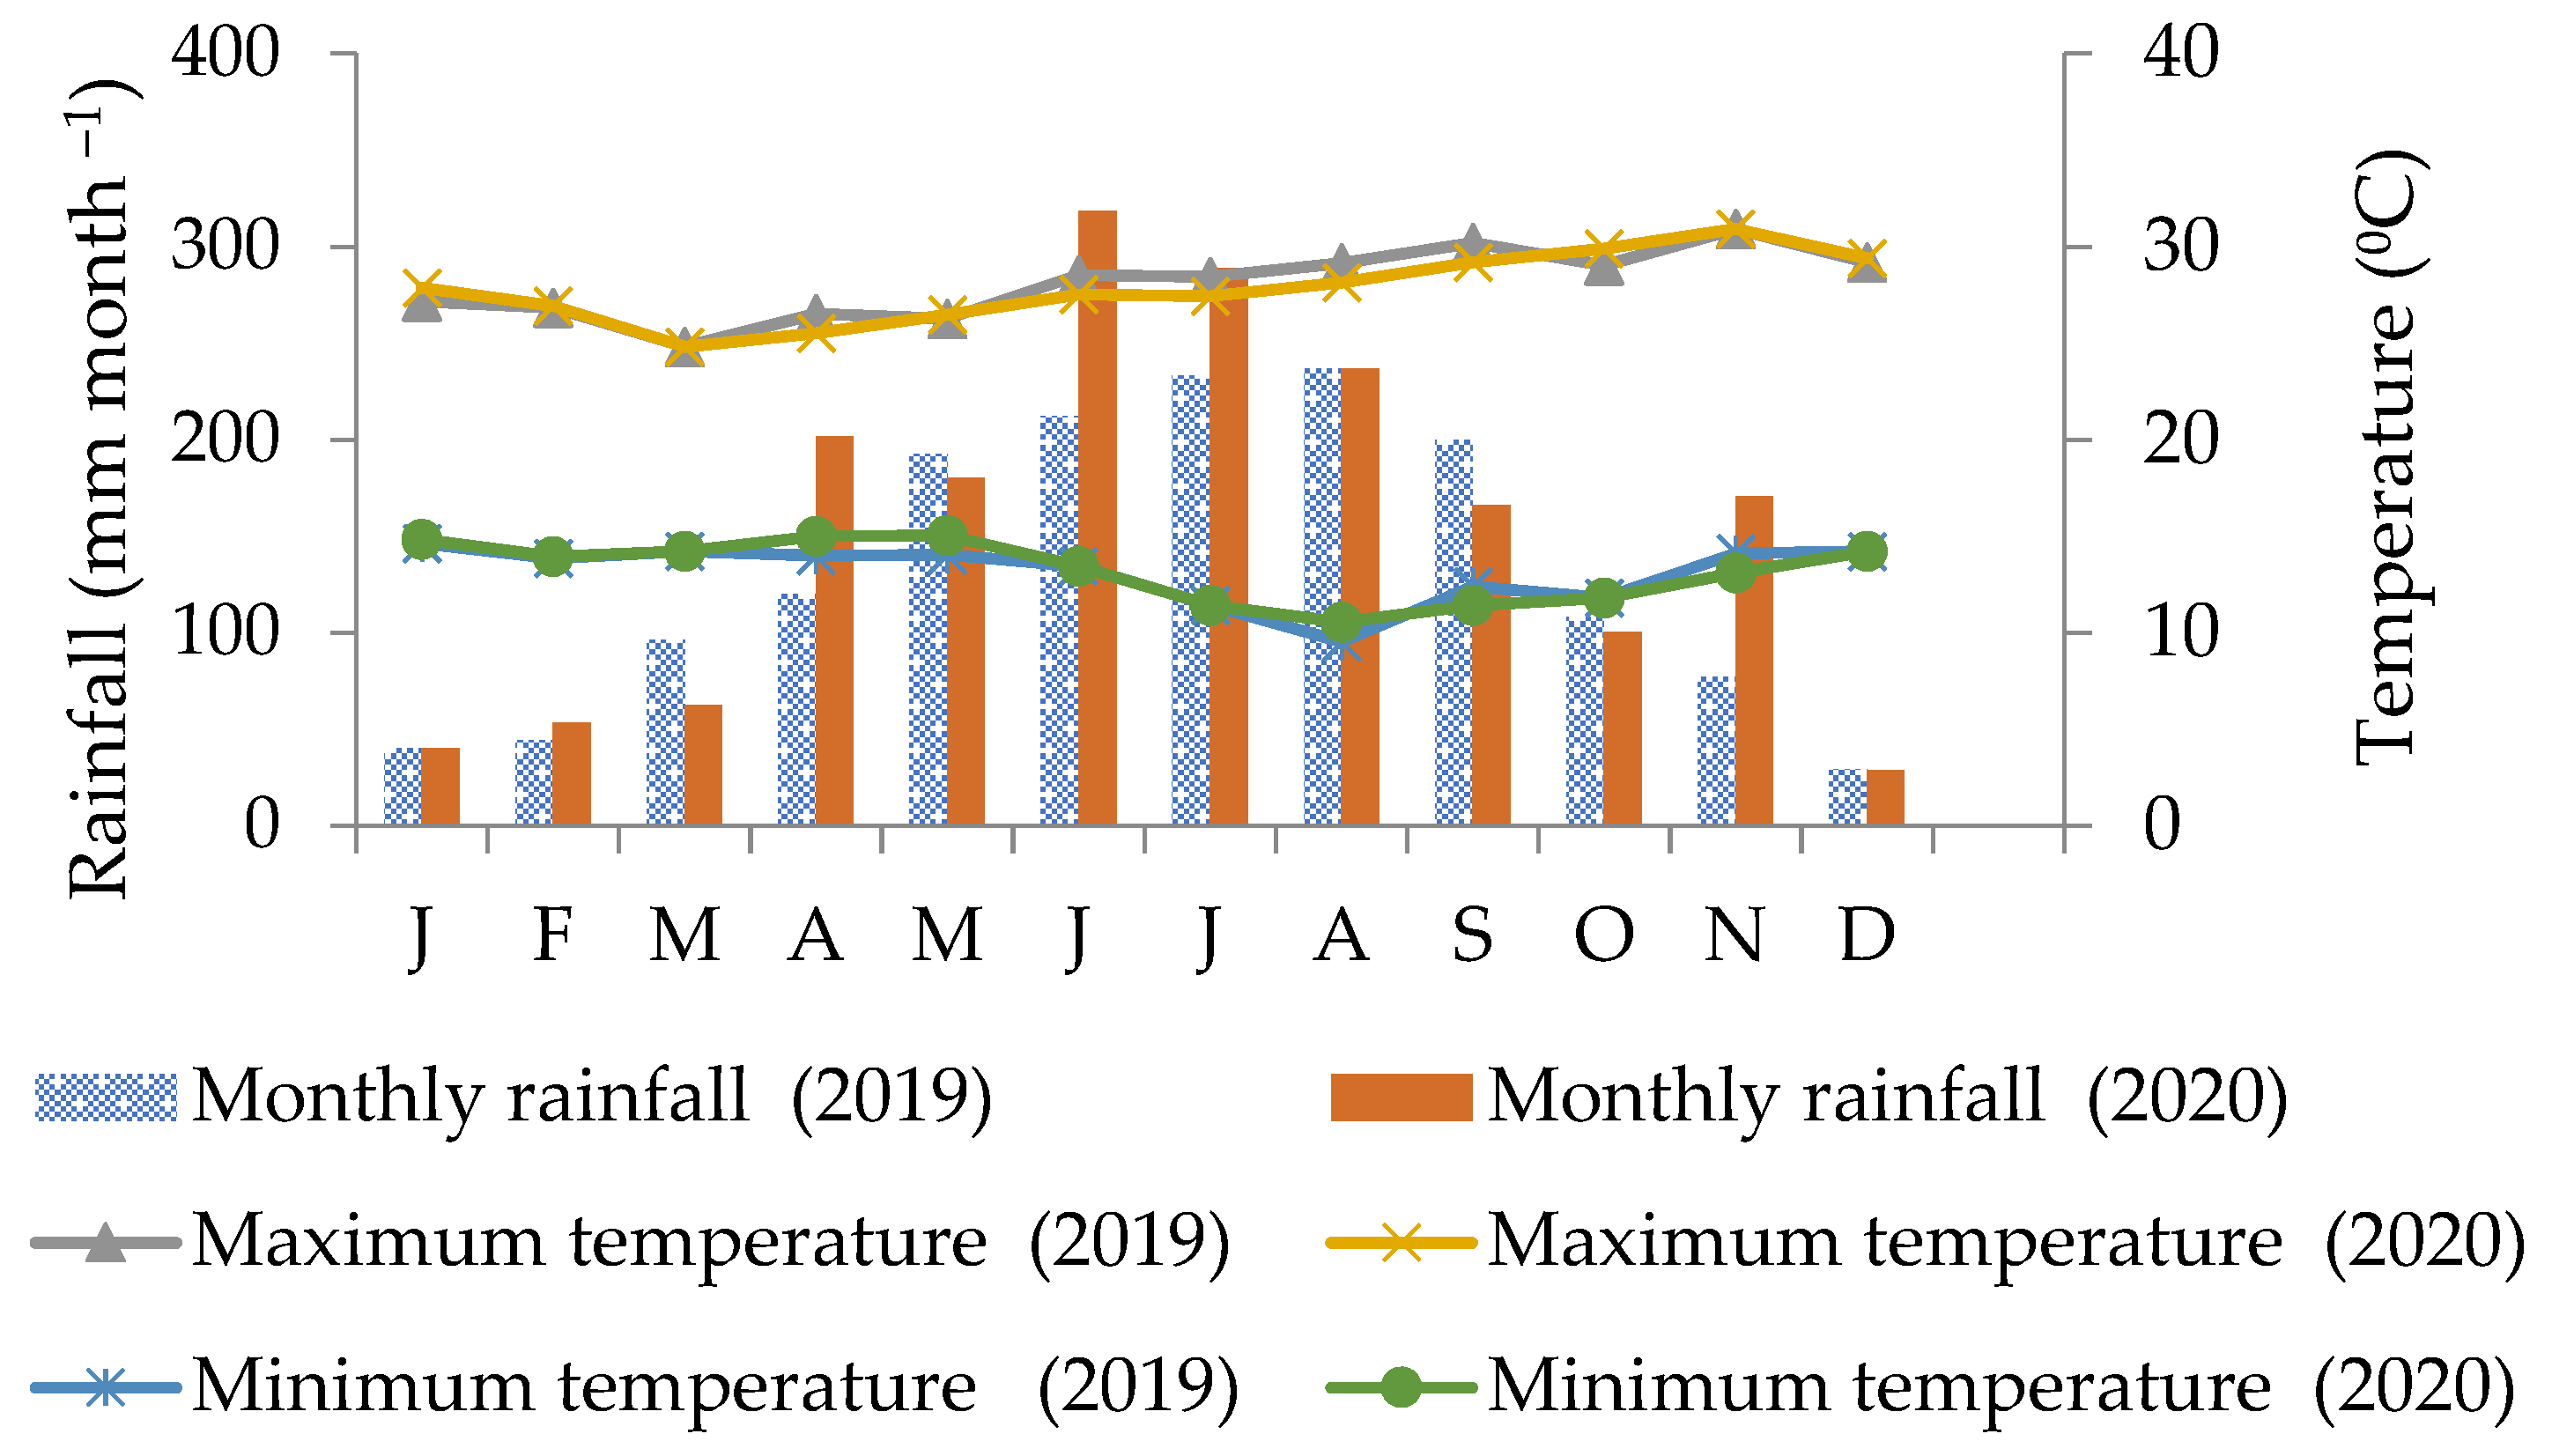
2.1. Experimental Site and Treatments

The study consisted of two experiments—one field experiment to evaluate the maize yield and one incubation experiment to analyze the emission of GHG after application of organic and mineral N sources. The field experiment was performed at the research station of Jimma University College of Agriculture and Veterinary Medicine (JUCAVM) at an altitude of 1710 m above sea level in Southwestern Ethiopia (Eladale; latitude, 7°42’N; longitude 36°49’E) (Figure 1). The research site is characterized as humid tropical climate with temperatures between 13 °C and 28 °C (Figure 2). The annual minimum and maximum rainfall in the area is around 1200 and 2400 mm, respectively, whereby for our experiment, considerably higher rainfall occurred in 2020 than in 2019. The soil texture of the experimental field was silty clay loam with a pH of 4.98, organic carbon content of 2.4%, and total N of 0.22% (Table 1). According to the World Reference Base, the soil was classified as Nitisol, which was characterized as red, well-drained soil with a clay content of more than 30% and a blocky structure. In addition, the site was characterized by low P content, and high iron and aluminum content [42,43]. The soil of this site was also used for the incubation experiment.
In order to assess the impact of the fertilizers on maize yield, GHG emissions and microbial activity in soil, different ratios of mineral, and organic fertilizers were applied to the soil. The fertilizer application based on previous recommendations for N and P supply in the maize cropping systems under similar growing conditions [44,45] and 100 kg N ha−1 and 33.3 kg P ha−1 were defined as the optimum amount of nutrients to be supplied with mineral fertilizers in this experiment (=100% mineral fertilizer). In the other treatments, the nutrient supply with the mineral fertilizers was gradually replaced by a biowaste compost. The maximum amount of compost applied to the field was 7 t ha−1 (dry weight, 1.2% N and 0.072% P) (=100% compost). Compost applications in this range were previously reported to be suitable for maize production in this region [46,47,48]. In total, seven treatments, including control without fertilizers, were established. The nomenclature followed the percentage of mineral fertilizer applied, starting with 100 min (= 100% mineral fertilizers), followed by 80 min, 60 min, 50 min, 30 min, and 100 comp (= 100% compost) (Table 2).
As a mineral fertilizer commercially available, NPS (19% N–38% P-7% S) and urea (46% N) were applied. A compost based on locally available materials such as residues from vegetable plants, animal manure, and wood ash was prepared following the standard procedure of Tulema et al. [49]. The soil and compost were analyzed regarding nutrient concentration and physical characteristics (Table 1). The pH of compost and soil were measured using a pH meter (pMX 3000) in 1:2.5 compost/soil: CaCl2 ratios. The organic C was measured by the Walkley–Black oxidation method and the total N by the micro-Kjeldahl method. The total element concentrations of the compost and soil were measured after microwave digestion (aqua regia) by using inductively coupled plasma optical emission spectroscopy (ICP-OES, Perkin Elmer). The available phosphorus (P), potassium (K), and magnesium (Mg) contents were measured in a spectrophotometer (P) or flame photometer (K, Mg) after extraction with calcium lactate (C6H10CaO6·5 H2O) solution. The cation exchange capacity (CEC) was determined by Chapman [50]. In addition, soil texture was determined using the hydrometer method [51] and bulk density was determined using a core sampler method [52].

2.2. Determination of Maize Yield and Agronomic N Use Efficiency

Maize was cultivated for two growing periods in a randomized complete block design with seven treatments (see Section 2.1) and four replications. The Bako hybrid (BH_661) variety was used, because it is the most commonly used by farmers in the study area. In February 2019 and March 2020, twelve plants per row were planted at 0.75 m inter-row and 0.30 m intra-row spacing with a plot size of 4 m by 2.5 m (10 m2) (Figure 1). No irrigation was applied during the experiment as the maize crops were sown during the main growing season with sufficient rainfall. Weeding and other agronomical practices were applied manually using labor forces. During maturity (July 2019 and August 2020), the two central rows in each subplot were harvested in order to determine the maize grain yield [53]. The grain samples were oven-dried for 72 h at 70 °C in order to get dry weight.
Beside the yields, agronomic nitrogen use efficiency (ANUE) for each treatment was also calculated, as described by Baligar and Fageria [54].
ANUE   ( kg   grain / kg   N   applied ) = GYf GYu Nap
where GYf is the grain yield of the N fertilized plot (kg), GYu is the grain yield of the unfertilized plot (kg), and Nap is the quantity of N applied with compost or mineral fertilizer (kg).

2.3. Incubation Experiment and Greenhouse Gas Measurement

Composite sampling of the topsoil (0–5 cm) of the unfertilized plots was performed assuming farmers usually incorporate fertilizers at the surface of the soil. The soil was homogenized, air-dried, sieved (2-mm pore size), and immediately stored at 4 °C until the beginning of the incubation experiment. Larger (>2 mm) surface aggregates and below-ground plant matter were removed beforehand. The laboratory incubation experiment was conducted at the University of Rostock (Germany) with the Nitisol from the field experiment in Ethiopia, applying the same fertilizer treatments as in the field experiment in four replications (Table 2). Two hundred grams of air-dried soil was filled into a 1000 mL jar, the soil aggregates were evenly compacted to a bulk density of 1.2 g cm−3 (to mimic the natural soil pore spaces), and pre-incubated at 25% WFPS and 25 °C for 15 days. Pre-incubation of soil samples is suggested before starting GHG measurement to settle and standardize the soil microbial community following the disturbance of sampling and sieving [55]. After the pre-incubation, fertilizers were applied and the moisture contents were adjusted to 40% and 75% WFPS in order to mimic the dry and rainy season. The fertilizer addition was adapted to the soil volume in the jars, whereas 100 kg N ha−1 corresponded to 33.3 mg N kg−1 soil. The mineral fertilizers and fresh compost were evenly spread and homogenized with the dry soil. The jars were incubated constantly at 25 °C in the dark in a completely randomized order. Loss of water during incubation was compensated by adding H2Odemin on a daily basis.
Gas samples were collected each day from the first day to the 13th day. For the first three days, gas samples were collected three times a day and for the remaining ten days, once a day. This approach considered the higher production of GHG immediately after fertilizer application [56]. Gas samples from the headspace of the sealed jars were collected by 60 mL syringes, transferred to evacuated vials, and the gas concentrations of N2O, CO2, and CH4 were measured with a gas chromatograph (GC-2014, Shimadzu, Kyoto, Japan) equipped with an electron capture detector for the N2O analysis, and a flame ionization detector (FID) for the CO2 and CH4 analysis. Jars were opened for 20 min to maintain aeration after every measurement and closed until the next measurement. The loss of moisture was re-adjusted to maintain the chosen moisture content throughout the incubation [35]. Gas fluxes were calculated by assuming a linear increase in gas concentrations inside the incubation bottles over time.

2.4. Determination of N2O, CO2, and CH4 Emissions, N2O Emission Factor, and Global Warming Potential

The GHG fluxes were calculated area-based by considering the surface of jars filled with soil. We measured the height and diameter of the jar, which was filled with soil (bulk density 1.2 g cm−3) and calculated the surface of the jars occupied by the soil. The diameter of the jar was determined by considering the average of the upper and lower surface of the jar. The soil emissions were estimated based on the rate of linear GHGs increase in the container headspace over time from a given amount of soil. Gas fluxes (g ha−1 day−1) were calculated by the following equation of Comeau et al. [57] for soil heterotrophic respiration assessment using minimally disturbed soil microcosm cores. The conversion factor of ppm/ppb N2O, CO2 and CH4 to mg N2O, CO2 and CH4 was calculated with Equation (2):
Cf = P   × Mm ( C   or   N ) * 1000 RT
where Cf = conversion factor of ppm/ppb of N2O, CO2 and CH4 to mg N2O-N, CO2-C and CH4-C; P = air pressure (kPa); Mm = molar mass of C (12) or N (28); R = gas constant (8.314); T = incubation air temperature (K). Finally, the N2O, CO2, and CH4 fluxes were computed on an area basis. The N2O-N, CO2-C, and CH4-C per unit of area were calculated using the following equation:
Flux = ( ( C t ) * Cf * Hs ) ( Area ) × 10 6
where Flux = linear gas efflux in incubation container on soil area basis (g CO2-C m−2 h−1); Cf = conversion factor of ppm CO2 to mg CO2-C m−3; t = incubation time (hours); C = change in gas concentration during the incubation period; Hs = headspace volume of the incubation jar (m3); 10−6 = conversion factor from µg to g; Area = area of the microcosm surface (m2). The cumulative GHG emissions were calculated by summing the daily fluxes [58]. The final results were converted from µg N2O h−1m−2, g CO2 h−1m−2, and µg CH4 h−1m−2 to g N2O ha−1 day−1, kg CO2 ha−1 day−1, and g CH4 ha−1 day−1, respectively, and presented in figures and tables.
The N2O emission factor (EF) was calculated following the 2019 Refinement to the 2006 IPCC Guidelines for National Greenhouse Gas Inventories Tier (I) methodology [59], as follows:
N 2 O   EF % = ( N 2 O   ENI N 2 O   EC Ninput ) × 100
where N2O EF% = N2O emission factor; N2O ENI = N2O emission in treatments with N input; N2O EC = N2O emission in the control treatments with no N addition; N input = the amount of N added to the soil.
The GWP was determined for fertilizer rate and type using the following equation [60]:
GWP = N 2 O × 298 +   CO 2 +   CH 4 × 25
where GWP = global warming potential (kg CO2 eq. ha−1); N2O = is the amount of N2O (kg ha−1); CO2 = the amount of CO2 (kg ha−1); CH4 = the amount of CH4 (kg ha−1); 298, and 25 = GWP coefficients to convert N2O and CH4, respectively, to CO2 equivalents [61].

2.5. Dehydrogenase Enzyme Activity

Dehydrogenase enzyme activity (DHA) was determined following the modified method based on [62]. During this procedure, 0.8% triphenyl-tetrazolium-chloride (TTC) was added to 1 g of soil and incubated for 24 h at 37 °C. As a result of DHA, TTC was reduced to triphenyl-formazan (TPF) by most microorganisms. TPF was extracted with acetone after incubation and measured with the spectral photometer (Specord 40, Analytik Jena, Germany). The activity was expressed as 1 g TPF per g soil released within 24 h (1 g TPF g−1 24 h−1). Soil samples were taken three times during the incubation period and analysed for DHA. The first sample was taken immediately after the incorporation of different fertilizers. The second sample was taken after seven days of incubation.

2.6. Statistical Analysis

The normality of residuals was assessed by the Kolmogorov–Smirnov normality test [63], and it was shown that our data was approximately normally distributed. One-way analysis of variance (ANOVA) was used to determine the effect of different fertilizer types on GHG emissions, N2O EF, GWP, and DHA. The interaction effect of moisture content and fertilizer types was analyzed by a two-way ANOVA. The mean values were determined by using the Tukey multiple-comparison test by using SPSS (22.0 version). Pearson correlation analysis was used to determine the relationship between C inputs and emissions of N2O, CO2, CH4, and N2O EF.

3. Results

3.1. Maize Yield and Agronomic Nitrogen Use Efficiency

The maize grain yields were measured in two consecutive years in an on-station experiment (Table 3). The maize yield depended on the experimental year as well as on the fertilizer treatments. Averaged across the fertilizer treatments, the yields were lower in the second year, which is linked to unexpected rainfall and windy weather conditions. Relatively high yields were found for the combined fertilizer treatments. This was especially true for the 60 min treatment with significantly (p < 0.05) higher yields (9.9 Mg ha−1) than the control without fertilizers or the single fertilizer applications in both years. For example, averaged across both years, the 60 min treatment had 9.8 Mg ha−1, which was 18% higher than the 8.3 Mg ha−1 in the 100 min treatment. The combined treatment with only 80 min was not found to be more effective than the 100 min treatment. No differences were found between the 100comp and 100 min treatments.
In accordance to the yields, a combined application of compost and mineral fertilizers increased the ANUE of maize, and for the 60 min and 50 min treatment, about three times higher values than in 100 min treatment were measured (18.2 and 13.9 vs. 5.5 kg grain per kg N applied).

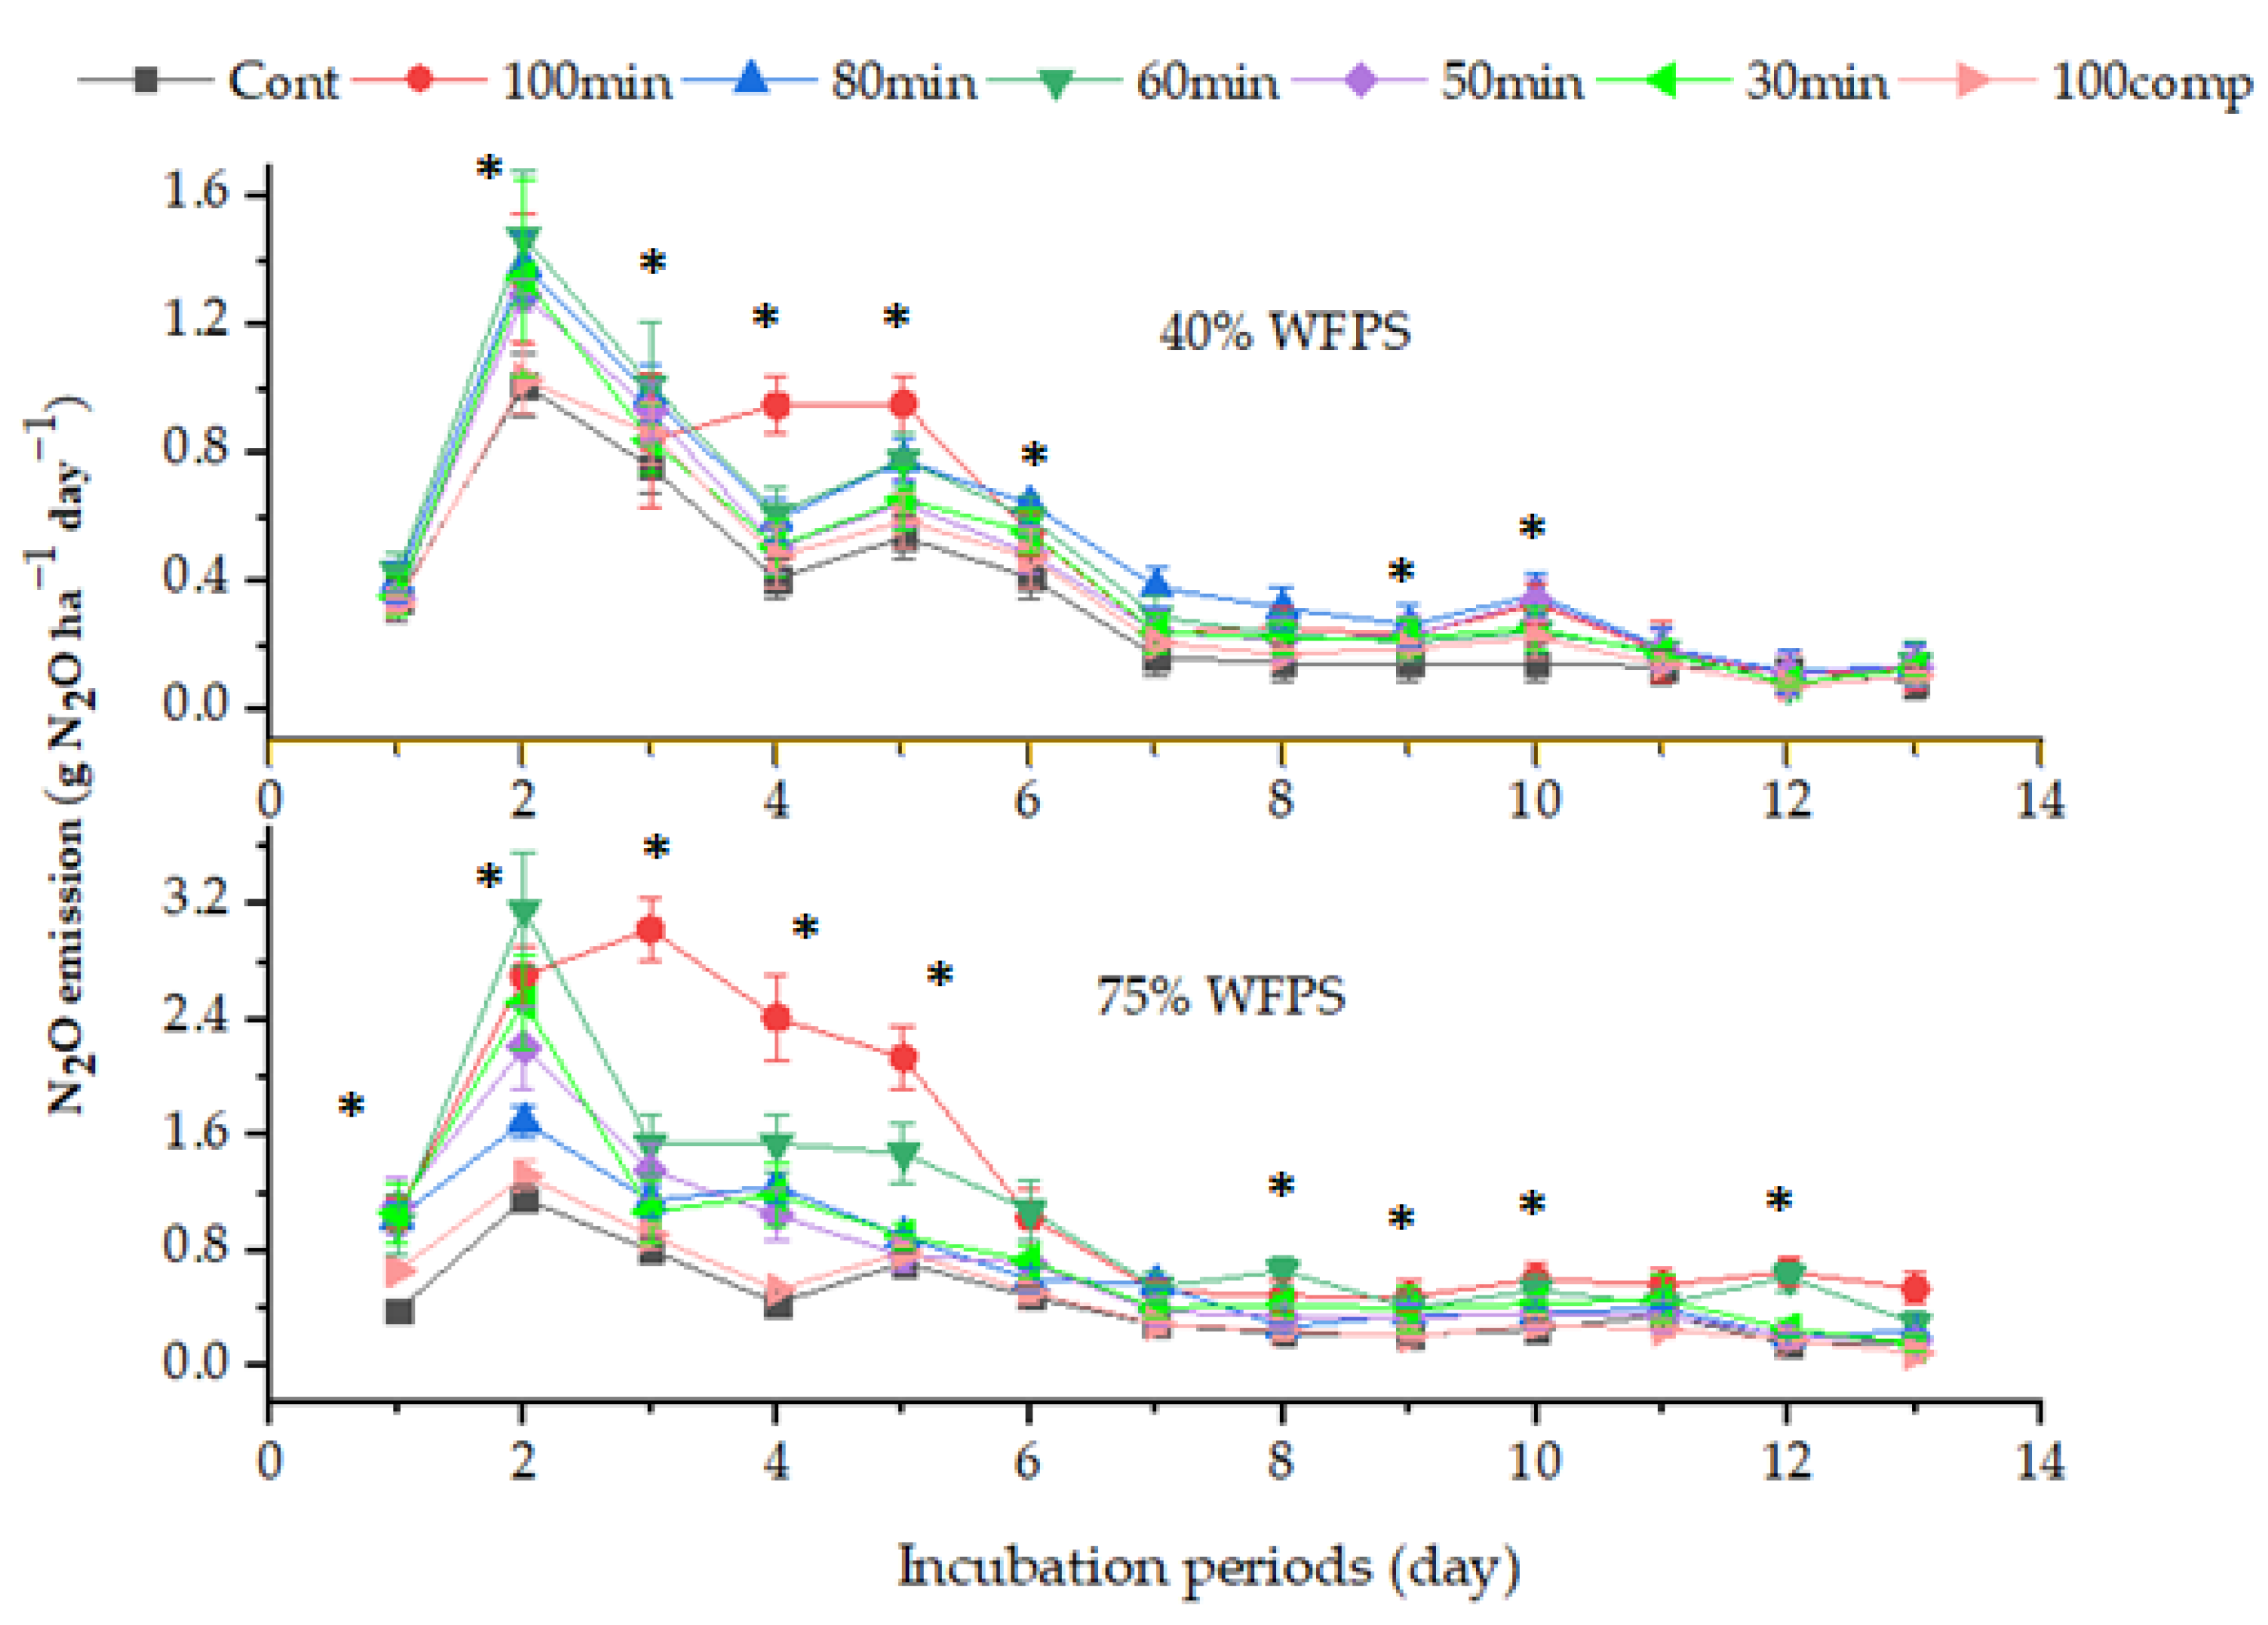
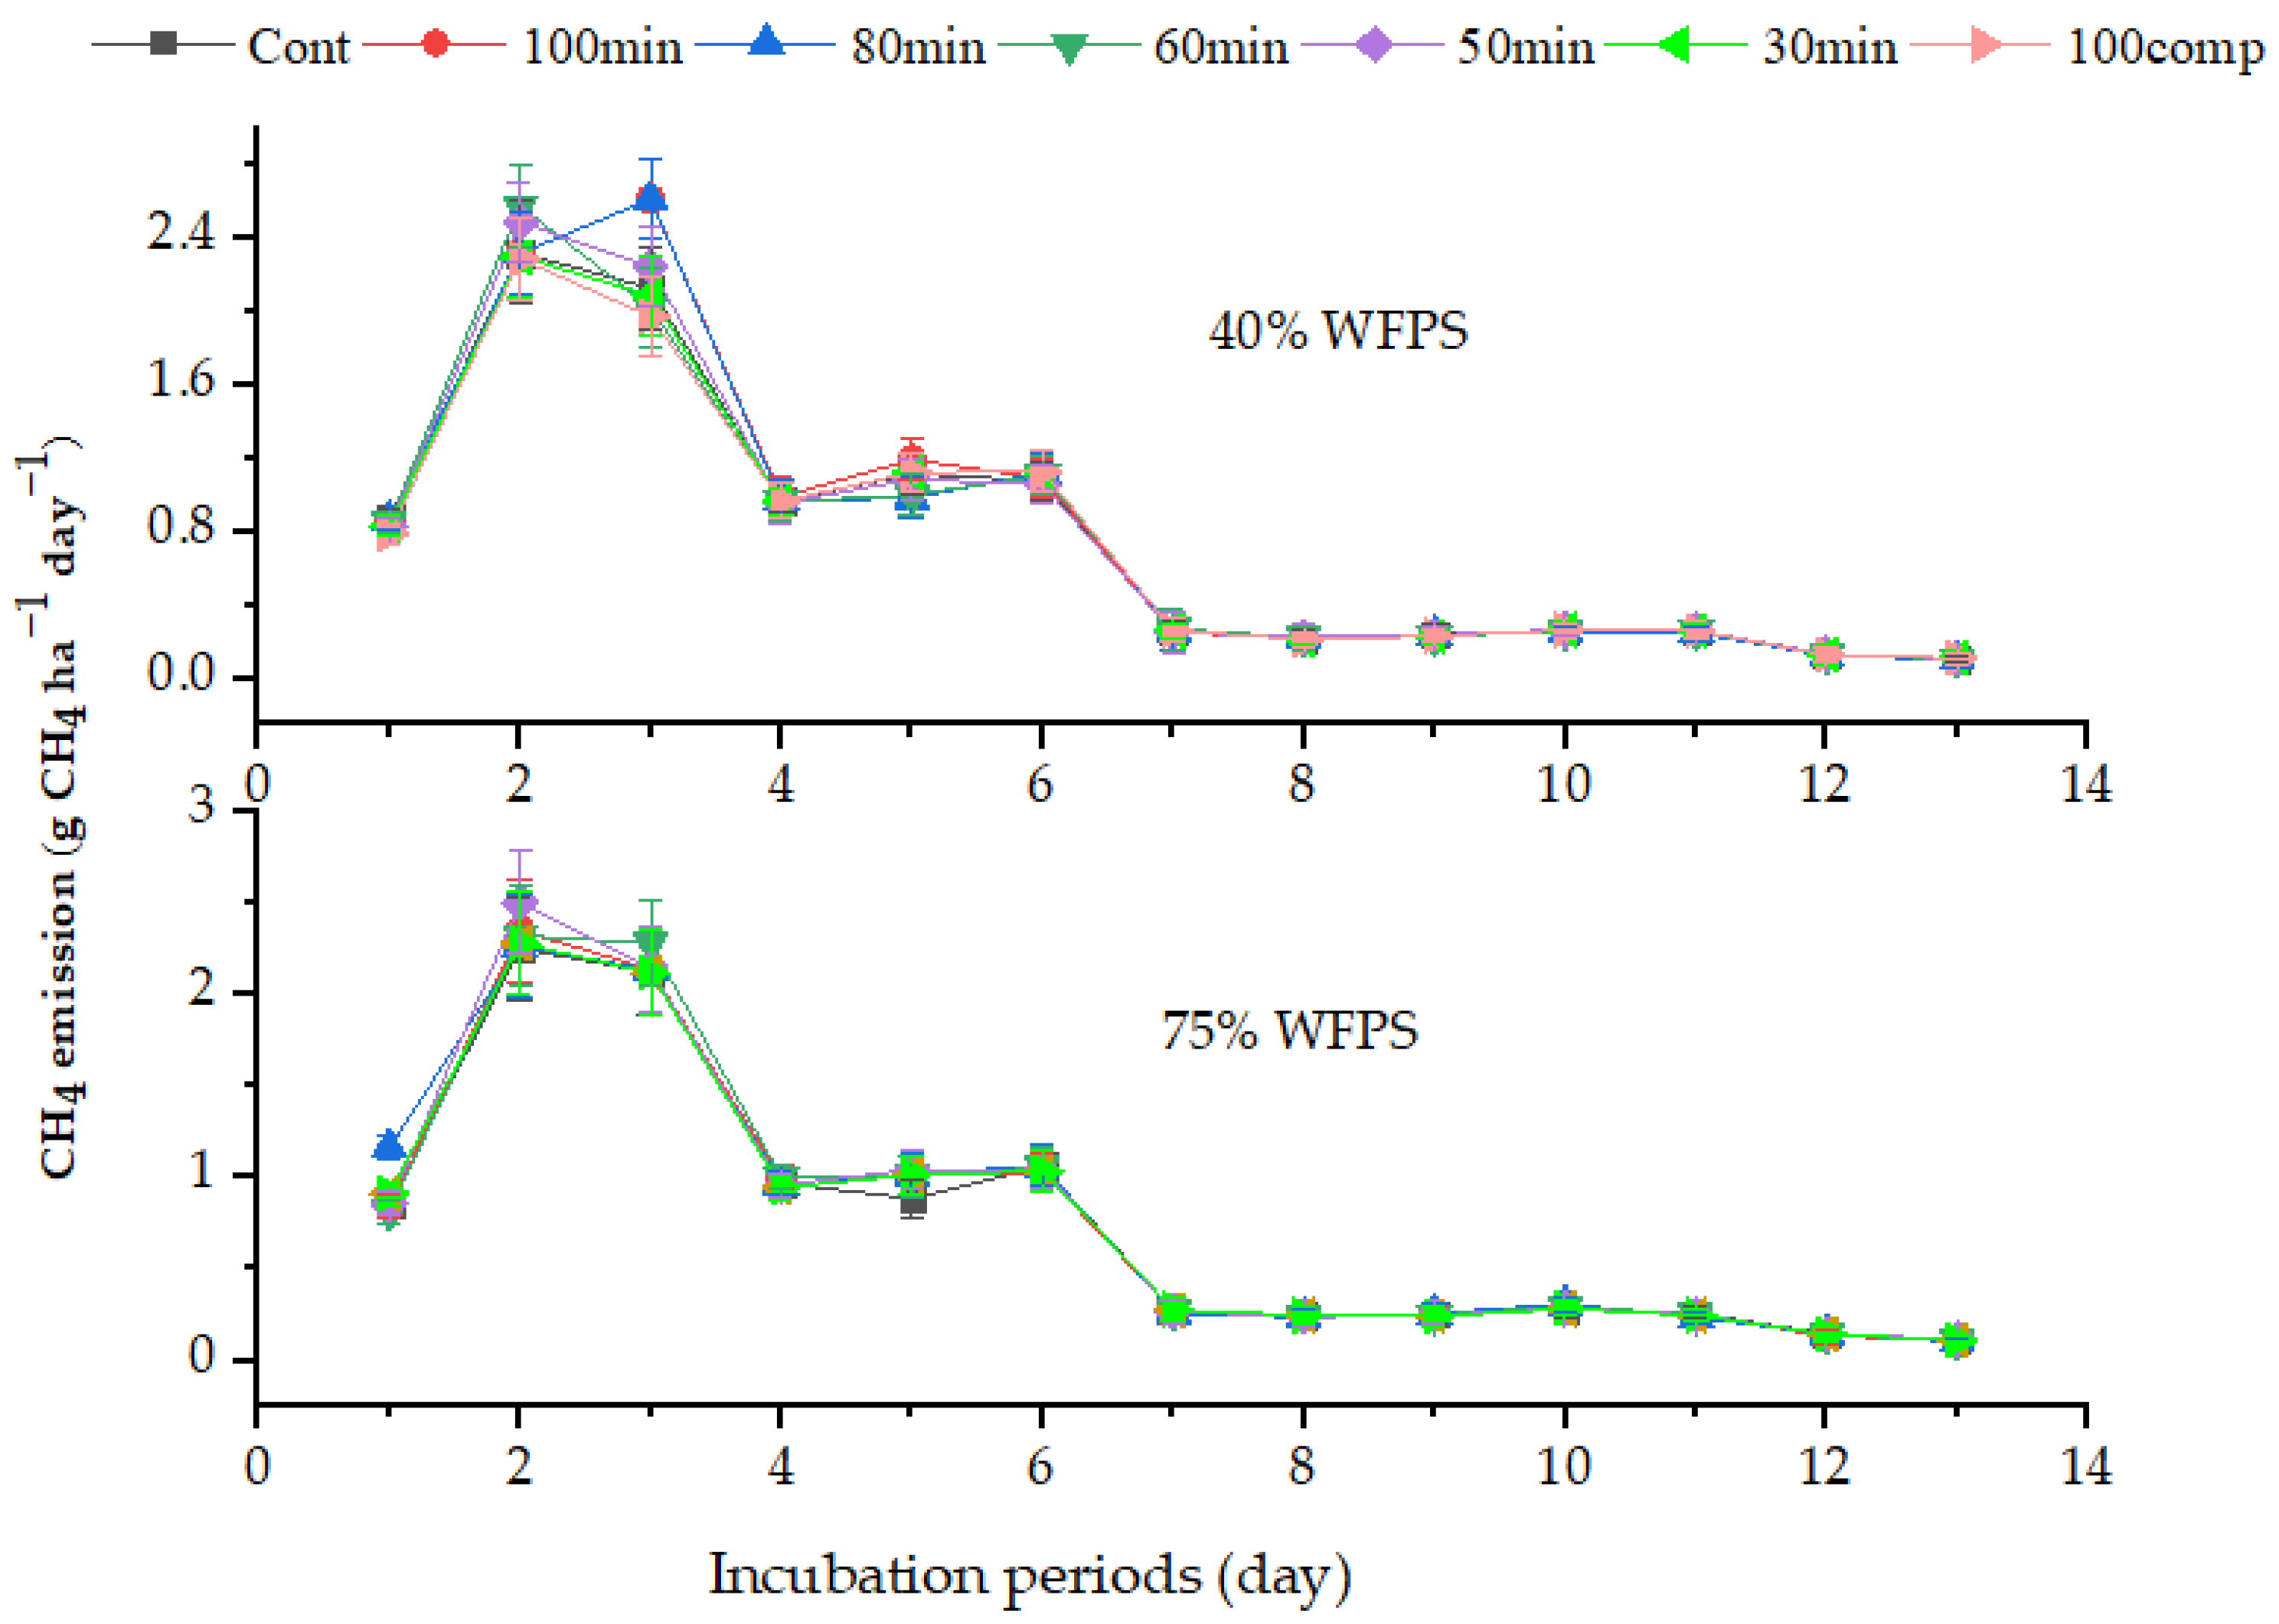
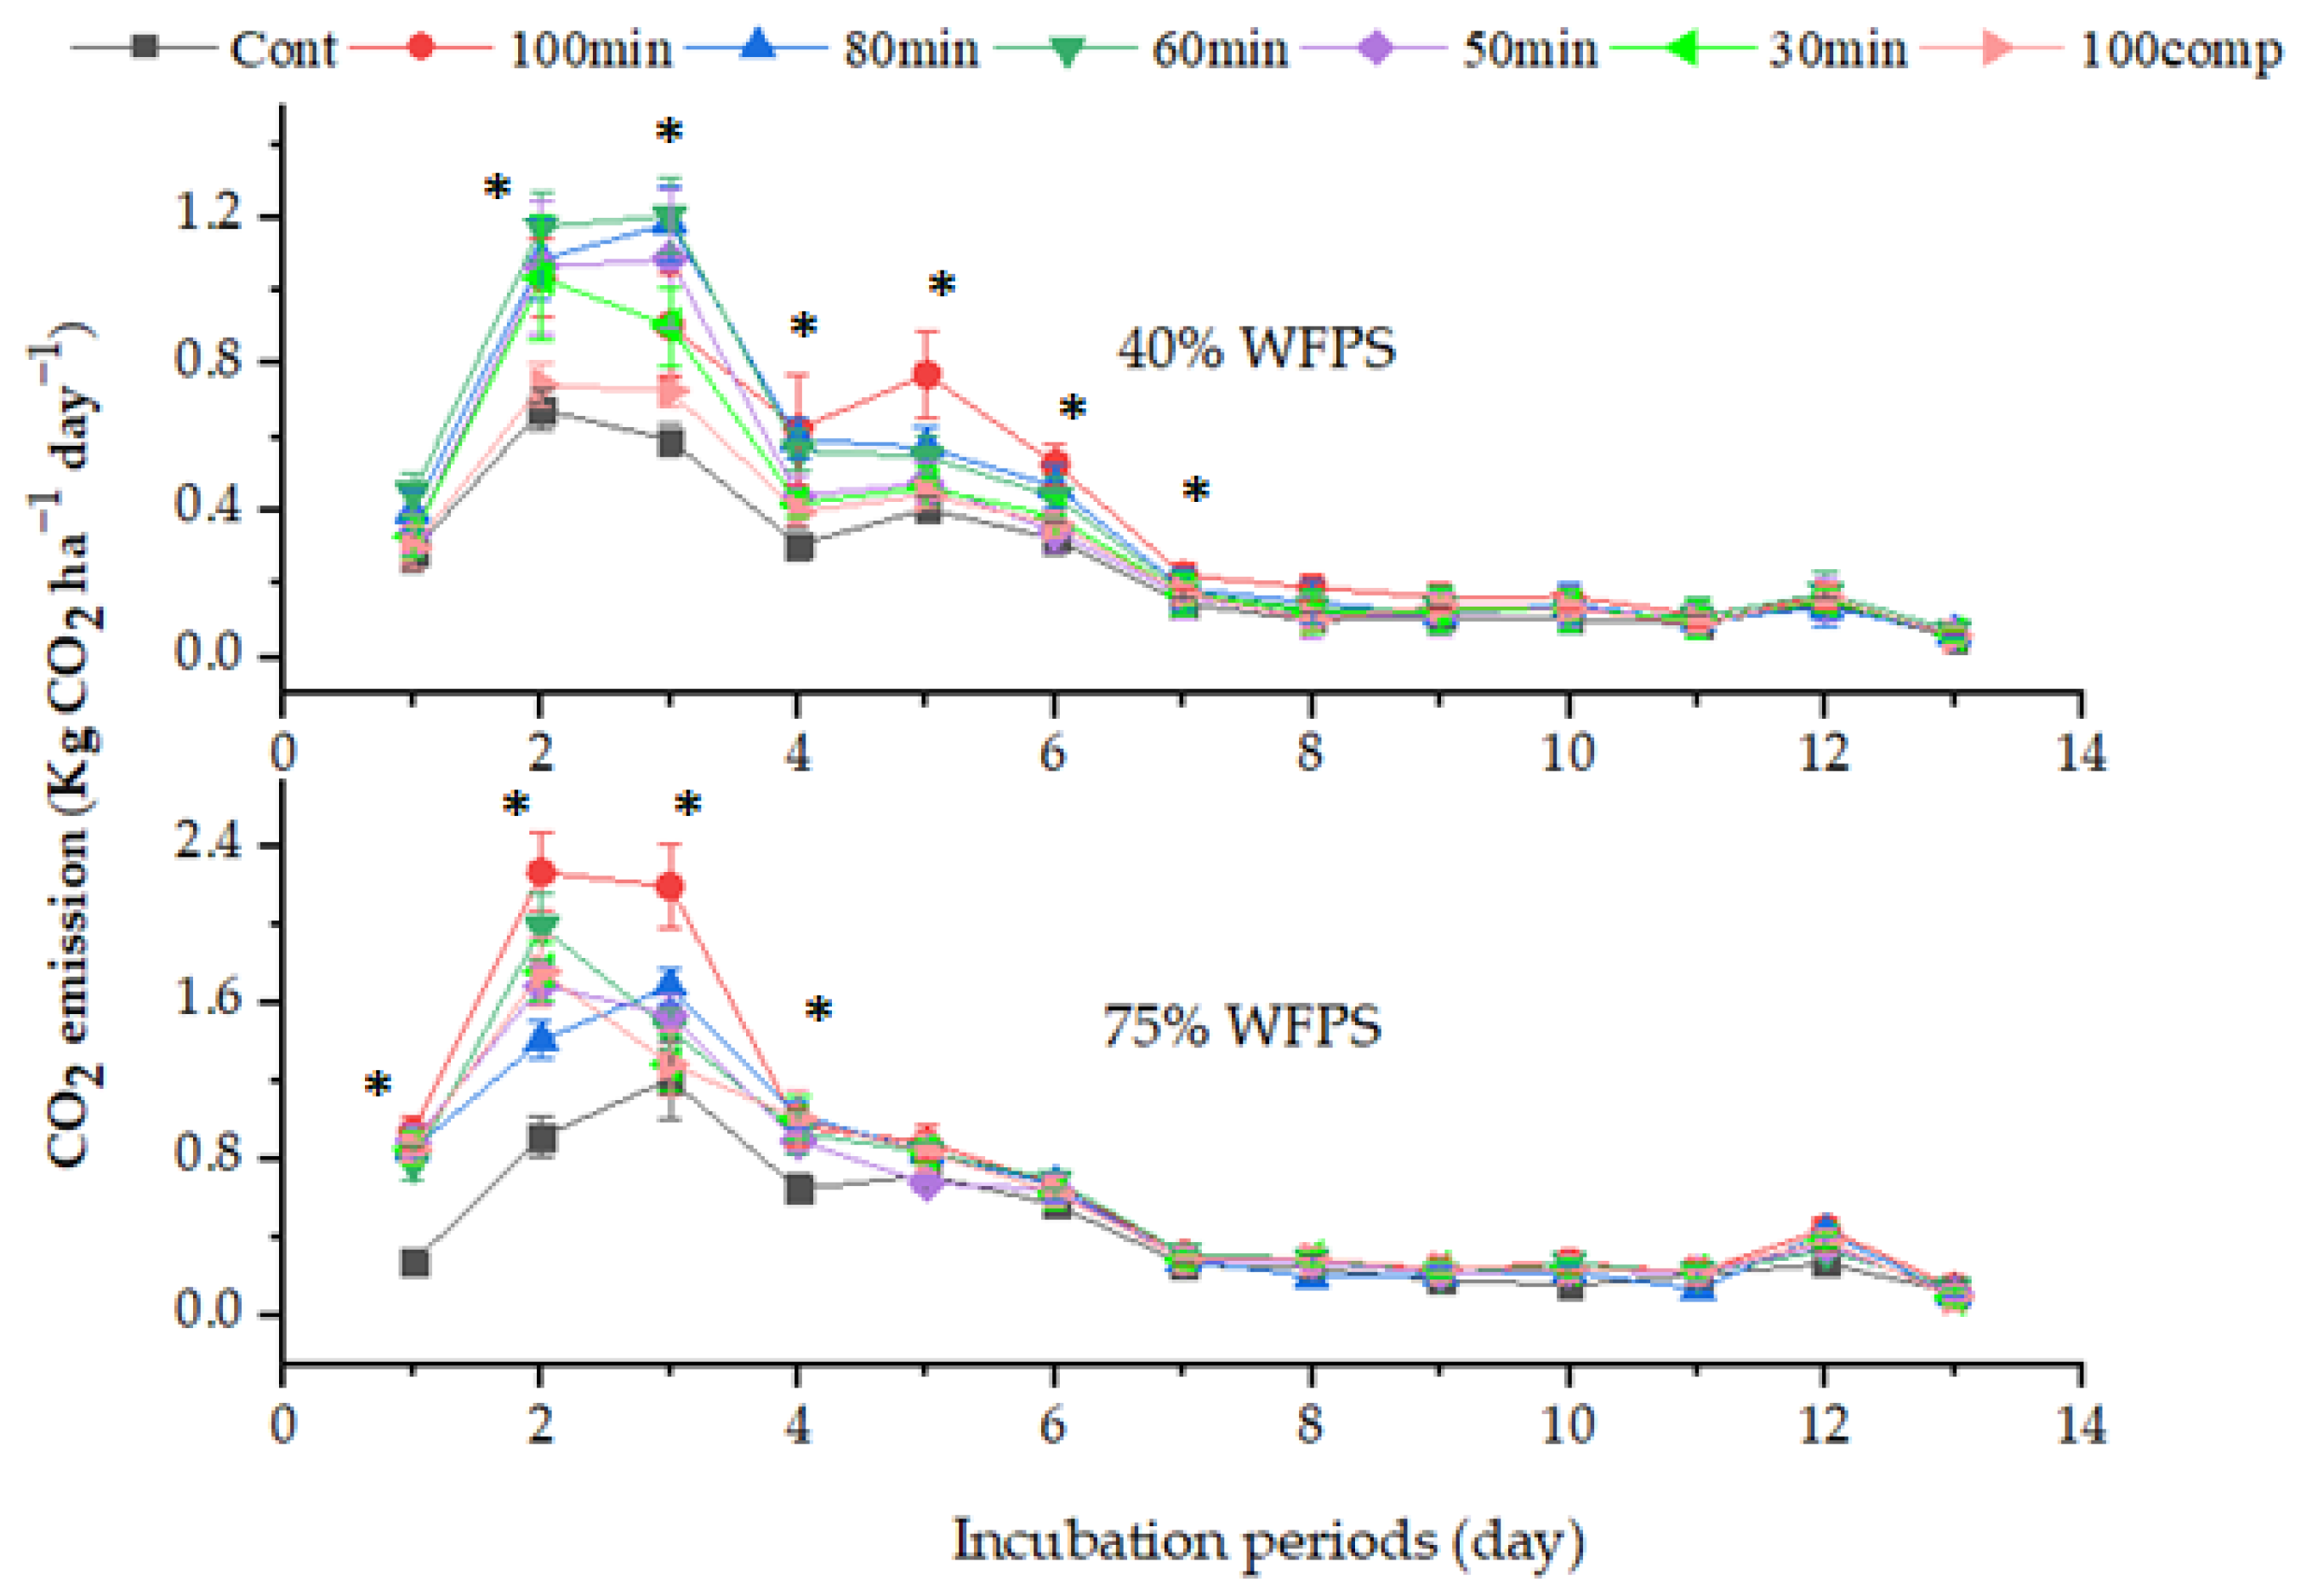
3.2. Daily Greenhouse Gas Emissions

The emission of GHGs was estimated in an incubation experiment with different soil moistures. Generally, GHG emissions were lower in dry soil (40%WFPS) than in wet soil (75% WFPS). High GHG emissions were measured on the second and third day of incubation. After the sixth day, the emission clearly decreased and remained at a similar level until the end of the experiment.
The N2O fluxes varied depending on the treatments, although a treatment effect was not found on each day of the experiment (Figure 3, Table A1 and Table A2). Relatively high fluxes were observed on the second day for the 60 min (3.17 g N2O-N ha−1 day−1) and the 100 min (2.71 g N2O-N ha−1 days−1) treatments in wet soil. On day three to five, the treatment with 100% mineral fertilizer stood out with about three to five times higher N2O emissions than the control (0.44 to 0.81 g N2O-N ha−1day−1) and the 100comp treatment (0.54 to 0.91 kg N2O-N ha−1day−1) (p < 0.05). Under dry conditions at 40% WFPS, the differences between the fertilizer treatments were less pronounced, though significant at several days of measurement with high values found again for the 100 min treatment. Lowest N2O emissions throughout the measurement time were usually observed in the control and 100comp treatments under both moisture conditions.
Similar to N2O, we usually observed greater daily emissions of CO2 from amended soil than from the control soil in the first days of measurement (Figure 4, Table A3 and Table A4). The peaks were observed on day two and three for both moisture levels. The fertilizer treatments showed different patterns depending on the soil moisture. For 75% WFPS, the 100 min treatment showed high values which were significantly higher than the control and the 100comp treatment (p < 0.05) and tendentially higher than all other fertilizer treatments on day two with 2.27 kg CO2-C ha−1day−1 and three with 2.20 kg CO2-C ha−1day−1. Under dry conditions, the 40comp treatment emitted more CO2 than the control and the 100comp treatment (p < 0.05) and tendentially more than all other fertilizer treatments on days two with 1.17 kg CO2-C ha−1day−1 and three with 1.21 kg CO2–C ha−1day−1. With running incubation time, as for the wet conditions, again the 100 min was found to release relatively high amounts of CO2.
The CH4 emissions were highest on days two and three (Figure 5). No differences were found between the treatments.

3.3. Cumulative Greenhouse Gas Emissions, Global Warming Potential, and Nitrous Oxide Emission Factor

Over the 28 days of incubations time, the cumulative N2O and CO2 but not CH4 emissions were affected by the fertilizer treatments and moisture levels (p < 0.05) (Table 4). In both moisture levels, the application of 100% mineral fertilizers resulted in higher (p < 0.05) N2O emissions than the application of 100% compost under wet (156% more) and dry (31% more) conditions. The different ratios of compost and mineral fertilizers rarely resulted in significant differences of N2O emissions, but tendentially more N2O was emitted when the ratio of mineral fertilizers increased. Similar statements can be made for CO2, with low emissions in the control and 100comp treatment.
At both moisture levels (40% and 75%), we observed strong negative correlations between C-input and cumulative N2O emissions (40%: r = −0.77, p < 0.001; 75%: r = −0.52, p < 0.047), and also between C-input and CO2 emissions (40%: r = −0.82, p < 0.001; 75%: r = −0.59, p < 0.02) (Table 5).
The N2O emission factor (N2O EF) depends mathematically on the N2O emission and consequently; as for the N2O emissions, the N2O EF values were found to be higher (p < 0.05) in the 100 min treatment than in the 100comp treatment at both moisture levels (Table 4). At 75% WFPS, the N2O EF was in the 100 min treatment more than ten times higher as in the 100comp treatment (0.28 vs. 3.85%).
Clear differences between the mineral and the compost treatments were also found for the global warming potential (GWP) (Table 4), which is mathematically based on the emissions of the three GHGs. At 75% WFPS, the GWP in the 100 min treatment was with 15.0 kg CO2 eq. ha−1 higher than all other treatments, except the 60 min treatment. With increasing ratios of mineral fertilizer, there is a trend of increasing GWP values under both soil moisture conditions.

3.4. Dehydrogenase Enzyme Activity

The dehydrogenase (DH) activity hardly varied between the two sampling dates on day 1 and day 7 (Table 6). The control without any amendments had with about 65 µg TPF g−1 24 h−1 usually lower DH activities than the treatments with fertilizer application. The ratio of organic to mineral fertilizers was not decisive for the activity of the DH. In contrast to the other characteristics, the soil moisture was also not relevant for the activity of the DH (p < 0.05).

4. Discussion

4.1. Higher Maize Yields and Agronomic Nitrogen Use Efficiency in the Combined Fertilizer Treatments

The results of our study showed that higher yields and ANUE were found in the combined application of compost (compost N: 40–70%) and mineral fertilizers (mineral fertilizer N: 30–60%) compared to other treatments. Positive yield effects of combined applications of organic and mineral fertilizers were also found in other studies under varying growing conditions [29,64,65,66], and often this was attributed to an improved soil structure [67,68], intensification of biological processes in soil [68], higher water storage capacity [64,65], and higher cation exchange capacity [69] (see also Introduction).
The rainfall pattern in the second year was less suitable for plant productions than in the first year, which resulted in lower yields, even if the differences were not particularly great (8.26 vs. 9.39 Mg ha−1, averaged across all treatments). Even under less-favorable conditions, higher yields and ANUE were found when mineral fertilizers were combined with compost. The results suggest that under extreme weather conditions and stronger yield depressions, which will probably occur more frequently in Ethiopia in the future [70], compost application can contribute to maintaining yields which has been demonstrated for agricultural and horticultural crops [8,9,68].
Another advantage of compost application is the supply of plant nutrients. The mineral fertilizer application in this experiment only consisted of N, P, and S, while composts contain all plant nutrients, albeit in differing concentrations, depending on the original material [65]. And although the site was not described as being deficient in nutrients—apart from the low P content—the application of various nutrients could have supported plant growth. However, despite of all these positive impacts of the compost application described, the treatment with 100% compost application was (at least tendentially) agronomically less suitable than the fertilizer mixtures with 40 to 70% of the N provided by compost. This can be explained by the availability of mineral N. The majority of N in composts is bound in stable organic compounds [71], and assumed 35% of N released in the year of application [48]. This can hamper maize growth, especially in periods of high N demands during the plant development [72]. Our results showed that shares of 40 to 70% N from compost in the fertilizer combinations are most suitable for maize growth under these growing conditions. The C:N ratio in these combinations were 2.7, 3.5, and 5.1, respectively. The addition of only 20% compost with a C:N ratio of 1.2 was obviously not enough to benefit from the organic matter supply.
The experimental field in our study was well managed in previous years, including adequate fertilizer management. The total content of N (about 2.2 g kg−1, which corresponds to about 5000 kg N ha−1 in the upper 30 cm of soil) as well as the content of organic C (about 24 g kg−1) in the soil were rather favourable and in the range of other Nitisol sites with proper soil management [73,74]. A fallow was applied at this site one year before our study started. These facts can explain the relatively high maize grain yield with the control treatment without fertilizers. In contrast to the fertilizer mixtures, we observed a non-responsiveness of maize yields to the application of sole mineral fertilizer (100 min) in both experimental years. This is partly related to the fertility of the soil, as also shown in a study by Negassa et al. [75]. However, we believe that the non-responsiveness of maize yields to mineral fertilizers in this study was also attributed to low availability of P. The bio-available soil P content was with 2 mg kg−1 very low at the beginning of the study, which can be reasoned with the acidic soil conditions (pH= 4.9) and high iron content, which usually reduce the availability of P [42,48,76]. As organic matter in soil can reduce P fixation, it contributes to a better availability of P for crops [77], which can explain the positive effect of compost in the mixtures. Unfavorable soil or weather conditions were cited in 68% of the surveyed agricultural fields in sub-Saharan Africa as a reason why mineral fertilizer use did not increase maize yield [78]. This indicates that the multiple interacting factors affecting crop yields are difficult to quantify in general, and that a careful evaluation of fertilizer practices for each cropping site is necessary to ensure returns on fertilizer investments.
As described above, the organic material in the compost is stabilized during the composting process. Although it was not tested in our experiment, fresh organic materials such as farmyard manure may have different effects, because of the faster decomposition of organic matter and cycling of nutrients [79]. For areas with same soil type, recent results showed an advantage of compost over farmyard manure [29,65].
Higher yields in the combined treatments were related to higher NUE, which is of great importance in Ethiopian agriculture. The results of the two growing seasons showed that the 30 min, 50 min, and 60 min treatments had with 12.7 to 18.2 kg grain per kg N about three times higher NUE than the other treatments. Thus, the results indicate that combined fertilizer application having 40% to 70% of the total N from compost can be a suitable measure to stabilize maize yields and increase nutrient efficiency in the study area.

4.2. Mitigation of GHG Emissions by Compost Application

Fertilizer types and rates had a significant effect on N2O and CO2 emissions and GWP from the Nitisol soil in the incubation experiment, although their influences varied in dependence on the soil moisture. The 100 min treatment resulted in higher N2O and CO2 emission than the control or 100comp, especially under wet soil conditions (75% WFPS).
High amounts of available N usually intensify the denitrification process and the N2O emissions [32,55,80] (see also introduction). In our study N2O emissions were reduced when the mineral fertilizers were combined with compost. This can be explained by the replacement of the mineral N by organic N, and consequently by an initial microbial immobilization of N [80,81] and/or slow release of N from the organic part in the ratios. Furthermore, compost application can increase the abundance of denitrifying microorganisms and thus favoring the complete denitrification and production of dinitrogen gas instead of N2O [14]. The availability of N also plays a role in CO2 emissions. Due to a reduction of available N, the microbial activity and decomposition of native soil organic matter usually decreases [82].
Besides the availability of N, the interactive effects of N and C supply also influence the emission of GHGs [83]. High microbial activity due to C supply with organic fertilizers can result in an intensification of microbial-induced processes [84]. However, negative correlations were observed between C input and N2O and CO2 emissions in our incubation experiment. The increased C:N ratio with increasing portion of compost in the mixtures could be the reason, which resulted finally in a limitation of N for microbial activities despite the higher C stocks. This is also supported by the microbial activity (DHA), which was not increased with increasing rates of compost in comparison to 100 min.
The reduction of CO2 and N2O emissions after the application of organic material was also highlighted in other studies with other amendments, such as crop residues [35,80] or manure [85]. Amendments with high C:N ratio like straw (up to 100:1) resulted in low N2O emission and is also an option to replenish soil organic matter [80] but may hamper the N nutrition of crops [86].
The majority of the gases were emitted during the first days after incubation, which was also shown in other incubation studies, as for Ferralsol [35] and Vertisol [80]. The results indicate the risk of high GHG emissions in a relatively short period after fertilizer application during the main crop growing season in Ethiopia when the soil is relatively wet. For sites with a high availability of N, the addition of organic material with a high C:N ratio like crops residues could be a good means under these conditions to reduce N2O emissions [35,80].
Generally, for soils rich in C and N, higher CO2 and N2O emissions can be expected. The C and N content of our soil (C, 24 g kg−1 and N, 2.2 g kg−1; see Table 1) were in the range of other Nitisols in Ethiopia [42] but higher than the majority of other soils in Ethiopia and other East African regions [87]. The results of other incubation experiments can also be interpreted in this context, with very low N2O emissions from Ferralsol with little or no N input [35] and high N2O emissions in fertilizer treatments with N application of >200 kg ha in Vertisol [80].
The fertilizer types and rates did not affect CH4 emissions in either moisture level and no correlations between C or N-input and CH4 emission were found in our incubation experiment. The emission of CH4 comes primarily from fields under flooded conditions [24,88] with higher water content than in our experiment. In this context, Brembong et al. [89] described soils with normal WFPS as very effective CH4 sinks.
Results of management strategies from other studies have to be considered with caution, as GHGs emissions vary depending on the physicochemical properties of soils [32,83]. For instance, a higher clay content of soil is usually related to higher water retention and higher emission of CH4 and N2O, which can explain that relatively high GHG emission were often found for Vertilsols due to their tendency to become waterlogged [80]. Nyamadzawo et al. [32] reported comparably low N2O emissions for Lixisol (about 0.5 kg ha−1) and Inceptisol of (about 1.5 kg ha–1) for different fertilizer treatments during a cropping season in Zimbabwe, which was attributed to the soil texture with high content of sand and low water retention. Another important soil characteristic regarding GHG emissions is soil pH. A low pH value is not suitable for most microorganisms involved in CH4 and CO2 metabolism [90], and from acid soils like Nitisols (the pH of soil in our study was 4.9) potentially lower CH4 and CO2 emissions can be expected than from neutral soils.
The effect of moisture was especially important for N2O emissions in the 100 min treatment, which were much higher under wet (75% WFPS) than under dry soil conditions. In wet conditions, anaerobic bacteria use NO3 as an electron acceptor during microbial oxidation and release N2O through the process of denitrification [19]. The CO2 emissions were also generally higher under wet conditions and the effects of the treatment were more pronounced than under dry conditions. The proportion of the pores filled with water and soil aeration affect CO2 emissions [91,92] and CO2 emissions from soil can increase linearly with the soil water content until saturation point, after which the emissions decrease again. For most soils, the saturation point for CO2 emission is >70% [36,93]. In this study, no effects of soil moisture were found on DH activity. Probably the range of moisture was still relatively suitable for microbial activity and with about 70 to 80 µg TPF g−1 TS 24 h−1 the activity of DH was relatively high (e.g., in comparison to Stagnic Cambisol [84]). Clear inhibitions of microbial activities can be found for very low water contents of air-dried soils [24].
Compost was shown to be a suitable amendment considering GHGs and maize yield in our study. However, like mineral fertilizers, compost is also limited in Ethiopia, especially in the area where organic resources are used for another purpose such as fuel, food for animals, or construction material [65,94,95]. As different ratios of compost and mineral fertilizers in the mixtures were found to be suitable to reduce N2O and CO2 emissions and increase maize yield (see Section 4.1), upon the availability of resources, the proportions of these types of fertilizers can be set flexibly in a certain range around 50:50. Beside the evaluation of the fertilizer effect, the ANUE might also be a good indicator to predict GHG emissions [80] and accordingly, the ANUE was found to be highest in the 30 min, 50 min, and 60 min treatments (see Section 4.1).

5. Conclusions

The results of this study showed that the combined application of compost and mineral fertilizer can be an option for enhancing maize yields and mitigating GHG emissions from Nitisols in Southwestern Ethiopia. Utilization of compost as fertilizer can be especially suitable during the wet season and might be an option to mitigate negative yield effects of extreme weather conditions, which will probably occur more frequently due to climate change in Ethiopia. To verify the results of the GHG emissions from the incubation experiment, further investigations should take place at the field level.

Author Contributions

Conceptualization, G.W.Z. and B.E.-L.; methodology, G.W.Z. and P.K.; formal analysis, G.W.Z., B.E.-L., D.-G.K. and P.K.; investigation, G.W.Z., P.K., and B.E.-L.; data curation, G.W.Z. and B.E.-L.; writing—original draft preparation, G.W.Z., B.E.-L., D.-G.K. and P.K.; writing—review and editing, B.E.-L., G.W.Z., D.-G.K. and P.K.; visualization, G.W.Z.; supervision, B.E.-L.; All authors have read and agreed to the published version of the manuscript.

Funding

This research received no external funding. The APC is funded by Rostock University via the University Library. This study was financially supported by KfW Project No. 51235 through ExiST Project Ethiopia: Excellence in Science and Technology.

Institutional Review Board Statement

Not applicable.

Informed Consent Statement

Not applicable.

Data Availability Statement

Not applicable.

Acknowledgments

We thank KfW Development Bank Germany for the financial support and the Ministry of Education of Ethiopia for the effective coordination of this project. D.-G.K acknowledged the support from IAEA CRP D15020. The authors thank Nicole Wrage-Mönnig for providing experimental material.

Conflicts of Interest

The authors declare no conflict of interest.

Appendix A

Table A1. Daily emission of nitrous oxide (N2O) at 40% water-filled pore space in different fertilizer treatments (incubation experiment). Only the days with significant differences between the treatments are listed.
TreatmentDay 2 Day 3 Day 4 Day 5 Day 6 Day 9 Day 10
(g N2O-N ha−1)
Cont1.01 ± 0.04 a0.76 ± 0.14 a0.41 ± 0.05 a0.54 ± 0.02 a0.42 ± 0.10 a0.14 ± 0.01 a0.15 ± 0.02 a
100 min1.35 ± 0.08 ab0.84 ± 0.09 ab0.95 ± 0.09 b0.95 ± 0.14 b0.55 ± 0.08 ab0.30 ± 0.01 b0.35 ± 0.02 b
80 min1.38 ± 0.21 ab0.99 ± 0.21 b0.60 ± 0.05 b0.78 ± 0.10 ab0.64 ± 0.10 b0.21 ± 0.01 ab0.36 ± 0.02 b
40 comp1.47 ± 0.20 b1.01 ± 0.21 b0.60 ± 0.09 b0.78 ± 0.12 ab0.60 ± 0.06 ab0.21 ± 0.01 ab0.24 ± 0.01 ab
50 min1.29 ± 0.20 ab0.94 ± 0.14 ab0.51 ± 0.04 ab0.65 ± 0.08 a0.49 ± 0.05 ab0.23 ± 0.01 ab0.34 ± 0.01 b
30 min1.20 ± 0.20 ab0.92 ± 0.10 ab0.51 ± 0.10 ab0.66 ± 0.09 a0.56 ± 0.12 ab0.23 ± 0.01 ab0.26 ± 0.01 ab
100 comp1.03 ± 0.05 ab0.86 ± 0.20 ab0.48 ± 0.02 ab0.59 ± 0.10 a0.48 ± 0.05 a0.19 ± 0.02 ab0.23 ± 0.01 ab
Different letters within the same column indicate significant differences among the treatments using the Tukey HSD test (p < 0.05).
Table A2. Daily emission of nitrous oxide (N2O) at 75% water-filled pore space in different fertilizer treatments (incubation experiment). Only the days with significant differences between the treatments are listed.
Treatment Day 1 Day 2 Day 3 Day 4 Day 5 Day 8 Day 9 Day 10 Day 12
(g N2O-N ha−1)
Cont0.39 ± 0.06 a1.16 ± 0.08 a0.81 ± 0.10 a0.44 ± 0.07 a0.72 ± 0.08 a0.24 ± 0.06 a0.23 ± 0.06 a0.26 ± 0.06 a0.16 ± 0.06 a
100 min1.07 ± 0.11 b2.71 ± 0.21 cd3.03 ± 0.22 b2.42 ± 0.30 b2.14 ± 0.22 b0.49 ± 0.11 a0.48 ± 0.10 b0.60 ± 0.10 b0.65 ± 0.11 b
80 min1.03 ± 0.11 b1.70 ± 0.11 abc1.15 ± 0.11 a1.25 ± 0.11 a0.9 ± 0.03 ab0.27 ± 0.03 a0.36 ± 0.05 ab0.36 ± 0.05 ab0.21 ± 0.01 ab
60 min1.0 ± 0.20 b3.17 ± 0.40 d1.55 ± 0.40 ab1.55 ± 0.21 ab1.48 ± 0.21 ab0.67 ± 0.10 b0.41 ± 0.11 ab0.52 ± 0.10 ab0.60 ± 0.10 b
50 min1.10 ± 0.20 b2.21 ± 0.30 abcd1.37 ± 0.20 a1.05 ± 0.20 ab0.77 ± 0.11 a0.43 ± 0.06 a0.40 ± 0.10 ab0.37 ± 0.10 ab0.21 ± 0.06 ab
30 min1.07 ± 0.21 b2.52 ± 0.30 bcd1.08 ± 0.21 a1.19 ± 0.21 ab0.91 ± 0.11 ab0.35 ± 0.06 a0.34 ± 0.06 ab0.40 ± 0.07 ab0.26 ± 0.04 ab
100 comp0.67 ± 0.03 a1.32 ± 0.10 ab0.91 ± 0.11 a0.54 ± 0.03 a0.80 ± 0.05 a0.25 ± 0.06 a0.21 ± 0.05 a0.29 ± 0.06 a0.18 ± 0.05 a
Different letters within the same column indicate significant differences among the treatments using the Tukey HSD test (p < 0.05).
Table A3. Daily emission of carbon dioxide (CO2) at 40% water-filled pore space in different fertilizer treatments (incubation experiment). Only the days with significant differences between the treatments are listed.
Treatment Day 2 Day 3 Day 4 Day 5 Day 6 Day 7
(kg CO2 –C ha−1)
Cont0.68 ± 0.06 a0.59 ± 0.05 a0.31 ± 0.05 a0.41 ± 0.04 a0.33 ± 0.05 a0.15 ± 0.02 a
100 min1.04 ± 0.10 abc0.91 ± 0.14 abc0.62 ± 0.15 d0.77 ± 0.12 c0.53 ± 0.06 b0.23 ± 0.04 b
80 min1.09 ± 0.10 bc1.18 ± 0.10 c0.60 ± 0.06 cd0.57 ± 0.06 b0.47 ± 0.06 ab0.19 ± 0.06 ab
60 min1.17 ± 0.09 c1.21 ± 0.10 c0.57 ± 0.06 bcd0.55 ± 0.06 b0.44 ± 0.05 ab0.19 ± 0.06 ab
50 min1.06 ± 0.2 bc1.09 ± 0.20 bc0.44 ± 0.05 abc0.48 ± 0.06 ab0.34 ± 0.06 a0.17 ± 0.06 a
30 min0.89 ± 0.2 abc0.92 ± 0.10 abc0.42 ± 0.04 ab0.46 ± 0.05 ab0.39 ± 0.06 ab0.17 ± 0.06 a
100 comp0.73 ± 0.06 ab0.73 ± 0.05 ab0.40 ± 0.04 ab0.44 ± 0.04 ab0.37 ± 0.04 a0.18 ± 0.03 a
Different letters within the same column indicate significant differences among the treatments using the Tukey HSD test (p < 0.05).
Table A4. Daily emission of carbon dioxide (CO2) at 75% water-filled pore space in different fertilizer treatments (incubation experiment). Only the days with significant differences between the treatments are listed.
Treatment Day 1Day 2Day 3Day 4
(kg CO2 –C ha−1)
Cont0.28 ± 0.07 a0.92 ± 0.10 a1.22 ± 0.20 a0.65 ± 0.07 a
100 min0.95 ± 0.08 c2.27 ± 0.21 d2.20 ± 0.21 b0.97 ± 0.10 ab
80 min0.86 ± 0.08 c1.41 ± 0.10 abc1.69 ± 0.10 ab1.03 ± 0.07 b
60 min0.79 ± 0.08 c1.99 ± 0.20 cd1.47 ± 0.11 a0.94 ± 0.11 ab
50 min0.90 ± 0.08 c1.70 ± 0.10 bcd1.55 ± 0.10 ab0.90 ± 0.06 ab
30 min0.86 ± 0.08 c1.78 ± 0.20 bcd1.29 ± 0.14 a1.01 ± 0.11 b
100 comp0.54 ± 0.08 b1.10 ± 0.20 ab1.44 ± 0.20 a0.84 ± 0.20 ab
Different letters within the same column indicate significant differences among the treatments using the Tukey HSD test (p < 0.05).

References

  1. Tesfai, M.; Moed, I.; Greipsland, I.; Huber, T.; van Duivenbooden, N. Integrated Soil Management Practices. In Climate Change and Agricultural Development; Nagothu, U.S., Ed.; Taylor & Francis Group: Abingdon, UK, 2016; Chapter 8; pp. 161–184. [Google Scholar]
  2. Komatsuzaki, M.; Ohta, H. Soil Management Practices for Sustainable Agro-Ecosystems. Sustain. Sci. 2007, 2, 103–120. [Google Scholar] [CrossRef]
  3. Raji, S.G.; Dörsch, P. Effect of legume intercropping on N2O emissions and CH4 uptake during maize production in the Great Rift Valley, Ethiopia. Biogeosciences 2020, 17, 345–359. [Google Scholar] [CrossRef] [Green Version]
  4. Timsina, J. Can Organic Sources of Nutrients Increase Crop Yields to Meet Global Food Demand? Agronomy 2018, 8, 214. [Google Scholar] [CrossRef] [Green Version]
  5. Hernández, T.; Chocano, C.; Moreno, J.-L.; García, C. Towards a More Sustainable Fertilization: Combined Use of Compost and Inorganic Fertilization for Tomato Cultivation. Agric. Ecosyst. Environ. 2014, 196, 178–184. [Google Scholar] [CrossRef]
  6. Brock, C.; Oltmanns, M.; Matthes, C.; Schmehe, B.; Schaaf, H.; Burghardt, D.; Horst, H.; Spieß, H. Compost as an Option for Sustainable Crop Production at Low Stocking Rates in Organic Farming. Agronomy 2021, 11, 1078. [Google Scholar] [CrossRef]
  7. Ribas-Agustí, A.; Seda, M.; Sarraga, C.; Montero, J.I.; Castellari, M.; Muñoz, P. Municipal Solid Waste Composting: Application as a Tomato Fertilizer and Its Effect on Crop Yield, Fruit Quality and Phenolic Content. Renew. Agric. Food Syst. 2017, 32, 358–365. [Google Scholar] [CrossRef]
  8. Martínez-Blanco, J.; Muñoz, P.; Antón, A.; Rieradevall, J. Assessment of Tomato Mediterranean Production in Open-Field and Standard Multi-Tunnel Greenhouse, with Compost or Mineral Fertilizers, from an Agricultural and Environmental Standpoint. J. Clean. Prod. 2011, 19, 985–997. [Google Scholar] [CrossRef]
  9. Martínez-Blanco, J.; Lazcano, C.; Christensen, T.H.; Muñoz, P.; Rieradevall, J.; Møller, J.; Antón, A.; Boldrin, A. Compost Benefits for Agriculture Evaluated by Life Cycle Assessment. A Review. Agron. Sustain. Dev. 2013, 33, 721–732. [Google Scholar] [CrossRef] [Green Version]
  10. Diacono, M.; Montemurro, F. Long-Term Effects of Organic Amendments on Soil Fertility. A Review. Agron. Sustain. Dev. 2010, 30, 401–422. [Google Scholar] [CrossRef] [Green Version]
  11. Abiven, S.; Menasseri, S.; Chenu, C. The Effects of Organic Inputs over Time on Soil Aggregate Stability—A Literature Analysis. Soil Biol. Biochem. 2009, 41, 1–12. [Google Scholar] [CrossRef]
  12. Bonanomi, G.; Antignani, V.; Pane, C.; Scala, F. Suppression of Soilborne Fungal Diseases with Organic Amendments. J. Plant Pathol. 2007, 89, 311–324. [Google Scholar]
  13. Zicker, T.; von Tucher, S.; Kavka, M.; Eichler-Löbermann, B. Soil Test Phosphorus as Affected by Phosphorus Budgets in Two Long-Term Field Experiments in Germany. Field Crop. Res. 2018, 218, 158–170. [Google Scholar] [CrossRef]
  14. Lazcano, C.; Zhu-Barker, X.; Decock, C. Effects of Organic Fertilizers on the Soil Microorganisms Responsible for N2O Emissions: A Review. Microorganisms 2021, 9, 983. [Google Scholar] [CrossRef]
  15. Ling, N.; Zhu, C.; Xue, C.; Chen, H.; Duan, Y.; Peng, C.; Guo, S.; Shen, Q. Insight into How Organic Amendments Can Shape the Soil Microbiome in Long-Term Field Experiments as Revealed by Network Analysis. Soil Biol. Biochem. 2016, 99, 137–149. [Google Scholar] [CrossRef]
  16. Sileshi, G.W. Nutrient Use Efficiency and Crop Yield Response to the Combined Application of Cattle Manure and Inorganic Fertilizer in Sub-Saharan Africa. Nutr. Cycl. Agroecosystems 2019, 113, 181–199. [Google Scholar] [CrossRef]
  17. Zhu, X.; Silva, L.C.R.; Doane, T.A.; Wu, N.; Horwath, W.R. Quantifying the Effects of Green Waste Compost Application, Water Content and Nitrogen Fertilization on Nitrous Oxide Emissions in 10 Agricultural Soils. J. Environ. Qual. 2013, 42, 912–918. [Google Scholar] [CrossRef] [Green Version]
  18. Hu, Q.; Liu, T.; Jiang, S.; Cao, C.; Li, C.; Chen, B.; Liu, J. Combined Effects of Straw Returning and Chemical N Fertilization on Greenhouse Gas Emissions and Yield from Paddy Fields in Northwest Hubei Province, China. J. Soil Sci. Plant Nutr. 2020, 20, 392–406. [Google Scholar] [CrossRef]
  19. Zhu, T.; Zhang, J.; Yang, W.; Cai, Z. Effects of Organic Material Amendment and Water Content on NO, N2O, and N2 Emissions in a Nitrate-Rich Vegetable Soil. Biol. Fertil. Soils 2013, 49, 153–163. [Google Scholar] [CrossRef]
  20. Das, S.; Adhya, T.K. Effect of Combine Application of Organic Manure and Inorganic Fertilizer on Methane and Nitrous Oxide Emissions from a Tropical Flooded Soil Planted to Rice. Geoderma 2014, 213, 185–192. [Google Scholar] [CrossRef]
  21. Grave, R.A.; Nicoloso, R.; Cassol, P.C.; da Silva, M.L.B.; Mezzari, M.P.; Aita, C.; Wuaden, C.R. Determining the Effects of Tillage and Nitrogen Sources on Soil N2O Emission. Soil Tillage Res. 2018, 175, 1–12. [Google Scholar] [CrossRef]
  22. Weitao, L.I.; Meng, W.U.; Ming, L.I.U.; Jiang, C.; Chen, X.; Kuzyakov, Y.; Zhongpei, L. I Responses of Soil Enzyme Activities and Microbial Community Composition to Moisture Regimes in Paddy Soils under Long-Term Fertilization Practices. Pedosphere 2018, 28, 323–331. [Google Scholar]
  23. Chapuis-Lardy, L.; Wrage, N.; Metay, A.; Chotte, J.-L.; Bernoux, M. Soils, a Sink for N2O? A Review. Glob. Chang. Biol. 2007, 13, 1–17. [Google Scholar] [CrossRef]
  24. Wang, R.; Filley, T.R.; Xu, Z.; Wang, X.; Li, M.-H.; Zhang, Y.; Luo, W.; Jiang, Y. Coupled Response of Soil Carbon and Nitrogen Pools and Enzyme Activities to Nitrogen and Water Addition in a Semi-Arid Grassland of Inner Mongolia. Plant Soil 2014, 381, 323–336. [Google Scholar] [CrossRef]
  25. Wolińska, A.; Stępniewska, Z. Dehydrogenase Activity in the Soil Environment. In Dehydrogenases; Canuto, R.A., Ed.; InTech: Rijeka, Croatia, 2012; pp. 183–209, in press. [Google Scholar]
  26. Chang, E.-H.; Chung, R.-S.; Tsai, Y.-H. Effect of Different Application Rates of Organic Fertilizer on Soil Enzyme Activity and Microbial Population. Soil Sci. Plant Nutr. 2007, 53, 132–140. [Google Scholar] [CrossRef]
  27. Nath, D.J.; Ozah, B.; Baruah, R.; Barooah, R.C.; Borah, D.K.; Gupta, M. Soil Enzymes and Microbial Biomass Carbon under Rice-Toria Sequence as Influenced by Nutrient Management. J. Indian Soc. Soil Sci. 2012, 60, 20–24. [Google Scholar]
  28. Shen, W.; Lin, X.; Shi, W.; Min, J.; Gao, N.; Zhang, H.; Yin, R.; He, X. Higher Rates of Nitrogen Fertilization Decrease Soil Enzyme Activities, Microbial Functional Diversity and Nitrification Capacity in a Chinese Polytunnel Greenhouse Vegetable Land. Plant Soil 2010, 337, 137–150. [Google Scholar] [CrossRef]
  29. Bayu, T. Review on Contribution of Integrated Soil Fertility Management for Climate Change Mitigation and Agricultural Sustainability. Cogent Environ. Sci. 2020, 6, 1823631. [Google Scholar] [CrossRef]
  30. Ruser, R.; Flessa, H.; Russow, R.; Schmidt, G.; Buegger, F.; Munch, J. C Emission of N2O, N2 and CO2 from Soil Fertilized with Nitrate: Effect of Compaction, Soil Moisture and Rewetting. Soil Biol. Biochem. 2006, 38, 263–274. [Google Scholar] [CrossRef]
  31. Shakoor, A.; Shakoor, S.; Rehman, A.; Ashraf, F.; Abdullah, M.; Shahzad, S.M.; Farooq, T.H.; Ashraf, M.; Manzoor, M.A.; Altaf, M.M.; et al. Effect of Animal Manure, Crop Type, Climate Zone, and Soil Attributes on Greenhouse Gas Emissions from Agricultural Soils—A Global Meta-Analysis. J. Clean. Prod. 2021, 278, 124019. [Google Scholar] [CrossRef]
  32. Nyamadzawo, G.; Shi, Y.; Chirinda, N.; Olesen, J.E.; Mapanda, F.; Wuta, M.; Wu, W.; Meng, F.; Oelofse, M.; de Neergaard, A.; et al. Combining Organic and Inorganic Nitrogen Fertilisation Reduces N2O Emissions from Cereal Crops: A Comparative Analysis of China and Zimbabwe. Mitig. Adapt. Strateg. Glob. Change 2017, 22, 233–245. [Google Scholar] [CrossRef]
  33. Oertel, C.; Matschullat, J.; Zurba, K.; Zimmermann, F.; Erasmi, S. Greenhouse Gas Emissions from Soils—A Review. Geochemistry 2016, 76, 327–352. [Google Scholar] [CrossRef] [Green Version]
  34. Kostyanovsky, K.I.; Huggins, D.R.; Stockle, C.O.; Morrow, J.G.; Madsen, I. J Emissions of N2O and CO2 Following Short-Term Water and n Fertilization Events in Wheat-Based Cropping Systems. Front. Ecol. Evol. 2019, 7, 63. [Google Scholar] [CrossRef] [Green Version]
  35. Rabenarivo, M.; Wrage-Moennig, N.; Chotte, J.; Rabeharisoa, L.; Tantely, M.R.; Chapuis-Lardy, L. Emissions of CO2 and N2O from a Pasture Soil from Madagascar—Simulating Conversion to Direct-Seeding Mulch-Based Cropping in Incubations with Organic and Inorganic Inputs. Plant Nutr. Soil Sci. 2014, 177, 360–368. [Google Scholar] [CrossRef]
  36. Säurich, A.; Tiemeyer, B.; Dettmann, U.; Don, A. How Do Sand Addition, Soil Moisture and Nutrient Status Influence Greenhouse Gas Fluxes from Drained Organic Soils? Soil Biol. Biochem. 2019, 135, 71–84. [Google Scholar] [CrossRef]
  37. Sakata, R.; Shimada, S.; Arai, H.; Yoshioka, N.; Yoshioka, R.; Aoki, H.; Kimoto, N.; Sakamoto, A.; Melling, L.; Inubushi, K. Effect of Soil Types and Nitrogen Fertilizer on Nitrous Oxide and Carbon Dioxide Emissions in Oil Palm Plantations. Soil Sci. Plant Nutr. 2015, 61, 48–60. [Google Scholar] [CrossRef]
  38. Adgeh, T.M. Characterization of Present Day Climate Trend Over Ethiopia for Impact Study. In Climate Change Adaptation in Africa; Springer: Cham, Switzerland, 2017; pp. 25–43. [Google Scholar]
  39. Girma, E.; Tino, J.; Wayessa, G. Rainfall Trend and Variability Analysis in Setema-Gatira Area of Jimma, Southwestern Ethiopia. Afr. J. Agric. Res. 2016, 11, 3037–3045. [Google Scholar] [CrossRef]
  40. Worku, M.A. Climate Change Mitigation in Agriculture and Forestry Sectors in Ethiopia: A Review. Agric. For. J. 2020, 4, 11–18. [Google Scholar]
  41. FDRE Forest Development, Conservation, and Utilization Proclamation. Proclamation No. 1065/2018; [Paper Reference 2]; FDRE: Addis Ababa, Ethiopia, 2018. [Google Scholar]
  42. Elias, E. Characteristics of Nitisol Profiles as Affected by Land Use Type and Slope Class in Some Ethiopian Highlands. Environ. Syst. Res. 2017, 6, 20. [Google Scholar] [CrossRef] [Green Version]
  43. Abebe, N.; Gebremedin, A.; Endalkachew, K. Fertility Status Os Eutric Nitisol and Fertilizer Recommendation Using NUMASS in the Selected Areas of Jimma Zone, Southwestern Ethiopia. Trop. Subtrop. Agroecosystems 2013, 16, 487–495. [Google Scholar]
  44. Onasanya, R.O.; Aiyelari, A.; Onasanya, F.E.N. Effect of Different Levels of Nitrogen and Phosphorus Fertilizers on the Growth and Yield of Maize (Zea mays L.) in Southwest Nigeria. Int. J. Agric. Res. 2009, 4, 193–203. [Google Scholar] [CrossRef] [Green Version]
  45. Wasonga, C.; Sigunga, D.; Musandu, A. Phosphorus Requirements by Maize Varieties in Different Soil Types of Western Kenya. Afr. Crop Sci. J. 2010, 16, 161–173. [Google Scholar] [CrossRef]
  46. Edwards, S.; Arefayne, A. The Impact of Compost Use on Crop Yields in Tigray, Ethiopia. International Conference on Organic Agriculture and Food Security. 2007. Available online: http://www.fao.org/tempref/docrep/fao/010/ai434e/ai434e00.pdf (accessed on 20 March 2020).
  47. Laekemariam, F.; Gidago, G. Response of Maize (Zea mays L.) to Integrated Fertilizer Application in Wolaita, South Ethiopia. Adv. Life Sci. Technol. 2012, 5, 10. [Google Scholar]
  48. Bedada, W.; Karltun, E.; Lemenih, M.; Tolera, M. Long-Term Addition of Compost and NP Fertilizer Increases Crop Yield and Improves Soil Quality in Experiments on Smallholder Farms. Agric. Ecosyst. Environ. 2014, 195, 193–201. [Google Scholar] [CrossRef]
  49. Tulema, B.; Aune, J.B.; Breland, T.A. Availability of Organic Nutrient Sources and Their Effects on Yield and Nutrient Recovery of Tef [Eragrostis Tef (Zucc.) Trotter] and on Soil Properties. J. Plant Nutr. Soil Sci. 2007, 170, 543–550. [Google Scholar] [CrossRef]
  50. Chapman, H.D. Cation-exchange Capacity. Methods Soil Anal. Part 2 Chem. Microbiol. Prop. 1965, 9, 891–901. [Google Scholar]
  51. Bouyoucos, G. Hydrometer Method Improved for Making Particle Size Analyses of Soils. Agron. J. 1962, 54, 464–465. [Google Scholar] [CrossRef]
  52. Blake, G.R.; Hartge, K.H. Bulk Density. In Methods of Soil Analysis, Part 1; Klute, A., Ed.; Physical and Mineralogical Methods; American Society of Agronomy: Madison, WI, USA, 1986. [Google Scholar]
  53. Testa, G.; Reyneri, A.; Blandino, M. Maize Grain Yield Enhancement through High Plant Density Cultivation with Different Inter-Row and Intra-Row Spacings. Eur. J. Agron. 2016, 72, 28–37. [Google Scholar] [CrossRef]
  54. Baligar, V.C.; Fageria, N.K. Nutrient Use Efficiency in Plants. Int. Aff. R. Inst. Int. Aff. 2001, 72, 376–377. Available online: www.dekker.com (accessed on 12 January 2020). [CrossRef]
  55. Frimpong, K.A.; Baggs, E.M. Do Combined Applications of Crop Residues and Inorganic Fertilizer Lower Emission of N2O from Soil? N2O from Combined Residue and Fertilizer Application. Soil Use Manag. 2010, 26, 412–424. [Google Scholar] [CrossRef]
  56. Sun, L.; Ma, Y.; Li, B.; Xiao, C.; Fan, L.; Xiong, Z. Nitrogen Fertilizer in Combination with an Ameliorant Mitigated Yield-Scaled Greenhouse Gas Emissions from a Coastal Saline Rice Field in Southeastern China. Environ. Sci. Pollut. Res. 2018, 25, 15896–15908. [Google Scholar] [CrossRef]
  57. Comeau, L.-P.; Lai, D.Y.F.; Cui, J.J.; Hartill, J. Soil Heterotrophic Respiration Assessment Using Minimally Disturbed Soil Microcosm Cores. MethodsX 2018, 5, 834–840. [Google Scholar] [CrossRef]
  58. Zhang, F.; Che, Y.; Xiao, Y. Effects of Rice Straw Incorporation and N Fertilizer on Ryegrass Yield, Soil Quality, and Greenhouse Gas Emissions from Paddy Soil. J. Soils Sediments 2019, 19, 1053–1063. [Google Scholar] [CrossRef]
  59. Hergoualc’h, K.; Akiyama, H.; Bernoux, M.; Chirinda, N.; del Prado, A.; MacDonald, J.D.; Kasimir, Å.; Ogle, S.M.; Regina, K.; van der Weerden, T.J.; et al. N2O Emission from Managed Soils, and CO2 Emissions from Lime and Urea Fertilizer. In 2019 Refinement to the 2006 IPCC Guidelines for National Greenhouse Gas Inventories; Agriculture, Forestry and Other Land Use; IPCC: Geneva, Switzerland, 2019; Volume 4. [Google Scholar]
  60. Bhattacharyya, R.; Bhatia, A.; Das, T.K.; Lata, S.; Kumar, A.; Tomer, R.; Biswas, A. K Aggregate-Associated N and Global Warming Potential of Conservation Agriculture-Based Cropping of Maize-Wheat System in the North-Western Indo-Gangetic Plains. Soil Tillage Res. 2018, 182, 66–77. [Google Scholar] [CrossRef]
  61. Anthropogenic and Natural Radiative Forcing. In Climate Change 2013—The Physical Science Basis: Working Group I Contribution to the Fifth Assessment Report of the Intergovernmental Panel on Climate Change; Intergovernmental Panel on Climate Change; Cambridge University Press: Cambridge, UK, 2014; pp. 659–740. ISBN 9781107057999.
  62. von Mersi, W.; Schinner, F. An Improved and Accurate Method for Determining the Dehydrogenase Activity of Soils with Iodonitrotetrazolium Chloride. Biol. Fertil. Soils 1991, 11, 216–220. [Google Scholar] [CrossRef]
  63. Drezner, Z.; Turel, O.; Zerom, D.A. Modified Kolmogorov-Smirnov Test for Normality. Commun. Stat. Comput. 2010, 39, 693–704. [Google Scholar] [CrossRef] [Green Version]
  64. Ejigu, W.; Selassie, Y.G.; Elias, E.; Damte, M. Integrated Fertilizer Application Improves Soil Properties and Maize (Zea mays L.) Yield on Nitisols in Northwestern Ethiopia. Heliyon 2021, 7, e06074. [Google Scholar] [CrossRef] [PubMed]
  65. Mamuye, M.; Nebiyu, A.; Elias, E.; Berecha, G. Combined Use of Organic and Inorganic Nutrient Sources Improved Maize Productivity and Soil Fertility in Southwestern Ethiopia. Int. J. Plant Prod. 2021, 15, 407–418. [Google Scholar] [CrossRef]
  66. Eichler-Loebermann, B.; Schiemenz, K.; Makadi, M.; Vágó, I.; Koeppen, D. Nutrient Cycling by Using Residues of Bio-Energy Production—Effects of Biomass Ashes on Plant and Soil Parameters. Cereal Res. Commun. 2008, 36, 1259–1262. [Google Scholar]
  67. Saha, R.; Mishra, V.K.; Majumdar, B.; Laxminarayana, K.; Ghosh, P.K. Effect of Integrated Nutrient Management on Soil Physical Properties and Crop Productivity under a Maize (Zea mays)—Mustard (Brassica campestris) Cropping Sequence in Acidic Soils of Northeast India. Commun. Soil Sci. Plant Anal. 2010, 41, 2187–2200. [Google Scholar] [CrossRef]
  68. Biramo, G. The Role of Integrated Nutrient Management System for Improving Crop Yield and Enhancing Soil Fertility under Small Holder Farmers in Sub-Saharan Africa: A Review Article. Mod. Concepts Dev. Agron. 2018, 2, 1–9. [Google Scholar] [CrossRef]
  69. Naohiro, M.; Koji, N.; Chisambi, C.; Moyo, M. Improvement of Maize Yield and Soil Fertility by 2-Years Compost Application in Malawis Northern Districts. Afr. J. Agric. Res. 2016, 11, 2708–2719. [Google Scholar] [CrossRef] [Green Version]
  70. Ayal, D.Y.; Leal, F.W. Farmers’ Perceptions of Climate Variability and Its Adverse Impacts on Crop and Livestock Production in Ethiopia. J. Arid Environ. 2017, 140, 20–28. [Google Scholar] [CrossRef]
  71. Gutser, R.; Ebertseder, T.; Weber, A.; Schraml, M.; Schmidhalter, U. Short-Term and Residual Availability of Nitrogen after Long-Term Application of Organic Fertilizers on Arable Land. J. Plant Nutr. Soil Sci. 2005, 168, 439–446. [Google Scholar] [CrossRef]
  72. Sharma, L.K.; Bali, S.K. A Review of Methods to Improve Nitrogen Use Efficiency in Agriculture. Sustainability 2018, 10, 51. [Google Scholar] [CrossRef] [Green Version]
  73. Agegnehu, G.; Nelson, P.N.; Bird, M.I. Crop Yield, Plant Nutrient Uptake and Soil Physicochemical Properties under Organic Soil Amendments and Nitrogen Fertilization on Nitisols. Soil Tillage Res. 2016, 160, 1–13. [Google Scholar] [CrossRef]
  74. Agegnehu, G.; Nelson, P.N.; Bird, M.I. The Effects of Biochar, Compost and Their Mixture and Nitrogen Fertilizer on Yield and Nitrogen Use Efficiency of Barley Grown on a Nitisol in the Highlands of Ethiopia. Sci. Total Environ. 2016, 569–570, 869–879. [Google Scholar] [CrossRef] [PubMed]
  75. Negassa, W.; Negisho, K.; Friesen, D.K.; Ransom, J.; Yadessa, A. Determination of Optimum Farmyard Manure and Np Fertilizers for Maize on Farmers Fields. Seventh E. S. Afr. Reg. Maize Conf. 2001, 11, 387–393. [Google Scholar]
  76. Buczko, U.; van Laak, M.; Eichler-Löbermann, B.; Gans, W.; Merbach, I.; Panten, K.; Peiter, E.; Reitz, T.; Spiegel, H.; von Tucher, S. Re-Evaluation of the Yield Response to Phosphorus Fertilization Based on Meta-Analyses of Long-Term Field Experiments. Ambio 2018, 47, 50–61. [Google Scholar] [CrossRef] [PubMed] [Green Version]
  77. Mkhabela, M.S.; Warman, P.R. The Influence of Municipal Solid Waste Compost on Yield, Soil Phosphorus Availability and Uptake by Two Vegetable Crops Grown in a Pugwash Sandy Loam Soil in Nova Scotia. Agric. Ecosyst. Environ. 2005, 106, 57–67. [Google Scholar] [CrossRef]
  78. Roobroeck, D.; Palm, C.A.; Nziguheba, G.; Weil, R.; Vanlauwe, B. Assessing and Understanding Non-Responsiveness of Maize and Soybean to Fertilizer Applications in African Smallholder Farms. Agric. Ecosyst. Environ. 2021, 305, 107165. [Google Scholar] [CrossRef]
  79. Olaleye, A.; Peak, D.; Shorunke, A.; Dhillon, G.; Oyedele, D.; Adebooye, O.; Akponikpe, P.B.I. Effect of Manure and Urea Fertilization on Yield, Carbon Speciation and Greenhouse Gas Emissions from Vegetable Production Systems of Nigeria and Republic of Benin: A Phytotron Study. Agronomy 2020, 10, 400. [Google Scholar] [CrossRef] [Green Version]
  80. Muhammad, W.; Vaughan, S.M.; Dalal, R.C.; Menzies, N.W. Crop Residues and Fertilizer Nitrogen Influence Residue Decomposition and Nitrous Oxide Emission from a Vertisol. Biol. Fertil. Soils 2011, 47, 15–23. [Google Scholar] [CrossRef]
  81. De Rosa, D.; Rowlings, D.W.; Biala, J.; Scheer, C.; Basso, B.; Grace, P.R. N2O and CO2 Emissions Following Repeated Application of Organic and Mineral N Fertiliser from a Vegetable Crop Rotation. Sci. Total Environ. 2018, 637–638, 813–824. [Google Scholar] [CrossRef]
  82. Lv, B.; Zhang, D.; Cui, Y.; Yin, F. Effects of C/N Ratio and Earthworms on Greenhouse Gas Emissions during Vermicomposting of Sewage Sludge. Bioresour. Technol. 2018, 268, 408–414. [Google Scholar] [CrossRef]
  83. Liang, L.L.; Eberwein, J.R.; Allsman, L.A.; Grantz, D.A.; Jenerette, G.D. Regulation of CO2 and N2O Fluxes by Coupled Carbon and Nitrogen Availability. Environ. Res. Lett. 2015, 10, 34008. [Google Scholar] [CrossRef]
  84. Eichler-Löbermann, B.; Zicker, T.; Kavka, M.; Busch, S.; Brandt, C.; Stahn, P.; Miegel, K. Mixed Cropping of Maize or Sorghum with Legumes as Affected by Long-Term Phosphorus Management. Field Crop. Res. 2021, 265, 108120. [Google Scholar] [CrossRef]
  85. Mohanty, S.; Nayak, A.K.; Swain, C.K.; Dhal, B.R.; Kumar, A.; Kumar, U.; Tripathi, R.; Shahid, M.; Behera, K.K. Impact of Integrated Nutrient Management Options on GHG Emission, N Loss and N Use Efficiency of Low Land Rice. Soil Tillage Res. 2020, 200, 104616. [Google Scholar] [CrossRef]
  86. Jin, Z.; Shah, T.; Zhang, L.; Liu, H.; Peng, S.; Nie, L. Effect of Straw Returning on Soil Organic Carbon in Rice—Wheat Rotation System: A Review. Food Energy Secur. 2020, 9, e200. [Google Scholar] [CrossRef] [Green Version]
  87. Zelleke, G.; Agegnehu, G.; Abera, D.; Rashid, S. Fertilizer and Soil Fertility Potential in Ethiopia: Constraints and Opportunities for Enhancing the System; International Food Policy Research Institute: Washington, DC, USA, 2010. [Google Scholar]
  88. Bharali, A.; Baruah, K.K.; Baruah, S.G.; Bhattacharyya, P. Impacts of Integrated Nutrient Management on Methane Emission, Global Warming Potential and Carbon Storage Capacity in Rice Grown in a Northeast India Soil. Environ. Sci. Pollut. Res. 2018, 25, 5889–5901. [Google Scholar] [CrossRef] [PubMed]
  89. Brempong, M.B.; Norton, U.; Norton, J.B. Compost and Soil Moisture Effects on Seasonal Carbon and Nitrogen Dynamics, Greenhouse Gas Fluxes and Global Warming Potential of Semi-Arid Soils. Int. J. Recycl. Org. Waste Agric. 2019, 8, 367–376. [Google Scholar] [CrossRef] [Green Version]
  90. Bao, Q.-L.; Xiao, K.-Q.; Chen, Z.; Yao, H.-Y.; Zhu, Y.-G. Methane Production and Methanogenic Archaeal Communities in Two Types of Paddy Soil Amended with Different Amounts of Rice Straw. FEMS Microbiol. Ecol. 2014, 88, 372–385. [Google Scholar] [CrossRef] [PubMed]
  91. Ding, W.; Meng, L.; Yin, Y.; Cai, Z.; Zheng, X. CO2 Emission in an Intensively Cultivated Loam as Affected by Long-Term Application of Organic Manure and Nitrogen Fertilizer. Soil Biol. Biochem. 2007, 39, 669–679. [Google Scholar] [CrossRef]
  92. Mazza, G.; Agnelli, A.E.; Andrenelli, M.C.; Lagomarsino, A. Effects of Water Content and N Addition on Potential Greenhouse Gas Production from Two Differently Textured Soils under Laboratory Conditions. Arch. Agron. Soil Sci. 2018, 64, 654–667. [Google Scholar] [CrossRef]
  93. Thangarajan, R.; Bolan, N.S.; Tian, G.; Naidu, R.; Kunhikrishnan, A. Role of Organic Amendment Application on Greenhouse Gas Emission from Soil. Sci. Total Environ. 2013, 465, 72–96. [Google Scholar] [CrossRef]
  94. Zerssa, G.; Feyssa, D.; Kim, D.-G.; Eichler-Löbermann, B. Challenges of Smallholder Farming in Ethiopia and Opportunities by Adopting Climate-Smart Agriculture. Agriculture 2021, 11, 192. [Google Scholar] [CrossRef]
  95. Abebe, G.; Debebe, S. Factors Affecting Use of Organic Fertilizer among Smallholder Farmers in Sekela District of Amhara Region, Northwestern Ethiopia. Cogent Food Agric. 2019, 5, 1–11. [Google Scholar] [CrossRef]
Figure 1. Map of the study site and photos of the field experiment and research activities at the site (Jimma University Research Center, Ethiopia).
Agronomy 11 02097 g001
Figure 2. Monthly rainfall and temperature of the study area during the experimental periods 2019 and 2020. Data source: Regional Meteorological Service Agency, Jimma Meteorological Branch Office, Ethiopia.
Agronomy 11 02097 g002
Figure 3. Emissions of nitrous oxide (N2O-N) from treatments with different fertilizer types and water-filled pore space (WFPS) (40 and 75%). Cont.: Control (no input); 100 min: 100% mineral fertilizer N (100 kg N ha−1) and P (33.3 kg P ha−1), 80 min: 80% mineral fertilizer + 1.4 t ha−1 compost; 60 min: 60% mineral fertilizer + 2.8 t ha−1 compost; 50 min: 50% mineral fertilizer + 3.5 t ha−1 compost; 30 min: 30% mineral fertilizer + 4.9 t ha−1 compost, and 100comp: 100% compost (7 t ha−1 compost).* indicates significant differences among the treatments (Tukey HSD test, p < 0.05). Error bars indicate the standard error of the mean (n = 3).
Agronomy 11 02097 g003
Figure 4. Emissions of carbon dioxide (CO2-C) from treatments with different fertilizer types and water-filled pore space (WFPS) (40 and 75%). Cont.: Control (no input); 100 min: 100% mineral fertilizer N (100 kg N ha−1) and P (33.3 kg P ha−1), 80 min: 80% mineral fertilizer + 1.4 t ha−1 compost; 60 min: 60% mineral fertilizer + 2.8 t ha−1 compost; 50 min: 50% mineral fertilizer + 3.5 t ha−1 compost; 30 min: 30% mineral fertilizer + 4.9 t ha−1 compost, and 100comp: 100% compost (7 t ha−1 compost). * indicates significant differences among the treatments (Tukey HSD test, p< 0.05). Error bars indicate the standard error of the mean (n = 3).
Agronomy 11 02097 g004
Figure 5. Emissions of methane (CH4-C) from treatments with different fertilizer types and water filled pore-space (WFPS) (40% and 75%). Cont.: Cont.: Control (no input); 100 min: 100% mineral fertilizer N (100 kg N ha−1) and P (33.3 kg P ha−1), 80 min: 80% mineral fertilizer + 1.4 t ha−1 compost; 60 min: 60% mineral fertilizer + 2.8 t ha−1 compost; 50 min: 50% mineral fertilizer + 3.5 t ha−1 compost; 30 min: 30% mineral fertilizer + 4.9 t ha−1 compost, and 100comp: 100% compost (7 t ha−1 compost). Error bars indicate the standard error of the mean (n = 3).
Agronomy 11 02097 g005
Table 1. Properties of soil and compost used for the incubation experiment (N = 4, Mean ± standard error).
ParametersBiowaste Compost Soil (5 cm Soil Depth)
Org. C (g kg−1)92.9 ± 0.824.0 ± 4.0
N (g kg−1)12.0 ± 0.72.2 ± 0.1
S (g kg−1)2.2 ± 0.080.5 ± 0.02
Ca (g kg−1)25.1 ± 1.52.3 ± 0.2
P * (mg kg−1)718.2 ± 7.52.1 ± 0.1
K * (g kg−1)1.9 ± 0.020.4 ± 0.1
Mg * (g kg−1)1.3 ± 0.040.2 ± 0.01
Cu (mg kg−1)39.8 ± 1.622.3 ± 1.2
Fe (mg kg−1)44.4 ± 0.266.6 ± 1.6
Zn (mg kg−1) 188.9 ± 2.398.1 ± 3.2
Mn (mg kg−1)1.9 ± 0.050.4 ± 0.02
pH7.1 ± 1.04.9 ± 0.9
EC (µS cm−1)6.1 ± 0.50.3 ± 0.01
CEC (cmole kg−1)118.0 ± 4.842.7 ± 5.3
Moisture content (%)9.7 ± 1.18.2 ± 1.0
Texture-Silty clay loam
Bulk density (g cm−3)-1.2 ± 0.2
* P, K, and Mg in the compost are given as total contents and in the soil as bio-available nutrients.
Table 2. Description and nutrient application of the treatments applied in the study.
Treatment NameDescription of Treatments
Urea and NPS Biowaste Compost
control00
100 min100% inorganic fertilizer [urea (135 kg ha−1) and NPS (200 kg ha−1) fertilizers); 100 kg N ha−1 and 33.3 kg P ha−1] 0
80 min 80% inorganic fertilizer [urea (108 kg ha−1) and NPS (160 kg ha−1); 80 kg N ha−1 and 27.7 kg P ha−1](1.4 t ha−1 compost): 130.1 kg C ha−1, 16.8 kg N ha−1 and 1.01 kg P ha−1
60 min60% inorganic fertilizer [urea (81 kg ha−1) and NPS (120 kg ha−1); 60 kg N ha−1 and 22 kg P ha−1](2.8 t ha−1 compost): 260.1 kg C ha−1, 33.6 kg N ha−1 and 2.02 kg P ha−1
50 min50% inorganic fertilizer [urea (67.5 kg ha−1) and NPS (100 kg ha−1); 50 kg N ha−1 and 19.2 kg P ha−1](3.50 t ha−1 compost): 325.2 kg C ha−1, 42 kg N ha−1 and 2.5 kg P ha−1
30 min 30% inorganic [urea (40.5 kg ha−1) and NPS (60 kg ha−1); 30 kg N ha−1 and 13.5 kg P ha−1](4.90 t ha−1 compost): 455.2 kg C ha−1, 58.8 kg N ha−1 and 3.53 kg P ha−1
100 comp0100% Compost (7 t ha−1 compost): (650.3 kg C ha−1; 84 kg N ha−1 and 5.04 kg P ha−1)
Table 3. Maize grain yield and agronomic nitrogen use efficiency (ANUE) in a two-year field experiment (N = 4) (Mean ± standard error).
Treatments1st Year Yield
(Mg ha−1)
2nd Year Yield
(Mg ha−1)
Average Yield
(Mg ha−1)
1st Year ANUE
(kg grain kg−1 N)
2nd Year ANUE
(kg grain kg−1 N)
Average ANUE
(kg grain kg−1 N)
Cont.8.5 ± 0.3 a7.5 ± 0.2 a8.0 ± 0.1 a---
100 min 9.0 ± 0.1 ab7.6 ± 0.2 a8.3 ± 0.2 ab4.5 ± 1.2 a0.3 ± 3.8 a2.4 ± 0.8 a
80 min9.0 ± 0.1 ab8.1 ± 0.3 ab8.6 ± 0.3 abc5.6 ± 0.8 a6.3 ± 4.0 ab5.6 ± 0.6 a
60 min10.4 ± 0.7 c9.2 ± 0.7 c9.8 ± 0.1 d18.8 ± 2.6 c17.6 ± 1.9 bc18.2 ± 1.9 b
50 min10.1 ± 0.2 bc8.6 ± 0.2 bc9.2 ± 0.3 bcd16.6 ± 1.8 bc11.2 ± 0.7 bc13.9 ±1.9 b
30 min9.1 ± 0.2 ab9.2 ± 0.3 c9.3 ± 0.3 cd6.6 ± 1.6 a19.2 ± 2.2 c12.7 ± 1.0 b
100 comp9.5 ± 0.4 b7.6 ± 0.2 a8.5 ± 0.3 abc11.0 ± 1.9 ab−0.002 ± 0.5 a5.5 ± 0.5 a
Means followed by the different lower-case letters within a column indicate significant differences among the treatments (Tukey HSD test, p < 0.05). Cont.: Control (no input); 100 min: 100% mineral fertilizer N (100 kg N ha−1) and P (33.3 kg P ha−1), 80 min: 80% mineral fertilizer + 1.4 t ha−1 compost; 60 min: 60% mineral fertilizer + 2.8 t ha−1 compost; 50 min: 50% mineral fertilizer + 3.5 t ha−1 compost; 30 min: 30% mineral fertilizer + 4.9 t ha−1 compost, and 100comp: 100% compost (7 t ha−1 compost).
Table 4. Cumulative nitrous oxide (N2O), carbon dioxide (CO2), and methane (CH4) emissions, global warming potential (GWP), and N2O emission factor (EF) (Mean ± standard error) in different fertilizer types and 40% and 75% water filled pore space (WFPS) for 28 days of incubation. (N = 3).
TreatmentN2O (g N2O-N ha−1)CO2 (kg CO2-C ha−1)CH4 (g CH4-C ha−1)GWP (kg CO2 eq. ha−1)N2O EF (%)
WFPS40%75%40% 75% 40% 75% 40% 75% 40%75%
Cont.4.5 ± 0.1 Aa5.7 ± 0.6 Aa3.4 ± 0.2 Aa5.9 ± 0.3 Ba10.0± 0.1 Aa9.6 ± 0.1 Aa4.9 ± 0.1 Aa7.8 ± 0.4 Ba--
100 min6.6 ± 0.3 Ab16.3 ± 2.2 Bb5.3± 0.02 Abc9.9 ± 0.3 Bc9.9 ± 0.04 Aa9.7± 0.1 Aa7.5 ± 0.5 Ac15.0 ± 0.9 Bd0.74 ± 0.08 Ab3.85 ± 0.62 Bc
80 min6.7 ± 0.3 Ab9.1 ± 0.5 Aa5.2 ± 0.3 Abc8.2 ± 0.3 Bbc9.8 ± 0.1 Aa10.0 ± 0.3 Aa7.4 ± 0.4 Ac11.8 ± 0.4 Bbc0.80 ± 0.09 Ab1.56 ± 0.32 Bab
60 min6.5 ± 0.3 Ab13.3± 1.6 Bab5.4 ± 0.3 Ac8.6 ± 0.3 Bc10.5 ± 0.2 Aa9.9 ± 0.1 Aa7.5 ± 0.4 Ac12.8 ± 0.4 Bcd0.75 ± 0.1 Ab2.97 ± 0.53 Bbc
50 min5.9± 0. 3 Aab9.4 ± 0.3 Aa4.6 ± 0.2 Abc8.1 ± 0.5 Bbc10.1 ±0.2 Aa9.9 ± 0.2 Aa6.6 ± 0.3 Abc11.5 ± 0.6 Bbc0.50 ± 0.1 Aab1.47 ± 0.34 Bab
30 min5.8 ± 0.3 Aab9.1 ± 0.2 Aa4.4 ± 0.2 Ab8.2 ± 0.1 Bbc10.2 ± 0.1 Aa9.6 ± 0.1 Aa6.3 ± 0.2 Abc11.2 ± 0.2 Bbc0.47 ± 0.09 Aab1.38 ± 0.23 Bab
100comp5.1 ± 0.4 Aa6.4 ± 0.2 Aa3.9 ± 0.1 Aab7.1 ± 0.2 Bab10.5± 0.5 Aa9.7 ± 0.1 Aa5.6 ± 0.2 Aab9.2 ± 0.2 Bab0.24 ± 0.1 Aa0.28 ± 0.08 Aa
Different upper-case letters indicate significant differences between the moisture levels; different lower case letters indicate significant differences between the fertilizer treatments (Tukey HSD test, p < 0.05). Cont.: Control (no input); 100 min: 100% mineral fertilizer N (100 kg N ha−1) and P (33.3 kg P ha−1), 80 min: 80% mineral fertilizer + 1.4 t ha−1 compost; 60 min: 60% mineral fertilizer + 2.8 t ha−1 compost; 50 min: 50% mineral fertilizer + 3.5 t ha−1 compost; 30 min: 30% mineral fertilizer + 4.9 t ha−1 compost, and 100comp: 100% compost (7 t ha−1 compost).
Table 5. Pearson correlation coefficients between carbon (C) inputs and emissions of nitrous oxide (N2O), carbon dioxide (CO2), and methane (CH4) and N2O emission factor (EF) in 40% and 75% water-filled pore space (WFPS).
C Input N2OCO2CH4N2O EF
WFPS40%75%40%75%40%75%40%75%
−0.77 **−0.52 *−0.82 **−0.59 *0.36−0.31−0.76 **−0.51
* Correlation is significant at the 0.05 level (2-tailed); ** Correlation is significant at the 0.01 level (2-tailed).
Table 6. Dehydrogenase activities in different fertilizer types and water-filled pore space (WFPS; 40% and 75%) (N = 3) (Mean ± standard error).
TreatmentsDay 1
(µg TPF g−1 DM 24 h−1)
Day 7
(µg TPF g−1 DM 24 h−1)
WFPS40% 75% 40% 75%
Cont.67.2 ± 3.7 Aa71.9 ± 3.8 Aa65.5 ± 4.9 Aa61.01 ± 2.2 Aa
100 min85.3 ± 2.1 Ab82.9 ± 1.4 Ab90.2 ± 1.7 Bd64.5 ± 2.6 Aa
80 min87.8 ± 2.6 Ab83.3 ± 2.1 Ab79.2 ± 4.9 Bb61.4 ± 4.4 Aa
60 min86.6 ± 3.1 Ab94.9 ± 3.0 Ac81.0 ± 1.0 Ab79.3 ± 3.5 Ab
50 min88.7 ± 2.5 Ab81.9 ± 0.9 Ab79.7 ± 3.8 Ab67.5 ± 4.0 Aa
30 min89.0 ± 3.6 Ab88.1 ± 5.2 Ac86.7 ± 6.4 Acd62.0 ± 1.7 Aa
100 comp82.8 ± 2.6 Ab80.9 ± 3.1 Ab84.8 ± 3.1 Abc81.3 ± 3.8 Ab
Different uppercase letters indicate significant differences between the moisture levels; different lowercase letters indicate significant differences between the fertilizer treatments (Tukey HSD test, p < 0.05). Cont.: Control (no input); 100 min: 100% mineral fertilizer N (100 kg N ha−1) and P (33.3 kg P ha−1), 80 min: 80% mineral fertilizer + 1.4 t ha−1 compost; 60 min: 60% mineral fertilizer + 2.8 t ha−1 compost; 50 min: 50% mineral fertilizer + 3.5 t ha−1 compost; 30 min: 30% mineral fertilizer + 4.9 t ha−1 compost, and 100comp: 100% compost (7 t ha−1 compost). DM = dry matter.
Publisher’s Note: MDPI stays neutral with regard to jurisdictional claims in published maps and institutional affiliations.

