Article

The Airflow Field Characteristics of the Unmanned Agricultural Aerial System on Oilseed Rape (Brassica napus) Canopy for Supplementary Pollination

1
Nanjing Institute of Agricultural Mechanization, Ministry of Agriculture and Rural Affairs, Nanjing 210014, China
2
Sino-USA Pesticide Application Technology Cooperative Laboratory, Nanjing 210014, China
3
Key Laboratory of Aviation Plant Protection, Ministry of Agriculture and Rural Affairs, Anyang 455000, China
4
Zhangye Academy of Agricultural Sciences, Zhangye 734099, China
*
Author to whom correspondence should be addressed.
These authors contributed equally to this work.
Agronomy 2021, 11(10), 2035; https://doi.org/10.3390/agronomy11102035
Submission received: 31 August 2021 / Revised: 6 October 2021 / Accepted: 8 October 2021 / Published: 11 October 2021
(This article belongs to the Special Issue Airborne Pollen)

Abstract

:
Pollination success is essential for hybrid oilseed rape (OSR, Brassica napus) seed production, but traditional pollination methods are not efficient. The unmanned agricultural aerial system (UAAS) has developed rapidly and has been widely used in China. When flying, the wind field generated by the rotors overcomes the UAAS gravity, and it blows and disturbs the crops below, which helps the pollen spread. In order to investigate the distribution law of the three-dimensional (direction x, y, z) airflow field, experiments involving three levels of flight speed (FS) at 4.0, 5.0, and 6.0 m/s, and three levels of flight height (FH) at 1.5, 2.0, and 2.5 m were conducted in the OSR field by using an electric four-rotor UAAS P20. The effects of FS and FH on airflow velocities ( v x , v y , v z ) were analyzed. High-speed dynamic camera (HSDC) technology was used to capture the swings of OSR plants under airflow field disturbance. OSR pollen samples were collected during the experiments. The results showed that the airflow field in the direction x was mainly concentrated on the center of the flight path (S3), and the maximum wind velocity of direction x was 8.01 m/s (T1, S3). The direction x airflow field width was distributed almost symmetrically, but the center position shifted easily, due to crosswind. The airflow field in the direction y was distributed on both sides of the center flight path, and the velocity was generally larger, with the maximum at 7.91 m/s (T1, S2). The airflow field in the direction z was distributed irregularly, and the velocity was small. The FH had highly significant impacts on   v x (p < 0.01), and the interaction of FS and FH had significant impacts on   v x (0.01 < p < 0.05), while the FS had no significant impact on v x (p = 0.70804 > 0.05). The FS, FH, and interaction of FS and FH all had highly significant impacts on v y (p < 0.01). The swings of the OSR plant captured by the HSDC proved that the UAAS airflow field could effectively blow the OSR plant. The swing amplitude changes showed a positive correlation with airflow velocities ( v x ) in general. Although the observed OSR plant swung forward and backward repeatedly, there was a law of first forward, and then backward, and forward again at the beginning of each swing. The pollen collected on the sampler verified that the UAAS airflow field could help with pollen spread. The research results provide technical support for UAAS application on supplementary pollination for hybrid OSR seed production.

1. Introduction

The oilseed rape (OSR, Brassica napus) is the third most important oil crop in the world [1], not only because of its high quality oil that meets the criteria of the most demanding nutritionists, but also because of its usage as a feed pellet for livestock species and resources for certain industrial products [2,3,4,5]. Its planting areas are expanding fast in regions with moderate climatic conditions, especially hybrid OSR [6]; thereby, hybrid OSR seed production is a guarantee for large-scale planting. During hybrid OSR seed production, the pollen from the male OSR plant needs to transfer onto the female OSR plant pistil to ensure the formation of siliques [7,8]. Traditional pollination methods include wind, manual, and insect pollinations. Natural wind pollination is highly uncertain because the velocity and the direction of the natural ambient wind are not controlled. Manual pollination is inefficient and is not suitable for large-scale field OSR seed production. Insect pollination has been identified as an ecosystem service [9,10,11] and is vital for high yields of OSR [12,13]. Honeybees (Apis mellifera) have been considered as the most important insect pollinator [14,15]. However, insect pollinators including honeybees are in decline because of the destruction of semi-natural habitats [16], increased insecticide use [17,18], pollution [19], climate change, invasive species and pathogens [20], and the decrease in floral resource availability linked to agricultural intensification [21,22], seriously threatening the crop yield, biodiversity, and food security [23]. Evidence is mounting that a range of insect-pollinated crops are experiencing pollination deficits [24,25]. Therefore, there is a necessity to find a new pollination method.
As a new type of agricultural machinery, the unmanned agricultural aerial system (UAAS) has rapidly developed in China [26,27,28]. Due to carrying different airborne mission equipment, the UAAS can execute remote sensing [29,30], aerial spraying [31,32,33], particle fertilizing [34], aerial seeding [35], etc. Some researchers have conducted studies on UAAS airflow in the field (with crop leaf effect), and correspondingly, the results of supplementary pollination show that the airflow field, which is downward generated by the rotors of UAAS, can improve crop pollination because the airflow causes canopy disturbance [36,37]. Liu et al. [38] used a single-rotor UAAS for supplementary pollination on hybrid rice seed production, the results showed that the seed setting rate and yields of the supplementary pollination by single-rotor UAAS could reach higher than those of manual pollination under airflow assistance. In order to reduce the adverse effects of high temperature and drought on maize pollination, Kong et al. [39] explored the assisting pollination method on maize with an eight-rotor UAAS, their test results were that the maize yield increased 880.05 and 1456.50 kg/ha with once and twice UAAS aerial pollination, respectively. Li et al. [40] collected, analyzed and processed the experimental data from the UAAS pollinators in the field. It was found that an important “steep wall” effect was observed when the wind velocity under the UAAS rotor reached its maximum value, and the increased rate of forward wind velocity was significantly higher than that of backward reduction. The whole airflow field “steep wall” was symmetrical along the UAAS flight direction. Wang et al. [41] used a wireless wind speed sensor network (WWSSN) measurement system to measure a single-rotor UAAS Z-3 airflow field in the rice field for supplementary pollination parameter optimizations. The experimental results showed that the wind parallel to the flight direction was more useful to the supplementary pollination, and the flight parameters were suggested as 7.0 m height, 3.0 m/s in a downwind direction to obtain a high efficiency. Through the machine vision technologies, Tian et al. [42] studied the influences of airflow on the wheat canopy during the UAAS hovering and flight (forward and reverse) states. During the hovering state, the disturbance canopy region was annular, and the area was larger for the single-rotor UAAS, while the region was circular, and the area was smaller for the four-rotor one. During the flight state, the disturbance canopy region was irregular, and the area was smaller when forward flying, while the region showed a U-shape, and the area was larger for the single-rotor UAAS. The disturbance canopy region shape and the area were basically the same due to the symmetry of the fuselage for the four-rotor UAAS during both states. Meanwhile, the study results showed that the FS had a significant impact on the disturbance canopy region characteristics. The region was concentrated and approximately showed an elliptical distribution; the plants in the region swung violently when the FS was low. The region was distributed in a long strip, and the plants in the region swung slightly when the FS was high. In addition to the outdoor field environment, some scholars have also carried out research on the UAAS airflow in a closed environment [43], which also provided references for the scientific use of UAAS airflow in practical applications.
In summary, the above research conclusions indicate that the UAAS airflow field can cause crop canopy disturbance, thus contributing to the pollination of hybrid rice and maize. There is still a lack of research on the characteristics of the UAAS airflow field on the OSR crop canopy. Therefore, this study aims to investigate the UAAS airflow distribution laws on the OSR crop canopy and the effects of FS and FH on airflow velocity and pollination. It is assumed that the wind field can also contribute to the pollination of hybrid OSR, which will provide some theoretical and data support for UAAS application on supplementary pollination of hybrid OSR seed production.

2. Materials and Methods

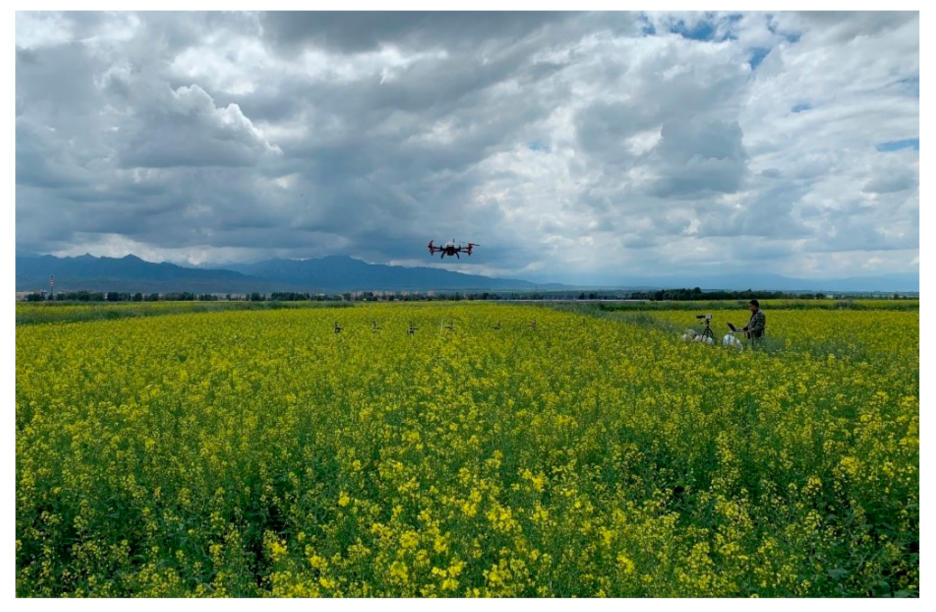
2.1. Experimental Site, OSR Characters and Weather Conditions

The experiment site was located at the hybrid OSR seed production agricultural base (38.4692° N, 100.8674° E) in Zhangye City, Gansu Province, China. The trials were conducted from July 3 to July 9, which are the local seasons for OSR pollination. The produced seed variety was Yangguang 131 (Registration Number: GPD Rape (2017) 420119, Ministry of Agriculture and Rural Affairs of the People’s Republic of China) [44], which is a three-line hybrid combination of Polyma cytoplasmic male sterile line 5A (male OSR plant) and restorer line C18 (female OSR plant) [45]. The OSR plant was sown in the field by manual transplanting. The main characters of the OSR plant and the weather conditions are shown in Table 1.

2.2. UAAS and Experimental Materials

The tested UAAS of P20 (Guangzhou XAG Co., Ltd., Guangzhou, China, as shown in Figure 1) is a four-rotor UAAS with real-time kinematic global positioning system (RTK-GPS). It is fully autonomous with the help of SUPERX2 flight control system (Guangzhou XAG Co., Ltd., Guangzhou, China), flying along the routes planned by the mobile app. The FS and FH can be set in the mobile app. The main technical parameters are shown in Table 2.
The WWSSN [40,41] system was used to measure airflow. A high-speed dynamic camera (HSDC) MotionPro X-4 (Integrated Design Tools Inc., Tallahassee, Florida, USA) was installed in a suitable position in the field to capture the swings of the OSR plant. The slides coated with vaseline oil were fixed on the sampling rod for pollen collecting.

2.3. Experimental Treatments

2.3.1. Experiment Design

The whole experimental area was divided into flight acceleration area, sampling area and flight stopping area. The GPS coordinates of two location points on the male OSR plant centerline were collected in the flight acceleration area and flight stopping area. The two location points were as the starting point and end point of the planned route after being transmitted to the flight control system, ensuring the UAAS centerline following the flight. During the tests, the FS was set to three levels at 4.0, 5.0, and 6.0 m/s, FH was set to three levels at 1.5, 2.0, and 2.5 m. The P20 flew from the acceleration area to the stopping area along the centerline of the sampling area above the male OSR plant line using autonomous mode [32]. A total of nine treatments are shown in Table 3, with treatment parameters.

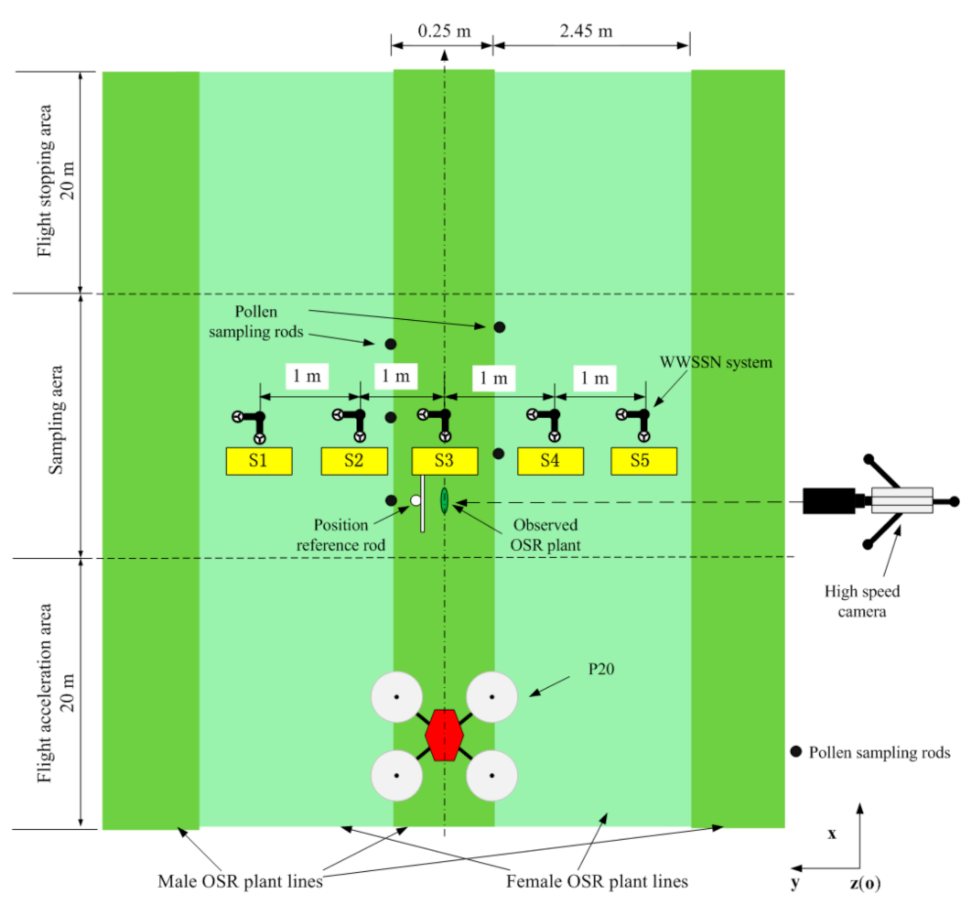
2.3.2. Sampling Point Arrangements

The flight acceleration area and the flight stopping area were both 20 m long in order to ensure the CPUAS could accelerate to a predetermined speed and timely stop. The sampling points were arranged along the vertical direction of the UAAS flight route symmetrically with a 1.0 m interval. Five points were arranged symmetrically on both sides of the flight route. The sampling points were labeled S1 to S5 from left to right, the sensors of WWSSN system were placed on each sampling point. The X axis was set along the flight direction, the Y axis was 90 degrees counterclockwise of the X axis, perpendicular to the flight direction, and the Z axis was set perpendicular to the ground. The layout of sampling points is shown in Figure 2. Three repetitions for each treatment were conducted to ensure the accuracy of the obtained data.
An OSR plant was selected as the observation object, and the position reference rod with a calibrated ruler was fixed behind it. The HSDC was set up outside the sampling area, creating a line with the observed OSR plant and the position reference rod, which adjusted the optical parameters ready for capturing. The pollen sampling rods with slides, as shown in Figure 3, were arranged on either side of the male OSR plant line, and a five-point sampling method [46] was selected to collect the OSR pollen. The field adjacent to the test area was selected as the control check (CK) area, where the OSR plants would not be affected by the UAAS wind field, and the pollen sampling rods were arranged in the same way as in the test area. In the CK area, the male OSR plants were disturbed only by the weak environmental wind (see Table 1—Mean Wind Speed). OSR pollen collection comparisons in the CK area and sampling area were used to qualitatively evaluate pollen spreading by the UAAS supplementary pollination.

2.4. Data Processing

The airflow wind distributions of three directions were compared and the maximum wind velocities were clarified. The average wind velocity value of each treatment during the sampling period was used as the effective wind velocity value in order to ensure accuracy. The impacts of FS and FH on the velocity were analyzed by two-way analysis of variance (ANOVA) [28,31]. The relationship between the OSR plant swing amplitudes and the wind velocities were analyzed from the images captured by the HSDC. The supplementary pollination effect was evaluated based on the OSR pollen collected by the sliders.

3. Results

3.1. Airflow Wind Data Statistics and Analysis

The average wind velocity of each treatment on S1 to S5 is shown in Table 4.
From Table 4, it can be seen that the variations of wind velocity were not continuous, while showing interval distributions. The V x   threshold ranged from 0.31 to 2.73 m/s, and the maximum value was 8.01 m/s (T1, S3) among the obtained data. The   V y threshold ranged from 0.31 to 3.35 m/s, and the maximum value was 7.91 m/s (T1, S3) among the obtained data, while the V z threshold ranged from 0.30 to 1.86 m/s, and the maximum value was 4.0 m/s.

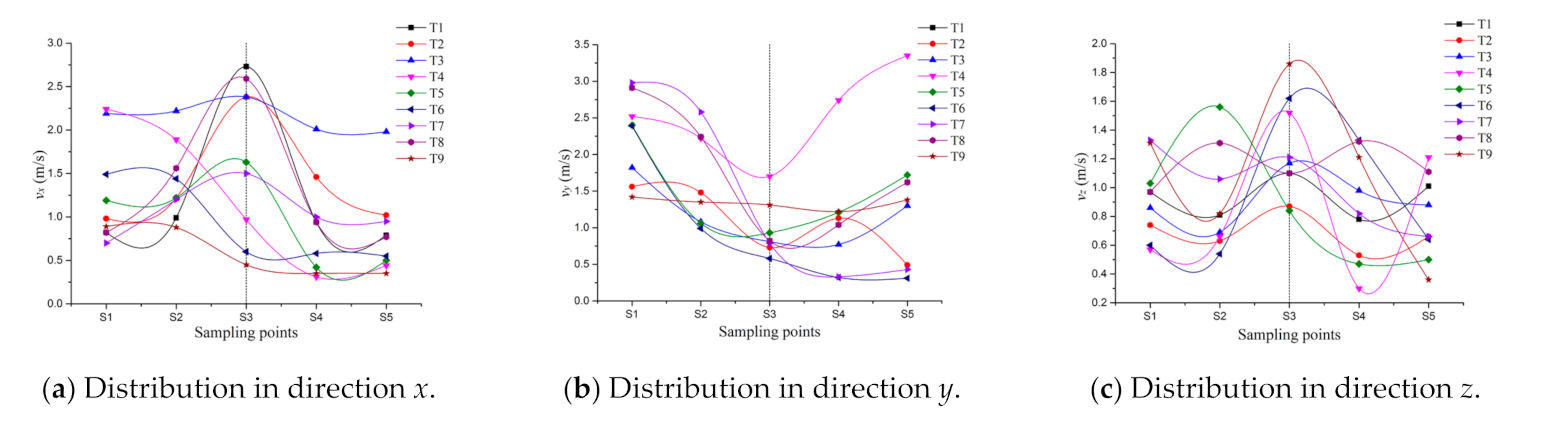
3.1.1. The Airflow Wind Velocity Distributions

The airflow wind velocity distributions of direction x, y and z are shown in Figure 4. The wind velocities of directions x and y mostly exceeded 1.0 m/s, which were relatively larger than those of direction z. Taking sample S3 as the center, the wind velocities in direction x showed a symmetrical distribution with low winds on both sides and large winds in the center, while the velocities for T4, T6 and T9 showed a downward trend from left to right (S1 to S5). The center position of the wind field shifted, probably due to the influence of crosswinds during the tests. The wind velocities in direction y showed a distribution pattern of large winds on the left side and low winds on the right side, except for T4. There was no obvious regularity of direction z wind velocity distribution. The direction z airflow was affected by the OSR plant canopy, and the airflow rebounded after contacting the ground, causing a ground effect [47,48]. In addition, direction z airflow will not help will pollination; thus, direction z wind velocity distribution is not discussed in this article.

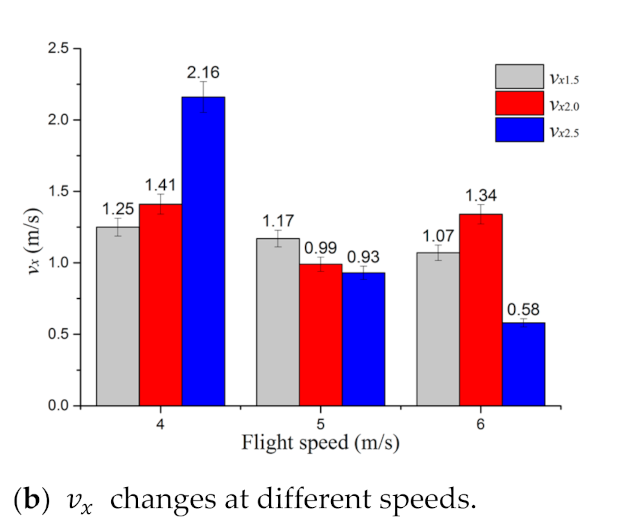
3.1.2. Wind Velocity

In order to clarify the distribution laws of the airflow more clearly, the effective velocity value of each direction was calculated as follows:
v d   =   1 5 V d S i 5
where v d represents the three directions of wind velocity v x , v y and v z in m/s, S i is the ith sampling point, and V d S i is the average wind velocity of the ith sampling point, m/s. According to Formula (1), v x , v y and v z were calculated, which are shown in Table 5.
From Table 5, the values of v x ranged from 0.58 (T9) to 2.16 m/s (T3), the values of v y ranged from 0.92 (T6) to 2.51 m/s (T4), and the values of v z ranged from 0.69 (T2) to 1.16 m/s (T8).

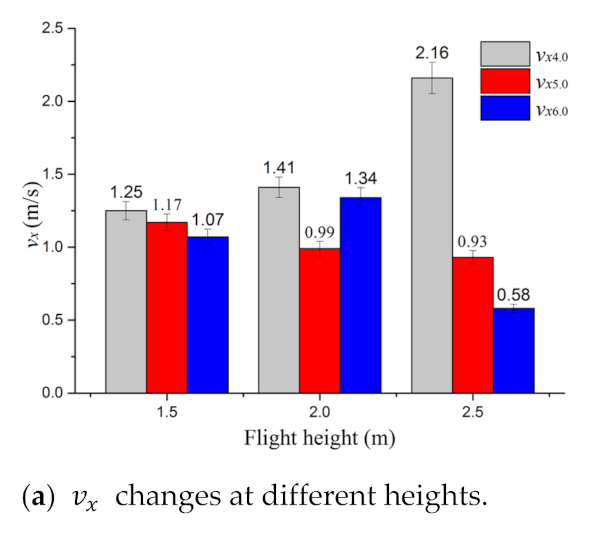
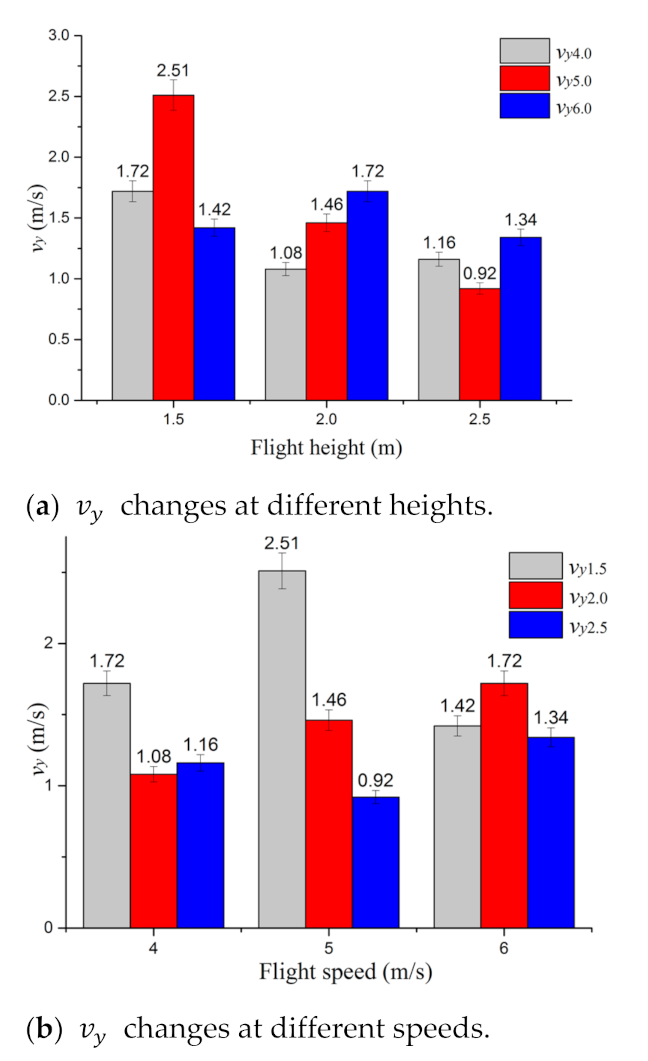
3.1.3. Effect of FS and FH on Airflow Velocity

Figure 5 and Figure 6 show the change trends of v x and v y in relation to the changes in FH and FS. v x increased as FH increased when FS was 4.0 m/s, and it decreased as FH increased when FS was 5.0 m/s. v x first increased and then decreased as FH increased when FS was 6.0 m/s. When FH was at 1.5 and 2.5 m, v x decreased as FS increased, while it first decreased and then increased as FS increased when FH was at 2.0 m. Regarding v y , it showed a uniform downward trend as FH increased when FS was 5.0 m/s, and a uniform upward trend was shown as FS increased when FH was 2.0 m. The change trends were not monotonous under other conditions. Therefore, it can be considered that FS and FH affected v x and v y .
Two-way ANOVA was conducted to verify the significant impact of FS and FH on v x and v y at p value = 0.05 level. The results are shown in Table 6 and Table 7. FH had highly significant impacts on v x (p < 0.01); the interaction of FS and FH had significant impacts on v x (0.01 < p < 0.05), while FS had no significant impact on v x (p = 0.70804 > 0.05). FS, FH, and the interaction of FS and FH all had highly significant impacts on v y (p < 0.01).

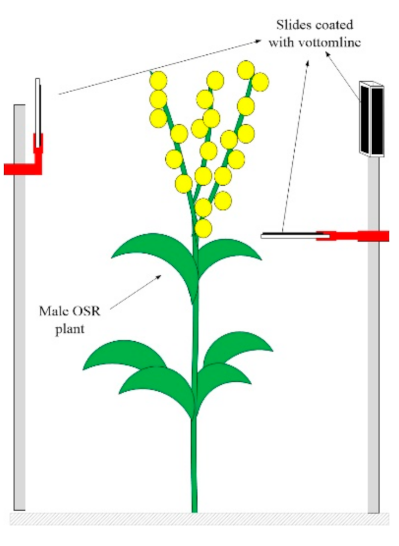
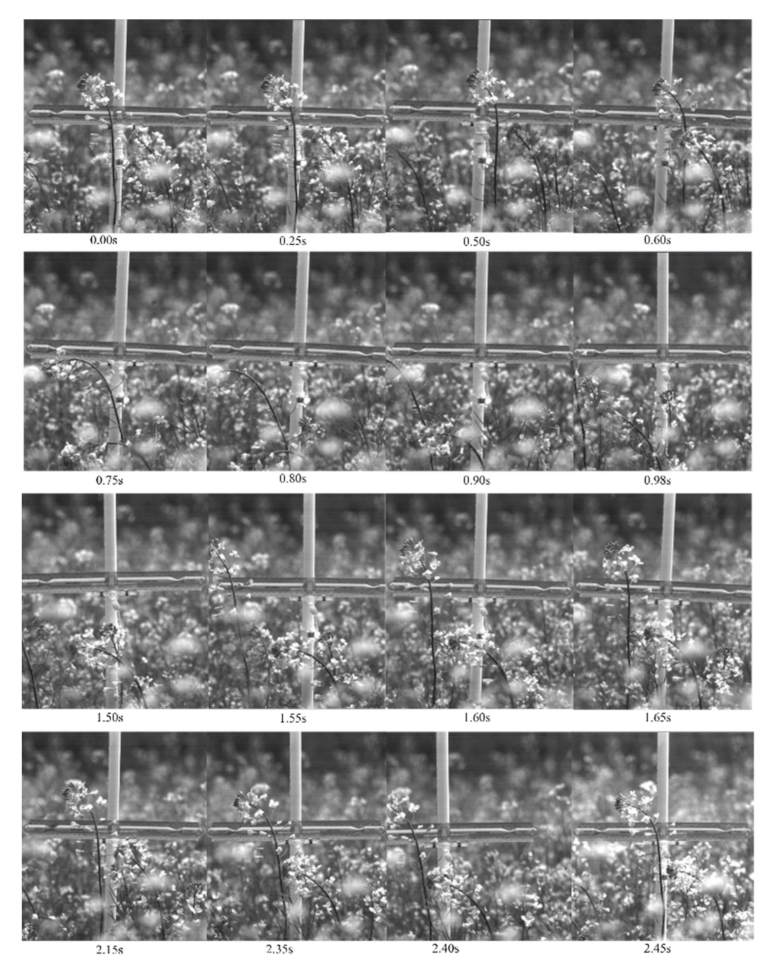
3.2. The OSR Plant Swing Capture

The swing amplitude of the observed OSR plant was positively correlated with v x based on the amplitude analysis from the captured images. The observed OSR plant swung forward (along positive X axis) and backward (along negative X axis) repeatedly, but there was a law of first forward, and then backward, and finally forward at the beginning of the swing. Figure 7 shows the observed OSR plant swings under the 4.0 m/s FS and 1.5 m FH; the observed OSR plant swung forward from the record time of 0.00 s to 0.60 s, and then swung backward until 0.98 s, and then swung forward again. The observed OSR plant swung back to the original position for the first time approximately at the recorded time of 2.45 s.

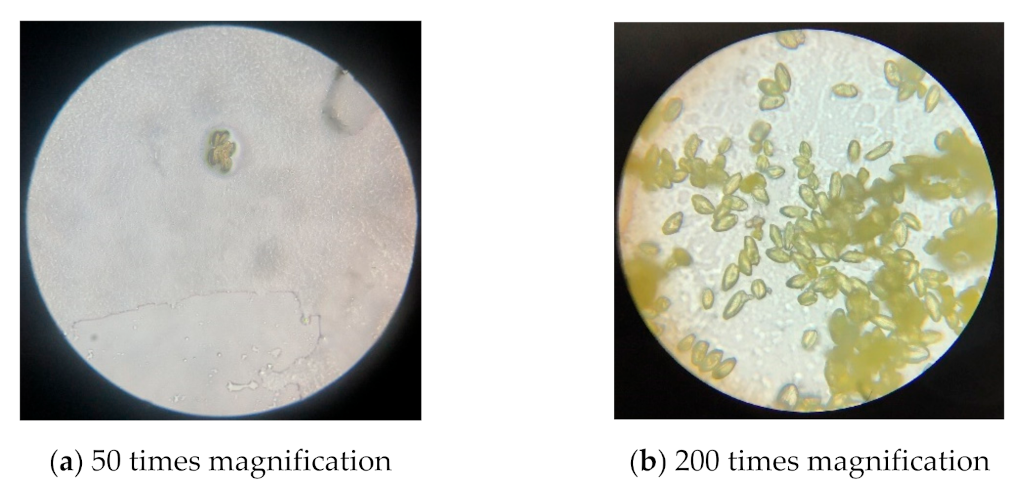
3.3. The OSR Pollen Sampling

OSR pollen was collected on the sampling sliders in the sampling area, while no pollen was collected in the CK area. The pollen appeared in clusters on the sliders as shown in Figure 8. The pollen collected on the sampler verified that the UAAS airflow field could help the pollen spread.

4. Discussion

Finding a new supplementary pollination method is of great importance for hybrid OSR seed production, as there are few studies that exist. In this article, we investigated UAAS P20 airflow field distribution on the OSR plant canopy to explore the feasibility of mechanical supplementary pollination. The wind field of the flight direction (direction x) was perpendicular to the flight direction (direction y) and had effective wind velocities, in which the maximum v x exceeded 8.0 m/s and the maximum v y approached 8.0 m/s; thus, it is believed that the wind field in these two directions can be applied for supplementary pollination. According to the wind velocities in Table 5, the v x was less than v y under most treatments (T1, T5, T7, T8, and T9) and was equivalent under T6, while it was larger under T2, T3 and T4. These results are different from Wang et al. [41], who showed that wind velocity was v x > v y and that the wind field in direction x was more useful to supplementary pollination. These may be caused by the structure differences between four-rotor and single-rotor UAASs. The wind in direction x showed a symmetrical distribution; basically, this is similar to the results of Li et al. [40]. Both the wind in direction x and y could be useful for supplementary pollination from the perspective of wind velocity, but v x was more stable and uniform; thus, it is recommended that the UAAS flies perpendicular to the male parent OSR lines. The ANOVA results showed that v x was highly affected by FH, was affected by the interaction of FS and FH, and that   v y was affected by FS, FH, and the interaction of FS and FH. T3, with the parameters of 4.0 m/s FS and 2.5 m FH, was the optimal parameter combination for supplementary pollination by wind field in direction x, and T4, with the parameters of 5.0 m/s FS and 2.5 m FH, was the optimal parameter combination for supplementary pollination by wind field in direction y. The images and the pollen sampling results indicate that the airflow field of the UAAS flying over the canopy can disturb the OSR plants and have a positive effect on OSR pollen spread.

5. Future Work

In this study, we mainly studied UAAS airflow wind distribution on the OSR plant canopy and drew conclusions based on the experimental data. It is necessary to combine machinery with the agronomy; thus, there are still further studies needed on UAAS supplementary pollination on hybrid OSR.
The factors of the daily optimal pollination time period, the frequency of the flight, the flight directions (parallel or perpendicular to the male OSR plant lines), etc., may all affect pollination and OSR yield. Further studies are needed to clarify the influences of the above factors on the effects of OSR seed production for scientific UAAS application on supplementary pollination.
Furthermore, in this study, the UAAS flew along the planned routes during the tests, and the routes were all straight from the starting to the end point, which was generated by the flight control system on the mobile app. Due to the shape of the farmland and the cultivation methods, the row of the OSR plant might not have been straight. Therefore, the straight-line planned route for the UAAS flight navigation needs to be improved if it requires the UAAS to accurately fly above the male OSR plant row. A research suggestion given is to introduce image recognition technology into the UAAS navigation, that is to recognize the male OSR plant row in real time; thus, the UAAS realizes meandering flight while following the male OSR plant row.
In addition, the yield of OSR seed production should be an indicator to evaluate different supplementary pollination methods such as manual pollination, insect (honeybees) pollination, natural wind pollination, and UAAS pollination, to verify whether the UAAS wind field can improve pollination or not on hybrid OSR seed production.
Finally, there is an extremely important and significant issue that is worth studying and cannot be ignored. With the development of agricultural mechanization and the continuous human pursuits of high efficiency in agricultural production, increasingly intelligent agricultural machinery has been applied, in which the UAAS in this study is representative. The use of these high-efficiency agricultural machines helps to achieve more yields, but the impacts on the natural biological populations are unknown. Combining studies with this article may determine whether UAAS supplementary pollination affects living pollinators. Taking the insect pollinator honeybee as an example, UAAS application on pollination may cause food reduction, injury, or death, thus leading to declines of quantity and population. Continuous and in-depth studies are needed to clarify the impacts of UAAS supplementary pollination on the insect population for maintaining ecological balance in the future.

Author Contributions

Conceptualization, S.Z. and X.X.; methodology, S.Z. and C.C.; software, S.Z. and C.C.; validation, S.Z., X.X. and C.C.; formal analysis, J.L.; investigation, J.L., T.S., X.L. and Y.T.; resources, S.Z. and C.C.; data curation, S.Z. and C.C.; writing—original draft preparation, S.Z. and C.C.; writing—review and editing, S.Z. and C.C.; visualization, S.Z.; supervision, X.X.; project administration, S.Z.; funding acquisition, X.X. All authors have read and agreed to the published version of the manuscript.

Funding

This research was funded by the China Agriculture Research System of MOF and MARA (grant no. CARS-12), the National Key Research and Development Program of China (grant no. 2017YFD0701000), the Agricultural Science and Technology Innovation Project of the Chinese Academy of Agricultural Sciences, Crop Protection Machinery Team (grant no. CAAS-ASTIP-CPMT), the Technology Innovation Guide Project of Gansu Province (grant no. 21CX6NG291)and the Jiangsu Science and Technology Development Plan (BE2019305).

Institutional Review Board Statement

Not applicable.

Informed Consent Statement

Not applicable.

Data Availability Statement

No new data were created or analyzed in this study. Data sharing is not applicable to this article.

Conflicts of Interest

The authors declare no conflict of interest.

References

  1. Liu, Q.; Ren, T.; Zhang, Y.; Li, X.; Gong, R.; Liu, S.; Fan, X.; Lu, J. Evaluating the application of controlled release urea for oilseed rape on Brassica napus in a regional scale: The optimal usage, yield and nitrogen use efficiency responses. Ind. Crop. Prod. 2019, 140, 111560. [Google Scholar] [CrossRef]
  2. Lu, J. Scientifc Fertilization Technology for Oilseed Rape; God Shield Press: Beijing, China, 2010. [Google Scholar]
  3. Delgado, M.; Felix, M.; Bengoechea, C. Development of bioplastic materials: From rapeseed oil industry by products toadded-value biodegradable biocomposite materials. Ind. Crop. Prod. 2018, 125, 401–407. [Google Scholar] [CrossRef]
  4. Szubert, K. Synthesis of organofunctional silane from rapeseed oil and its application as a coating material. Cellulose 2018, 25, 6269–6278. [Google Scholar] [CrossRef] [Green Version]
  5. Shim, Y.Y.; Falk, K.; Ratanapariyanuch, K.; Reaney, M.J.T. Food and fuel from Canadian oilseed grains: Biorefinery production may optimize both resources. Eur. J. Lipid Sci. Technol. 2017, 119, 1438–7697. [Google Scholar] [CrossRef]
  6. Cong, R.; Wang, Y.; Li, X.; Ren, T.; Lu, J. Differential Responses of Seed Yield and Yield Components to Nutrient Deficiency Between Direct Sown and Transplanted Winter Oilseed Rape. Int. J. Plant Prod. 2019, 14, 77–92. [Google Scholar] [CrossRef]
  7. Vollmann, J.; Rajcan, I. Oilseed Rape in Oil Crops; Springer: New York, NY, USA, 2009; pp. 91–126. [Google Scholar]
  8. Requier, F.; Odoux, J.-F.; Tamic, T.; Moreau, N.; Henry, M.; Decourtye, A.; Bretagnolle, V. Honey bee diet in intensive farmland habitats reveals an unexpectedly high flower richness and a major role of weeds. Ecol. Appl. 2015, 25, 881–890. [Google Scholar] [CrossRef] [Green Version]
  9. Allen-Wardell, G.; Bernhardt, P.; Bitner, R.; Burquez, A.; Buchmann, S.; Cane, J.; Cox, P.A.; Dalton, V.; Feinsinger, P.; Ingram, M.; et al. The potential consequences of pollinator declines on the conservation of biodi-versity and stability of food crop yields. Conserv. Biol. 1998, 12, 8–17. [Google Scholar]
  10. Qing, Y.; Li, Y.; Xu, L.; Ma, Z. Screen oilseed rape (Brassica napus) suitable for low-loss mechanized harvesting. Agriculture 2021, 11, 504. [Google Scholar] [CrossRef]
  11. Bommarco, R.; Kleijn, D.; Potts, S.G. Ecological intensification: Harnessing ecosystem services for food security. Trends Ecol. Evol. 2013, 28, 230–238. [Google Scholar] [CrossRef]
  12. Klein, A.-M.; Vaissière, B.E.; Cane, J.H.; Steffan-Dewenter, I.; Cunningham, S.A.; Kremen, C.; Tscharntke, T. Importance of pollinators in changing landscapes for world crops. Proc. R. Soc. B Biol. Sci. 2006, 274, 303–313. [Google Scholar] [CrossRef] [Green Version]
  13. Kremen, C.; Williams, N.M.; Aizen, M.A.; Gemmill-Herren, B.; LeBuhn, G.; Minckley, R.; Packer, L.; Potts, S.G.; Roulston, T.; Steffan-Dewenter, I.; et al. Pollination and other ecosystem services produced by mobile organisms: A conceptual framework for the ef-fects of land-use change. Ecol. Lett. 2007, 10, 299–314. [Google Scholar] [CrossRef] [PubMed]
  14. Aizen, M.A.; Harder, L.D. The global stock of domesticated honeybees is growing slower than agricultural demand for pollination. Curr. Biol. 2009, 19, 915–918. [Google Scholar] [CrossRef] [PubMed] [Green Version]
  15. Cordeiro, G.D.; Liporoni, R.; Caetano, C.A.; Krug, C.; Martínez-Martínez, C.A.; Martins, H.O.J.; Cardoso, R.K.O.A.; Araujo, F.F.; Araújo, P.C.S.; Oliveira, R.; et al. Nocturnal Bees as Crop Pollinators. Agronomy 2021, 11, 1014. [Google Scholar] [CrossRef]
  16. Blackstock, T.H.; Rimes, C.A.; Stevens, D.P.; Jefferson, R.G.; Robertson, H.J.; Mackintosh, J.; Hopkins, J.J. Hopkins the extent of semi-natural grassland communities in Lowland England and Wales: A review of conservation surveys 1978–1996. Grass Forage Sci. 1999, 54, 1–18. [Google Scholar] [CrossRef]
  17. Robinson, R.A.; Sutherland, W.J. Post-war changes in arable farming and biodiversity in Great Britain. J. Appl. Ecol. 2002, 39, 157–176. [Google Scholar] [CrossRef] [Green Version]
  18. Brittain, C.A.; Vighi, M.; Bommarco, R.; Settele, J.; Potts, S.G. Impacts of a pesticide on pollinator species richness at different spatial scales. Basic Appl. Ecol. 2010, 11, 106–115. [Google Scholar] [CrossRef]
  19. Halm, M.-P.; Rortais, A.; Arnold, G.; Touffet-Briens, F. Modes of honeybees exposure to systemic insecticides: Estimated amounts of contaminated pollen and nectar consumed by different categories of bees. Apidologie 2005, 36, 71–83. [Google Scholar] [CrossRef] [Green Version]
  20. Potts, S.G.; Imperatriz-Fonseca, V.; Ngo, H.T.; Aizen, M.A.; Biesmeijer, J.C.; Breeze, T.D.; Dicks, L.V.; Garibaldi, L.A.; Hill, R.; Settele, J.; et al. Safeguarding pollinators and their values to human well-being. Nature 2016, 540, 220–229. [Google Scholar] [CrossRef]
  21. Potts, S.G.; Biesmeijer, J.C.; Kremen, C.; Neumann, P.; Schweiger, O.; Kunin, W.E. Global pollinator declines: Trends, impacts and drivers. Trends Ecol. Evol. 2010, 25, 345–353. [Google Scholar] [CrossRef]
  22. Goulson, D.; Nicholls, E.; Botías, C.; Rotheray, E.L. Bee declines driven by combined stress from parasites, pesticides, and lack of flowers. Science 2015, 347, 1255957. [Google Scholar] [CrossRef]
  23. Fairhurst, S.M.; Cole, L.J.; Kocarkova, T.; Jones-Morris, C.; Evans, A.; Jackson, G. Agronomic Traits in Oilseed Rape (Brassica napus) Can Predict Foraging Resources for Insect Pollinators. Agronomy 2021, 11, 440. [Google Scholar] [CrossRef]
  24. Garibaldi, L.A.; Aizen, M.A.; Klein, A.M.; Cunningham, S.A.; Harder, L.D. Global growth and stability of agricultural yield decrease with pollinator dependence. Proc. Natl. Acad. Sci. USA 2011, 108, 5909–5914. [Google Scholar] [CrossRef] [Green Version]
  25. Breeze, T.D.; Boreux, V.; Cole, L.; Dicks, L.; Klein, A.; Pufal, G.; Balzan, M.V.; Bevk, D.; Bortolotti, L.; Petanidou, T.; et al. Linking farmer and beekeeper preferences with ecological knowledge to improve crop pollination. People Nat. 2019, 1, 562–572. [Google Scholar] [CrossRef]
  26. Lan, Y.; Wang, G. Development situation and prospects of China’s crop protection UAV industry. Agric. Eng. Technol. 2018, 38, 17–27. [Google Scholar]
  27. Lan, Y.; Chen, S. Current status and trends of plant protection UAV and its spraying technology in China. Int. J. Precis. Agric. Aviat. 2018, 1, 1–9. [Google Scholar] [CrossRef]
  28. Zhang, S.; Xue, X.; Sun, T.; Gu, W.; Zhang, C.; Peng, B.; Sun, X. Evaluation and comparison of two typical kinds UAAS based on the first industry standard of China. Int. Agric. Eng. J. 2020, 29, 331–340. [Google Scholar]
  29. Zhang, S.; Xue, X.; Chen, C.; Sun, Z.; Sun, T. Development of a low-cost quadrotor UAV based on ADRC for agricultural remote sensing. Int. J. Agric. Biol. Eng. 2019, 12, 82–87. [Google Scholar] [CrossRef]
  30. Wang, X.; Wang, M.; Wang, S.; Wu, Y. Extraction of vegetation information from visible unmanned aerial vehicle images. Trans. Chin. Soc. Agric. Eng. 2015, 31, 152–159. [Google Scholar]
  31. Zhang, S.; Qiu, B.; Xue, X.; Sun, T.; Peng, B. Parameters optimization of crop protection UAS based on the first industry standard of China. Int. J. Agric. Biol. Eng. 2020, 13, 29–35. [Google Scholar] [CrossRef]
  32. Xue, X.; Lan, Y.; Sun, Z.; Chang, C.; Hoffmann, W.C. Develop an unmanned aerial vehicle based automatic aerial spraying system. Comput. Electron. Agric. 2016, 128, 58–66. [Google Scholar] [CrossRef]
  33. Ahmad, F.; Qiu, B.; Dong, X.; Ma, J.; Huang, X.; Ahmed, S.; Chandio, F.A. Effect of operational parameters of UAV sprayer on spray deposition pattern in target and off-target zones during outer field weed control application. Comput. Electron. Agric. 2020, 172, 105350. [Google Scholar] [CrossRef]
  34. Huang, X.; Zhang, S.; Luo, C.; Li, W.; Liao, Y. Design and Experimentation of an Aerial Seeding System for Rapeseed Based on an Air-Assisted Centralized Metering Device and a Multi-Rotor Crop Protection UAV. Appl. Sci. 2020, 10, 8854. [Google Scholar] [CrossRef]
  35. Cai, G.; Dias, J.; Seneviratne, L. A Survey of Small-Scale Unmanned Aerial Vehicles: Recent Advances and Future Development Trends. Unmanned Syst. 2014, 02, 175–199. [Google Scholar] [CrossRef] [Green Version]
  36. Wang, S.; Lei, X.; Tang, Y.; Chang, Y.; Lv, X. Pear tree spray pollination technology based on multi-rotor UAV. Jiangsu Agric. Sci. 2020, 48, 210–214. [Google Scholar]
  37. Wu, H. Research of Effection Hybrid Rice Seed Pollination with Unmanned Helicopter. Master’s Thesis, Hunan Agriculture University, Changsha, China, 6 May 2014. [Google Scholar]
  38. Liu, A.; Zhang, H.; Liao, C.; Zhang, Q.; Xiao, C.; He, J.; Zhang, J.; He, Y.; Li, J.; Luo, X. Effects of supplementary pollination by single-rotor agricultural unmanned aerial vehicle in hybrid rice seed production. Agric. Sci. Technol. 2017, 18, 543–547, 552. [Google Scholar]
  39. Kong, D.; Zhao, Y.; Hui, X.; Xu, L.; Wang, X. Method and exploration of crop protection UAV assisting pollination to increase corn yield. China Agric. Technol. Ext. 2019, 35, 32–33. [Google Scholar]
  40. Li, J.; Zhou, Z.; Lan, Y.; Hu, L.; Zang, Y.; Liu, A.; Zhang, T. Distribution of canopy wind field produced by rotor unmanned aerial vehicle pollination operation. Trans. Chin. Soc. Agric. Eng. 2015, 31, 77–86. [Google Scholar]
  41. Wang, P.; Hu, L.; Zhou, Z.; Yang, W.; Liu, A.; Luo, X.; Xue, X.; He, J.; Yan, Y. Wind field measurement for supplementary pollination in hybrid rice breeding using unmanned gasoline engine single-rotor helicopter. Trans. Chin. Soc. Agric. Eng. 2013, 29, 54–61. [Google Scholar]
  42. Tian, Z.; Xue, X.; Xu, Y.; Yang, F.; Sun, Z. Effect of plant protection UAVs downwash on crop canopy. Trans. Chin. Soc. Agric. Eng. 2021, 52, 40–48. [Google Scholar]
  43. Shi, Q.; Pan, Y.; He, B.; Zhu, H.; Liu, D.; Shen, B.; Mao, H. The Airflow Field Characteristics of UAV Flight in a Greenhouse. Agriculture 2021, 11, 634. [Google Scholar] [CrossRef]
  44. Announcement No. 2566 of the Ministry of Agriculture and Rural Affairs of the People’s Republic of China. Available online: http://www.moa.gov.cn/govpublic/nybzzj1/201710/t20171011_5837449.htm (accessed on 31 August 2021).
  45. Yangguang 131. Available online: http://ocri.caas.cn/cgzh/194886.htm (accessed on 31 August 2021).
  46. Wang, G.; Lan, Y.; Qi, H.; Chen, P.; Hewitt, A.J.; Han, Y.; Yubin, L. Field evaluation of an unmanned aerial vehicle (UAV) sprayer: Effect of spray volume on deposition and the control of pests and disease in wheat. Pest Manag. Sci. 2019, 75, 1546–1555. [Google Scholar] [CrossRef] [PubMed]
  47. Zheng, Y.; Yang, S.; Liu, X.; Wang, J.; Norton, T.; Chen, J.; Tan, Y. The computational fluid dynamic modeling of downwash flow field for a six-rotor UAV. Front. Agric. Sci. Eng. 2018, 5, 159–167. [Google Scholar] [CrossRef] [Green Version]
  48. Zhang, S.; Gu, W.; Qiu, B.; Xue, X.; Zhou, L. Design and experiment of a hydraulic lifting wind field test platform for crop protection UAS. Int. J. Agric. Biol. Eng. 2021, 14, 166–174. [Google Scholar] [CrossRef]
Figure 1. The UAAS P20 flying in the test field.
Agronomy 11 02035 g001
Figure 2. The field sampling layout (top view).
Agronomy 11 02035 g002
Figure 3. The pollen sampling rods layout.
Agronomy 11 02035 g003
Figure 4. Three directions of airflow wind velocity distributions.
Agronomy 11 02035 g004
Figure 5. v y change trends. Note: v x 4.0 , v x 5.0 , v x 6.0 represent v x when FS is 4.0, 5.0, and 6.0 m/s; v x 1.5 ,   v x 2.0 , v x 2.5 represent v x when FH is 1.5, 2.0, and 2.5 m, respectively.
Agronomy 11 02035 g005aAgronomy 11 02035 g005b
Figure 6. v x change trends. Note: v y 4.0 , v y 5.0 , v y 6.0 represent v y when FS is 4.0, 5.0, and 6.0 m/s; v y 1.5 ,   v y 2.0 , v y 2.5 represent v y when FH is 1.5, 2.0, and 2.5 m, respectively.
Agronomy 11 02035 g006
Figure 7. The observed OSR plant swing images.
Agronomy 11 02035 g007
Figure 8. Collected OSR pollen images under different magnifications.
Agronomy 11 02035 g008
Table 1. The OSR characteristics and weather conditions.
Test TimeGrowth PeriodOSR Plant Mean Height (cm)Width of OSR Plant Line (m)Row Proportion of Male to FemaleMean Wind Speed (m/s)Mean Temperature (°C)Mean Relative Humidity (%)
3–9 July 2019Early stage of blooming160 ± 10 (male)
150 ± 10 (female)
0.25 (male)
2.45 (female)
2:100.78 ± 0.2025.85 ± 0.3035.1 ± 1.55
Table 2. The main technical parameters of P20.
ItemsParameters
UAAS size1262 mm × 1250 mm × 490 mm
Rotor diameter36 cm
Battery capacity18,000 mAh × 2
FS3–7 m/s
FH0.5–3 m
Note: UAAS, unmanned agricultural aerial system; FS, flight speed; FH, flight height.
Table 3. The experiment treatment designs.
TreatmentsFSFH
T14.0 m/s1.5 m
T24.0 m/s2.0 m
T34.0 m/s2.5 m
T45.0 m/s1.5 m
T55.0 m/s2.0 m
T65.0 m/s2.5 m
T76.0 m/s1.5 m
T86.0 m/s2.0 m
T96.0 m/s2.5 m
Table 4. The average wind velocities of the sampling points.
TreatmentsWind VelocityS1S2S3S4S5
T1 V x (m/s)0.820.992.730.940.79
V y (m/s)2.912.240.821.041.62
V z (m/s)0.970.811.100.781.01
T2 V x (m/s)0.981.222.381.461.02
V y (m/s)1.561.480.731.130.49
V z (m/s)0.740.630.870.530.66
T3 V x (m/s)2.192.222.382.011.98
V y (m/s)1.821.080.810.771.30
V z (m/s)0.860.691.170.980.88
T4 V x (m/s)2.241.890.970.310.44
V y (m/s)2.522.221.702.743.35
V z (m/s)0.570.661.520.301.21
T5 V x (m/s)1.191.221.630.420.50
V y (m/s)2.401.060.931.211.72
V z (m/s)1.031.560.840.470.50
T6 V x (m/s)1.491.440.600.580.55
V y (m/s)2.390.990.580.320.31
V z (m/s)0.600.541.621.330.64
T7 V x (m/s)0.701.201.501.000.95
V y (m/s)2.982.580.790.330.43
V z (m/s)1.331.061.210.820.66
T8 V x (m/s)0.821.562.590.940.77
V y (m/s)2.912.240.821.041.62
V z (m/s)0.971.311.101.321.11
T9 V x (m/s)0.890.880.450.350.35
V y (m/s)1.421.351.311.221.38
V z (m/s)1.310.821.860.370.36
Note: V x ,   V y ,   V z   mean the average wind velocity on each sampling point of the direction x, y, z, respectively.
Table 5. The effective velocities of three directions.
Treatments v x v y v z  
T11.25 m/s1.72 m/s0.93 m/s
T21.41 m/s1.08 m/s0.69 m/s
T32.16 m/s1.16 m/s0.92 m/s
T41.17 m/s2.51 m/s0.85 m/s
T50.99 m/s1.46 m/s0.88 m/s
T60.93 m/s0.92 m/s0.95 m/s
T71.07 m/s1.42 m/s1.02 m/s
T81.34 m/s1.72 m/s1.16 m/s
T90.58 m/s1.34 m/s0.94 m/s
Table 6. Two-way analysis of variance for v x .
Source of VariancedfFp ValueSignificance
FS20.350.70804NS
FH229.052.31752 × 10−6**
FS × FH46.870.00153*
Note: p denotes the significance level of the factor affecting the result. p < 0.01 ** denotes that factors have highly significant impact on test result; p < 0.05 * denotes that factors have significant impact on test result; NS denotes that factors have no significant impact on test result.
Table 7. Two-way analysis of variance for v y .
Source of VariancedfFp ValueSignificance
FS291.283.77829 × 10−10**
FH210.440.00098**
FS × FH443.784.86608 × 10−9**
Note: p denotes the significance level of the factor affecting the result. p < 0.01 ** denotes that factors have highly significant impact on test result.
Publisher’s Note: MDPI stays neutral with regard to jurisdictional claims in published maps and institutional affiliations.

