1. Introduction
Grazing is the most important source to cover the dietary needs of livestock in extensive sheep and goat systems. The efficient management of grazing is a factor maximizing the competitiveness of livestock systems and the use of grasslands can contribute toward more sustainable livestock production in the long term [
1]. Depending on the season, climate, species, floristic diversity, production system organization and other factors, small ruminants cover partially or fully their needs in natural pastures.
The choice between confined and pasture-based ruminant systems has been discussed mainly for cows. Peyraud et al. [
1] outlined the prerequisites and actions to be undertaken to render grasslands the basis for more sustainable dairy systems, including innovations in forage production, livestock-specific and system-specific characteristics. Reijs et al. [
2] presented a comparative socioeconomic analysis of dairy cattle systems in several Central and North European countries. They found significant differences in the economic performance—including production costs and labor—across farm types categorized according to the level and strategy of grazing. For small ruminants (sheep and goats); however, relevant research has been less systematic. Part of the literature has focused on the effects of grazing on the structure and function of the ecosystem [
3,
4]. The overall sustainability of these systems has also been investigated, as pasture-based systems play important sociocultural and economic roles [
5] and there is general consensus that action needs to be taken to improve their economic, social, and environmental performance and to tackle the interactions of these dimensions [
6,
7].
Pasture-based systems undoubtedly have high economic importance for local societies and families involved [
8]; however their economic performance have sometimes been proven low [
9]. Mills et al. [
10] point out that farmers could be reluctant to increase grazing because of potential barriers including distance and inaccessibility of pastures. New farm objectives which include higher productivity, economic performance and an easier way of life have led to the prevalence of more intensive patterns across Europe [
11,
12]. In Greece, the consequent shift from pasture-based to intensive confined small ruminant production has been witnessed in the emergence of more and more intensive farms, while the reliance on grazing is gradually substituted by the provision of feedstuff (forage and concentrates) either produced on-farm or from markets [
13,
14,
15]
Apart from less grazing in natural pastures, the intensification of small ruminant production—especially of dairy sheep and goats—is associated with investments on equipment and livestock [
15] and is accompanied by the use of concentrates and both off-farm and on-farm forage provision. This process has increased milk yields with variable effects on economic performance. Intensive farms have been found to lower their average total costs and to increase their efficiency levels (i.e., the level to which they transform inputs to outputs) compared to more extensive patterns [
16]. This intensification can be particularly profitable for increases of concentrate provision from very low levels—i.e., for transition to intensification from very extensive patterns—while maintaining grazing at acceptable stocking rates [
17]. However, increased economic performance does not always accrue with intensification, for instance Basset-Mens et al. [
18] underlined that higher product prices and lower prices of basic feedstuff are more profitable for intensive farms, while extensive farms benefit more in times when the contrary occurs. In Greece, this was witnessed during the economic crisis, as intensive farms were significantly more affected than those which grazed more [
15,
19,
20].
Feeding costs are the main source of expenses in most Greek sheep farms [
14,
15,
21], so it is obvious that feeding management is of utmost importance. Grazing provides flexibility to farmers, as they can design alternative feeding plans according to the availability of resources and thus adjust their feeding costs and increase their competitiveness and viability [
22]. In this context, sustainable intensification [
23] should rely on efficient use of pastures rather than just increasing concentrate intake [
17]. Farmers develop strategies involving different levels of pasture grazing either as a response to external challenges [
24] or to increase the economic performance of their farm [
25]. Delsalle et al. [
26] discerned four types of feeding management two of which involve some level of on-farm production of feedstuff, while the other two included the exclusive provision of naturally produced or of cultivated feedstuff. The application of grazing is an important element in first three types [
27].
Apart from purely economic considerations, farmers’ choices regarding grazing management are also affected by their personal beliefs and preferences, as well as by factors relating to perceived usefulness (e.g., labor shortage and time savings) and the easiness of use (e.g., adequate access) [
28,
29]. In Greece, the lack of coordination in the management and use of pastures poses barriers to farmers. For the first time the Common Agricultural Policy (CAP) 2014–2020 linked the distribution of community pastures with grazing capacities. More specifically, the introduction of the limit of 0.7 livestock units per ha and the stricter requirements to make pastures eligible [
30] led to a reduction of eligible pastures, threatening a subsequent reduction of income support. This was initially resolved through a ‘virtual’ allocation of eligible land to farmers in order to maintain payments already entitled to them. However, farmers continued to actually graze the pastures they had been using for years, without a specific plan, which inevitably led to misuse (overgrazing, undergrazing) [
31]. Then, the Greek Government issued a series of Common Ministerial Decisions (see [
21,
30] for details), regulating transitional methodologies for pasture allocation and leasing. Finally, the Common Ministerial Decision (CMD) 1058/71977/FEK 2331/7.07.2017 introduced the rules to modernize the system through the deployment of Integrated Grazing Management Plans (IGMP). The key aim of IGMPs is the sustainable use of rangelands according to their grazing capacity. This adjustment, which is actually ongoing, is expected to resolve issues relating to uncertainties and practical difficulties for livestock farmers, to increase eligible pastures and to contribute toward efficient use of grazing resources.
This study aspires to contribute to the debate about the economic sustainability of pasture-based small ruminant farms. In particular, the paper explores the managerial decisions of farmers under which grazing has a positive impact on economic performance and whether cost savings due to grazing are counterbalanced by other expenses. For this reason, this paper presents the results of a small ruminant farm management survey in a Greek rural area. Farms were categorized according to species and the time that livestock grazed in natural pastures. Based on this typification, technical and economic indicators as well as financial results were calculated to pinpoint differences across different farm types, focusing on the effects of adopting strategies which include more or less grazing. In addition, with an application of the Data Envelopment Analysis (DEA) method, differences in the technical efficiency of farms were investigated. To our knowledge, this is the first study which explores the economic performance and efficiency of small ruminant farms according to grazing.
2. Materials and Methods
2.1. The Study Area
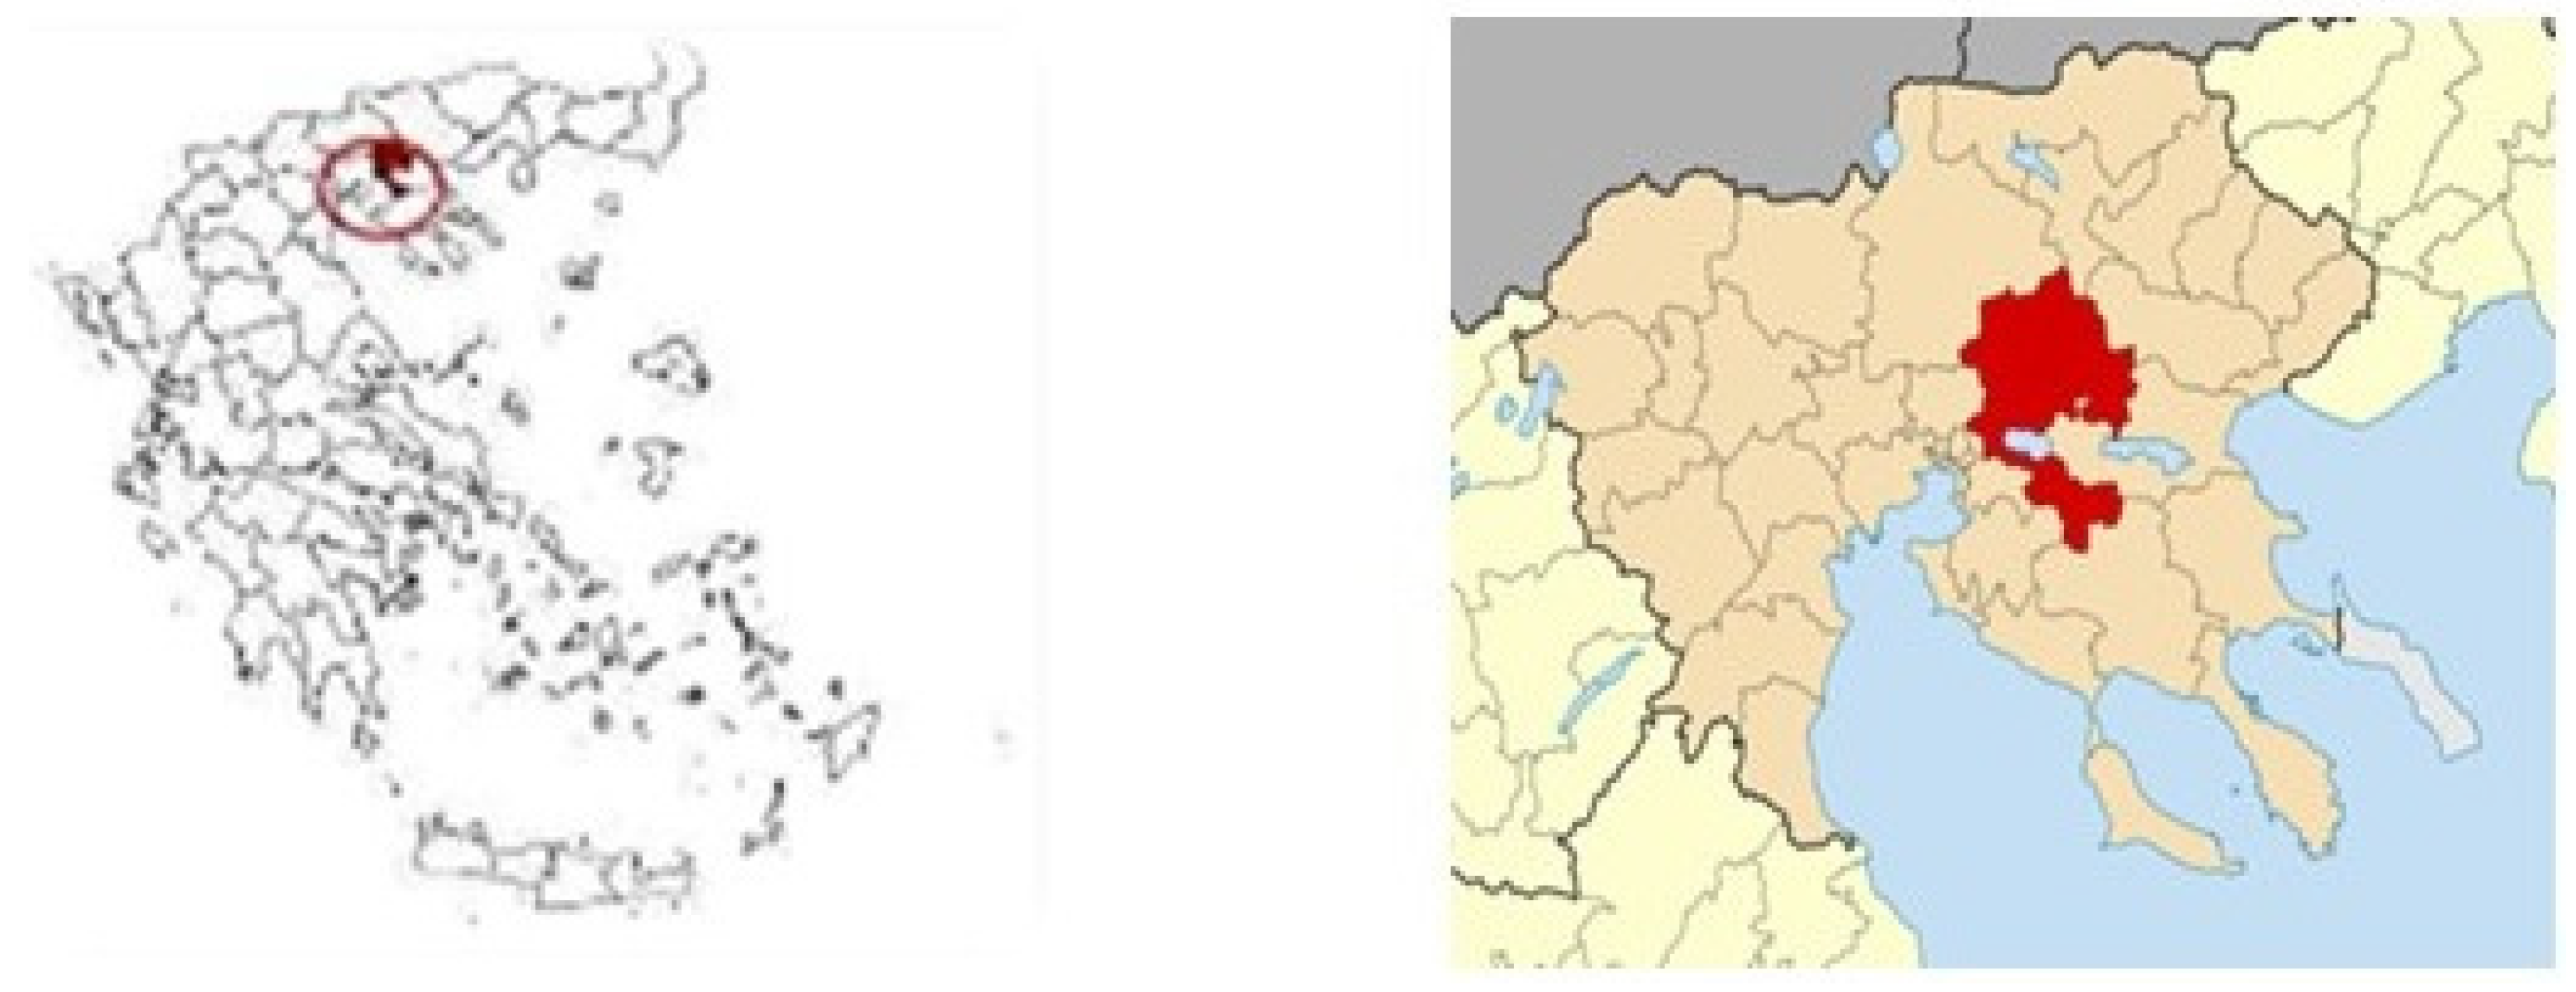
The survey involved the Municipality of Lagkadas, in the Regional Unit of Thessaloniki, Northern Greece (
Figure 1). The area is composed of a set of sub-areas with special geographical, bioclimatic, and ecological characteristics, resulting in considerable inter-sectoral differences and equally rich variety in production, economic activities and use of available resources. Indeed, production varies depending on the altitude, resources, and tradition in each sub-region. The climate of the area is semi-arid Mediterranean with annual rainfall from 410 to 685 mm depending on the elevation. The bedrock of the area is quite homogenous mainly with metamorphic rocks, pyroclastic rocks, and limestones [
32]. Shallow soils (leptosols and regosols) are the most common in the area, while in lowland plains the alluvial soils [
32].
The Municipality (122,000 ha) can be divided in three agro-ecological sub-regions (zones) (lowland <200 m; semi-mountain 201–600 m; mountain >600 m asl). The lowland zone is dominated by
Quercetalia pubescentis with evergreen broadleaves
Quercus coccifera (kermes oak),
Juniperus communis (Juniper) and
Phyllirea latifolia (Green olive tree). The vegetation in the semi-mountain zone includes a variety of deciduous broadleaves as
Castanea sativa (Sweet chestnut),
Ostrya carpinifolia (European hophornbeam),
Platanus orientalis (Oriental Plane Tree),
Prunus spinose (Blackthorn),
Pyrus amygdaliformis (Almond-leaved Pear),
Quercus spp (Oak) and
Sorbus domestica (Service Tree). In altitudes exceeding 600–800 m (mountain zone)
Fagus sp (Beech) and
Abies sp (Fir) prevail [
34].
Although the Municipality is very close to Thessaloniki, the main urban center of Northern Greece, the primary sector—crop and livestock production—is the main economic activity and source of income and employment. According to raw data provided by the Greek Payment and Control Agency for Guidance and Guarantee Community Aid (OPEKEPE)—which is the Greek payment authority of CAP aid schemes—for 2018, the arable area in the Municipality is 36,100 ha cultivated with arable crops (wheat, barley, corn, oilseeds, legumes etc.), vegetables, olives, and fruit trees. Livestock production is based on cattle (22,000 cattle—for fattening but also with a considerable number of intensive dairy farms) and sheep and goats (96,500 sheep and goats, 451 farms) and less on poultry, pigs, and beekeeping (OPEKEPE data for 2018). Sheep and goats are predominantly dairy and meat plays a secondary role in farm livelihoods. The long-term increase of livestock in the Municipality, the large number of livestock farms as well as the high percentage of livestock production in the per capita gross product of the primary sector, are elements that emphasize its special importance for the wider region.
The dominant sheep and goat production system in the area is pastoral non-transhumant, which means that the livestock feeding is directly related to grazing, mainly in winter, spring and autumn. During summer, flocks usually graze on agricultural land with grain stalks and very rarely move to neighboring areas at higher altitudes. In cold and rainy days, the animals remain confined, but in all seasons they are also fed with forage and concentrates (corn, wheat, barley, cotton pulp etc.). While grazing, livestock are always supervised by a shepherd, either a family member or a salaried employee. Farms are predominantly dairy and sell their milk to local dairies mainly for the production of ‘feta’ cheese and yogurt. Since the area is a Municipality, the access of farms to markets is not constrained by physical factors such as distance, climate, and soil.
The pastures of the Municipality follow a variable pattern with valleys and steep slopes and are distributed across the three altitude zones. Although small ruminants can move relatively comfortably on steep slopes, farmers tend to avoid these areas and choose the most accessible ones across the four types of pastures prevailing in the area (grasslands, shrublands, dense shrublands and grazed oak forests). Grasslands are mostly located in lowland, while shrublands in semi-mountain and mountain areas. The grasslands in the lowland area are more productive (unpublished data) compared to these in semi-mountain and mountain areas although are the most heavily grazed [
35]. The floristic composition of grasslands is not highly differentiated across the agro-ecological sub-regions and mainly consists of
Aegilops sp.,
Cynodon dactylon,
Chrysopogon gryllus,
Anthoxanthum odoratum,
Hordeum sp,
Trifolium sp (Unpublished data). IGMPs have not been delivered yet, therefore farmers are still operating under the transitional regime using a continuous grazing system, which is sometimes the cause of frustration and practical barriers, including long distance from their actual pastures, low productivity, and inability to undertake improvement actions. It should be noted that since grazing does not follow a particular pattern (e.g., rotational or strip grazing), farmers use the same areas throughout the year.
2.2. Survey Design and Administration
The farm accounting data for this empirical application were collected from farmers of the study area, through a farm management survey using a carefully designed questionnaire, in order to assure an in-depth empirical analysis. Data included description of flock (size and species); product yields and prices; CAP income support (Basic Payment Scheme entitlements, mountain area payments, coupled support for sheep and goat meat); description of labor (family and hired as well as allocation of tasks among workers); detailed description of grazing practices (period, duration per period, types of livestock which graze); variable capital (purchased feedstuff, crop production for feedstuff; other supplies); fixed capital endowments (buildings, machinery). Data describing the pastures were also collected but finally they were not used for the analysis, as the eligible pasture of each farm could differ significantly from the one actually used.
The survey was carried out from February 2018 to March 2019. Personal interviews were conducted in order to provide explanations to respondents regarding data requirements as well as to ensure that responses would be as realistic and accurate as possible, especially regarding financial data (prices, income support, expenses). Each interview lasted from 1 to 3 h. In total, 80 sheep and goat farmers were surveyed, of which 32 were from the lowland, 34 from the semi-mountain and 14 from the mountain zone. Sample farms also accounted for all three types in the area according to species reared (sheep, goats, mixed sheep and goats in almost equal numbers), as explained in
Section 2.3.
2.3. Data Analysis
2.3.1. Technical and Economic Analysis
Apart from duration of grazing and livestock species, the sample of 80 farms covered a wide range of farm structural characteristics, including size, productivity, labor sources, value of livestock and equipment, cultivated area and feeding management. A descriptive technical-economic analysis was employed to capture this variability, by presenting the existing organization and economic performance of the sampled farms. This analysis included the calculation of technical and economic indicators of farm performance, the presentation of the structure of farm expenses per production factor (land, labor, and capital) as well as the calculation of basic financial results.
To highlight potential differences due to grazing management, farms were categorized according to the duration of grazing—i.e., hours per year that the flock grazed in natural pastures. In Category 1 (C1) flocks grazed 1–1800 h per year while in Category 2 (C2) flocks grazed more than 1801 h per year. C1 included farms which grazed mainly in late spring and early autumn for a few hours a day, with the purpose of increasing animal welfare or—additionally—taking advantage of vegetation abundance. C2 farms, on the other hand, grazed throughout the year, except for harsh winters. C1 farms grazed mostly around the farm and did not move more than 1–2 km per day, while C2 farms moved up to 4–5 km per day, especially in summer and autumn, as they grazed for more hours per day to cover a significant part of the dietary needs of their animals with natural vegetation.
In addition, three farm types were discerned in each category according to the animal species i.e., sheep farms (SF), goat farms (GF) and mixed farms (MF), which reared exclusively sheep or goats or both species in relatively equal numbers respectively. Thus, the analysis indicated the potential of the sector associated with the various levels of grazing per animal species, summarizing technical and economic indicators as well as financial results per farm type but also for the average farm (AF) per Category.
Table 1 summarizes these classifications and presents the number of sampled farms per Category and Type.
2.3.2. Theoretical Model of Data Envelopment Analysis
Data Envelopment Analysis (DEA), which was introduced by Charnes et al. [
36], has been proven an efficient tool in the evaluation of relative efficiency of production units. It is a non-parametric approach which measures technical efficiency estimators as optimal solutions to mathematical programming problems. In general, DEA defines a non-parametric frontier and measures the efficiency of each Decision-Making Unit (DMU) relative to that frontier, attributing all the deviations from the frontier to inefficiencies. Assuming that there are
n DMUs (
DMUj,
j = 1,
2,
…,
n), each producing
s outputs
yrj (
i = 1,
2,
…,
m) by using
m inputs
xij, the variable returns to scale (VRS) input-oriented model (DEA models can be either input or output oriented. In the input orientation the efficiency scores relate to the largest feasible proportional reduction in inputs for fixed outputs, while in the output orientation they correspond to the largest feasible proportional expansion in outputs for fixed inputs [
37].) where the inputs are minimized and the outputs are kept at their current levels [
38] is expressed as follows:
where
DMUo represents one of the
n DMUs under evaluation, and
xio and
yro are the
ith input and the
rth output respectively.
λj are intensity variables, indicating at what intensity a particular activity may be employed in production, while
θ* represents the input-oriented technical efficiency score of
DMUo. If
θ* = 1, then the current input levels cannot be reduced indicating that
DMUo lies on the efficiency frontier. If
θ* < 1, then
DMUo is dominated by the frontier and the input can be simultaneously reduced without altering the proportions in which they are used by 1 −
θ*.DEA is now a well-established method with many applications in the primary sector and it is not necessary to go into many details about the theoretical background of the approach. Comprehensive reviews and extensions of the DEA model can be found in Kumbhakar and Lovell [
39], Coelli [
40], Cooper et al. [
41], and Coelli et al. [
42].
For this empirical application, survey accounting data from all 80 farms were used. Indeed, all farms had the required characteristics for the empirical application of DEA, which involves the identification and measurement of relevant inputs and outputs that are common in all production units. Each farm consumed varying amounts of inputs to produce different levels of outputs and it was assumed that they all operated under the same or similar production technology. In the specification chosen for this study, the relevant inputs used were: (1) farm size measured by the number of female productive animals (ewes and dams) reared in the farm, (2) variable capital cost (€/farm/year), (3) human labor for grazing -(hours/farm/year), (4) human labor for all other activities in the farm, such as on-farm production of feed, feeding of animals, milking, care of livestock, etc.—(hours/farm/year) (5) fixed capital cost (annual expenses of machinery, equipment, livestock and other fixed assets) (€/farm/year). The conventional inputs selected for the DEA model express all the factors used in a typical livestock production process (labor, variable capital, fixed capital). Gross revenue including subsidies, which was a function of prices as well as product quantities (milk, meat, others), was used as the output measure in the estimation of efficiency in order to incorporate the effect of price and yield variability in the output measure (€/farm/year). Non-parametric methods were applied for the statistical evaluation of the Technical Efficiency (TE) scores among the farm groups. The assumptions of normality and homogeneity of variances were tested using the Shapiro-Wilk and Levene’s test, respectively. The TE scores estimated through DEA were transformed to square roots for accessing the assumptions of normality and stability of variances. In the case where assumptions about either variability or the form of the population’s distribution were seriously violated, with or without transformed data, the Wilcoxon rank sum test (Mann-Whitney U-test) non-parametric test was applied to evaluate differences between mean TE scores of specific farm groups, i.e., TE score achieved in C1 AF compared with the score achieved in C2 AF. Analyses were conducted using the statistical software program SPSS (v. 25.0).
3. Results
3.1. Technical and Economic Analysis of the Sample
The sampled farms exhibited similar characteristics in terms of production orientation (dairy farms), input prices as well as management and production practices (grazing at different levels). Also, most of them shared common features in terms of milking (machine milking and lactation periods of 210 days from mid-December to mid-July) and breeds (crossbreeds—Greek and imported improved breeds). As reported in
Table 2, all farms—either C1 or C2—fed animals with additional forage as well as concentrates (produced on-farm or bought from markets), therefore their feeding costs included the costs of market purchases as well as the ones for on-farm production. The C1 AF fed higher quantities of forage per ewe/dam compared to C2 AF, while the opposite was found for concentrates. Seasonal changes in the provision of feedstuff following changes in grazing are not reported here, as there was no clear pattern across the farms and many of them fed the same quantities throughout the year.
Table 2 presents basic technical and economic data for ‘average’ representative farms (AF) per Category and Type, as reported in
Table 1. The size of C1 and C2 AFs was 294 ewes/dams, therefore the differences discussed in this section cannot be attributed to size. However, the synthesis of species differed significantly, as C1 AF reared almost four times more sheep than goats (232 and 62 respectively), while in C2 AF goats exceeded sheep a little (153 and 141, respectively). This is due to the fact that the average size of C1 farms was 50.0% larger for SF (310 compared to 200 sheep) but 40.0% smaller for GF (205 compared to 350 goats). Evidently, one of the main differences across farms was hours grazing per year, as C1 and C2 AFs grazed 1189 and 2478 h respectively. SF grazed less on average than other farm types, while C2-SFs grazed 132.0% more hours than C1 SFs.
Since flocks grazed more, C2 AF required considerably more labor compared to C1 AF (20.4 h/ewe-dam/year compared to 17.7 h/ewe-dam/year). This was mainly due the fact that C1 SFs required almost 50.0% less labor per ewe compared to C2, while, surprisingly, C1 GFs required 18.0% more than C2. Apart from grazing, farms produced part of their feedstuff (0.03 ha/ewe-dam on average), while C2 SF cultivated more than twice the acreage of C1 SF.
Product yields and prices varied across farm Categories and Types. C1 AF achieved higher milk yields than C2 AF, mainly due to the considerably higher yields of goat milk, which were 53.0% lower for C2GF compared to C1 GF (148.0 lt/ewe-dam compared to 226.6 lt/ewe-dam) and 25.0% lower for C2 AF compared to C1 AF. Milk prices were higher for all C1 farms compared to C2, with the exception of goat milk in MFs (0.48€/lt and 0.52€/lt respectively). For meat, C1 AF achieved 10.0% higher yields than C2 AF but 7.0% lower aggregate prices, as especially the price of sheep meat was lower for C1 SFs. Please note that meat mainly involves lambs and meats—slaughtered right after weaning (40–50 days)—and, to a lesser extent, meat from culled animals—usually after 4 or 5 lactations.
Table 3 presents the cost structure of the sample farms per Category and Type. As expected, capital expenses stood for the highest part of total farm expenditure across all Types (from 67.2% for C2 GFs to 76.4% for C1 SFs). Fixed expenses stood for a relatively lower percentage of total expenses for the C2 AF compared to C1 (23.5% and 27.4% respectively). Also, the implicit (unpaid) expenses for family labor—calculated for an implicit hourly wage of 3.5€/h—stand for an important part of total expenses (17.8% and 22.8% for C1 and C2 AFs respectively).
In general, C1 AF operated under higher costs per ewe-dam compared to C2 AF (224.51€/ewe-dam and 213.87€/ewe-dam respectively). This was due to capital cost savings of 18.36€/ewe-dam for C2 AF—mainly due to lower fixed costs and expenses for purchased feedstuff—which were partially counterbalanced by higher labor expenses. However, the situation was substantially different for SF and GF across Categories. C2 SF and GF exhibited the highest and lowest total production costs per ewe/dam respectively. Since C2 SF grazed and cultivated more than twice land compared to C1 SF, it would be expected that they would minimize significantly their expenses for purchased feedstuff. However, the results in
Table 3 do not confirm that, as the expenditure for feedstuff for markets per ewe was almost 16.0% higher for C2 SF than C1 SF (99.80€/ewe and 86.34€/ewe respectively). Therefore, the production costs for C2 SF were higher than C1 SF by 65.24€/ewe. On the contrary, C2 GF achieved significant savings in feeding costs (purchased feedstuff plus crop production) but, most importantly, in labor, despite the fact that animals grazed more and hired labor was used.
Table 4 summarizes two sets of financial results of farms across categories and types—one set including income support and one excluding them. The most important product was milk, accounting for 61.2% and 55.7% of total revenues for C1 AF and C2 AF respectively. Evidently, income support played a crucial role for the performance and viability of farms (20.9% and 24.3% of total revenues for C1 AF and C2 AF respectively). As a result of lower yields and product prices, C1 AF achieved considerably higher gross outputs per ewe-dam than C2 AF, which was also the case for other farm types except for SF.
Both C1 and C2 AFs operated with net losses, because of differences in gross output and expenses. Net losses were lower for C1 AF compared to C2 AF (12.87€/ewe-dam and 33.62€/ewe-dam respectively). It was only C1 SF that achieved net profit (0.21€/ewe). However, when income support was not included, losses were aggravated across all Categories and Types. These results demonstrate how all sampled farms had negative prospects and faced difficulties regarding their viability even with income support. In the short run, however, farms do not face imminent threats, as the gross margin was positive either with or without income support.
With regards to the remuneration of production factors (labor and capital), both AFs showed very low returns. For labor, the hourly wage was positive for C1 and C2 (2.14€/h and 1.62€/h respectively) but lower than the minimum hourly wage paid to farmworkers (3.00€/h). Without income support, however, the hourly wage was negative or zero across all Categories and Types. When it comes to capital return, it was marginally positive for C1 AF (1.0%)—bearing in mind that the average lending rate in Greece was around 6.0%—and negative for C2 AF and for most Types in both Categories.
3.2. Efficiency Analysis—DEA
The variable returns to scale (VRS) input-oriented DEA model was solved using the DEA Frontier program [
43] and the frequency distribution of the technical efficiency estimates obtained for sample farms are presented in
Table 5. The results indicated a significant variation in the level of technical efficiency of sheep and goat farms, although they operate under the same or similar production systems (dairy farms), input-output prices as well as management and production practices (grazing at different levels). Technical efficiency scores ranged from a low of 0.457 to a high of 1.000 (fully efficient farms), with an average technical efficiency of 0.846. According to the input-oriented DEA model, the efficiency score of the AF (84.6%) indicates that the same level of revenues could be achieved by reducing inputs by 15.4% ((1 − 0.846) * 100%) provided that the farms make managerial decisions which will lead to higher efficiency levels. Technical inefficiency indicates that there is plenty of room for improvement in the use of the entrepreneurial factor in the sheep and goat farms; a factor that has a great impact on their economic performance. Under the DEA model 28 of the 80 farms—i.e., 35.0% of the total sample—were fully technical efficient and these were the ones using the existing technology quite rationally in terms of management. In addition, 20 farms (25.0%) had technical efficiencies between 80.0% and 99.0% operating relatively close to the DEA frontier, while only 32 farms (40.0%) exhibited technical efficiencies less than 80.0%.
The input-oriented DEA approach identified efficiency targets (possible reduction in inputs) while achieving the same output [
44]. The results of efficiency improvement projection based on the VRS DEA model for the sampled farms are presented in
Table 6, where the efficient target for each input under evaluation (DEA projection of the optimal value for each input) are described. If the farms achieved these targets, they would be operating on the efficient frontier, thus they could decrease the use of inputs and their production cost and still achieve the same gross revenue. It should be underlined, however that the achievement of the efficiency target is subject to managerial skills and decisions of farmers and is thus not related to specific practices. The application of the Mann-Whitney test did not indicate statistical difference between farm groups (C1 AF vs. C2 AF (
p-value = 0.339), C1 SF vs. C2 SF (
p-value = 0.964), C1 GF vs. C2 GF (
p-value = 0.727) and C1 MF vs. C2 MF (
p-value = 0.844)) regarding the achieved TE score. This result does not downplay the significance, the robustness, and the importance of the following results, since DEA is a non-parametric, deterministic, linear-programming approach that calculates a measure of “relative” efficiency which is sample-related. The performance of each production unit (farms in this case) in DEA is measured against the set of its closest efficient, best-observed practice unit. The fact that this relative efficiency measures are based on these observable sets of “best practice units” is the characteristic that makes DEA so appealing to economists and management scientists [
45,
46]. Any change in the sample units would change significantly the TE scores and hence, it is difficult to make any statistical inference for non-parametric DEA estimators [
47].
For the Overall AF results show that the same gross revenue could be achieved by a smaller farm in size which would rear 53 less animals (18.0% reduction, from 294 sheep and goats to 241). This farm would require 9.0% less variable cost per ewe/dam (from 102.45€ to 93.18€) and 2.7% less fixed cost per ewe/dam for its operation (from 55.41€ to 53.91€). Moreover, the farm could reduce human labor for grazing by 14.0% (from 6.4 h per animal to 5.5 h) and labor for all the other farm activities by only 2.7% (12.7 h per ewe/dam to 12.4 h).
The results follow the same pattern across Categories and Types of farms. Concerning farm size, the largest adjustment occurs in the C2 AF which could rear 21.8% less animals to achieve the same output (from 294 to 230 animals), while regarding farm types, the largest reduction in flock sizes occurs in the MF in both categories (27.5% reduction for the C2 MFs and 24.1% for the C1 MFs) and for the GFs (24.3% for the C2 GFs and 23.3 for the C1 GFs).
The variable cost could be reduced by 8.2% and 10.3% for the C1 and C2 AF, respectively, if they would operate on the efficient frontier. The largest reduction regarding variable cost appears in the C2 SFs (13.4%) and in the C2 MFs (13.3%), followed by the C1 MFs (9.8%) and the C1 SFs (8.6%). The adjustment for the fixed cost is relatively small across the farm categories, i.e., 3.5% for the C1 AF and only 2.8% for the C2 AF. The largest reduction in fixed cost occurs in the MFs in both categories (12.8% in the C2 MFs and 9.9 in the C1 MFs).
The results also indicate that grazing could be reduced significantly in both farm categories without changing gross revenues (12.5% and 11.9% reduction for the C1 AF and the C2 AF, respectively). On the contrary the reduction in labor for the other farm activities is very small, especially for the C2 AF (4.4% and 1.7% reduction for the C1 AF and C2 AF, respectively). Across farm Types, farms that do not allocate efficiently the available human labor for grazing are the C1 SFs (reduction of 12.5%) and the C2 GFs (17.3%).
In general, the results indicate that the adaptation of the farm derives mainly from better use of labor for grazing as well as from the adoption of more efficient feeding strategies that reduce feeding cost. Moreover, the reduction in fixed cost per animal, although small, combined with the adjustment of the farm to its optimal size indicates that farms undertake heavy investments in machinery and buildings that increase their total production cost affecting their resilience and sustainability.
4. Discussion
One of the key findings of this study was that grazing did not contribute to technical efficiency the same way to all farm types. Differences between C1 and C2 AFs in terms of yields, expenses and labor requirements were partially due to different average sizes—although the DEA showed that efficient operation could be achieved by reducing the number of animals reared—while farms were relatively homogeneous in terms of other practices and faced with similar physical conditions. Therefore, it can be argued that differences in economic performance and efficiency are mainly due to grazing—and in particular to the choices of farmers regarding the feeding patterns of their farms—and not on geophysical or market external factors [
48,
49,
50]. However, it cannot be supported that the impact of grazing can be definitely positive or negative. Besides, DEA results indicated that a reduction in grazing was required to achieve higher levels of technical efficiency (in fact this was the input which required the higher reduction to achieve the same level of output). Furthermore, C2 farms were less technically efficient than C1 and, although they fed higher quantities of concentrates, they achieved lower milk yields.
A comparison with the results presented by Galanopoulos et al. [
51] for transhumant farms shows that the farms in this study exhibit considerably higher scores of relative technical efficiency, even C2 farms which graze more than the transhumant farms of the study under discussion. This highlights the importance of a rationally designed feeding plan for all farms, despite their level of intensification, and also that the flexibility that grazing provides can only be effective if used carefully. Furthermore, the achievement of feeding cost savings from more grazing can be counterbalanced by the costs of additional labor requirements. More important, increased grazing may affect the organization of farms and alter their efficient operation, such as in the example presented by [
52] where the expansion of an extensive farm to cheese production reduced its operational effectiveness.
According to Ragkos et al. [
15] sheep farmers in Greece shifted to grazing and became more extensive in order to mitigate the negative effects of the financial crisis and reduce their production costs. However, this study shows that this would not be enough, as more grazing and extensification of farms not only led to lower yields and revenues but also required a different internal organization pattern, which would improve the management of labor. This illustrates how guidance is required for grazing farms in order to assist them undertake a transition toward better organization of labor.
An important finding of this study is the significant discrepancy between the organization of C1 and C2 SFs. The more extensive SF of C2 perform poorly in terms of feeding management, as their excessive feeding costs do not lead to higher productivity. The technical and financial indicators for both SF are considerably worse than those reported for a typical dairy farm in Basque County by Ripoll-Bosch et al. [
7] but are generally higher than those reported in Greek studies. For instance, in Ragkos et al. [
15] sheep farms which shifted from intensive to more extensive patterns due to the economic crisis achieved negative farm incomes and operated under net losses of 142€/ewe to 191.6€/ewe. For transhumant sheep and goats, the average farm rearing under 350 ewes-dams operated under net losses of 84.2€/ewe excluding income support [
19]. More recently, Sintori et al. [
53] reported an average milk yield of 136.8 kg/ewe for sheep farms in mainland Greece combining feedstuff provision from markets, crops cultivation and grazing, while Pulina et al. [
12] presented a considerably lower average milk yield for Greek sheep farms (101 kg/ewe) but higher milk prices (0.96€/kg) than those reported in this study. Better results have been reported for more intensive patterns, for instance positive net profit with considerably higher production costs (390€/ewe) [
14] and average milk yield of 276.6 kg/ewe for Chios sheep farms, whose grazing average was close to C1 SF in this study [
54].
For goats, also significant differences were found. Yields for French, Spanish, and Italian farms in a typological study of dairy goat farms in the Mediterranean, which combined cultivation of feedstuff with grazing and concentrate provision [
55], were considerably higher than those presented in this study. Also, feeding costs were lower than C1 GF for three out of four clusters and labor requirements were lower than both C1 and C2 GF and closer to the target values reported in
Table 6 for C2 GF. However, the authors arrived to the same observation as this study that farms need to manage grazing more efficiently, especially its combination with supplementary feeding. Gelasakis et al. [
56] studied grazing goat farms in Greece and calculated milk yield per doe per lactation 207 ± 115.3 kg, which was lower than for C1 GF and higher than C2 GF, and around 16 h/doe labor requirements annually, which was lower than for GF in this study, while they reported positive financial results, although they were not directly comparable to the ones reported here. Pulina et al. [
12] presented a higher average milk yield for Greek goat farms (250 kg/ewe) but higher milk prices (0.58€/kg) than those reported in this study. In recent decades the woody vegetation cover in the area increased [
57], while grasslands decreased. It is known that goats are browsers [
58] and able to use the woody vegetation because of their particular metabolic efficiency [
59]. According to Chouvardas and Vrahnakis [
60], it is necessary to make policies for supporting the extensification of goat farming in the area. This way, goats will consume the woody species, most of which are preferable and will be used as a biological tool for the control of woody vegetation.
Mixed grazing by sheep and goats has been found a beneficial strategy from the environmental perspective [
61] and this study revealed that there are also positive economic effects in terms of cost savings, especially for C2 MF, although these farms achieve relatively low prices, yields and technical efficiency. MFs could achieve the same level of output with considerable reductions in flock sizes and better organization of labor. The findings of this study partially converge with those presented by Penati et al. [
62] for dairy cattle. In particular, in both studies farmers sought to increase their milk production, but this did not seem to be achievable through an increase in grazing. As Mack et al. [
63] pointed out in a study regarding summer pastures in the Alpine zone, low-yielding land with poor accessibility was increasingly managed with as little labor input as possible or will be completely abandoned. Therefore, the choice of farmers to organize rationally the operation of their farms was subject to the quality of rangelands. For this study, it is expected that the deployment of IGMPs will motivate farmers to undertake long-term management of their pastures and thus reorganize their farms toward higher levels of operation.
The finding that farms operate under net losses is in line with other studies in Greece [
15,
19] and also internationally—especially when income support are excluded [
10]. This shows that pasture-based small ruminant systems are highly dependent on EU support, which partially ensures their viability but renders them vulnerable to changes in the policy context. A potential abolishment of income support would entail the loss of almost all Farm Income for C2 AF and of around 70% of it for C1 AF. In addition, the generic framework of these payments—which is reflected in the fact that most farms enjoy much the same income support per ewe-dam (
Table 4)—could potentially be revised and become more targeted to the specificities of these farms, including for the provision of ecosystem services, as Bernues et al. [
64] suggest. Galanopoulos et al. [
51] found that smaller transhumant farms benefit more from income support than larger ones, which perform better without them; nonetheless these differences were not directly attributable to grazing management.
5. Conclusions
This study summarized empirical findings demonstrating how grazing contributes to the economic performance of small ruminant farm in a Greek area. It was shown that the inclusion of grazing in the feeding strategy of a farm does not always lead to higher financial results. On the contrary, feeding patterns combining feedstuff provision and grazing ineffectively could lead to losses due to higher labor requirements for flock supervision and/or excessive expenses for forage and concentrates. Indeed, the same level of outputs could be achieved by reducing grazing, without changing other inputs, while this reduction was significantly higher than the reduction range for other inputs, such as flock size and investments in fixed capital. Therefore, these factors, combined with low productivity, counterbalanced the potential expected benefits from grazing. Mixed farms rearing sheep and goats performed worse than those rearing exclusively sheep or goats, which also implies that farm management requirements to accommodate both species are higher.
The results presented in this study can be easily generalized to other areas with similar climate and production conditions, although the results of DEA are related to the sample. A key limitation, however, is that information about the quality characteristics of the pastures that each farm grazes has not been considered; therefore, no in-depth analysis can be supported. In addition, milk yields are definitely affected by the quality of rangelands and the provision of additional feed, but this sensitivity is not examined at the farm level. Nevertheless, this is a study at the local level which provides insights regarding the role of grazing in the economic sustainability of farms. More detailed analysis could be supported by GIS data, but this would require data about the actual areas grazed by each farm, which is difficult to be obtained in this transitional period, before the delivery of the IGMPs.
It is expected that after IGMPs are implemented, farmers will have a clearer image and better motivation to use pastures. In addition, more specific support will be provided to farmers—based on realistic scientific data—and pastures will play a more important role in the operation and economic performance of farms. In this context, the environmental role that extensive farms play—including the provision of ecosystem services—should be more explicitly recognized in the CAP framework by introducing specific support schemes for environmental services (either income support or structural, in the forthcoming RDP 2021–2027). Apart from that, some other basic domains that require interventions, as highlighted by this study, involve infrastructure for accessibility of pastures (e.g., roads and paths) that would reduce the necessary time to reach them; innovations relating to flock management which will facilitate the use of pastures (electric fences, pasture improvement, new management options); as well as training and information for farmers who wish to systemize grazing on their farms.


 ,
, 

