Abstract
Understanding the roles of natural drivers and anthropogenic activities in greenhouse gas (GHG) emissions of arable fields is crucial for adopting the most appropriate agricultural management. This study investigated the effect of two tillage treatments of mouldboard ploughing (MP) and no-tillage (NT), and the environmental factors (soil water content and temperature, carbon content and nitrogen forms) on soil carbon dioxide (CO2) and nitrous oxide (N2O) emissions. The research was conducted on chernozem soil under winter wheat cultivation. Besides field monitoring, several laboratory experiments took place to examine the effects of environmental drivers and fertilization management on soil GHG emissions. We observed no significant difference between the CO2 emission of MP and NT during a full year period. Nevertheless, significant differences were found in the sub-periods (more particularly during vegetation and then after harvest). NT had higher CO2 emission than MP in all laboratory experiments (p < 0.001) and in the after harvest period of the field trial, measured on bare soil (p < 0.0001). NT had significantly higher N2O emission both under laboratory (p < 0.0001) and field conditions (p < 0.0081). Different fertilization showed no distinguishable effect on N2O emission in the laboratory. This study confirms that N2O emission of the arable field depended more on soil water content than soil temperature, and vice-versa for CO2 emission.
1. Introduction
Although the importance of carbon dioxide (CO2) in climate change is well known, it remains in the focus of research interest due to its role in the biosphere and the global ecosystem. More recently however the function of nitrous oxide (N2O) emission appears as a new challenge despite the fact that N2O has minor concentration in the atmosphere compared to CO2. Nonetheless, it is a more potent greenhouse gas (GHG) having 310 times higher global warming potential than CO2 [1]. Moreover, N2O also contributes to the processes of ozone depletion [2].
CO2 has many natural (respiration of biosphere, soils and wetlands, volcanic eruptions) and anthropogenic sources (industry, fossil fuel combustion, transportation, agriculture), as well as natural sinks (forests and oceans) [3]. N2O emission might originate from natural sources such as different microbial processes of soils and wetlands, lightning in the troposphere or anthropogenic sources like industry and agriculture, fuel and biomass combustion. There are a number of natural sinks of N2O, like photochemical processes in the stratosphere [3].
Soil CO2 emission has several natural drivers, such as soil temperature (Ts), soil water content (SWC), soil carbon content (TC) and biosphere (e.g., root respiration, micro, mezzo and macro fauna) [4]. N2O emission of soils is mainly governed by soil climate like SWC, Ts, soil chemistry and microbial processes such as nitrification or denitrification. N2O emission has great temporal and spatial variability [5], thus its measurement is more uncertain than that of CO2 emission that usually has well-defined annual patterns [6]. N2O emission variations can be examined especially after heavy rain events or during long-lasting wet periods and after thaws [7]. There are contradictions and gaps in our recent knowledge on this topic [8], hence further research should specify the effect of different environmental factors such as SWC and Ts on soil CO2 and N2O emission. Elevated Ts and SWC might influence soil carbon and nitrogen cycle via microbiological processes, thus higher CO2 and N2O emissions can occur under such circumstances [9,10,11]. High SWC is regarded as a facilitating factor of elevated N2O emissions, although increased emissions do not necessarily occur under high moisture circumstances [12]. After fertilization, immense rainfalls can induce N2O emission peaks [12]. Therefore, nutrient supply combined with precipitation might affect N2O emission. Although during winter and spring thaws elevated N2O emissions are probable [12,13] they do not necessarily occur: fertilization and available nitrogen sources also influence this phenomenon [12]. Besides N2O emissions, CO2 emission peaks can be also observed during fall and winter thaws [13]. It is important to note, however, that N2O fluxes depend more on air and soil surface (5 cm depth) temperature than on deeper soil (25 cm depth) temperature during thaw events, while CO2 fluxes have similar temperature dependency at both surface and sub-surface layers [13].
GHG emissions induced by agricultural production participate with 10–12% of global anthropogenic GHG emission [14], which compels scientists to investigate this topic in specific soil and environmental conditions. Agricultural activities like soil management (e.g., tillage or fertilization practices) affect CO2 and N2O emissions [15,16,17] but contradictions prevail regarding the effect of tillage and minimum or no-tillage practices on GHG emissions of soils. The effects of different tillage methods on CO2 emission are highly dependent on the timing of measurements. CO2 emission measurements performed just after tillage operation show much higher values in the ploughing plots than in the no-tilled ones [18], as aeration provides optimal conditions for more intensive microbial activities. By contrast, the changes in CO2 emissions, affected by different tillage methods, are not so evident on the long-term scale. Most of the experiments regarding the long-term effect of ploughing on soil GHG emission compares the collected data to no tillage or reduced tillage findings. Some studies report higher CO2 emission in ploughing [19,20,21,22], while others find higher emission in reduced or no-tillage treatments [23,24,25]. Still others do not report significant differences in the emission of conventional and no-tillage treatments [26,27]. Several investigations report higher N2O emissions for minimum or no-tillage treatments compared to tilled fields [20,25,26,28,29,30], while other studies conclude with opposite findings [21,31,32,33], or report no significant differences [34]. Mineral [35,36,37,38] and organic fertilizer [36,37,38,39] management influences CO2 and N2O emission of arable fields, especially in a couple of days after fertilizer application. Fertilization affects soil parameters such as SWC, microbial community, and soil nutrient contents. Available C and N forms, and the C/N ratio are key factors of GHG emissions. The application of organic and mixed (organic and mineral) fertilizer treatments can result in a higher CO2 emission of soils [40]. At the same time the effects of nitrogen-based fertilizers without organic matter addition on soil emissions are not evident, since they can reduce CO2 emission on a long term [41]. Mineral fertilizers might enhance N2O emission in the short- term, but organic treatments might enhance emissions in the long-term [42]. Even the type of nitrogen fertilizer influences N2O production, as the emissions tend to be higher after NH4+-based mineral fertilizer treatments than after NO3− based ones [43].
Due to incomplete knowledge about N2O emissions of soils, based on works in both field and laboratory measurements, developing or improving models can be considered as essential to fill gaps.
The aim of this study is to investigate the effects of two tillage methods—the mouldboard ploughing (MP) and the no-tillage (NT)—on CO2 and N2O emissions on a Central European arable field. We hypothesized that tillage causes differences in SWC and Ts, and this consequently manifests in differences in soil CO2 and N2O emissions. Besides field investigations, we performed several laboratory experiments to further explore the main governing factors of GHG emissions, i.e., SWC, Ts, and fertilizer amount.
2. Materials and Methods
2.1. Introduction of Field Trial
The study site is a long-term (>18 years) tillage experiment at Szent István University’s Józsefmajor Experimental and Training Farm, Heves County, Hungary (47 41′31.7′′ N 19 36′36.1′′ E, 110 m a.s.l). The soil is Endocalcic loamic chernozem [44], which is a dominant soil type in the region of the study. The climate is typical continental type with 560 mm average annual precipitation and 10.3 °C mean annual temperature. The experiment was set up in 2002 and consists of six different tillage treatments (mouldboard ploughing-(MP), no-tillage (NT), disk tillage, loosening, shallow and deep cultivation), in a randomized design. For the purpose of this study, we investigated the MP and NT treatments. Each tillage treatment had an area of 10 × 105 m in four replicates. In the experiment, crop rotation and adaptive fertilization were used annually. After harvest plant residuals were left on the surface as mulch, and straw was mixed with the soil during tillage operations. The sown crop in season 2018/2019 was winter wheat (Triticum aestivum), and the results of emission measurements of the year 2019 are introduced in this article. The management events and the applied N fertilization doses during the last 5 years of the experiment are summarized in Table 1.

Table 1.
Management events and the applied fertilization doses between 2014–2019 [45] (note: weed management is not included).
2.2. Greenhouse Gas (GHG) Emission Measurements—Laboratory Experiments
To investigate the underlying processes of GHG emissions in a more controlled environment, we set up the following three different laboratory experiments. Detailed information is presented in Table 2 and Table 3.
Table 2.
Details of the Tillage and Fertilizer soil column experiments.
Table 3.
Details of the Temperature dependency soil column experiments.
- (i)
- In the Tillage experiment we examined the effect of the two tillage methods (MP, NT) on GHG emission under constant air temperature. For the investigations, we collected samples from MP and NT treatments and one fertilizer dose of 80 kg ha−1 N (MP80, NT80) was applied besides non-fertilized control (MP0, NT0). Calcium ammonium nitrate (CAN) was used as fertilizer. SWC was constant in the first part of the experiment and then columns were left to air dry, which enabled us to study the SWC-dependency of GHG emission.
- (ii)
- In the Fertilizer experiment we examined the effect of different fertilizer doses of 80 kg ha−1 N (MP80, NT80) and 160 kg ha−1 N (MP160, NT160) on the GHG emissions of MP and NT under constant air temperature. In the Fertilizer experiment, the initial field SWC was maintained in the first part of the experiments, then a higher SWC was used in the second part of this investigation.
- (iii)
- In the Temperature dependency experiment we investigated the effect of Ts on GHG emissions of MP and NT under two constant SWC and fertilization conditions.
The laboratory experiments were implemented by the following methodology: we collected undisturbed soil cores (d = 10.5 cm, h = 10.0 cm) from the upper 10 cm of MP and NT treatments. We inserted plastic tubes (d = 10.5 cm, h = 20.0 cm) into the soil and sealed them in the bottom after sampling. During the laboratory measurements, the top of these columns was also sealed to create an incubation chamber, which enabled us to attach these sealed chambers to a cavity ring down spectrometer (CRDS) multi-gas analyser for measuring CO2 and N2O emissions. Each experiment started after a 2-day long pre-incubation period. We maintained SWC on the initial field value for the first part of the experiment until a steady state GHG emission occurred. We did not change the initial SWC of the samples, therefore SWC was higher in NT than in MP treatment in all laboratory experiments imitating field conditions (Table 2).
The air temperature was constant (21 or 27 °C depending on the experiment) during the investigations (Table 2) except for the Ts dependency experiment, where investigations were performed at 4, 10, 20 and 30 °C (Table 3).
In all laboratory experiments, we measured GHG emissions daily during the first week, then two times weekly during the rest of the experimental duration (Figure 1).
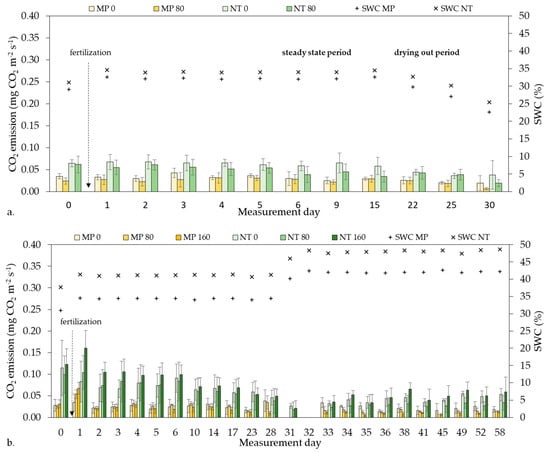
Figure 1.
The course of CO2 emission in the laboratory experiments: (a) tillage experiment and (b) fertilizer experiment. Different fertilizer doses: MP0, 80, 160; NT 0, 80, 160 kg ha−1 in mouldboard ploughing (MP) and no-tillage (NT), respectively. SWC—soil water content.
2.3. GHG Emission Measurements—Field Experiment
Regular CO2 emission measurements were performed in seven replicates from 2013 in both MP and NT treatments [46]. In addition, we started N2O measurements in 2019. For the present study we selected the whole year dataset for CO2 including vegetation and after-harvest period and a half-year dataset for N2O emission including the after-harvest period (Table 4). We implemented CO2 measurements weekly and N2O measurements on a weekly to monthly basis with 7 (CO2) and 3 (N2O) replicates per treatment. To determine GHG emissions, we applied two in situ gas analysers, an infrared gas analyser (IR) for CO2 emission and a CRDS multi gas analyser for N2O emission. The measurements by the different instruments were taken at the same time, in close vicinity. The GHG measurements were based on the dynamic chamber method [47,48,49], where chambers were not automatic but were placed manually. We set the incubation time of the chambers to 2 and 15 min for CO2 and N2O, respectively. GHG fluxes were calculated by quadratic (CO2) and linear (N2O) estimations. To investigate the environmental drivers of GHG emissions, we monitored SWC, Ts at every GHG measurement points. Sampling strategy and basic environmental parameters are presented in Table 4.
Table 4.
Sampling strategy and basic environmental parameters of the field experiment with small letters indicating significant differences between soil water content (SWC) of the treatments. Tillage treatments: MP: mouldboard ploughing, NT: no-tillage. Ts—soil temperature.
2.4. Instrumentation
We used an EGM-5 (PPSYSTEMS, U.S.) in situ IR gas-analyser to determine CO2 emissions and a PICARRO G2508 CRDS multi-gas analyser (PICARRO, U.S.) to determine N2O emission of the field trial. We also used the PICARRO G2508 to determine CO2 and N2O emissions during all laboratory experiments.
The measurement accuracy of EGM-5 was <1% of reference gas and the measurement range was 0–5000 ppm. In the case of the PICARRO G2508, the accuracy for raw non-smoothed data was ±600 ppb for CO2 and ±25 ppb for N2O. The guaranteed range was 380–5000 ppm for CO2 and 0.3–200 ppm for N2O.
In the field experiment we also measured the volumetric SWC of the upper 10 cm of each GHG measurement points by CAMPBELL SCIENTIFIC HYDROSENSE II SWC probe with an accuracy of 3% and a resolution of <0.05%. We determined Ts with PPSYSTEMS STP-2 soil temperature probe, which was attached to the EGM5 analyser with an accuracy of ±0.3 °C at 25 °C. In the laboratory experiments, we calculated volumetric SWC from gravimetric SWC of each sample at the end of the experiments.
The leaf area index (LAI) of winter wheat were measured by an ACCUPAR LP80 ceptometer (METERGROUP, U.S.) during ear emergence and flowering phenological phases, which refer to GS59 and GS61 in the Zadoks decimal code system, respectively [50,51]
2.5. Soil Chemical and Physical Analyses
We collected soil samples from the upper 10 cm at all N2O emission measurement times to determine the total nitrogen (Ntot), total carbon (TC), NH4+-N, and NO3−-N contents of the samples by wet chemical analyses [52]. We determined the same chemical parameters from the soil columns used in the laboratory experiments by the same methods at the end of the experiments. Sample numbers of the field experiment were 19 and 26 in total (over the after-harvest period) for MP and NT, respectively. Sample numbers of laboratory experiments’ chemical parameters can be seen in Table 2 and Table 3.
For the physical analysis, we collected three undisturbed soil cores (100 cm3) from the upper 5–10 cm layer of MP and NT. We dried the soil cores at 105 °C for 24 h, and we measured the dry weight of the samples to calculate bulk density [53].
2.6. Data Handling and Statistical Analyses
Negative CO2 flux data of field measurements provided by the EGM analyser were omitted because we considered these occasions to be caused by chamber failures. Negative fluxes of CO2 are a matter of debate in the scientific discussion. Negative CO2 fluxes are more probable in specific areas like deserts [54], non-vegetated arid lands [55], highly alkaline soils under dry conditions [56], coastal peatlands [57], or estuary wetlands [58] than in the case of continental type arable field during summer and early fall. We used the 5 min smoothed dataset of N2O concentrations provided by the PICARRO analyser in order to eliminate the high variance of the raw concentration curve. Negative N2O fluxes were considered as zero fluxes. Arable fields can be a sink of N2O from the atmosphere under certain circumstances [59], but in our case these negative values converged to zero well, and they were below measurement uncertainty.
For the basic statistical analysis, we used GraphPad Prism version 8.4.3 for Windows, (GraphPad Software, San Diego, California U.S.). We determined the distribution of the datasets with a D’Agostino and Pearson test. We applied all data from the replicates instead of daily mean values of GHG emission, SWC and chemical comparison of laboratory and field investigations. Based on the dataset distribution we used different statistical analyses, which are presented in Table 5.
Table 5.
Statistical analysis of the different experiments. ANOVA refers to analysis of variance.
We used Pearson’s correlation to find relationships of GHG emission and environmental parameters. We interpreted correlations according to Schober et al. [60].
3. Results
3.1. GHG Emissions of Laboratory Experiments
3.1.1. CO2 Emission
In general, under laboratory conditions, NT had higher mean CO2 emissions than MP in all experiments (Table 6). In the Tillage experiment the difference between CO2 emissions of MP0 and NT0 was significant (p < 0.0001) and it was significant between MP80 and NT80 (p < 0.0001) as well. Fertilization significantly reduced CO2 emission both in the MP80 (p = 0.0245) and NT80 treatments (p < 0.0067) compared to non-fertilized controls (MP0 and NT0, respectively).
Table 6.
Mean CO2 emission (± SD) of soil column experiments.
Similar to the findings of the Tillage experiments, NT0, NT80, NT160 had significantly higher mean CO2 emissions than MP0, MP80, MP160 (p < 0.0001) in the Fertilizer experiment. However, none of the fertilizer doses had significant effect on the CO2 emission, in MP80 (p > 0.9999); MP 160 (p = 0.1747) compared to MP0; or in NT80 (p = 0.1083), NT160 (p > 0.9999) compared to NT0, but there was a significant difference between NT80 and NT160 (p = 0.0009)
Mean CO2 emissions of NT varied in all laboratory experiments, while the mean CO2 emissions of MP had only minor variability, thus the emission of MP was more stable (Table 6).
Treatments had a decreasing trend of CO2 emission over time in the laboratory experiments, which was steeper in the case of NT compared to MP, especially in the Fertilizer experiment (Figure 1).
3.1.2. N2O Emission
We found similar tendencies in the case of N2O emission as for the CO2 data, the mean N2O emission of NT was higher than of MP in all laboratory experiments (Table 7).
Table 7.
Mean N2O emission (± SD) of laboratory experiments. Small letters indicate significant differences between treatments, within each experiment. Different fertilizer doses: MP 0, 80, 160; NT 0, 80, 160 kg ha−1 in mouldboard ploughing (MP) and no-tillage (NT), respectively. (Sample numbers are presented in Table 2).
In the Tillage experiment, N2O emission was significantly higher (p < 0.0001) in NT compared to MP treatments regardless of the fertilization doses (Table 7). The 80 kg ha−1 fertilizer dose had a significant effect (p = 0.0028) on N2O emission of MP80 compared to MP0, however, it had a non-significant effect (p > 0.9999) in NT80 compared to NT0 (Table 7).
In the Fertilizer experiment NT0, NT80, NT160 had a significantly higher (p < 0.0001) N2O emission than MP0, MP80, and MP160 regardless of fertilization doses. The N2O emissions had a nonlinear response to the different fertilizer rates in NT, where NT160 showed the highest mean N2O emission. There were significant differences between the mean N2O emission of NT0 and NT80 (p = 0.0065) and between NT0 and NT160 (p < 0.0001). Nevertheless, the difference was not significant between NT80 and NT160 (p > 0.9999) (Table 7). There was no significant effect of fertilizer additions on N2O emission for MP treatments (p > 0.0523) (Table 7).
The temporal course of the N2O emissions showed similarities both in the Tillage and Fertilizer experiments (Figure 2). After fertilization, N2O emissions peaked in the first week, then there were declining trends in all experiments while the SWC and Ts were constant. The N2O emissions reached a steady-state after one week (Figure 2), then decreased during the drying out period (Figure 2a).
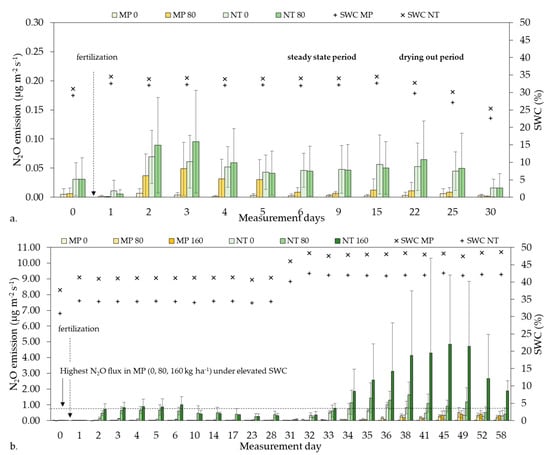
Figure 2.
N2O emission and soil water content (SWC) in (a) Tillage experiment and (b) in Fertilizer experiment. Different fertilizer doses: MP 0, 80, 160; NT 0, 80, 160 kg ha−1 in mouldboard ploughing (MP) and no-tillage (NT), respectively.
After N2O emission got constant, we increased the SWC of the treatments from 33.5 ± 1.0 to 40.9 ± 2.0 (avg. MP) and from 40.3 ± 0.6 to 47.7 ± 0.9 (avg. NT) during the second part of the Fertilizer experiment (Figure 2b). The N2O emission was significantly higher under elevated SWC compared to initial SWC in all treatments (p < 0.0103). Still, elevated N2O emissions of MP did not reach the highest emission of any measured N2O values in the NT treatments under initial SWC, even when the SWC of MP was on the same level (Figure 2b).
3.2. Environmental Governing Factors of GHG Emissions in Laboratory Experiments
We set a T dependency experiment under initial (field) SWC (33.9 ± 0.4 % in MP0, 39.6 ± 0.3 % in NT0), high SWC (43.3 ± 0.4 % in MP0 and 46.7 ± 0.4 in NT0), and high SWC combined with fertilization (44.5 ± 0.5 % in MP80 and 47.6 ± 0.6 % in NT80; Table 3).
CO2 emissions of MP and NT treatments highly depended on Ts in laboratory experiments, although the correlations were not significant in all cases (Table 8). Correlation between CO2 emission and Ts was strong in all cases but not always significant.
Table 8.
Correlation and significance * of Ts and greenhouse gas (GHG) emissions; r2 and p-values are indicated (Sample numbers are presented in Table 3).
The N2O emissions showed moderate to strong dependency on Ts with significance only in two cases (Table 8).
The SWC of the MP and NT treatments were also different during all laboratory experiments (Table 2 and Table 3), due to the initial field conditions of the treatments. In the Tillage experiment NT had a significantly higher SWC than MP regardless of fertilization (p < 0.0001 both in 0 and 80 kg ha−1).
We could observe similar trends in the Fertilizer experiment as NT treatments (NT0, NT80, NT160) had significantly higher SWC than MP treatments (MP0, MP80, MP160) regardless of fertilization (p < 0.0001 in all treatments). In contrast with tillage, fertilization had no significant effect on SWC neither in MP nor in NT in any experiments (p > 0.9999) (Table 2).
We examined the SWC dependency of GHG emissions in the second, shorter drying out period, after reaching the steady-state GHG emission phase in the Tillage experiments. The SWC dependency of CO2 emission was strong in MP0 (r2 = 0.89, p = 0.0589) and very strong and significant in MP80 (r2 = 0.99, p = 0.0020). Both control and fertilized samples of NT had moderate correlation with SWC (r2 = 0.60, p = 0.2277 in NT0; r2 = 0.58, p = 0.2360 in NT80).
Investigating the SWC dependency of N2O emission in the Tillage experiment, MP80 and NT0 samples showed very strong and significant SWC dependency (r2 = 0.93, p = 0.0344 and r2 = 0.95, p = 0.0278, respectively). The N2O emission of NT80 had a strong, but not significant correlation with SWC (r2 = 0.74, p = 0.1418) and MP0 had weak N2O emission during the whole measurement period, thus SWC dependency could not be interpreted (r2 = 0.03, p = 0.8354).
3.3. Soil Chemical Parameters of Laboratory Experiments
The main soil chemical parameters are provided in Table 9 for all laboratory experiments. Regardless of fertilization rate, all NT treatments had significantly higher Ntot content as compared to all MP treatments in the Tillage (p < 0.0137), Fertilizer (p < 0.0001) and Temperature dependency (p < 0.0079) experiments.
Table 9.
Soil chemical parameters of the laboratory experiments.
In the Tillage experiment NT0 and NT80 had significantly higher NH4+ contents than MP0 (p = 0.0004 and p = 0.0047, respectively), or MP80 (p = 0.0031 and p = 0.0374, respectively). Fertilization had no effect on NH4+ contents in MP (p = 0.7332) or NT (p = 0.6120) treatments. In the Fertilizer experiment NT0, NT80, NT160 and MP160 treatments had significantly higher NH4+ contents compared to MP0 (p < 0.0250) and MP80 (p < 0.0026), and there was no significant difference between the NH4+ content of MP0 and MP80 (p = 0.9979). NH4+ content of NT treatments was not significant as compared to each other (p > 0.8478). Significantly higher NH4+ of NT80 compared to MP80 was observed in the Temperature dependency experiment (p = 0.0079; Table 9).
In the Tillage experiment there were no significant differences between the NO3− content of MP0 and MP80 (p = 0.7595) and between NT0 and NT80 (p = 0.7590), while the differences were significant between MP0 and NT0 (p = 0.0277) and between MP80 and NT80 (p = 0.0276). In the Fertilizer experiment there were significant differences (p < 0.0233) between the NO3− content of all of the fertilizer doses in MP. In NT there was no significant difference (p > 0.9999) in the NO3− content of NT0 and NT80, although these fertilizer treatments significantly differed from NT160 (p = 0.0183 and p = 0.0095, respectively). There was a significant difference between the NO3− content of MP and NT treatments (p = 0.0211) only under 160 kg ha−1 fertilization. In the Temperature dependency experiment there were no significant differences between the NO3− content of the two (MP80 and NT80) treatments (p = 0.1508; Table 9).
3.4. GHG Emissions of Field Experiment
The annual course of CO2 emission showed an increasing trend in the first part of the vegetation period until the end of May, then decreased during ripening till harvest in both MP and NT treatments. A secondary emission peak occurred in the after-harvest period with a decline in fall and winter (Figure 3a).
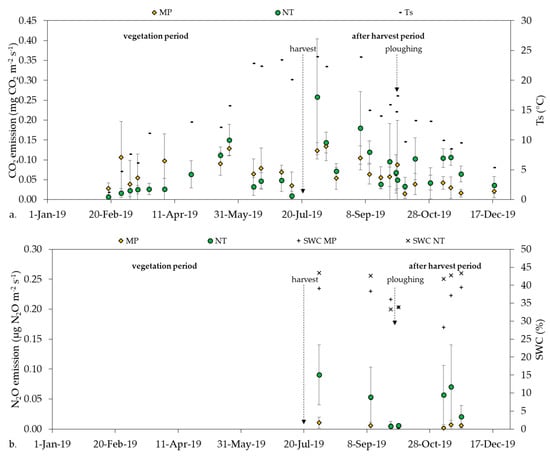
Figure 3.
(a) The annual course of CO2 emission with soil temperature (Ts) and (b) half-year course of N2O with soil water content (SWC).
The whole year investigation period was divided into two sub-periods: vegetation period, and after harvest period with no vegetation (Figure 3, Table 4). In the NT treatment, the after harvest period had a significantly higher mean CO2 emission than the vegetation period (p < 0.0001) or the whole year period (p = 0.0080). Regarding MP none of the three investigated periods had significant differences as compared to each other (p = 0.4778), thus MP showed a more balanced CO2 emission (Table 10).
Table 10.
Mean values of GHG emissions divided into different periods. Small letters indicate significant differences between the different periods within a treatment. Tillage treatments: MP: mouldboard ploughing, NT: no-tillage. (Sample numbers are presented in Table 4).
NT had a slightly higher mean CO2 emission than MP during the whole year period, but the difference was not significant (p = 0.3933). During the vegetation period (from 18/02/19 to 01/08/19) MP had significantly higher mean CO2 emission than NT (p = 0.0028). In the after harvest period, where plant and root activity did not prevail, NT had a significantly higher CO2 emission than MP (p < 0.0001) (Table 11).
Table 11.
Mean values of GHG emissions divided into different periods.
N2O emission data were collected from the after harvest period only, where there was no vegetation on the selected parcels. Our data showed that N2O emission had a non-specific temporal trend on the investigated arable field (Figure 3b). Both the temporal variability of N2O emission and the deviation of the measurement points were higher in NT than in MP (Figure 3b). Mean N2O emission was significantly higher (p = 0.0081) in NT than in MP treatment (Table 11).
3.5. Environmental Governing Factors of GHG Emissions in Field Experiment
Regarding the whole year period, the correlation between Ts and CO2 emission was weak but significant (r2 = 0.27, p = 0.0043 in MP and r2 = 0.25 p = 0.0067 in NT (Table 12)), while during the vegetation period, the correlations were weak and non-significant (r2 = 0.002, p = 0.6418 in MP and r2 = 0.006, p = 0.4277 in NT). CO2 emission significantly correlated with Ts (r2 = 0.89, p < 0.0001 in MP and r2 = 0.45, p = 0.0018 in NT) in each treatment after harvest. N2O emission of MP slightly depended on Ts during the after harvest period. There was weak and not significant correlation between Ts and N2O emission in MP (r2 = 0.30; p = 0.1995) and no correlation in NT (r2 = 0.03; p = 0.6984).
Table 12.
Environmental drivers of GHG emission and its significance*. r2 values are indicated. Tillage treatments: MP: mouldboard ploughing, NT: no-tillage. (Sample numbers are presented in Table 3).
According to the collected data of the field experiment SWC of NT was significantly higher than in MP (p = 0.0020; Table 4). Bulk density of NT was also slightly higher than MP with 1.6 ± 0.0 and 1.5 ± 0.0 g cm−3, respectively. We could not observe any correlation between the SWC and the CO2 emission during the after harvest period (r2 = 0.00, p = 0.9044) in MP and (r2 = 0.02, p = 0.7134) in NT.
N2O emission showed high dependency on SWC of the field trial. Correlation was strong and significant in both tillage treatments (r2 = 0.83, p = 0.0347 in MP and r2 = 0.82, p = 0.0399 in NT; Table 12).
3.6. Soil Chemical Parameters of the Field Experiment
During the after-harvest period of the field experiment, we collected soil samples every N2O measurement day from all sampling points. The mean soil chemical parameters of the treatments are summarized in Table 13.
Table 13.
Mean values of soil chemical parameters of the field experiment.
In the field experiment NT had significantly higher mean Ntot (p < 0.0001), NH4+-N (p = 0.0330), NO3−-N (p = 0.0030), and TC (p < 0.0001) content than MP treatment.
3.7. Plant Parameters—Field Experiment
According to the background data of the crop, winter wheat had a higher LAI in MP, than in NT during ear emergence (205 days after sowing). The maximum green LAI occurred 236 days after sowing. Winter wheat also had a higher LAI in MP than in NT. Yield, straw, and root data collected at harvest showed higher vegetation biomass in MP as compared to NT (Table 14).
Table 14.
Vegetation parameters collected after harvest in moldboard ploughing (MP) and no-tillage (NT) treatments.
4. Discussion
4.1. GHG Emissions Affected by Tillage and Fertilization
NT had significantly higher CO2 emission than MP, not only in all laboratory experiments involving bare soil, but also in field conditions in the after harvest period. The higher TC content in the upper layer of NT than MP might resulted the difference in CO2 emissions [61,62,63]. We can presume the same reason in the case of laboratory experiments, as within a tillage treatment TC content varies on the scale of a decade rather than annually [64,65].
As a contrast, MP had significantly higher CO2 emission as compared to NT in the vegetation period. Based on the literature, root respiration is one of the major factors of soil CO2 emission [66], but its contribution to total soil CO2 emission has a diurnal and seasonal variability. The root respiration/total CO2 emission ratio is the highest in vegetation season and strongly correlates with LAI [67]. In our experiment, MP had higher LAI than NT in the vegetation period, thus the presence of winter wheat can be a partial explanation of the significantly higher CO2 emission of MP than NT over this period. Root biomass data from our field trial also support this assumption.
Our finding regarding the non-significant difference in CO2 emission of MP and NT during the whole year period coincides with an experiment conducted on a Stagnosol, which also reported similar results of these two tillage methods under winter wheat cultivation [68]. In the arable field investigated in this article, the presence of winter wheat caused higher CO2 emission of MP than in NT during the vegetation period. In the after harvest period, the higher TC content of NT than MP might explain higher CO2 emission, while the effect of vegetation and soil chemistry balanced out each other during the whole year.
Similar to our finding, in a continuous maize cropping system, in the long term no-tillage was found to have significantly lower CO2 emission as compared to conventional tillage during the vegetation period [69]. Although several studies report that conventional practices like ploughing promote soil CO2 emission as compared to no-tillage or reduced tillage techniques during one or a number of seasons [24,25,26,27], other reports present opposite findings [28,29,30]. The contradiction might be due to differences in the experimental conditions such as soil types, vegetation, tillage practices, or weather conditions [70].
Similar to CO2 emission, NT had significantly higher mean N2O emission than MP both in the laboratory experiments and in the after harvest period of the field trial. The significantly higher Ntot, NH4+ and NO3− content of NT than MP can be an explanatory factor of higher N2O emission. Bhatia et al. [71] also report higher N content and N2O emission of no-tillage as compared to conventional tillage. Higher N2O emissions in NT are also supported by studies based on field experiments under winter wheat cultivation reporting that soils under no-tillage emit more N2O than conventional tillage treatments [71,72,73,74]. Nevertheless, some other studies observed that soils under no-tillage application tend to emit less N2O than soils under a conventional tillage method [27,75,76,77]. Shakoor et al.’s [78] meta-analyses reported that no-tillage or reduced tillage treatments tend to have higher CO2 and N2O emissions as compared to conventional tillage, while Feng et al.’s [79] meta-analysis reported opposite findings. Overall, contradictory results prevail in the scientific literature about the tillage effects on soil GHG emissions, thus further investigations are required.
Differences in tillage treatments change several soil conditions, thus the amount of GHG emitted from the soils also varies. Based on a field trial conducted by Bessou et al. [80] compacted and less aerated soils enhance N2O emission. Generally, there are differences between the bulk density of soils in tillage and reduced or no-tillage treatments [81,82]. In the NT treatment of our field trial, SWC was significantly higher than in MP, moreover the bulk density of this treatment was also slightly higher than in MP. Available historical data from this field trial also show that NT has usually higher bulk density than MP [46]. In a synthetic work of Rochette [83] based on 25 field studies, no-tillage was found to have higher N2O emission as compared to tilled treatment in the case of poorly-aerated soils, and it had a neutral effect on N2O emission in medium and well-aerated soils. Thus it seems that soil compaction and SWC are key factors regarding N2O emission in different soil types and tillage methods. NT soils from our laboratory experiments are expected to be less aerated due to significantly higher SWC. Besides nitrogen contents this higher SWC of NT could cause an increase in N2O emission.
According to our laboratory results MP had significantly lower N2O emission than NT even under a similar level of SWC. On the one hand, the presence of nitrifiers and denitrifiers and their ratio [84] in the investigated tillage treatments might be different, resulting in the measured variances of N2O emissions. On the other hand, NT is more compacted even under the same SWC, thus it is less aerated than MP inducing higher N2O emissions [85,86].
We could not identify clear patterns regarding the connection between the effect of fertilization on MP and NT treatments of laboratory experiment. Fertilizer doses had no effect in many cases. Similar to our findings, van Groenigen et al. [87] reported non linearity of soil N2O emission regarding different N application on sandy and clay soils under maize cultivation, indicating that N2O emissions are strongly dependent on soil and fertilizer types. The authors found that there were no significant differences between N2O emissions of the treatments in the case of different mineral fertilizer dose applications on clay soil but they were significant on sandy soil. According to another model estimation of Grant et al. [88], N2O emission of soils had also a non-linear relationship with fertilizer application in temperate, humid climate, and former fertilizations over previous years were also contributing factors of soil nitrogen stocks and N2O emission.
It is our conclusion that the differences between the GHG emissions of the two tillage methods can be altered by soil types, weather and soil conditions, crop cultivation, the propagation of the vegetation, and the combination of these factors.
4.2. GHG Emissions Affected by Soil Temperature (Ts) and Soil Water Content (SWC)
Our study confirms—concurrently with other works [89,90]—that Ts is among the main governing factors of soil CO2 emission. CO2 emission of MP and NT showed very strong correlation with Ts in our laboratory experiment. This correlation was strong in MP and it was moderate in NT during the after harvest period of the field experiment. We have found that the CO2 emission of MP was more dependent on Ts than the emission of NT. Similar to our results, Reth et al. [91] report stronger correlation of CO2 emission with Ts in the laboratory than in the field environment.
In the analysis of the vegetation and the whole year period, the CO2 dependence on Ts was reduced. Horák et al. [92] also reported different Ts dependencies of CO2 emission in sub-periods, although they found higher correlations during the beginning of the vegetation period than in the post-harvest period. The presence of vegetation might have an overwriting effect on environmental drivers in our study. We found a similar correlation for the whole year in the same field experiment in 2015 when also winter wheat was cultivated [46].
SWC dependency of CO2 emissions was moderate to strong in the laboratory and it was minor in field conditions. Reth et al. [91] reported that the effect of SWC on CO2 emissions of soils largely depended on land use, although, it was less pronounced than the effect of Ts. According to Schaufler et al. [89], SWC dependency of CO2 emission is not linear or exponential, but there is an optimal interval. The authors found that the highest CO2 emission occurred at medium SWC. Schaufler et al. [89] also claim that N2O emission can be better described by SWC than Ts under field circumstances, which confirms the results obtained in our experiment.
The dependency of N2O emission on Ts was moderate to strong in laboratory and minor under field conditions. In the field experiment the main driver of N2O emission was rather SWC than Ts, which was very strong in both MP and NT.
Based on our results, the correlation of environmental parameters and GHG emission can be more precisely examined under laboratory circumstances.
5. Conclusions
Tillage (NT and MP treatments) have significant implications on SWC and soil chemistry. The presence of vegetation (winter wheat) substantially elevated CO2 emission on MP as compared to NT during the vegetation period. After the harvest, CO2 emission became significantly higher in NT in comparison with MP, very likely due to the initially higher soil carbon content of NT.
The significantly higher N2O emission in NT as compared to MP is most probably the result of the different SWC, aeration and different initial chemical characteristics of the tillage treatments after performing 16 years of the same tillage methods. Tillage proved to have a higher effect on GHG emissions than fertilization practices.
Considering our overall data, NT emitted more CO2 on the chernozem than MP, but the presence of vegetation had a stronger effect on CO2 emissions than tillage practices. Higher N2O emission can be expected in the case of extremely high SWC (heavy rainfalls and thaws) in this arable field, especially for the NT treatment.
Author Contributions
Conceptualization, E.T. and M.D.; methodology, E.T. and M.D.; validation, M.D.; formal analysis, M.D.; investigation, Á.H., E.T. and M.D.; resources, E.T.; data curation, E.T. and M.D.; writing—original draft preparation, M.D.; writing—review and editing, Á.H., E.T., I.B., and M.D.; visualization, M.D.; supervision, E.T.; project administration, E.T.; funding acquisition, E.T. All authors have read and agreed to the published version of the manuscript.
Funding
This research was funded by the Hungarian National Research Fund, project numbers NKFI/OTKA PD-116084, FK-131792 and 2018-2.1.12-TÉT-HR-2018-00007. The research was supported by the Hungarian Government (GINOP-2.3.2-15-2016-00028) and the Ministry of Agriculture (MgF/272-1/2018 and AGMF/61/2019).
Data Availability Statement
Data sharing is not applicable to this article.
Acknowledgments
The authors would like to thank Márta Birkás and Igor Dekemati for providing help with our field experiment.
Conflicts of Interest
The authors declare no conflict of interest.
References
- Trogler, W.C. Physical properties and mechanisms of formation of nitrous oxide. Coord. Chem. Rev. 1999, 187, 303–327. [Google Scholar] [CrossRef]
- Portmann, R.W.; Daniel, J.S.; Ravishankara, A.R. Stratospheric ozone depletion due to nitrous oxide: Influences of other gases. Philos. Trans. R. Soc. B: Biol. Sci. 2012, 367, 1256–1264. [Google Scholar] [CrossRef]
- Change, I.C. The Physical Science Basis. Contribution of Working Group I to the Fifth Assessment Report of the Intergovernmental Panel on Climate Change; Cambridge University Press: New York, NY, USA, 2013; p. 1535. [Google Scholar]
- Hursh, A.; Ballantyne, A.; Cooper, L.; Maneta, M.; Kimball, J.; Watts, J. The sensitivity of soil respiration to soil temperature, moisture, and carbon supply at the global scale. Glob. Chang. Biol. 2017, 23, 2090–2103. [Google Scholar] [CrossRef]
- Hénault, C.; Grossel, A.; Mary, B.; Roussel, M.; Léonard, J. Nitrous Oxide Emission by Agricultural Soils: A Review of Spatial and Temporal Variability for Mitigation. Pedosphere 2012, 22, 426–433. [Google Scholar] [CrossRef]
- Raich, J.W.; Potter, C. Global patterns of carbon dioxide emissions from soils. Glob. Biogeochem. Cycles 1995, 9, 23–36. [Google Scholar] [CrossRef]
- Kim, D.-G.; Vargas, R.; Bondlamberty, B.; Turetsky, M.R. Effects of soil rewetting and thawing on soil gas fluxes: A review of current literature and suggestions for future research. Biogeosciences 2012, 9, 2459–2483. [Google Scholar] [CrossRef]
- Butterbachbahl, K.; Baggs, E.M.; Dannenmann, M.; Kiese, R.; Zechmeister-Boltenstern, S. Nitrous oxide emissions from soils: How well do we understand the processes and their controls? Philos. Trans. R. Soc. B: Biol. Sci. 2013, 368, 20130122. [Google Scholar] [CrossRef]
- Jianwen, Z.; Huang, Y.; Lianggang, Z.; Xunhua, Z.; Yuesi, W. Carbon dioxide, methane, and nitrous oxide emissions from a rice-wheat rotation as affected by crop residue incorporation and temperature. Adv. Atmospheric Sci. 2004, 21, 691–698. [Google Scholar] [CrossRef]
- Chatterjee, A.; Jenerette, G. Changes in soil respiration Q10 during drying–rewetting along a semi-arid elevation gradient. Geoderma 2011, 163, 171–177. [Google Scholar] [CrossRef]
- Liang, L.L.; Grantz, D.A.; Jenerette, G.D. Multivariate regulation of soil CO2 and N2O pulse emissions from agricultural soils. Glob. Chang. Biol. 2016, 22, 1286–1298. [Google Scholar] [CrossRef]
- Westphal, M.; Tenuta, M.; Entz, M.H. Nitrous oxide emissions with organic crop production depends on fall soil moisture. Agric. Ecosyst. Environ. 2018, 254, 41–49. [Google Scholar] [CrossRef]
- Furon, A.C.; Wagner-Riddle, C.; Smith, C.R.; Warland, J.S. Wavelet analysis of wintertime and spring thaw CO2 and N2O fluxes from agricultural fields. Agric. For. Meteorol. 2008, 148, 1305–1317. [Google Scholar] [CrossRef]
- Smith, P.; Martino, D.; Cai, Z.; Gwary, D.; Janzen, H.; Kumar, P.; McCarl, B.; Ogle, S.; O’Mara, F.; Rice, C.; et al. Agriculture. In Climate Change 2007: Mitigation; Metz, B., Davidson, O.R., Bosch, P.R., Dave, R., Meyer, L.A., Eds.; Contribution of Working Group III to the Fourth Assessment Report of the Intergovernmental Panel on Climate Change; Cambridge University Press: New York, NY, USA, 2007. [Google Scholar]
- Deng, Q.; Hui, D.; Wang, J.; Yu, C.-L.; Li, C.; Reddy, K.C.; Dennis, S. Assessing the impacts of tillage and fertilization management on nitrous oxide emissions in a cornfield using the DNDC model. J. Geophys. Res. Biogeosci. 2016, 121, 337–349. [Google Scholar] [CrossRef]
- Zurovec, O.; Sitaula, B.K.; Čustović, H.; Žurovec, J.; Dörsch, P. Effects of tillage practice on soil structure, N2O emissions and economics in cereal production under current socio-economic conditions in central Bosnia and Herzegovina. PLoS ONE 2017, 12, e0187681. [Google Scholar] [CrossRef]
- Silva, B.D.O.; Moitinho, M.R.; Santos, G.A.D.A.; Teixeira, D.D.B.; Fernandes, C.; La Scala, N. Soil CO2 emission and short-term soil pore class distribution after tillage operations. Soil Tillage Res. 2019, 186, 224–232. [Google Scholar] [CrossRef]
- Bilandžija, D.; Zgorelec, Z.; Kisic, I. Influence of tillage systems on short-term soil CO2 emissions. Hung. Geogr. Bull. 2017, 66, 29–35. [Google Scholar] [CrossRef]
- Krištof, K.; Šima, T.; Nozdrovicky, L.; Findura, P. The effect of soil tillage intensity on carbon dioxide emissions released from soil into the atmosphere. Agron. Res. 2014, 12, 115–120. [Google Scholar]
- Mangalassery, S.; Sjogersten, S.; Sparkes, D.L.; Sturrock, C.J.; Craigon, J.; Mooney, S.J. To what extent can zero tillage lead to a reduction in greenhouse gas emissions from temperate soils? Sci. Rep. 2015, 4, 4586. [Google Scholar] [CrossRef]
- Yeboah, S.; Zhang, R.; Cai, L.; Song, M.; Li, L.; Xie, J.; Luo, Z.; Wu, J.; Zhang, J. Greenhouse gas emissions in a spring wheat–field pea sequence under different tillage practices in semi-arid Northwest China. Nutr. Cycl. Agroecosystems 2016, 106, 77–91. [Google Scholar] [CrossRef]
- Huang, Y.; Ren, W.; Wang, L.; Hui, D.; Grove, J.H.; Yang, X.; Tao, B.; Goff, B. Greenhouse gas emissions and crop yield in no-tillage systems: A meta-analysis. Agric. Ecosyst. Environ. 2018, 268, 144–153. [Google Scholar] [CrossRef]
- Alvarez, R.; Russo, M.E.; Prystupa, P.; Scheiner, J.D.; Blotta, L. Soil Carbon Pools under Conventional and No-Tillage Systems in the Argentine Rolling Pampa. Agron. J. 1998, 90, 138–143. [Google Scholar] [CrossRef]
- Li, C.-F.; Zhou, D.-N.; Kou, Z.-K.; Zhang, Z.-S.; Wang, J.-P.; Cai, M.-L.; Cao, C.-G. Effects of Tillage and Nitrogen Fertilizers on CH4 and CO2 Emissions and Soil Organic Carbon in Paddy Fields of Central China. PLoS ONE 2012, 7, e34642. [Google Scholar] [CrossRef]
- Lognoul, M.; Theodorakopoulos, N.; Hiel, M.-P.; Regaert, D.; Broux, F.; Heinesch, B.; Bodson, B.; Vandenbol, M.; Aubinet, M. Impact of tillage on greenhouse gas emissions by an agricultural crop and dynamics of N2O fluxes: Insights from automated closed chamber measurements. Soil Tillage Res. 2017, 167, 80–89. [Google Scholar] [CrossRef]
- Regina, K.; Alakukku, L. Greenhouse gas fluxes in varying soils types under conventional and no-tillage practices. Soil Tillage Res. 2010, 109, 144–152. [Google Scholar] [CrossRef]
- Behnke, G.D.; Zuber, S.M.; Pittelkow, C.M.; Nafziger, E.D.; Villamil, M.B. Long-term crop rotation and tillage effects on soil greenhouse gas emissions and crop production in Illinois, USA. Agric. Ecosyst. Environ. 2018, 261, 62–70. [Google Scholar] [CrossRef]
- Ball, B.C.; Scott, A.; Parker, J.P. Field N2O, CO2 and CH4 fluxes in relation to tillage, compaction and soil quality in Scotland. Soil Tillage Res. 1999, 53, 29–39. [Google Scholar] [CrossRef]
- Almaraz, J.J.; Mabood, F.; Zhou, X.; Madramootoo, C.; Rochette, P.; Ma, B.-L.; Smith, D.L. Carbon Dioxide and Nitrous Oxide Fluxes in Corn Grown under Two Tillage Systems in Southwestern Quebec. Soil Sci. Soc. Am. J. 2009, 73, 113–119. [Google Scholar] [CrossRef]
- Yao, Z.; Zheng, X.; Wang, R.; Xie, B.; Butterbach-Bahl, K.; Zhu, J. Nitrous oxide and methane fluxes from a rice–wheat crop rotation under wheat residue incorporation and no-tillage practices. Atmospheric Environ. 2013, 79, 641–649. [Google Scholar] [CrossRef]
- Six, J.; Ogle, S.M.; Breidt, F.J.; Conant, R.T.; Mosier, A.R.; Paustian, K. The potential to mitigate global warming with no-tillage management is only realized when practised in the long term. Glob. Chang. Biol. 2004, 10, 155–160. [Google Scholar] [CrossRef]
- Yonemura, S.; Nouchi, I.; Nishimura, S.; Sakurai, G.; Togami, K.; Yagi, K. Soil respiration, N2O, and CH4 emissions from an Andisol under conventional-tillage and no-tillage cultivation for 4 years. Biol. Fertil. Soils 2014, 50, 63–74. [Google Scholar] [CrossRef]
- Zhu, X.; Chang, L.; Liu, J.; Zhou, M.; Li, J.; Gao, B.; Wu, D. Exploring the relationships between soil fauna, different tillage regimes and CO2 and N2O emissions from black soil in China. Soil Biol. Biochem. 2016, 103, 106–116. [Google Scholar] [CrossRef]
- Van Kessel, C.; Venterea, R.T.; Six, J.; Adviento-Borbe, M.A.; A Linquist, B.; Van Groenigen, K.J. Climate, duration, and N placement determine N2O emissions in reduced tillage systems: A meta-analysis. Glob. Chang. Biol. 2013, 19, 33–44. [Google Scholar] [CrossRef]
- Baggs, E.; Stevenson, M.; Pihlatie, M.; Regar, A.; Cook, H.; Cadisch, G. Nitrous oxide emissions following application of residues and fertiliser under zero and conventional tillage. Plant Soil 2003, 254, 361–370. [Google Scholar] [CrossRef]
- Dambreville, C.; Morvan, T.; Germon, J.-C. N2O emission in maize-crops fertilized with pig slurry, matured pig manure or ammonium nitrate in Brittany. Agric. Ecosyst. Environ. 2008, 123, 201–210. [Google Scholar] [CrossRef]
- Zhai, L.; Liu, H.-B.; Zhang, J.-Z.; Huang, J.; Wang, B.-R. Long-Term Application of Organic Manure and Mineral Fertilizer on N2O and CO2 Emissions in a Red Soil from Cultivated Maize-Wheat Rotation in China. Agric. Sci. China 2011, 10, 1748–1757. [Google Scholar] [CrossRef]
- Herr, C.; Mannheim, T.; Müller, T.; Ruser, R. Effect of cattle slurry application techniques on N2O and NH3 emissions from a loamy soil. J. Plant Nutr. Soil Sci. 2019, 182, 964–979. [Google Scholar] [CrossRef]
- Velthof, G.; Kuikman, P.J.; Oenema, O. Nitrous oxide emission from animal manures applied to soil under controlled conditions. Biol. Fertil. Soils 2003, 37, 221–230. [Google Scholar] [CrossRef]
- Guo, Z.; Han, J.; Li, J.; Xu, Y.; Wang, X. Effects of long-term fertilization on soil organic carbon mineralization and microbial community structure. PLoS ONE 2019, 14, e0211163. [Google Scholar] [CrossRef]
- Al-Kaisi, M.M.; Kruse, M.L.; Sawyer, J.E. Effect of Nitrogen Fertilizer Application on Growing Season Soil Carbon Dioxide Emission in a Corn-Soybean Rotation. J. Environ. Qual. 2008, 37, 325–332. [Google Scholar] [CrossRef]
- De Rosa, D.; Rowlings, D.W.; Biala, J.; Scheer, C.; Basso, B.; Grace, P.R. N2O and CO2 emissions following repeated application of organic and mineral N fertiliser from a vegetable crop rotation. Sci. Total. Environ. 2018, 813–824. [Google Scholar] [CrossRef]
- Volpi, I.; Laville, P.; Bonari, E.; O Di Nasso, N.N.; Bosco, S. Improving the management of mineral fertilizers for nitrous oxide mitigation: The effect of nitrogen fertilizer type, urease and nitrification inhibitors in two different textured soils. Geoderma 2017, 307, 181–188. [Google Scholar] [CrossRef]
- FAO. World Reference Base For Soil Resources 2014, Update 2015: International Soil Classification System For Naming Soils and Creating Legends For Soil Maps; FAO: Rome, Italy, 2015; p. 192. [Google Scholar]
- Dekemati, I.; Simon, B.; Bogunovic, I.; Kisic, I.; Kassai, K.; Kende, Z.; Birkás, M. Long term Effects of Ploughing and Conservation Tillage Methods on Earthworm Abundance and Crumb Ratio. Agronomy 2020, 10, 1552. [Google Scholar] [CrossRef]
- Tóth, E.; Gelybó, G.; Dencső, M.; Kása, I.; Birkás, M.; Horel, Á. Soil CO2 emission in a long-term tillage treatment experiment. In Soil Management and Climate Change—Effects on Organic Carbon, Nitrogen Dynamics and Greenhouse Gas Emissions; Munoz, M.A., Zornoza, R., Eds.; Academic Press: London, UK, 2018; pp. 293–308. [Google Scholar]
- Pumpanen, J.; Kolari, P.; Ilvesniemi, H.; Minkkinen, K.; Vesala, T.; Niinistö, S.M.; Lohila, A.; Larmola, T.; Morero, M.; Pihlatie, M.; et al. Comparison of different chamber techniques for measuring soil CO2 efflux. Agric. For. Meteorol. 2004, 123, 159–176. [Google Scholar] [CrossRef]
- Heinemeyer, A.; McNamara, N.P. Comparing the closed static versus the closed dynamic chamber flux methodology: Implications for soil respiration studies. Plant Soil 2011, 346, 145–151. [Google Scholar] [CrossRef]
- Diefenderfer, H.; Cullinan, V.I.; Borde, A.B.; Gunn, C.M.; Thom, R. High-frequency greenhouse gas flux measurement system detects winter storm surge effects on salt marsh. Glob. Chang. Biol. 2018, 24, 5961–5971. [Google Scholar] [CrossRef]
- Zadoks, J.C.; Chang, T.T.; Konzak, C.F. A decimal code for the growth stages of cereals. Weed Res. 1974, 14, 415–421. [Google Scholar] [CrossRef]
- Tottman, D.R. The decimal code for the growth stages of cereals, with illustrations. Ann. Appl. Biol. 1987, 110, 441–454. [Google Scholar] [CrossRef]
- Buzás, I. Methodology book for soil and agrochemical analyses; (in Hungarian). Buzás, I., Ed.; INDA 4231; Kiadó: Budapest, Hungary, 1993. [Google Scholar]
- Blake, G.R.; Hartge, K.H. Bulk Density. Methods Biogeochem. Wetl. 2018, 363–375. [Google Scholar] [CrossRef]
- Cueva, A.; Volkman, T.H.; Van Haren, J.; Troch, P.A.; Meredith, L.K. Reconciling Negative Soil CO2 Fluxes: Insights from a Large-Scale Experimental Hillslope. Soil Syst. 2019, 3, 10. [Google Scholar] [CrossRef]
- Wang, W.; Chen, X.; Pu, Z. Negative Soil Respiration Fluxes in Unneglectable Arid Regions. Pol. J. Environ. Stud. 2015, 24, 24. [Google Scholar] [CrossRef]
- Xie, J.; Li, Y.; Zhai, C.; Li, C.; Lan, Z. CO2 absorption by alkaline soils and its implication to the global carbon cycle. Environ. Earth Sci. 2009, 56, 953–961. [Google Scholar] [CrossRef]
- Windham-Myers, L.; Bergamaschi, B.; Anderson, F.; Knox, S.; Miller, R.; Fujii, R. Potential for negative emissions of greenhouse gases (CO2, CH4 and N2O) through coastal peatland re-establishment: Novel insights from high frequency flux data at meter and kilometer scales. Environ. Res. Lett. 2018, 13, 045005. [Google Scholar] [CrossRef]
- Han, G.; Xing, Q.; Luo, Y.; Rafique, R.; Yu, J.; Mikle, N. Vegetation Types Alter Soil Respiration and Its Temperature Sensitivity at the Field Scale in an Estuary Wetland. PLoS ONE 2014, 9, e91182. [Google Scholar] [CrossRef] [PubMed]
- Chapuis-Lardy, L.; Wrage, N.; Metay, A.; Chotte, J.-L.; Bernoux, M. Soils, a sink for N2O? A review. Glob. Chang. Biol. 2007, 13, 1–17. [Google Scholar] [CrossRef]
- Schober, P.; Boer, C.; Schwarte, L.A. Correlation Coefficients: Appropriate use and interpretation. Anesthesia Analg. 2018, 126, 1763–1768. [Google Scholar] [CrossRef]
- Yang, X.; Drury, C.F.; Wander, M.M.; Kay, B. Evaluating the Effect of Tillage on Carbon Sequestration Using the Minimum Detectable Difference Concept. Pedosphere 2008, 18, 421–430. [Google Scholar] [CrossRef]
- Kravchenko, Y.S.; Rogovska, N.; Petrenko, L.; Zhang, X.; Song, C.; Chen, Y. Quality and dynamics of soil organic matter in a typical Chernozem of Ukraine under different long-term tillage systems. Can. J. Soil Sci. 2012, 92, 429–438. [Google Scholar] [CrossRef]
- Van Eerd, L.L.; Congreves, K.A.; Hayes, A.; Verhallen, A.; Hooker, D.C. Long-term tillage and crop rotation effects on soil quality, organic carbon, and total nitrogen. Can. J. Soil Sci. 2014, 94, 303–315. [Google Scholar] [CrossRef]
- Dimassi, B.; Mary, B.; Wylleman, R.; Labreuche, J.; Couture, D.; Piraux, F.; Cohan, J.-P. Long-term effect of contrasted tillage and crop management on soil carbon dynamics during 41 years. Agric. Ecosyst. Environ. 2014, 188, 134–146. [Google Scholar] [CrossRef]
- Gubler, A.; Wächter, D.; Schwab, P.; Müller, M.; Keller, A. Twenty-five years of observations of soil organic carbon in Swiss croplands showing stability overall but with some divergent trends. Environ. Monit. Assess. 2019, 191, 277. [Google Scholar] [CrossRef]
- Silvola, J.; Alm, J.; Ahlholm, U.; Martikainen, P.J. The contribution of plant roots to CO2 fluxes from organic soils. Biol. Fertil. Soils 1996, 23, 126–131. [Google Scholar] [CrossRef]
- Li, X.; Fu, H.; Guo, D.; Li, X.; Wan, C. Partitioning soil respiration and assessing the carbon balance in a Setaria italica (L.) Beauv. Cropland on the Loess Plateau, Northern China. Soil Biol. Biochem. 2010, 42, 337–346. [Google Scholar] [CrossRef]
- Bilandzija, D.; Zgorelec, Z.; Kisic, I. Influence of Tillage Practices and Crop Type on Soil CO2 Emissions. Sustain. 2016, 8, 90. [Google Scholar] [CrossRef]
- Ussiri, D.A.N.; Lal, R. Long-term tillage effects on soil carbon storage and carbon dioxide emissions in continuous corn cropping system from an alfisol in Ohio. Soil Tillage Res. 2009, 104, 39–47. [Google Scholar] [CrossRef]
- Feizienė, D.; Kadžienė, G. The influence of soil organic carbon, moisture and temperature on soil surface CO2 emission in the 10th year of different tillage-fertilisation management. Zemdirb. Agric. 2008, 95, 29–45. [Google Scholar]
- Bhatia, A.; Sasmal, S.; Jain, N.; Pathak, H.; Kumar, R.; Singh, A. Mitigating nitrous oxide emission from soil under conventional and no-tillage in wheat using nitrification inhibitors. Agric. Ecosyst. Environ. 2010, 136, 247–253. [Google Scholar] [CrossRef]
- Oorts, K.; Merckx, R.; Gréhan, E.; Labreuche, J.; Nicolardot, B. Determinants of annual fluxes of CO2 and N2O in long-term no-tillage and conventional tillage systems in northern France. Soil Tillage Res. 2007, 95, 133–148. [Google Scholar] [CrossRef]
- Dong, W.; Hu, C.; Zhang, Y.; Wu, D. Gross mineralization, nitrification and N2O emission under different tillage in the North China Plain. Nutr. Cycl. Agroecosystems 2012, 94, 237–247. [Google Scholar] [CrossRef]
- Gupta, D.K.; Bhatia, A.; Kumar, A.; Das, T.; Jain, N.; Tomer, R.; Malyan, S.K.; Fagodiya, R.; Dubey, R.; Pathak, H. Mitigation of greenhouse gas emission from rice–wheat system of the Indo-Gangetic plains: Through tillage, irrigation and fertilizer management. Agric. Ecosyst. Environ. 2016, 230, 1–9. [Google Scholar] [CrossRef]
- Passianoto, C.C.; Ahrens, T.; Feigl, B.J.; Steudler, P.A.; Carmo, J.B.D.; Melillo, J.M. Emissions of CO2, N2O, and NO in conventional and no-till management practices in Rondônia, Brazil. Biol. Fertil. Soils 2003, 38, 200–208. [Google Scholar] [CrossRef]
- Malhi, S.S.; Lemke, R. Tillage, crop residue and N fertilizer effects on crop yield, nutrient uptake, soil quality and nitrous oxide gas emissions in a second 4-yr rotation cycle. Soil Tillage Res. 2007, 96, 269–283. [Google Scholar] [CrossRef]
- Xiaoxiao, S.; Li, Q. Effect of Different Tillage Methods on Soil Emissions of N2O and Crop Yield in North China Grain Field. IOP Conf. Ser. Earth Environ. Sci. 2019, 310, 042020. [Google Scholar] [CrossRef]
- Shakoor, A.; Shahbaz, M.; Farooq, T.H.; Sahar, N.E.; Shahzad, S.M.; Altaf, M.M.; Ashraf, M. A global meta-analysis of greenhouse gases emission and crop yield under no-tillage as compared to conventional tillage. Sci. Total. Environ. 2021, 750, 142299. [Google Scholar] [CrossRef]
- Feng, J.; Li, F.; Zhou, X.; Xu, C.; Ji, L.; Chen, Z.; Fang, F. Impact of agronomy practices on the effects of reduced tillage systems on CH4 and N2O emissions from agricultural fields: A global meta-analysis. PLoS ONE 2018, 13, e0196703. [Google Scholar] [CrossRef]
- Bessou, C.; Mary, B.; Léonard, J.; Roussel, M.; Gréhan, E.; Gabrielle, B. Modelling soil compaction impacts on nitrous oxide emissions in arable fields. Eur. J. Soil Sci. 2010, 61, 348–363. [Google Scholar] [CrossRef]
- Bogunovic, I.; Pereira, P.; Kisic, I.; Sajko, K.; Sraka, M. Tillage management impacts on soil compaction, erosion and crop yield in Stagnosols (Croatia). Catena 2018, 160, 376–384. [Google Scholar] [CrossRef]
- Alskaf, K.; Mooney, S.; Sparkes, D.L.; Wilson, P.; Sjogersten, S. Short-term impacts of different tillage practices and plant residue retention on soil physical properties and greenhouse gas emissions. Soil Tillage Res. 2021, 206, 104803. [Google Scholar] [CrossRef]
- Rochette, P. No-till only increases N2O emissions in poorly-aerated soils. Soil Tillage Res. 2008, 101, 97–100. [Google Scholar] [CrossRef]
- Grave, R.A.; Nicoloso, R.D.S.; Cassol, P.C.; Da Silva, M.L.B.; Mezzari, M.P.; Aita, C.; Wuaden, C.R. Determining the effects of tillage and nitrogen sources on soil N2O emission. Soil Tillage Res. 2018, 175, 1–12. [Google Scholar] [CrossRef]
- Sitaula, B.; Hansen, S.; Sitaula, J.; Bakken, L. Effects of soil compaction on N2O emission in agricultural soil. Chemosphere - Glob. Chang. Sci. 2000, 2, 367–371. [Google Scholar] [CrossRef]
- Yamulki, S.; Jarvis, S. Short-term effects of tillage and compaction on nitrous oxide, nitric oxide, nitrogen dioxide, methane and carbon dioxide fluxes from grassland. Biol. Fertil. Soils 2002, 36, 224–231. [Google Scholar] [CrossRef]
- van Groenigen, J.; Kasper, G.; Velthof, G.; Dasselaar, A.V.D.P.-V.; Kuikman, P. Nitrous oxide emissions from silage maize fields under different mineral nitrogen fertilizer and slurry applications. Plant Soil 2004, 263, 101–111. [Google Scholar] [CrossRef]
- Grant, R.F.; Pattey, E.; Goddard, T.W.; Kryzanowski, L.M.; Puurveen, H. Modeling the Effects of Fertilizer Application Rate on Nitrous Oxide Emissions. Soil Sci. Soc. Am. J. 2006, 70, 235–248. [Google Scholar] [CrossRef]
- Schaufler, G.; Kitzler, B.; Schindlbacher, A.; Skiba, U.; Sutton, M.A.; Zechmeister-Boltenstern, S. Greenhouse gas emissions from European soils under different land use: Effects of soil moisture and temperature. Eur. J. Soil Sci. 2010, 61, 683–696. [Google Scholar] [CrossRef]
- Zhang, X.B.; Xu, M.; Sun, N.; Wang, X.; Wu, L.; Wang, B.; Li, D. How do environmental factors and different fertilizer strategies affect soil CO2 emission and carbon sequestration in the upland soils of southern China? Appl. Soil Ecol. 2013, 72, 109–118. [Google Scholar] [CrossRef]
- Reth, S.; Reichstein, M.; Falge, E. The effect of soil water content, soil temperature, soil pH-value and the root mass on soil CO2 efflux—A modified model. Plant Soil 2005, 268, 21–33. [Google Scholar] [CrossRef]
- Horák, J.; Igaz, D.; Aydin, E.; Šimanský, V.; Buchkina, N.; Balashov, E. Changes in direct CO2 and N2O emissions from a loam Haplic Luvisol under conventional moldboard and reduced tillage during growing season and post-harvest period of red clover. J. Hydrol. Hydromech. 2020, 68, 271–278. [Google Scholar] [CrossRef]
Publisher’s Note: MDPI stays neutral with regard to jurisdictional claims in published maps and institutional affiliations. |
© 2020 by the authors. Licensee MDPI, Basel, Switzerland. This article is an open access article distributed under the terms and conditions of the Creative Commons Attribution (CC BY) license (http://creativecommons.org/licenses/by/4.0/).