Article

Early-Stage Phenotyping of Root Traits Provides Insights into the Drought Tolerance Level of Soybean Cultivars

1
INP-ENSAT Toulouse, UMR AGIR, Université Fédérale de Toulouse, 31326 Castanet-Tolosan, France
2
INRAE, UMR AGIR, Université Fédérale de Toulouse, 31326 Castanet-Tolosan, France
3
Terres Inovia, Institut Technique des Oléagineux, des Protéagineux et du Chanvre, 31450 Baziège, France
*
Author to whom correspondence should be addressed.
Agronomy 2021, 11(1), 188; https://doi.org/10.3390/agronomy11010188
Submission received: 18 December 2020 / Revised: 12 January 2021 / Accepted: 15 January 2021 / Published: 19 January 2021

Abstract

:
Soybean (Glycine max (L.) Merr.) may contribute to the agro-ecological transition of cropping systems in Europe, but its productivity is severely affected by summer drought. New drought-avoidance cropping strategies, such as early sowing, require cultivars with high early plant growth under suboptimal conditions. This study aims at phenotyping early-stage root and shoot traits of 10 cultivars commonly grown in Europe. Cultivars were grown in minirhizotrons under two soil moisture status in controlled conditions. Root and shoot traits were evaluated at 10 days after sowing. Field early growth of two cultivars was also analyzed under early and conventional sowing dates. A significant intraspecific variability (p < 0.05) was found for most investigated shoot and root morpho-physiological traits regardless of the soil moisture status under controlled conditions. However, no significant difference among cultivars (p > 0.05) was found in terms of root architectural traits that were mainly affected by water stress. Total root length was positively correlated with shoot length and shoot dry matter (p < 0.05). Under field conditions, the differences between cultivars were expressed by the canopy cover at emergence, which determines the subsequent canopy cover dynamics. The significant early growth difference among cultivars was not related to the maturity group. Cultivars characterized by high root depth and length, high root density and narrow root angle could be considered as good candidates to cope with water stress via better soil exploration. New agronomic strategies mobilizing the diversity of cultivars could thus be tested to improve soybean water use efficiency in response to climate change.

1. Introduction

European market imports annually around 17 million tons of crude proteins, of which 13 million tons come from soybean (corresponding to 30 million tons of equivalent grains) from the American continent [1]. Although European soybean production increased progressively over the last 5 years, reaching 2.8 million tons in 2018, this quantity is still not sufficient for the needs of the European market in animal and human nutrition. In France, the strategic plan of the oil–protein sector aims at increasing the soybean acreage with an objective of 250,000 ha by 2025. Southwestern France, one of the two soybean production basins of the country, where soybean is cultivated mainly under irrigation, is concerned by the strategic plan. At the same time, an increase in the soybean acreage in this region is associated with high variability in soybean production as drought and irrigation availability are two key limiting factors affecting soybean yield [2]. Yield losses up to 40% were recorded, particularly when water stress occurs during both the vegetative and reproductive stages [3]. Indeed, the most critical period to water stress for the crop begins from the flowering stage [4]. Under these circumstances, early sowing has been proposed as a low-water-input strategy to grow soybean under summer drought [5]. The enhancement of biomass production under drought stress can be achieved primarily by maximizing soil water capture while diverting the largest part of the available soil moisture towards stomatal transpiration [6]. Otherwise, early sowing is the suitable strategy for the “deeper rooting” of a crop compared with conventional sowing. For example, a rapid early root growth deeper in soil layers has been reported to enhance efficient N depletion and water uptake for a longer time in catch crops [7]. In addition, earlier sowing in wheat allows deeper root growth with higher access to water that finally increased grain yield under climate change [8].
Root system distribution and architecture in the soil are important for crop productivity, improving water and nutrient use efficiency [9]. To avoid drought, plants should be able to maintain a favorable water status by enhancing the root water uptake through a deeper rooting [10]. In soybean, deepening, the rooting system could be considered as a major adaptation trait to climate change for both increasing yield and decreasing annual yield variability [11]. In France, there is a paucity of information about locally adapted, drought-tolerant soybean cultivars, especially with regard to root growth. Recently, there has been a substantial improvement in methods for quantification of deep root growth and function. For example, Han et al. (2020) investigated root growth and activity of perennial pasture up to 4.2 m soil depth using a core-labeling technique (CLT) [12]. Another study [13] demonstrated the accuracy of a high-throughput root phenotyping in identifying deep roots on spring barley cultivars under semi-field conditions by using a minirhizotron technique with a multispectral imaging system. Despite the improvement in root phenotyping, these techniques are still tedious to study a wide range of soybean cultivars under field conditions. Studying the rooting system remains a challenge for many reasons, such as phenotypic plasticity of roots in response to soil conditions, cost of screening methods, and the difficulty to harvest the whole rooting system from the soil, especially under field conditions [14].
Early growth is a critical phase of the crop cycle, which spans from sowing until the beginning of competition among plants (crops or weeds) for the acquisition of trophic resources [15,16]. This phase is sensitive to species traits and sowing conditions, including seedbed moisture, which is a key factor for soybean establishment in Southwestern France, affecting both seed germination [17] and seedling emergence [18]. Small differences in early-season seedling growth can result in large variabilities in growth, and resources capture the ability of the crop later in the season [19]. For instance, soybean (cv. Protina) with rapid early shoot growth, higher shoot biomass and an expanded lateral root had a better soil N uptake during early growth compared with other legumes species [20]. An early establishment of the soybean root system could be one of the most important traits for genotype selection in order to improve crop production under drought [21,22]. A cultivar having a strong ability to capture resources during early growth could be more competitive during later stages. Since water is a mobile resource, it may be advantageous to have a primary root (taproot) and a network of lateral roots penetrating deeper into soil layers even from the onset of seedling growth. Indeed, grain yield will be less affected by water stress prior to flowering compared with the post-flowering one because of early plasticity of the rooting system (e.g., increasing taproot length and rooting density underwater stress conditions) [21,23]. Phenotyping root traits with simple, rapid and accurate methods is more feasible during early growth stage.
Interspecific and intraspecific variability for root traits during early growth have been well-documented in leguminous species such as lupin [24,25], pea [26], common bean [27] or soybean [20]. Moreover, previous studies reported genetic variability for root traits in soybean cultivars, which appeared from 12 days after sowing (das) for taproot progression in-depth [22,28,29]. Although soybean is grown in Europe since the 1980s, little is known to date about the genetic variability of root traits for cultivars grown in Europe. Moreover, identifying the correlations between root, shoot (plant height, dry matter), and seed (size) traits could facilitate the phenotyping of a large number of cultivars.
The characteristics of rooting traits improving water uptake in soybean have been identified [30]: a faster rate of root depth progression, an improved distribution of root length density into deeper soil layers, an increased length per unit root mass and a greater root: shoot biomass ratio. We assume that soybean cultivars characterized by such favorable root traits during early growth could be good candidates (ideotypes) for maintaining crop performance underwater-stressed conditions, thereby limiting yield losses. Crop ideotype was defined by Martre et al. (2015) as the combination of morphological and/or physiological traits, or their genetic bases, optimizing crop performance to a particular biophysical environment, crop management, and end-use [31]. Identifying ideotypes for root traits involved in drought tolerance at early growth stages could be useful in guiding the development of soybean cultivars with enhanced soil exploration, and thus water acquisition, underwater deficit conditions. Lynch (2013) showed that maize roots growing vertically at a lower metabolic cost (steep, cheap and deep) are interesting to select for rapid exploitation of deep soil, thus maximizing water and N uptake. Since phosphorus (P) is an immobile resource, the soybean cultivars with shallower root growth angle of basal roots and long root hairs have been useful in order to enhance P-acquisition in low-P soil [32,33,34,35]. Similarly, because water is a mobile resource in the soil, it is necessary to find root traits in soybean cultivars that allow a better exploration of deeper soil horizons to cope with drought. However, our knowledge is still limited to design soybean ideotypes with root traits that allow maximizing water uptake under drought conditions.
Here, we chose 10 soybean cultivars to represent the widest range of phenological characteristics (maturity group, growth type) among elite cultivars grown in Europe [36]. The objectives of this research were to (i) evaluate the phenotypic difference of ten soybean cultivars in terms of root morphological and architectural traits during early growth under well-watered conditions, (ii) identify the response of studied traits to water stress, (iii) determine the relationship between root and shoot, as well as root and seed traits, and (iv) assess the early growth of two soybean cultivars among the previous ones under early and conventional sowing dates.

2. Materials and Methods

2.1. Plant Material and Experimental Design

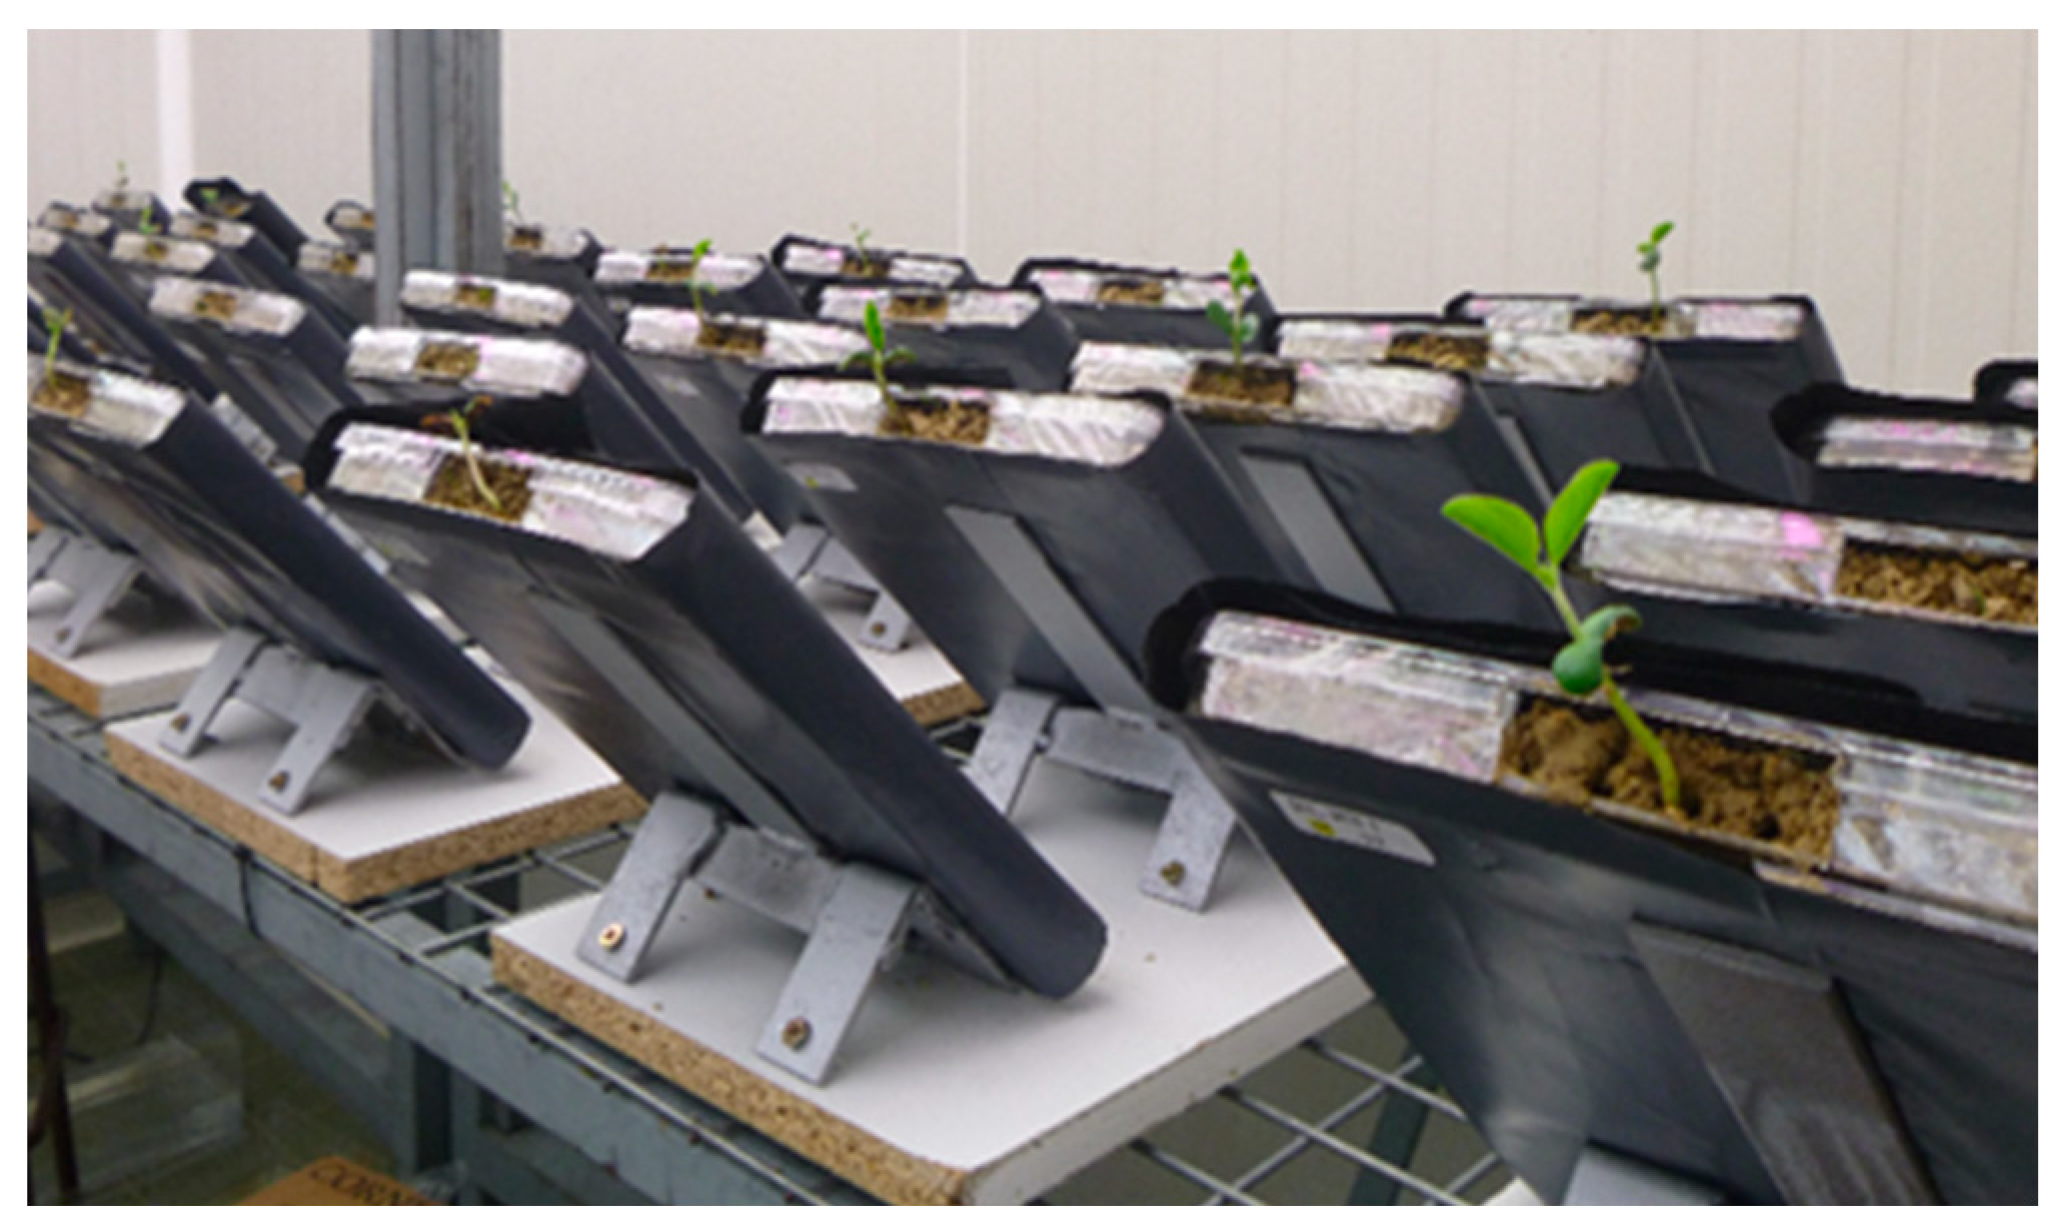
2.1.1. Controlled Conditions

Ten soybean cultivars grown in Europe were selected based on their contrasting characteristics related to crop development (maturity groups from 000 to II) and growth type (semi-determinate to indeterminate growth) (Table 1). Cultivars were grown under two contrasting soil moisture status; named well-watered (WW) or water-stressed (WS) conditions, of factorial experiments in a completely randomized design (Figure 1). The experiment was conducted under artificial light in a growth chamber with 25 °C and 12/12 h day/night temperature and photoperiod, respectively, 56% relative humidity and an average light intensity of 110 μmol m−2 s−1 measured at the canopy level. The experiment was carried out using transparent minirhizotrons [37] with inner dimensions of (24.5 × 24.5 × 2.5) cm, which were covered with black polyethylene plastic sheets. The rhizotrons were inclined at 45° so that the roots would grow towards the underside (Figure 1). Each rhizotron was filled with 1.250 kg of a mixture of fresh soil (75%) and dry sand (25%). The soil was sieved (2 mm) prior to being homogeneously mixed with the dry sand. The texture of the soil was 26% clay, 29% loam, 45% sand and contained 1.3% organic matter. Overall, 125 mL and 250 mL of tap water were added to each minirhizotron for water-stressed (WS) and well-watered (WW) conditions, respectively. Penetration resistance of the soil was measured using the cone penetrometer (STELZNER, Instruction Art.30005090, Bad Klosterlausnitz, Germany, Sols Mesures, Trappes, France). The value of resistance was <1.4 MPa for 24.5 cm depth, which is considered as no mechanical resistance [28]. The soybean seeds were weighted and selected to reduce the variation in the individual seed mass to ±10%. Prior to sowing, seeds were sterilized with 2.6% sodium hypochlorite, then rinsed twice with autoclaved water. The seeds were pre-germinated on moist filter paper (Fisherbrand, Illkirch, France) in the dark (25 °C) until the radicle emerged from the seed [38]. One germinated seed was transplanted per minirhizotron at 2 cm depth with at least 4 repetitions for each cultivar and in each soil moisture status. The experiment was replicated twice successively (set 1, set 2) in the same conditions in order to get 8 to 9 repetitions for each cultivar and for each soil moisture status (Table A1).

2.1.2. Field Conditions

The field experiments were carried out in 2013 and 2014 at En Crambade (43.25° N, 1.39° E) study site, an experimental station of Terres Inovia located southeast of Toulouse. After preceding wheat harvest, conventional tillage was performed that consisted of plowing at 25 cm depth, followed by a passage of cultivator at 7–10 cm depth, and of flat harrow at 5–7 cm depth. Two soybean cultivars (Isidor and Santana, Table 1) were sown in 64 m2 unit plots (each 10 m long and 6.4 m wide replicated 6 times) at 3 cm depth with 45 seeds m−2 and with 50 cm inter-row distance. The experiment was arranged as a completely randomized block design. Each year, two sowing dates were compared: early (15 and 14 March in 2013 and 2014, respectively) and conventional (25 and 30 April in 2013 and 2014, respectively). Daily temperatures and precipitations were recorded by an automatic weather station located at the experimental site (data not shown).

2.2. Sampling and Data Collection in Controlled Conditions

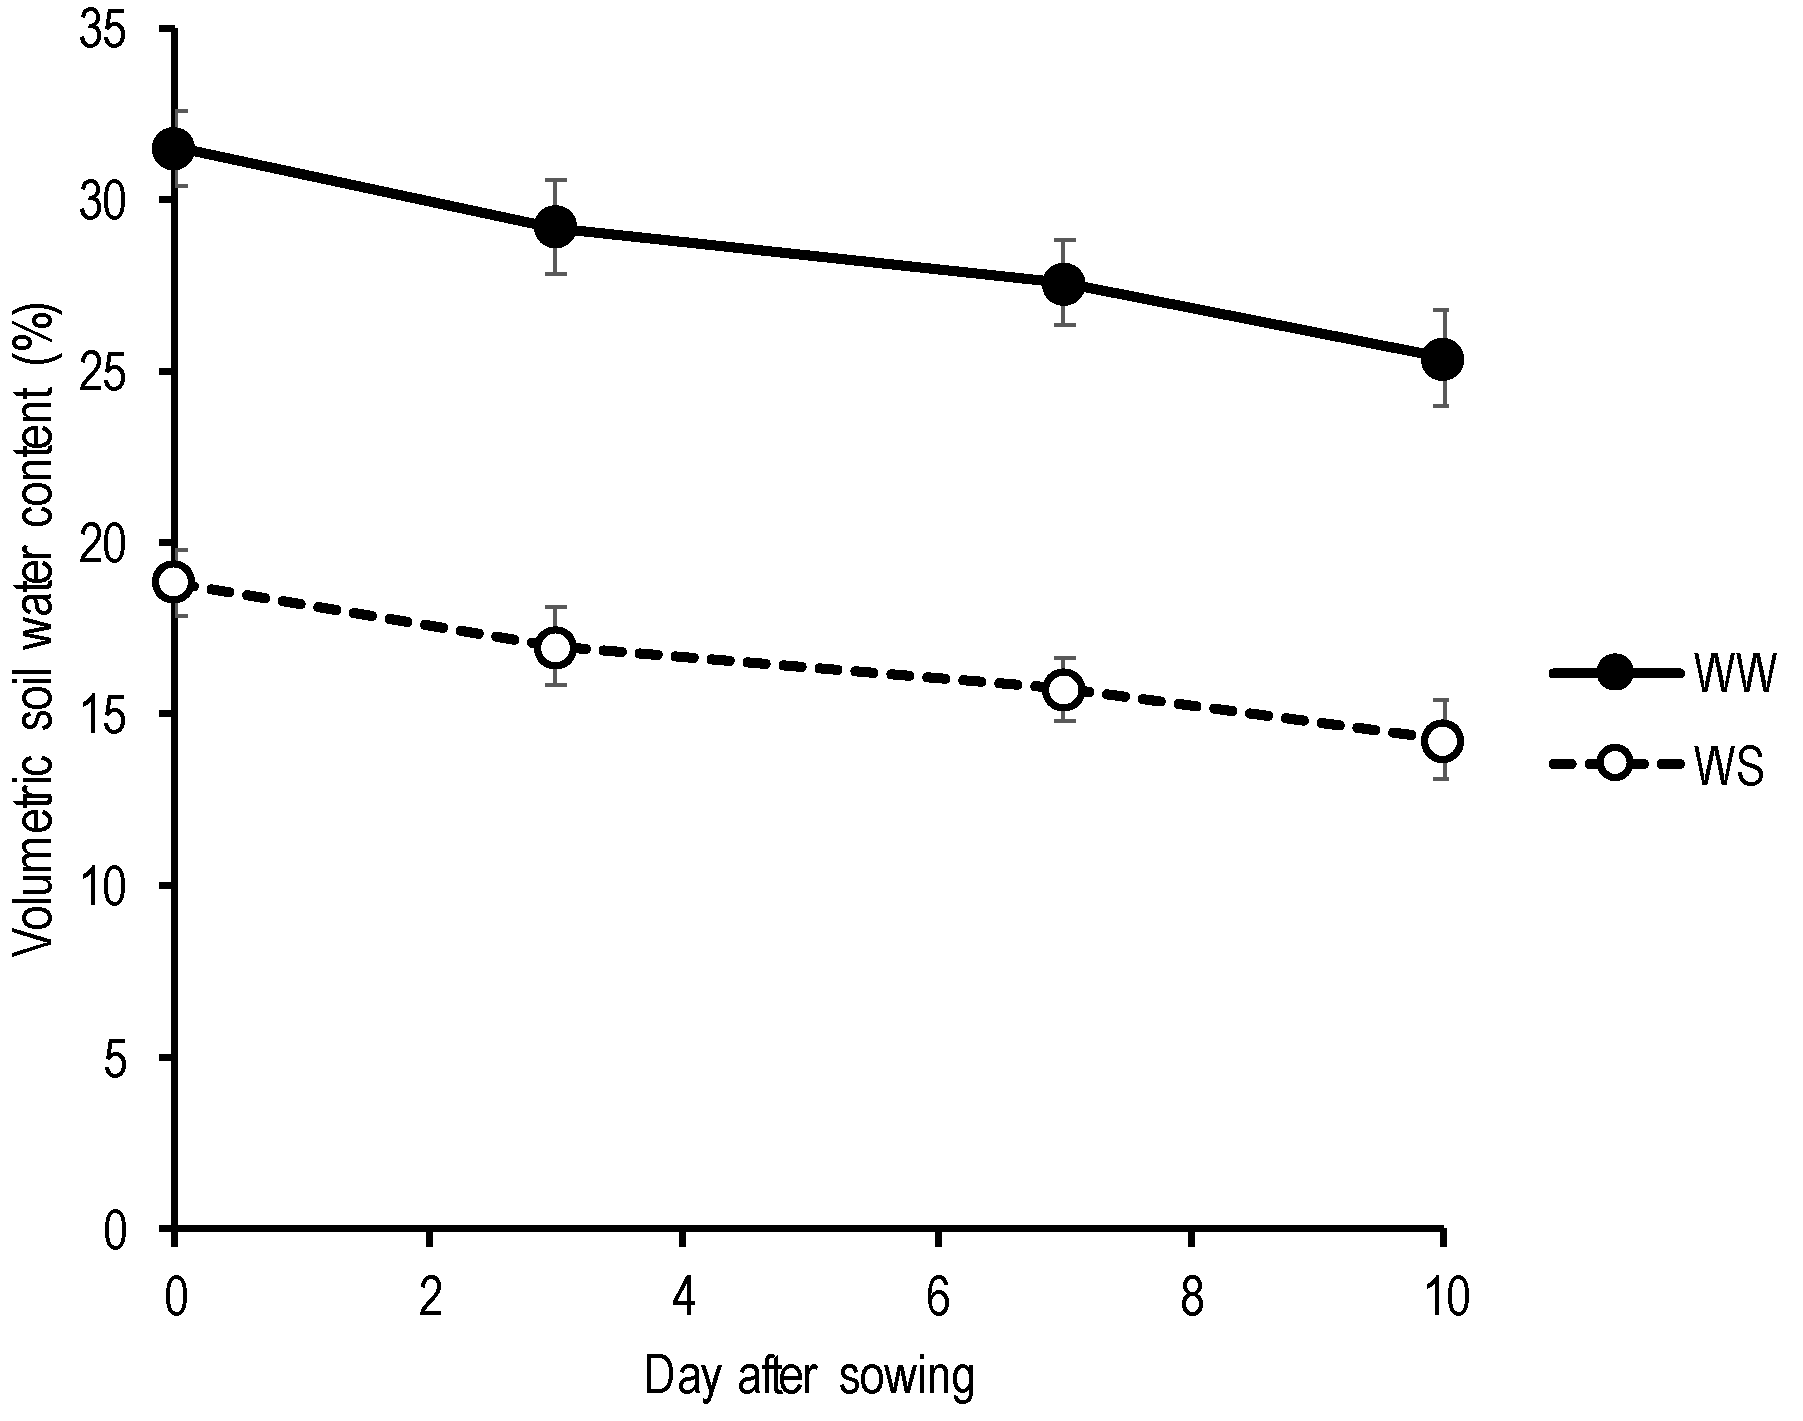
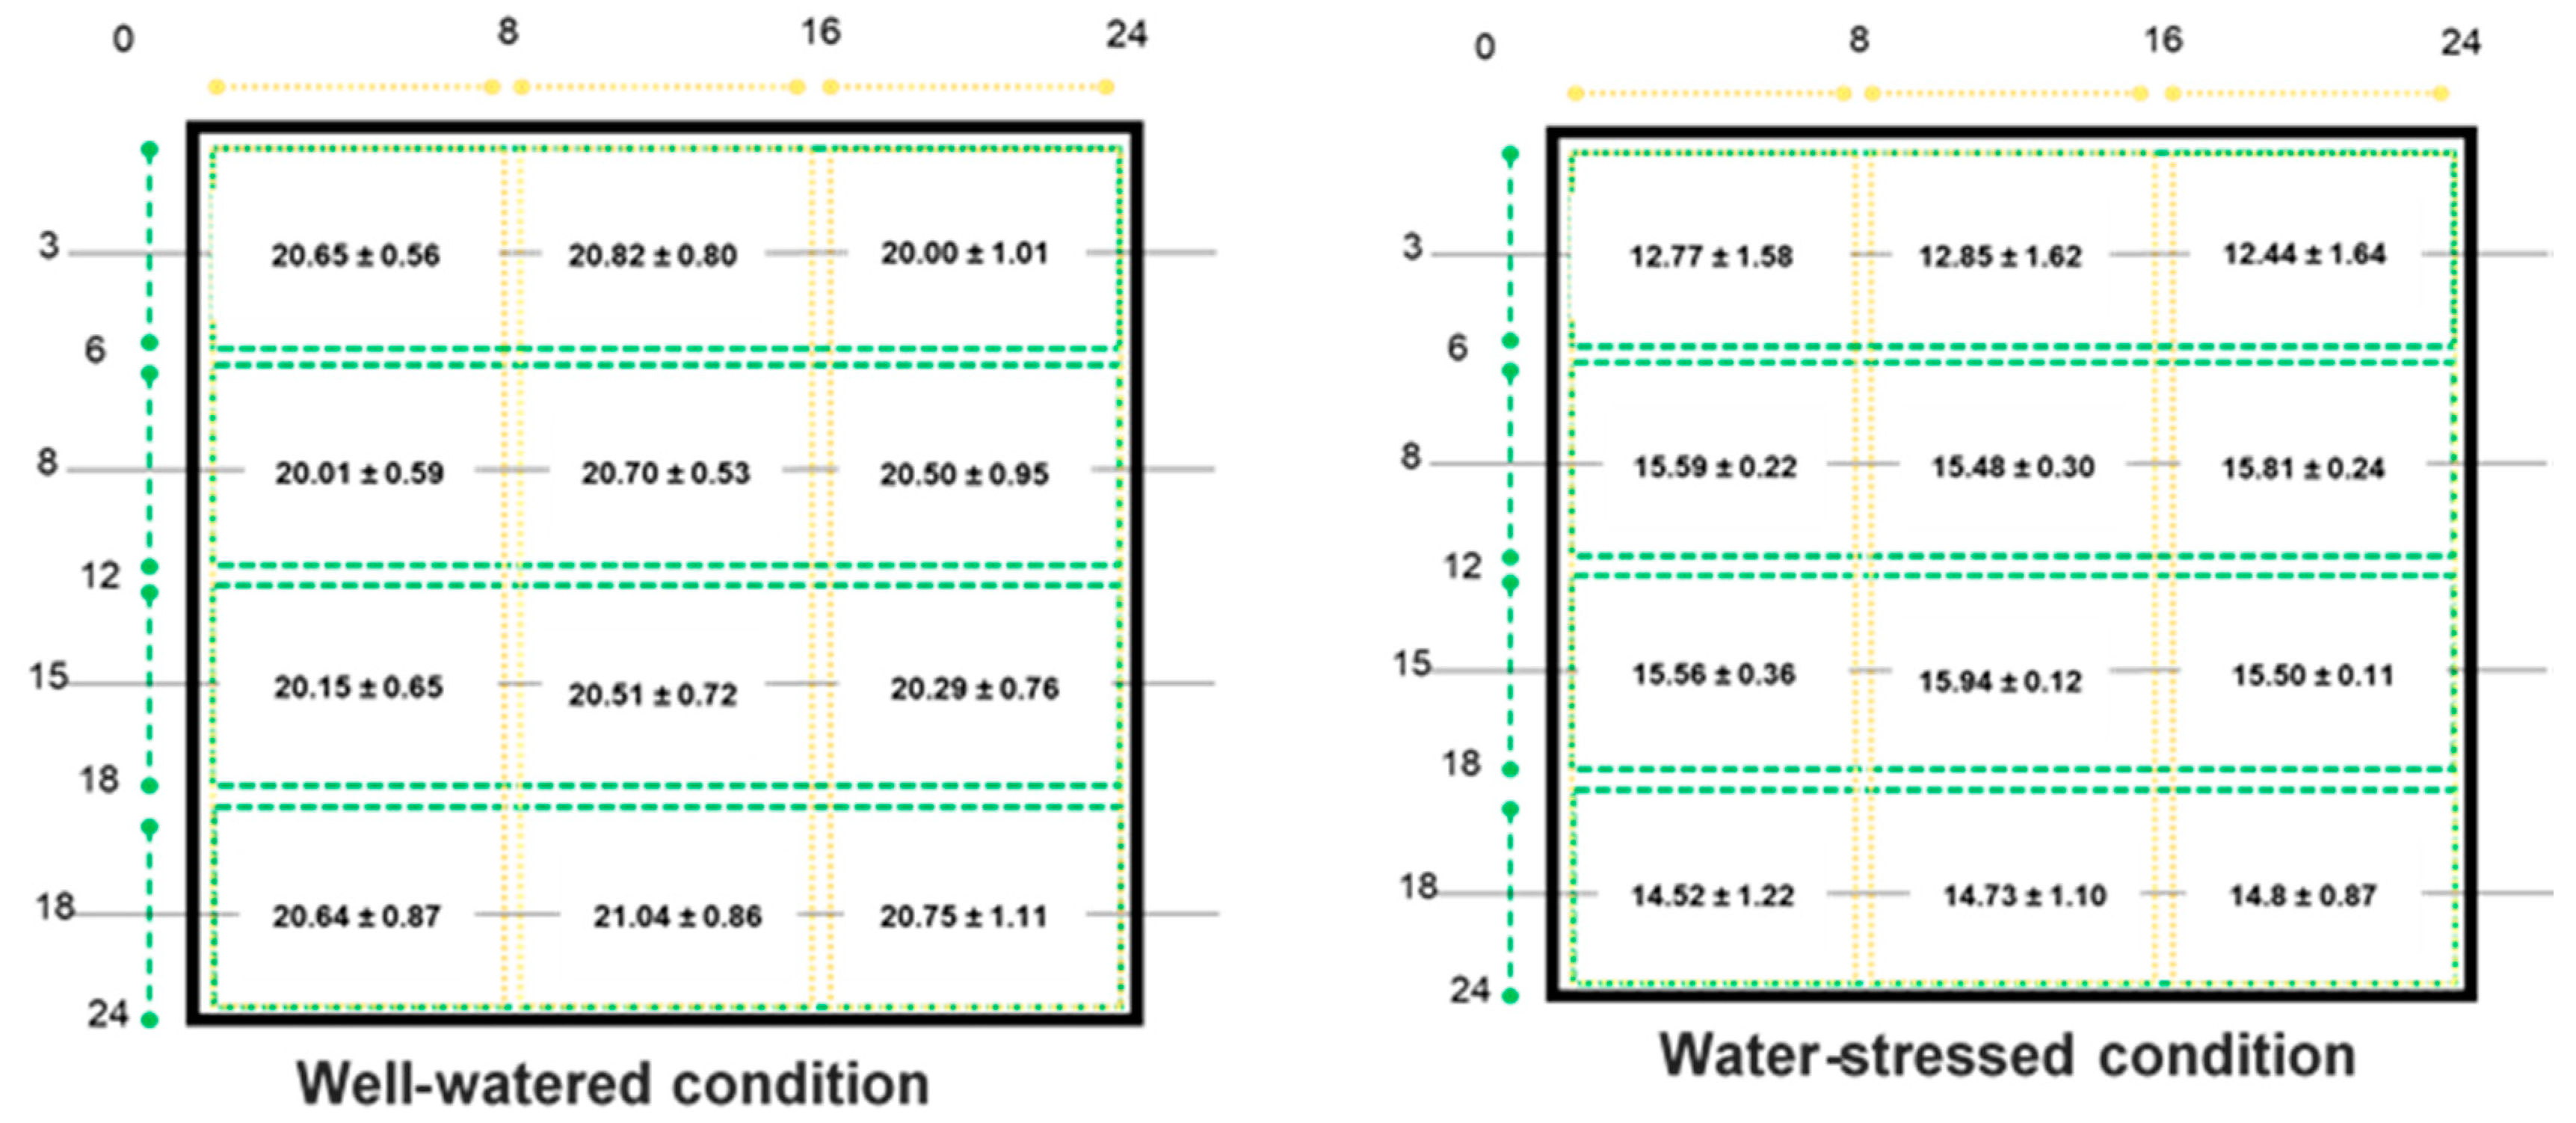
2.2.1. Soil Moisture Status

Volumetric soil water content was measured at the beginning of the experiment, followed by three measurements with a 2 day interval until harvest. At sowing, after weighing wet soil, the soil samples were oven-dried for 48 h at 105 °C.
The volumetric water content (θv) was calculated with the formula:
θv = ([wet soil weight − dry soil weight])/([water density × volume of soil]) × 100
With water density = 0.997 g m−3.
Volumetric soil water content (%) varied from 31% (which is close to soil moisture at field capacity) to 25% under well-watered conditions (WW) and from 19% to 14% underwater-stressed conditions (WS), for sowing and sampling date, respectively. However, the gap between the two soil moisture status was consistently maintained during the experiment (Figure A1).
On the sampling date, we verified that the soil water content was distributed homogeneously in each minirhizotron regardless of the soil moisture status by dividing each minirhizotron into 12 squares. Then we measured volumetric soil water content (%) in each square for a soil sample of about 104 g replicated 3 times (data are shown in Figure A2).

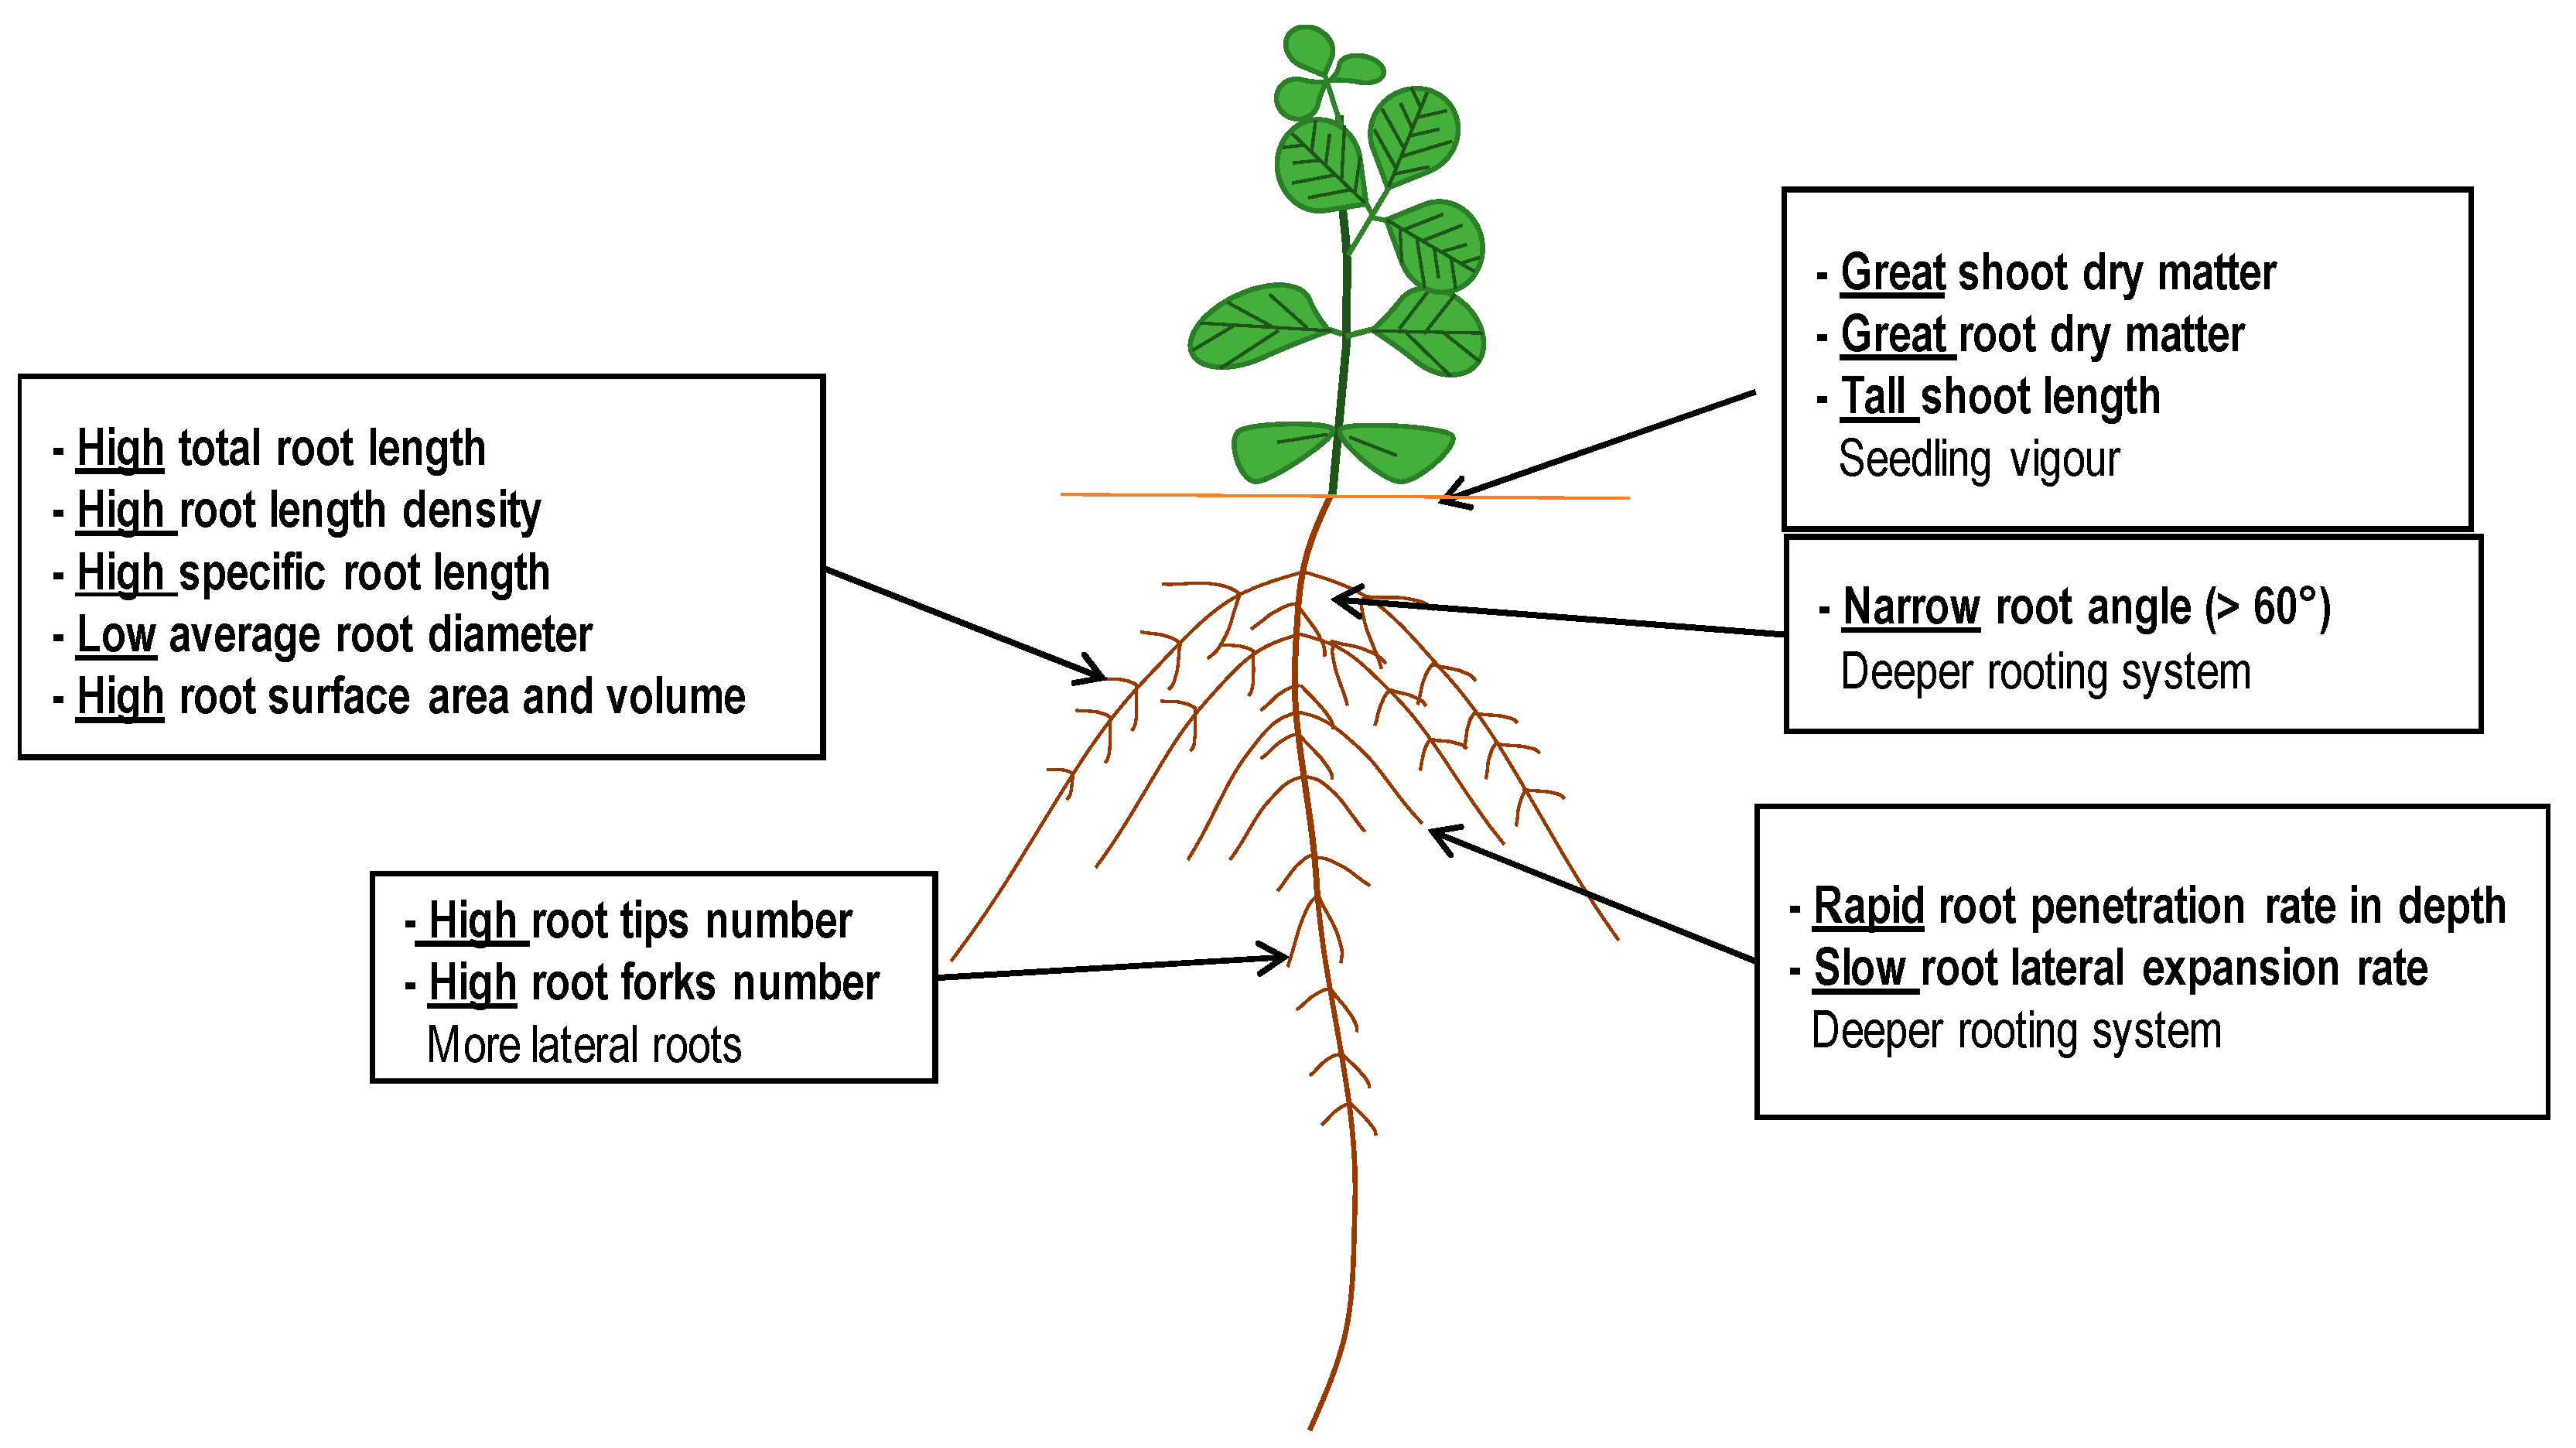
2.2.2. Shoot and Root Morpho-Physiological Traits

Cultivars were harvested 10 days after sowing (das) while they were still in their early growth stage (i.e., either the emergence VE or cotyledon VC stage) [32]. Plant water potential (Ψw) was measured at harvest on each dark-adapted plant using a Scholander’s pressure chamber (Soil Moisture Equipment Corp., Goleta, CA, USA). The root systems were removed from the minirhizotron, and the soil was washed out. To prepare root samples for scanning, the roots were stained with methylene blue (0.025 g L−1) and stored at 4 °C for 12 h. After this, the root systems were scanned while submerged in water with a root scanner (Epson Perfection 4990 Photo3.4 (32–32)). The scanned images of roots were analyzed using the WinRhizo 2013e program (Regent Instruments Canada Inc., Quebec, QC, Canada) to estimate total root length, root diameter, root volume, root surface area and number of root tips. In addition, shoot height was measured as the distance between the soil surface and the last node on the seedling stem. Shoot and root dry matter were determined after oven drying at 80 °C for 48 h. All investigated traits are presented in Table A2.

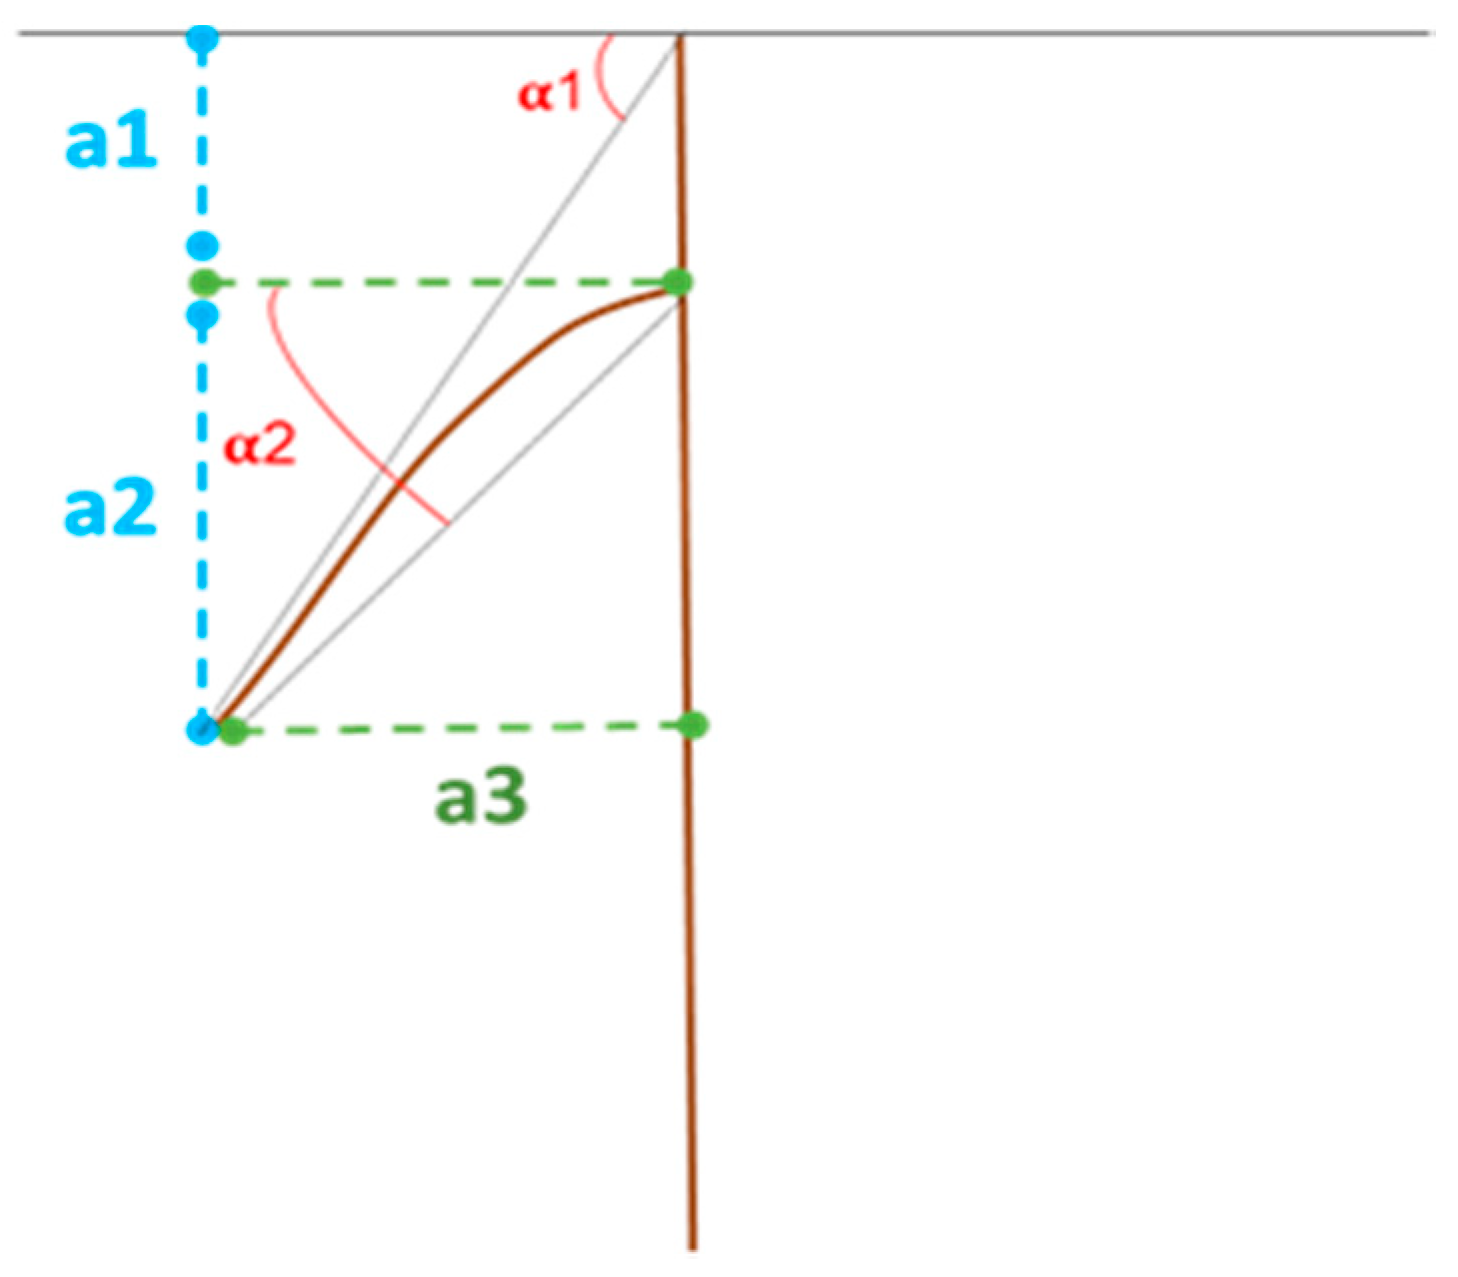
2.2.3. Root Architectural Traits

The root depth and lateral expansion were monitored using a grid of 5 mm × 5 mm squares printed on a transparent plastic sheet that was fixed on the underside of the minirhizotron. From sowing to sampling time, root depth was taken as the length of taproot in the minirhizotron; root lateral expansion was measured as the largest width of lateral roots [40]. The rates of vertical and lateral root expansion were considered as root architectural traits, according to Lynch and Brown (2012) [41]. The root angles (α1, α2) were calculated (Figure 2) by using the Equations (1) and (2):
α1 = arctan ((a1 + a2)/a3),
α2 = arctan (a2/a3),
where:
  • α1: the angle between the longest lateral root and the horizontal line of soil (as average on both sides);
  • α2: angle between the longest lateral root and the horizontal line from the point of insertion of this root on taproot (as averaged on both sides);
  • a1: vertical distance from soil to longest lateral root insertion on taproot;
  • a2: vertical distance between the end of a1 and the tip of the longest lateral root;
  • a3: horizontal distance between the tip of the longest lateral root and the taproot.

2.3. Sampling and Data Collection under Field Conditions

Two phenological stages were recorded (VE: emergence; R1: first flower) [38] when 50% of the plants/plot reached the stages. Plant shoot height and green canopy cover (CC) were measured regularly (1 to 2 measurements per week) from emergence to flowering, where CC is the fraction of the soil surface covered by green canopy cover. CC was determined by analyzing the photos of “in situ” 1 m2 quadrat by Image J free software [42]. According to [43], CC dynamics over time was fitted to an exponential function of time beginning (Equation (3)) from the canopy cover when emergence has occurred (CC0) and using a growth rate defined by the canopy growth coefficient (CGC). Total shoot plant dry matter was determined at the R1 stage and at the crop maturity. Plant measurements were performed only on aerial parts under field conditions. The crop was harvested, and soybean grains were dried up to remove the residual humidity. Then grain yield was expressed at 13% grain moisture.
CC = CC 0 .   e CGC .   t
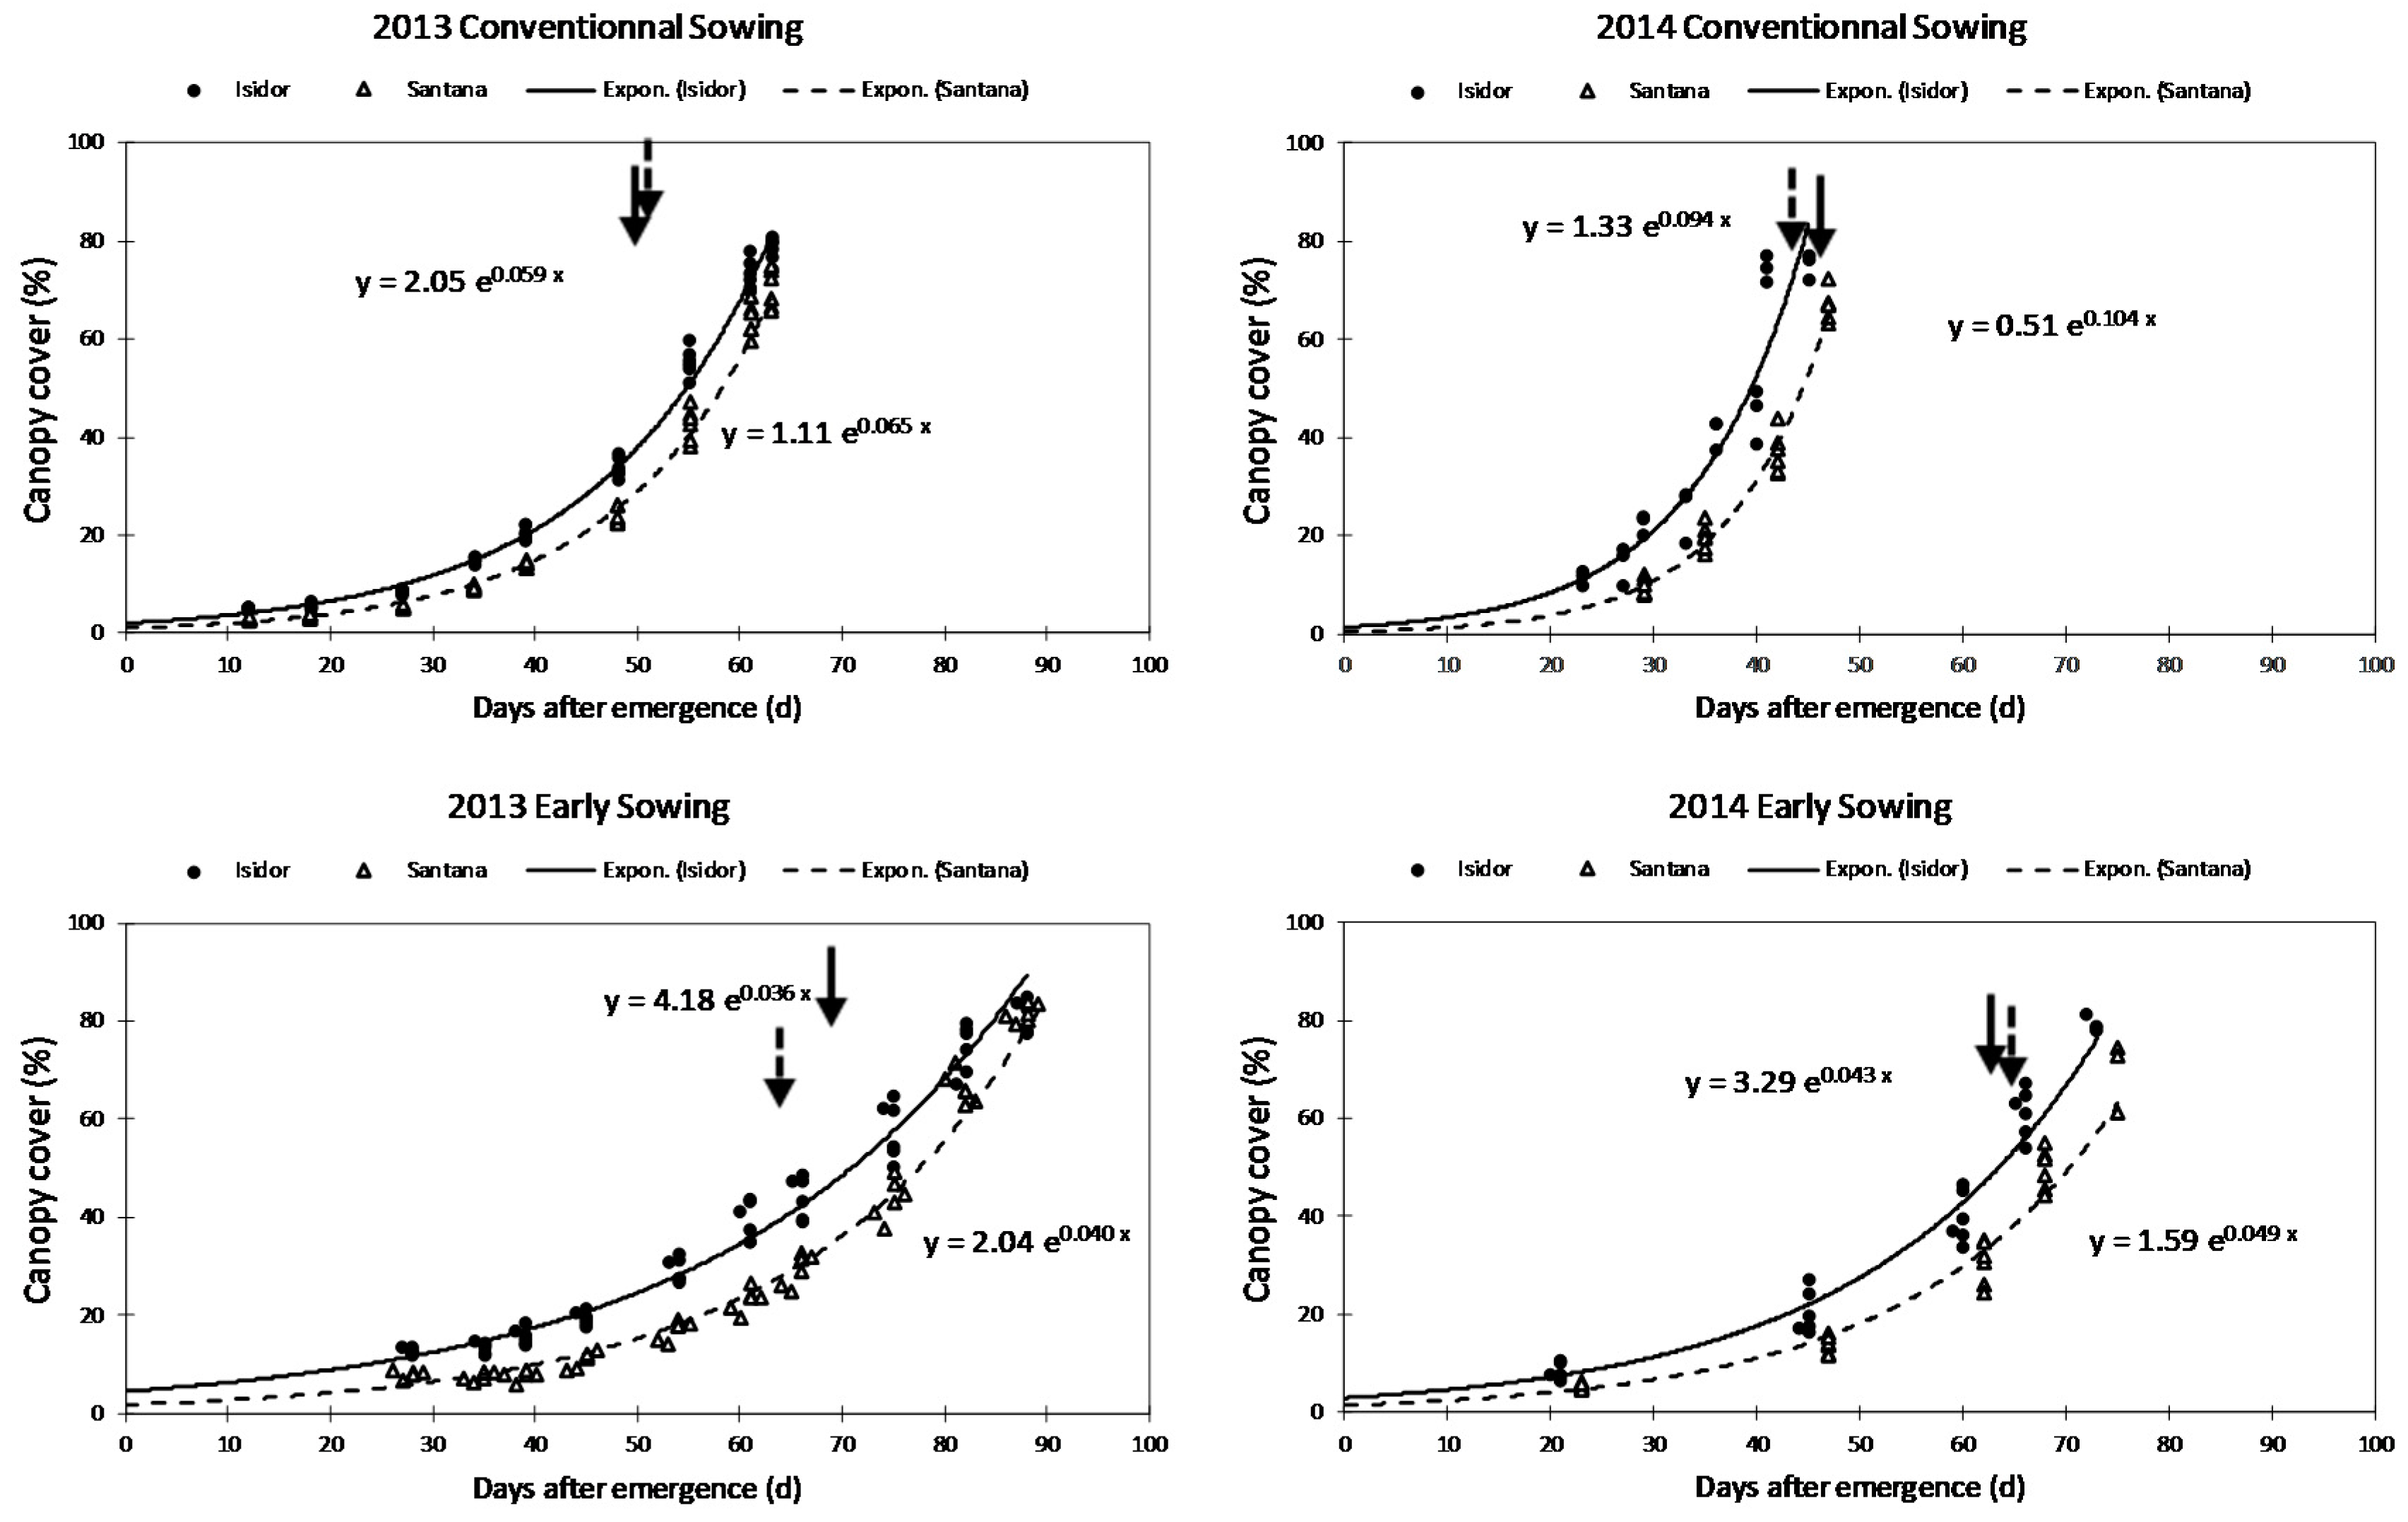
  • With: CC0: canopy cover when emergence has occurred;
  • CGC: canopy growth coefficient;
  • t: time from emergence stage (in days).

2.4. Statistical Analyses

The rates of vertical and lateral root expansion (cm day−1) were calculated by linear regression analysis. The rate of trait variation (%) is the difference between the cultivars with the highest and the lowest trait value divided by the cultivar with the lowest trait value multiplied by 100. The effects of cultivars and soil moisture status on root and shoot morpho-physiological traits and root architectural traits were tested by one-way analysis of variance (type III sum of squares; α = 0.05). An ANOVA test was also performed on the three factors: cultivar, water stress and experimental set. The normality of the residues and homoscedasticity were tested using Shapiro–Wilk and Bartlett’s tests, respectively (α = 0.05). Means were compared using Tukey’s honestly significant difference (HSD) test; α = 0.05) to determine whether the main effect was significant. All statistical analyses were performed using the R Commander package in R software, version 3.1.2 [44]. Principal component analysis (PCA) was carried out using the package FactoMineR [45] in R software. The exponential function (Equation (3)) adjustment was performed by simultaneously optimizing the two function parameters (CC0, CGC) with the Excel solver tool.

3. Results

3.1. Difference among Cultivars for Shoot and Root Traits under Controlled Conditions

Significant differences among cultivars for shoot and root morpho-physiological traits (p < 0.05) were observed in 10 days-old plants under well-watered conditions. Shoot length and shoot dry matter were different among cultivars (p < 0.05 and p < 0.001, respectively). Isidor showed the highest shoot length and the greatest shoot dry matter (10.92 cm and 184.72 mg per plant, respectively), whereas ES Pallador and Blancas had the shortest shoot length (7.09 cm per plant as the average for the two cultivars) and the smallest shoot dry matter (125.21 mg per plant as average) (Table 2). The root dry matter varied among cultivars (p < 0.0001) from 13.78 (ES Pallador) to 36.68 (Isidor) mg per plant, which represents a variation rate of 166% while the root: shoot ratio ranged from 0.12 (ES Pallador and Sultana) to 0.24 (RGT Shouna) (p < 0.05). The total dry matter was greater for Isidor (221.40 mg per plant), whereas Blancas and ES Pallador showed the lowest total dry matter (150.70 and 136 mg per plant, respectively) (Table 2).
Among soybean cultivars, Isidor showed the longest root length (247.57 cm per plant) and the greatest values per plant for root surface (38.14 cm2), root volume (0.47 cm3) and number of root tips (204.33). In contrast, ES Pallador showed the shortest root length (93.93 cm) and the smallest values per plant for root surface (15.79 cm2), root volume (0.22 cm3) and number of root tips (86) (Table 2). The other cultivars showed intermediate values between Isidor and ES Pallador for most shoot and root morpho-physiological traits.
No difference was observed among the ten soybean cultivars for the rates of root penetration in-depth and of root lateral expansion 10 das (Table A3). The rate of depth penetration was approx. 3.55 cm day−1 (linear regression average R2 = 0.97) as averaged of the cultivar slopes under well-watered conditions. However, the rate of root lateral expansion was 1.80 cm day−1 (linear regression average R2 = 0.95) as averaged of the cultivar slopes under well-watered conditions. Significant differences among cultivars for root angle 1 (p < 0.05) were observed under well-watered conditions (Table 2). ES Pallador, RGT Shouna and Sultana had the highest value (average of 57°), whereas Ecudor had the smallest value (42°) of root angle 1. All the cultivars had a root angle 1 value between 40° and 60°.
Underwater-stressed conditions, the difference among cultivars in shoot and root morpho-physiological traits was observed in 10 days-old plants (Table 2). Isidor and RGT Shouna showed the highest shoot length (10 cm per plant as the average for the two cultivars), whereas Ecudor, ES Pallador, Santana, Sigalia and Sultana showed the shortest one (6.67 cm per plant as the average for the cultivars. Shoot dry matter was the highest for Isidor (186.99 mg per plant), whereas ES Pallador showed the lowest shoot dry matter (on average 116.56 mg per plant). Isidor and ES Mentor accumulated the greatest root dry matter (32.26 and 31.90 mg per plant, respectively), whereas Santana had the smallest one (18.88 mg per plant). The root: shoot ratio ranged between 0.13 for Santana and 0.24 for both Blancas and Klaxon (p < 0.05) (Table 2). Isidor showed the longest root length (241.94 cm per plant) and had the greatest values per plant for root surface (37.15 cm2), root volume (0.46 cm3) and number of root tips (217.63). In contrast, Blancas, Ecudor, Klaxon, ES Pallador, Santana, RGT Shouna, Sigalia and Sultana showed the shortest root length (128.80 cm as average). No difference was observed among the ten soybean cultivars in terms of the investigated root architectural traits, including the rate of root penetration in-depth, lateral root expansion and root angle at 10 das underwater-stressed conditions. However, all cultivars, but Santana, tended to increase their root angle1 to more than 60° with soil surface (Table 2 and Table A3).

3.2. Impact of Water-Stressed Conditions on Shoot and Root Traits under Controlled Conditions

The impact of water stress was more obvious on root architectural traits than on morpho-physiological traits during the early growth stage (Table 3). Shoot length, shoot dry matter, total dry matter and root diameter were affected by water stress (p < 0.05). Shoot length and shoot dry matter were reduced by 16% and 6%, respectively, for all cultivars underwater-stressed compared to well-watered conditions. However, the average root diameter increased by 5% underwater-stressed compared to well-watered conditions. In addition, soybean roots developed more surface (+10%) and length (+12%) per unit root dry matter underwater-stressed compared to no stress conditions.
Root architectural traits were differently affected by water–stress (p < 0.01). The rate of root penetration in-depth increased by 5% for all cultivars. However, we observed a decrease in the rate of lateral expansion by 48% underwater-stressed compared to well-watered conditions. Root angle1 increased from 51° under well-watered to 64° underwater-stressed conditions as averaged for all tested cultivars. The insertion of the longest lateral root on taproot was deeper from soil surface underwater-stressed conditions and increased by 47% compared with well-watered conditions (Table 3).
No significant interaction was found for all variables between cultivar and soil moisture status applied (Table 3). However, some cultivars showed noticeable differences with regard to shoot and root traits. Root architecture was more affected by water stress than root morphological traits. The rate of root penetration in-depth for cv. Blancas was higher underwater-stressed (4.29 cm day−1) compared with well-watered conditions (2.91 cm day−1). In contrast, the rate of lateral expansion for cvs. Blancas, Klaxon and Sigalia was slower underwater-stressed (1.09, 0.81 and 1.25 cm day−1, respectively) compared with well-watered conditions (1.56, 2 and 1.95 cm day−1, respectively). For cv. Klaxon, the root: shoot ratio was greater underwater-stressed than under well-watered conditions. For cvs. Blancas, Ecudor, ES Mentor, Klaxon, Santana, Sigalia and Sultana, differences were observed in root angle1 (p < 0.01) between the two water regimes, average root angle 1 increasing from 49° to over 65° from well-watered to water-stressed, respectively. No impact of water-stressed during early growth was observed on root traits of cvs. Isidor and ES Pallador.

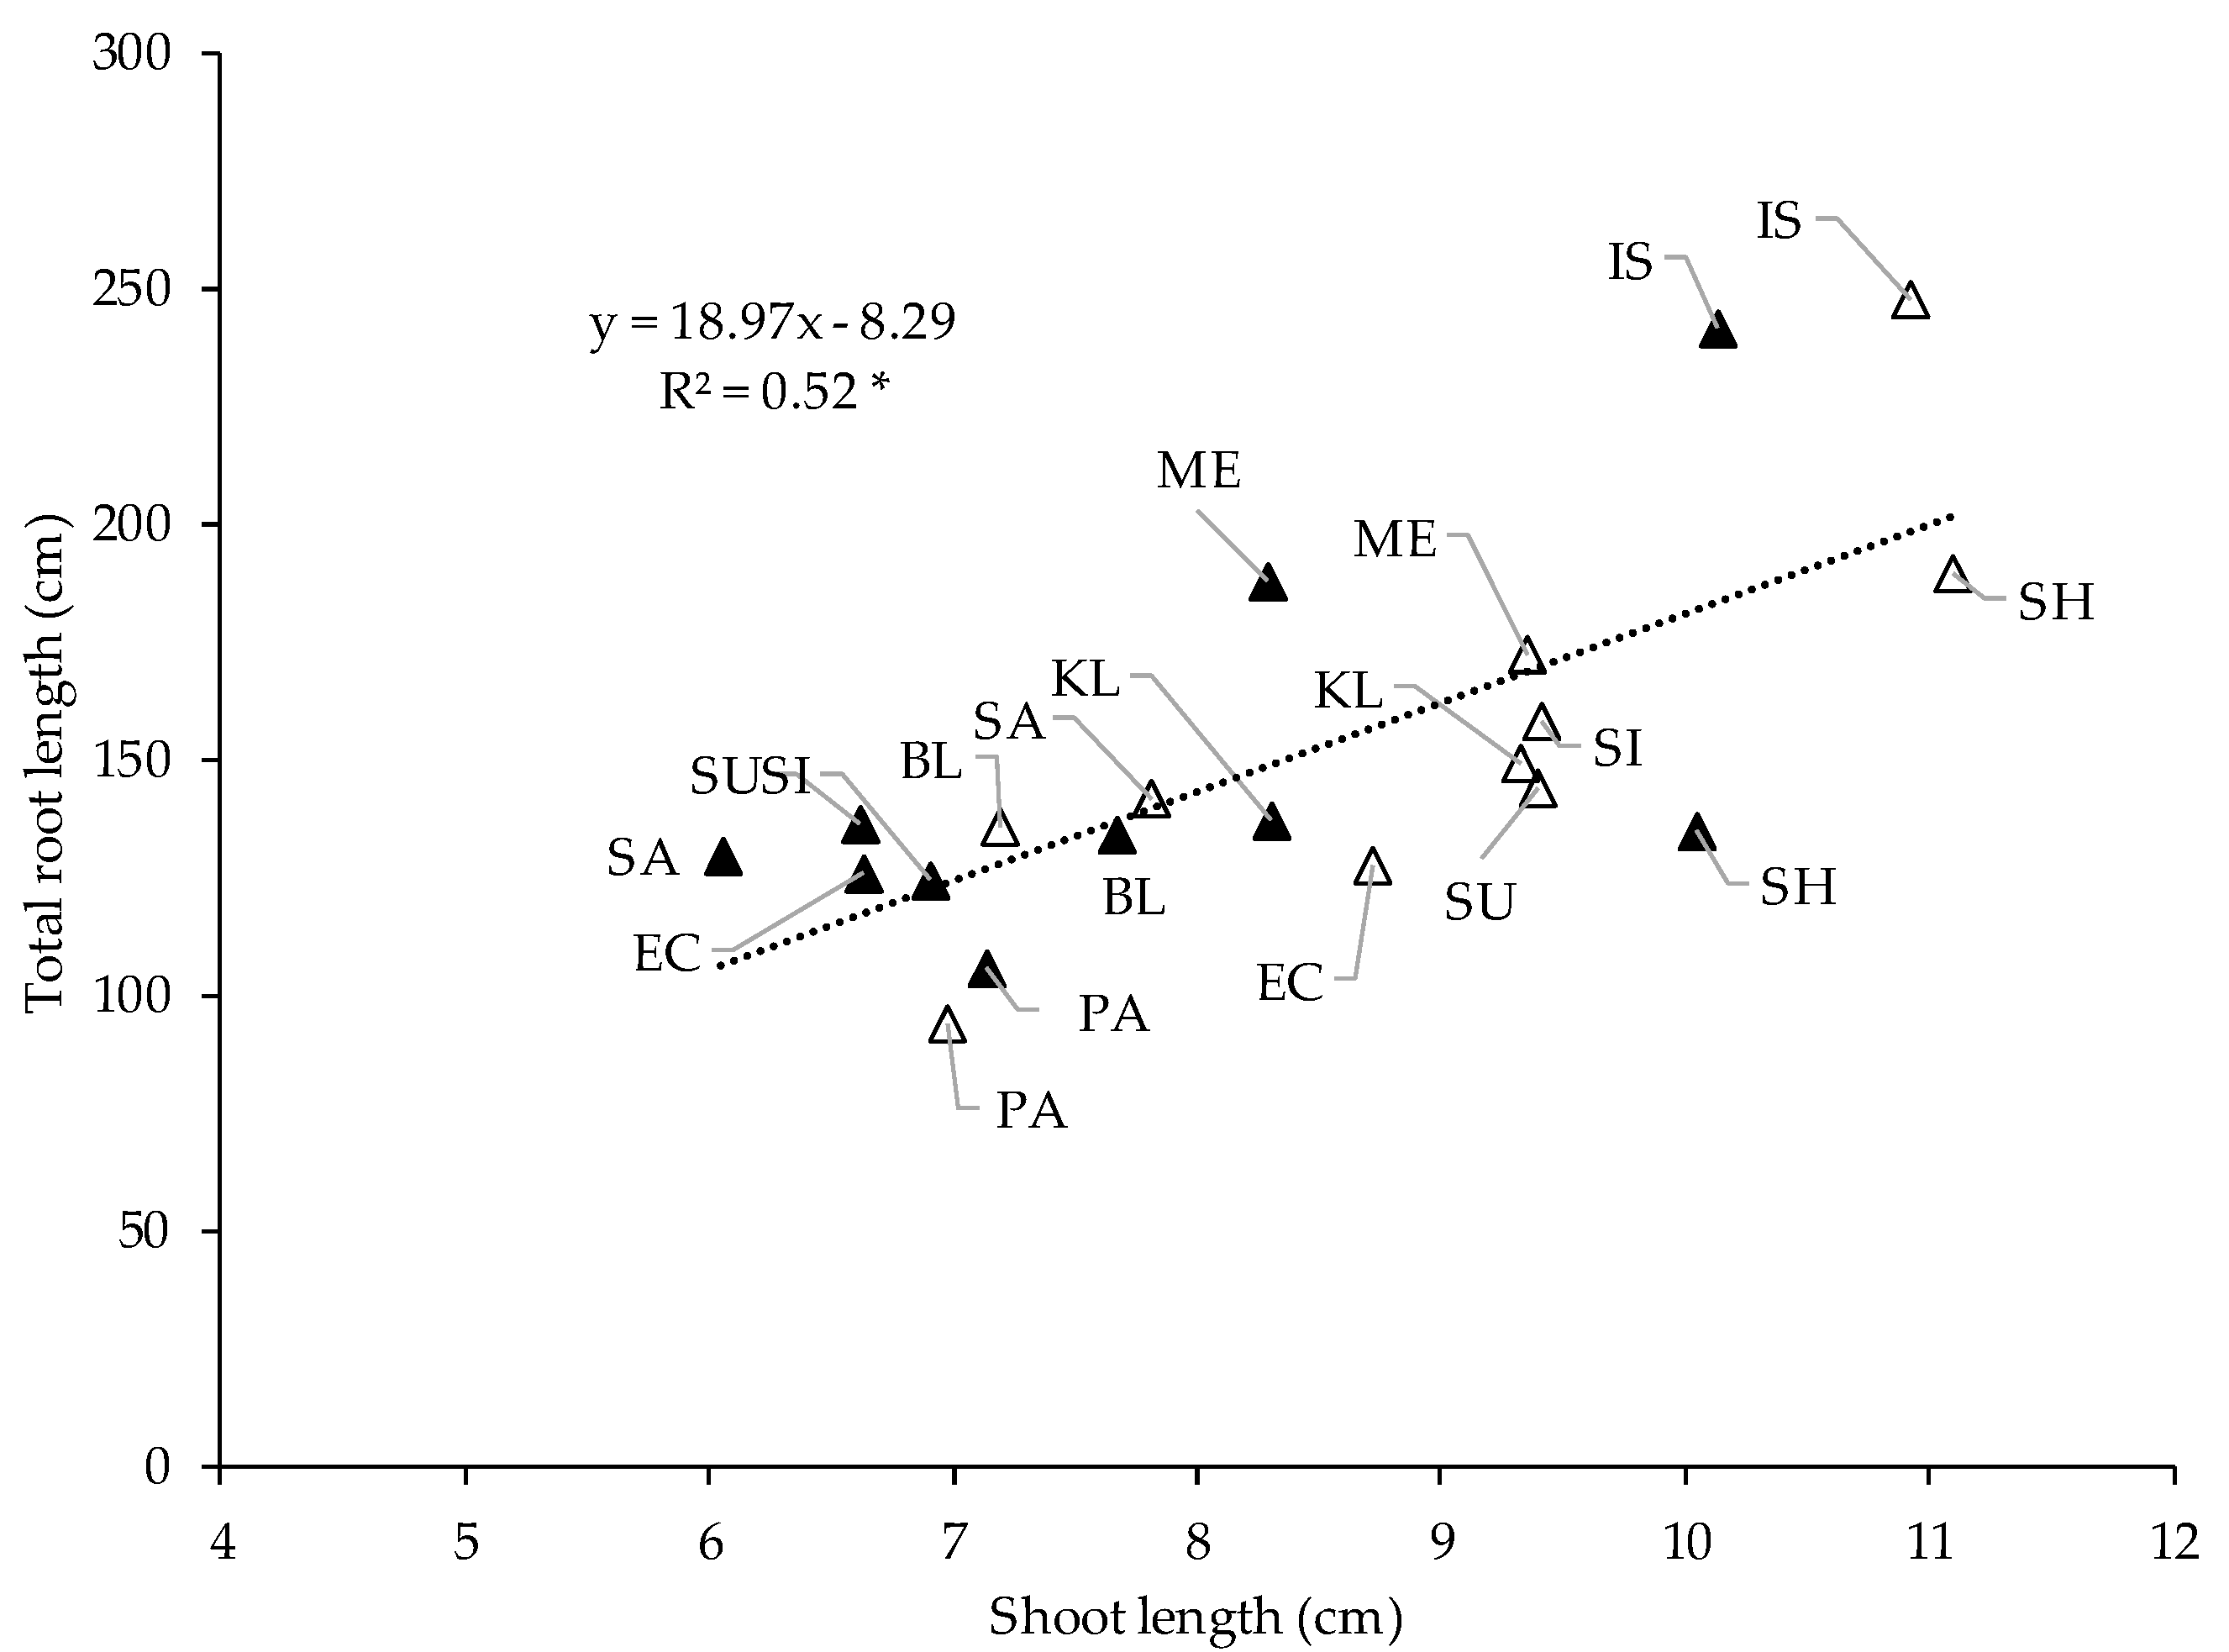
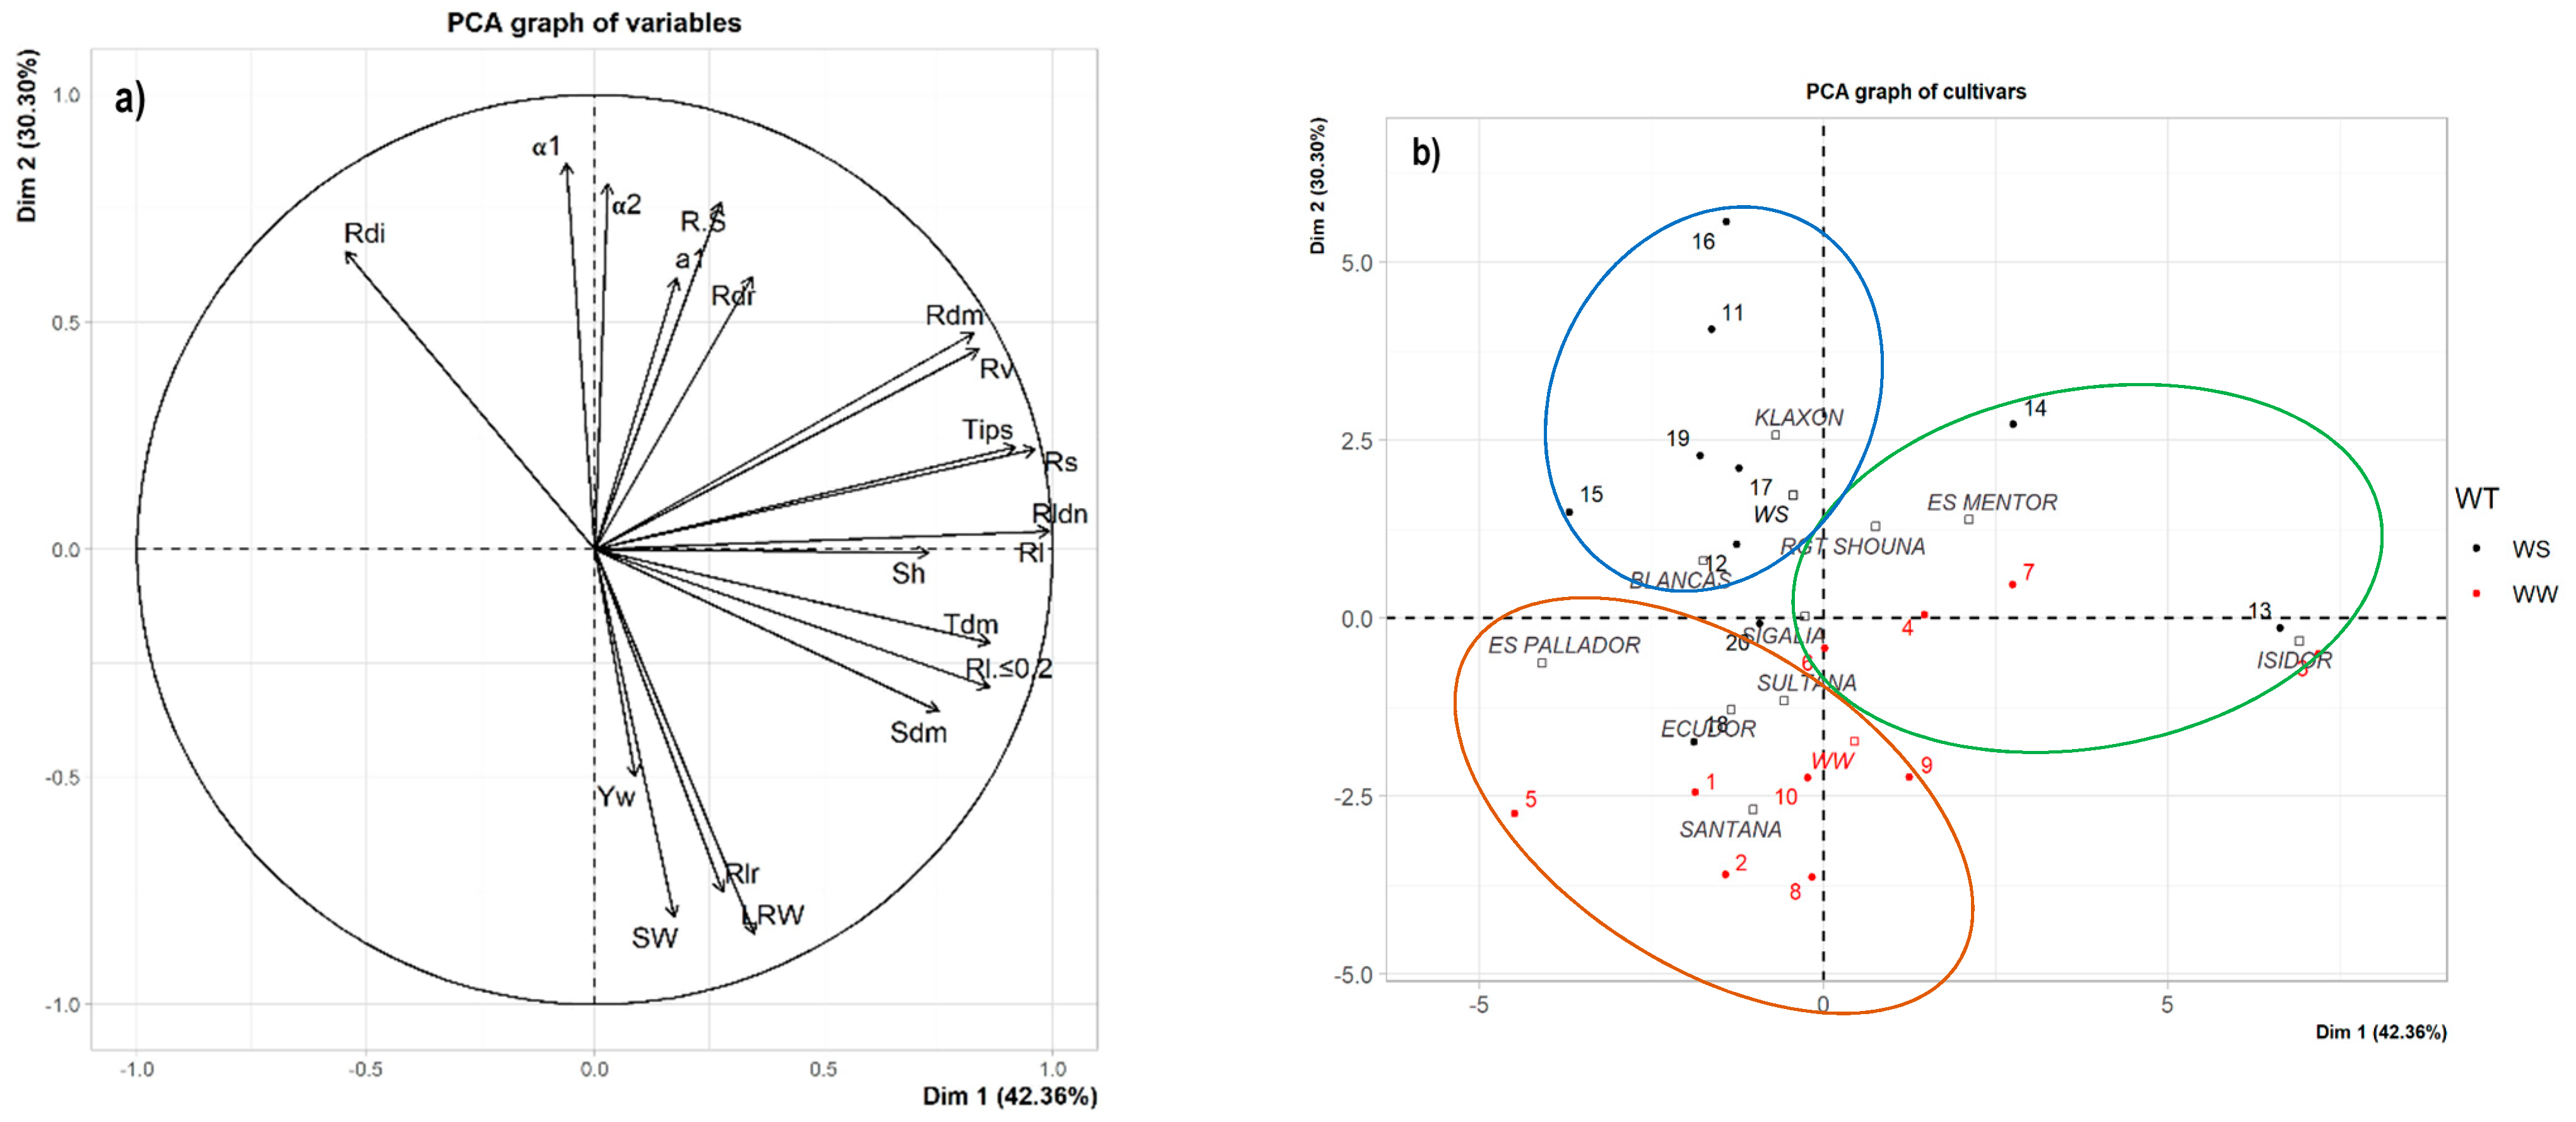
3.3. Relationships between Studied Traits during the Early Growth under Controlled Conditions

Regardless of soil moisture status, the total root length was positively correlated with shoot length (R2 = 0.52 *) (Figure 3), shoot and root dry matter as well as total dry matter (Table A4 and Table A5). No correlation was found between shoot and root dry matter independent of the soil moisture status. However, shoot dry matter was positively correlated with seed size (p < 0.001) and negatively correlated with root diameter (p < 0.01). Likewise, shoot dry matter was positively correlated with the rate of root penetration in-depth but only under well-watered conditions (R2 = 0.73 **). A positive correlation was found between seed size and total root length, but only underwater-stressed conditions (R2 = 0.63 *). Seed size was negatively correlated with average root diameter and positively correlated with the length of fine roots with a diameter ≤ of 0.2 mm in both soil moisture status (Table A4 and Table A5).
Most of the studied morpho-physiological traits were correlated with soybean cultivars represented by Dim 1 while root architectural traits were correlated with soil moisture status (WW and WS) represented by Dim 2 (Figure 4a). All the studied traits of 10 soybean cultivars grown under the two soil moisture status were included in a principal component analysis (PCA) (Figure 4) that captured 72.66% of the total variability. The first component (Dim 1, 42.36% of the variability) was mainly related to the cultivars represented by their morpho-physiological traits, while 30.30% of the variation, depicted by Dim 2, was mainly due to differences in soil moisture status. Most of the morpho-physiological traits (shoot and root) except the root diameter were positively correlated with most of the other root traits (Figure 4a).
The hierarchical clustering allowed to discriminate three groups of soybean cultivars according to early growth ability (or vigor seedling) (Figure 4b). Cv. Isidor showed a particular profile represented by the highest early and rapid development ability while cv. ES Pallador was characterized by the lowest growth. In addition, the other cultivars could belong to different groups according to soil moisture status.

3.4. Comparison of Two Contrasted Cultivars for Early Growth under Field Conditions

Canopy cover (CC) growth at 50–70 days after emergence (the R1 stage) was significantly higher (p < 0.001) for cv. Isidor vs. Santana, independent of sowing dates and years (Figure 5). The number of days since emergence to reach 50% CC was lower for cv. Isidor compared with that for cv. Santana: the difference of 4 to 6 days in conventional sowing and of 7 to 11 days in early sowing. The differences between cultivars were expressed by the canopy cover at emergence (CC0), which determines the subsequent canopy cover dynamics under field conditions, without significant cultivar difference for CGC (Table 4). Early sowing had a significant effect on both canopy cover at emergence (CC0) and canopy growth coefficient (CGC). The year effect was significant (p < 0.001) on the early growth of these two cultivars: CGC and shoot dry matter at R1 were significantly lower in 2013 compared to 2014, the number of days to reach the flowering stage was higher in 2013 due to lower temperatures (data not shown). Total shoot dry matter was significantly higher (p < 0.05) for cv. Isidor compared to that for Santana in 2013, as well as in 2014 under conventional sowing. Grain yield ranged from 43 to 51 q ha−1 and was similar for both cultivars and in both sowing dates over the two years.

4. Discussion

The novelty of this phenotyping study consists in characterization of the rooting system morphology and architecture of 10 soybean cultivars commonly grown in Europe with a significant difference among cultivars in terms of root and shoot traits under two contrasting soil moisture status during the early growth stage. The cultivars tested belonged to contrasted maturity groups (00, 000, I, II) and had different values of initial seed mass ranging from 168 (cv. Klaxon) to 248 mg (cv. Isidor) (Table 1). Our study showed a large variability among soybean cultivars for most investigated morpho-physiological traits regardless of the soil moisture status at ten das. However, no difference among cultivars was found in terms of root architectural traits, which were mainly affected by the water-stressed conditions. Previous studies showed a difference among cultivars in early root traits, such as the depth of taproot from 12 das in soybean [28,29]. A wide range of variability for root and shoot traits was found among the studied soybean cultivars in Table 2. Such a cultivar range was similarly observed for morphological root traits at the beginning of the flowering stage (42 das) for 49 soybean cultivars [47].

4.1. Shoot and Root Growth for Soybean Cultivars under Well-Watered Conditions

We found a significant difference among soybean cultivars for all morpho-physiological traits except for the average root diameter in 10 days-old seedlings under well-watered conditions. In general, cv. Isidor showed the highest values for most studied traits while cv. ES Pallador showed the lowest ones. As averaged for all studied cultivars, shoot dry matter was six times greater than root dry matter, which led to the low values of root: shoot ratio (0.17 to 0.19) (Table 2). Manavalan et al. (2010) found that shoot dry matter was two times greater than that of the root at 12 das as averaged for 34 soybean cultivars, but similar values were found later at 21 das. In our study, the relatively high dry matter of cotyledons at this very early stage (VE, VC) could explain the wide variation between the shoot and root dry matters. Root dry matter ranged from 13.78 (cv. ES Pallador) to 36.68 (cv. Isidor) mg per plant, with a variation rate of 166% under well-watered conditions. A previous study found a higher rate of variation than the one observed here for root dry matter of 34 soybean cultivars that reached 600% at 12 das [28]. Our results showed that the rate of variation for total root length was about 164%. During later stages, a higher value of variation rate of total root length was found, attending up to 200% for 49 soybean cultivars at the beginning of the flowering stage [47].
No difference was observed among the 10 soybean cultivars for root architectural traits in terms of the rate of both root penetration in depth and root lateral expansion at 10 das under well-watered conditions. The rate of root depth was linear and ranged from 2.91 (cv. Blancas) to 4.04 cm (cv. Isidor) per day for all the soybean cultivars. A similar value of depth penetration rate (2.26 cm day−1) under greenhouse conditions at 15 das was previously reported for soybean (cv. Protina) [20]. However, when cultivars were planted under field conditions, taproot elongation was found to be linear at a rate of 1.3 cm day−1 as averaged until the full-seed stage in soybean [48,49]. As a result, we observed that the rate of rooting depth could be variable as a function of different parameters such as cultivar, growing conditions, soil penetration resistance, soil temperature and moisture.
A significant difference was observed for root angle 1 (p < 0.05) among soybean cultivars under well-watered conditions. A previous study demonstrated a genetic variability for three soybean cultivars in terms of root angle at the flowering and mid-pod filling stage [50]. Although the difference among cultivars was found in this study, the values of root angle 1 were less than 60° and varied between 43° and 57°. When soybean cultivars had a root angle between 40° and 60°, they could belong to plant type C, which is characterized by an intermediate architecture between deep and shallow rooting systems [51]. In our study, all the cultivars could be classified into type C in relation to root angle trait under well-watered conditions.

4.2. Impact of Water-Stressed Conditions on Shoot and Root Growth

A slight impact of water-stressed conditions was observed on some morpho-physiological traits (shoot and total dry matter, shoot length, average root diameter, specific root surface, root length density and length of root with diameter ≤ 0.2 mm) (Table 3) during early growth for all cultivars. However, water stress mainly affected root architectural traits such as the rates of vertical and lateral root expansion, root angle 1 and the level of insertion of the longest lateral root on taproot in the soil. Indeed, all cultivars tended to increase their root angle 1 from 40° to more than 64° underwater-stressed conditions, but no difference among cultivars was found. In parallel, the rate of root lateral expansion was slower with a soil water deficit, which suggests that roots tended to grow in depth as an adaptive strategy to avoid drought. According to Zhao et al. (2004), plants that had a root angle greater than 60° (type B) showed a deeper rooting system underwater-stressed conditions and may be classified as good candidates for exploring soil and water uptake in the deeper soil layers [51].
Root angle determines the direction of distribution of root development, horizontal or vertical, in the soil and acts as an adaptive trait for drought avoidance in many crops such as wheat [52], sorghum [53] and rice [54]. In soybean, root angle was slightly increased in three cultivars after one month of drought compared with well-watered treatment, although the difference among cultivars was significant; deep (66°), shallow (25°) and intermediate (53°) root phenotypes [50]. However, this result was found during the later stages of the crop cycle from the flowering to the mid-pod filling stage under field conditions.
To the best of our knowledge, phenotypic screening for root angle and especially root angle adaptation under water-stressed conditions has never been reported at an earlier growth stage (10 das) in soybean cultivars. However, root angle was previously studied at the seedling stage in sorghum [55,56], wheat [57,58] and maize [59], and it was considered as an architectural root trait that could be involved in drought adaptation. Genes controlling root system architecture could be important targets for breeding strategies to improve drought tolerance in soybean [60].

4.3. Correlations among Root and Shoot Traits

Regardless of soil moisture status, the total root length was positively correlated with both shoot length and shoot dry matter (Figure 3, Table A4 and Table A5). Taller plants tend to develop a deeper root system, while shorter plants tend to develop a shallow root system [61]. However, the correlation between shoot and root length could be variable as a function of cultivar [28]. Thus, shoot length could serve as a proxy for root growth and its plasticity under drought in the field. Positive correlations were observed between thousand seed weight (TSW) and shoot dry matter, and TSW and total dry matter, irrespectively of the soil moisture status (Table A4 and Table A5). A previous study found that the smaller values of shoot and root dry matter might be associated with smaller seed size during early growth [28]. In contrast, another study found that seed size was not correlated with root traits in soybean cultivars at the flowering stage [47]. Our results showed that TSW was negatively correlated with average root diameter while it was positively correlated with the length of fine root (diameter ≤ 0.2 mm). This led to cultivars with greater seed mass (cv. Isidor) that tend to develop more fine roots than cultivars with smaller seed mass (cv. ES Pallador). Our results revealed that seed mass could be a useful trait in order to characterize the potential root development in soybean cultivars during early growth. However, seed mass for a single cultivar could be variable as a function of seed lots, which depend on the conditions experienced by the seed-producing plants and the postharvest conditions. Indeed, the seed mass for soybean seed lots used in our study was not consistent (data not shown) with the values reported from the technical institute, which is a critical factor that should be taken into account.
Shoot dry matter was positively correlated with total root length, root surface and fine root length with a diameter ≤ of 0.2 mm regardless of the soil moisture status. These correlations were previously observed [47] although at later growth stages (i.e., 42 das). Moreover, shoot dry matter was positively correlated with the rate of root penetration in-depth under well-watered conditions. Therefore, if soybean cultivars are able to accumulate more dry matter in the shoot during the early growth stage underwater-stressed conditions, the rooting system may be able to progress faster in-depth.
In our study, root angle 1 was negatively correlated with the root lateral expansion rate underwater-stressed conditions. Although no difference among cultivars was found in underwater-stressed conditions, a significant average angle increase of 16° for cvs. Blancas, Ecudor, ES Mentor, Klaxon, Santana, Sigalia and Sultana when submitted to soil water deficit. This result could suggest that root angle could be an adaptive trait in some cultivars under drought.

4.4. Soybean Ideotypes during Early Growth under Water-Stressed Conditions

Although Isidor and ES Pallador belonged to the same maturity group (MG I), they showed contrasting values of the studied traits under well-watered conditions. Indeed, Isidor was more vigorous as soon as seedling growth occurred and accumulated a root dry matter 3 times greater than did cv. ES Pallador at 10 das. We found that a cultivar belonging to the early maturity group (MG 000 to 0) did not show a seedling vigor greater than do cultivars belonging to the late maturity group (II). Early growth, which exhibited a significant difference among cultivars, did not follow any MG-related order. According to the genetic variability among soybean cultivars concerning traits, the 10 cultivars could be classified into three groups independent of the soil moisture status: (i) the first group, including cv. Isidor, which is characterized by good seedling vigor and the highest values for most studied shoot and root traits, (ii) a second one represented by cv. ES Pallador, which showed a weak growth and the lowest values of traits, and (iii) a third one, including the other cultivars that demonstrated an intermediate growth during early stages. A recent study showed that seedling root traits as the length of the taproot and the number of basal roots were significantly related to seed yield in common bean under abiotic stresses, including drought [62].
Differences in plant growth observed between cvs. Isidor (good vigor) and Santana (moderate vigor) in the early phase under controlled conditions were consistent with their growth under field conditions, as observed previously. This difference may be due to early root growth that was superior for Isidor. Such cultivar differences in shoot growth at emergence resulted in larger variations in the subsequent growth rate of the canopy cover. Canopy cover at an early stage is critical for radiation interception and biomass production. In our study, cultivar differences in vegetative cover rate were not systematically associated with differences in biomass at flowering, which is likely due to differences in the conversion efficiency of the intercepted radiation into shoot biomass [63]. Although a slight impact of water stress was found on early soybean growth and performance, all studied cultivars tended to show an adaptation, especially in terms of root architectural traits such as increasing root angle, the rate of root penetration in depth, deeper insertion of lateral root on taproot and decreasing the rate of root lateral expansion. As a consequence, it could be possible to design ideotypes in relation to studied traits to be adapted under drought (Figure 6). Such ideotypes had been previously identified in monocotyledons such as maize [64] that has a complex root system but not in soybean, which has a simple and an allorhizic root system consisting of a primary root (or taproot) and lateral roots [65]. Identifying these ideotypes by their rooting system among commercial soybean varieties seems crucial in the selection and recommendation of cultivars adapted for low-water–input cropping systems. The cultivar parameters evaluated in this study will contribute to the calibration of crop models (e.g., STICS; [66]) in order to predict the performance of such cultivars under various water regimes. Based on our findings, further field experiments are recommended to validate the intraspecific variability in root growth between the most contrasting cultivars (Isidor and ES Pallador) and related it to their potentially different responses to soil water deficit.

5. Conclusions

In summary, our study brought new insights into the characterization of root morpho-physiological and architectural traits of common soybean cultivars grown in Europe. We found a large variability among soybean cultivars for most shoot and root morpho-physiological traits regardless of the soil moisture status during early growth. However, no difference among the tested cultivars was found in terms of root architectural traits that are mainly affected by water-stressed conditions. The correlations among seed mass, root and shoot traits could be interesting in order to better understand the root development system. Our results also showed that canopy cover growth dynamic under field conditions is sensitive to early growth conditions at emergence that emphasizes the importance of early growth stage, especially that occurring during the heterotrophic phase. The results presented here confirm that early-stage phenotyping of root traits provides insights into the drought tolerance level of soybean cultivars. Root phenotyping by minirhizotron is a rapid, low-cost and adaptable method for controlled conditions, especially during early growth. Further experiments are required under field conditions with contrasting levels of water regimes to assess whether differences among cultivars can be observed and maintained at later growth stages and to show how shoot and root traits are affected by various soil and climate conditions.

Author Contributions

Conceptualization, P.D. and P.M.; methodology, E.D. and P.M.; validation, E.D., P.D. and P.M.; formal analysis, E.D. and P.M.; investigation, E.D.; resources, P.D. and P.M.; data curation, E.D.; writing—original draft preparation, E.D.; writing—review and editing, E.D., J.R.L., C.S., P.D. and P.M.; project administration, P.M.; funding acquisition, P.D. and P.M. All authors have read and agreed to the published version of the manuscript.

Funding

This work was partially funded by the “Sojamip” research project involving various partners (Euralis Semences, RAGT2n, Terres Inovia, Terres Univia, Toulouse INP-EIP Purpan, Toulouse INP-ENSAT, INRAE) and was a part of the collaborative “UMT Pactole” program associating most of the previous partners. The authors thank the Occitanie/Pyrénées-Méditerranée region and Terres Inovia for their financial support.

Institutional Review Board Statement

Not applicable.

Informed Consent Statement

Not applicable.

Data Availability Statement

The data presented in this study are available on request from the corresponding author.

Acknowledgments

The authors thank all partners of the “Sojamip” research project. Special thanks to Béatrice Quinquiry and other technicians of the Vasco research team, UMR AGIR, and those of Terres Inovia, Euralis Semences, and RAGT 2n seed companies for their kind support during this study, and Elie Maza for his expert advice in statistical analysis.

Conflicts of Interest

The authors declare no conflict of interest.

Appendix A

Figure A1. Volumetric soil water content (%) of well-watered (closed circles) and water-stressed (open circles) treatments for 10 days after sowing. Values are mean (n = 80) ± standard error.
Agronomy 11 00188 g0a1
Table A1. Number of replications within each set and for the two contrasting soil moisture status; well-watered (WW) or water-stressed (WS) conditions (experiment under controlled conditions).
Set 1Set 2
WWWSWWWS
Blancas4444
Ecudor3355
ES Mentor3355
ES Pallador3355
Isidor4454
Klaxon4455
RGT Shouna4455
Santana4444
Sigalia4345
Sultana3454
Table A2. Shoot and root morpho-physiological and root architectural traits for the phenotyping methods.
Type of traitsVariable
Morpho-physiological traits (shoot or root)Average root diameter (mm)
Length of roots with diameter ≤ 0.2 mm (cm)
Length of roots with diameter between 0.2 and 0.4 mm (cm)
Length of roots with diameter between 0.4 and 0.6 mm (cm)
Length of roots with diameter between 0.6 and 0.8 mm (cm)
Length of roots with diameter between 0.8 and 1 mm (cm)
Length of roots with diameter between 1 and 2 mm (cm)
Length of roots with diameter between 2 and 3 mm (cm)
Root dry matter (mg)
Root length density (cm cm−3)
Root surface area (cm2)
Root: shoot ratio (mg/mg)
Root tips number
Root volume (cm3)
Shoot length (cm)
Shoot dry matter (mg)
Specific root length (cm mg−1)
Specific root surface (cm2 mg−1)
Total dry matter (mg)
Total root length (cm)
Plant water potential (MPa)
Architectural traits (root)Distance from soil to longest lateral root insertion on taproot (cm)
Root angle 1 (°)
Root angle 2 (°)
Root lateral expansion rate (cm day−1)
Root penetration rate in depth (cm day−1)
Figure A2. Diagram representing soil sampling from 12 squares a minirhizotron (24.5 × 24.5 × 2.5) cm. Values of volumetric soil water content (%) (mean (n = 3) ± standard error).
Agronomy 11 00188 g0a2
Table A3. A comparison of root architectural traits in ten soybean cultivars under well-watered and water-stressed conditions.
CultivarsRoot Lateral Expansion Rate (cm day−1)Root Penetration Rate in Depth (cm day−1)Distance from Soil to Longest Lateral Root Insertion on Taproot (cm)Root Angle 2 (°)
Well-watered conditions
Blancas1.65 ± 0.152.91 ± 0.401.28 ± 0.6135.35 ± 3.71
Ecudor1.97± 0.303.20 ± 0.481.35 ± 0.7433.18 ± 2.93
ES Mentor1.74 ± 0.313.66 ± 0.422.59 ± 0.6537.52 ± 5.24
ES Pallador1.50 ± 0.293.50 ± 0.482.58 ± 0.5436.06 ± 4.12
Isidor1.94 ± 0.334.04 ± 0.411.87 ± 0.5543.01 ± 2.86
Klaxon2.00 ± 0.293.87 ± 0.341.23 ± 0.3744.21 ± 4.46
RGT Shouna1.74 ± 0.213.19 ± 0.472.20 ± 0.9246.37 ± 4.90
Santana2.08 ± 0.303.52 ± 0.321.43 ± 0.3632.04 ± 4.27
Sigalia1.95 ± 0.223.87 ± 0.371.69 ± 0.5042.24 ± 4.49
Sultana1.44 ± 0.233.79 ± 0.512.09 ± 1.0446.74 ± 5.31
SignificanceNSNSNSNS
Water-stressed conditions
Blancas1.09 ± 0.194.29 ± 0.303.33 ± 1.1548.69 ± 5.30
Ecudor1.44 ± 0.233.67 ± 0.484.03 ± 1.2040.49 ± 6.36
ES Mentor1.21 ± 0.214.00 ± 0.405.22 ± 1.5545.97 ± 4.04
ES Pallador1.39 ± 0.333.83 ± 0.242.64 ± 0.7847.53 ± 4.59
Isidor1.39 ± 0.234.84 ± 0.224.49 ± 1.2241.48 ± 2.72
Klaxon0.81 ± 0.164.67 ± 0.314.19 ± 1.4951.90 ± 6.53
RGT Shouna1.17 ± 0.183.79 ± 0.321.86 ± 0.8447.65 ± 7.56
Santana1.45 ± 0.263.66 ± 0.481.94 ± 0.7143.23 ± 6.38
Sigalia1.25 ± 0.203.97 ± 0.292.32 ± 0.6649.08 ± 5.03
Sultana1.06 ± 0.224.13 ± 0.344.45 ± 1.0240.31 ± 3.90
SignificanceNSNSNSNS
NS: not significant.
Table A4. Correlation between traits under well-watered conditions.
Root Dry Matter (mg)Root: Shoot RatioShoot Dry Matter (mg)Total Dry Matter (mg)Plant Water Potential (MPa)Average Root Diameter (mm)Length of Roots with Diameter ≤ 0.2 mm (cm)Root Length Density (cm cm−3)Root Surface Area (cm2)Root Tips NumberRoot Volume (cm3)Shoot Length (cm)Specific Root Length (cm mg−1)Specific Root Surface (cm2 mg−1)Total Root Length (cm)Distance from Soil to Longest Lateral Root Insertion on Tap Root (cm)Root Angle 1 (°)Root Angle 2 (°)Root Lateral Expansion Rate (cm day−1)Root Penetration Rate in Depth (cm day−1)Thousand Seed Weight (g)
Root dry matter (mg)1
Root: shoot ratio0.83 ***1
Shoot dry matter (mg)0.50−0.071
Total dry matter (mg)0.69 *0.170.97 ***1
Plant water potential (MPa)−0.210.05−0.41−0.41
Average root diameter (mm)−0.040.47−0.77 **−0.65 *0.041
Length of roots with diameter ≤ 0.2 mm (cm)0.89 ***0.560.70 *0.83 ***−0.16−0.41
Root length density (cm cm−3)0.95 ***0.66 *0.67 *0.84 ***−0.24−0.270.95 ***1
Root surface area (cm2)0.97 ***0.74 **0.60 *0.77 **−0.27−0.110.91 ***0.99 ***1
Root tips number0.89 ***0.62 *0.67 *0.81 ***−0.23−0.230.93 ***0.95 ***0.95 ***1
Root volume (cm3)0.97 ***0.82 **0.470.66 *−0.280.080.84 ***0.93 ***0.98 ***0.91 ***1
Shoot length (cm)0.79 **0.61 *0.530.66 *−0.280.040.71 **0.84 ***0.89 ***0.85 ***0.91 ***1
Specific root length (cm mg−1)−0.57−0.75 **0.190.000.11−0.53−0.20−0.31−0.41−0.23−0.51−0.231
Specific root surface (cm2 mg−1)−0.67 *−0.67 *−0.09−0.260.01−0.11−0.45−0.47−0.49−0.36−0.52−0.160.88 ***1
Total root length (cm)0.95 ***0.66 *0.69 *0.84 ***−0.24−0.270.95 ***1.000.99 ***0.95 ***0.93 ***0.84 ***−0.31−0.471
Distance from soil to longest lateral root insertion on tap root (cm)0.060.030.000.020.240.03−0.070.060.07−0.050.070.16−0.09−0.040.061
Root angle 1 (°)0.180.120.110.150.000.090.090.250.270.180.280.44−0.040.080.250.84 ***1
Root angle 2 (°)0.390.290.300.36−0.310.130.310.490.530.500.540.74 **−0.030.140.490.220.68 *1
Root lateral expansion rate (cm day−1)0.360.210.330.37−0.45−0.070.440.320.340.450.360.22−0.20−0.260.32−0.61 *−0.57−0.231
Root penetration rate in depth (cm day−1)0.28−0.190.73 **0.68 *−0.73 **−0.430.390.420.390.380.320.430.100.030.420.170.410.470.221
Thousand Seed Weight (g)0.34−0.180.88 ***0.83 ***−0.23−0.84 ***0.59 *0.530.420.470.280.340.360.030.53−0.01−0.08−0.020.290.511
“*”, “**”, “***” indicate that a regression is significant at p < 0.05, p < 0.01, p < 0.001, respectively, according to table proposed by Fisher and Yates (1938) [46].
Table A5. Correlation between traits underwater-stressed conditions.
Root Dry Matter (mg)Root: Shoot RatioShoot Dry Matter (mg)Total Dry Matter (mg)Plant Water Potential (MPa)Average Root Diameter (mm)Length of Roots with Diameter ≤ 0.2 mm (cm)Root Length Density (cm cm−3)Root Surface Area (cm2)Root Tips NumberRoot Volume (cm3)Shoot Length (cm)Specific Root Length (cm mg−1)Specific Root Surface (cm2 mg−1)Total Root Length (cm)Distance from Soil to Longest Lateral Root Insertion on tap root (cm)Root Angle 1 (°)Root Angle 2 (°)Root Lateral Expansion Rate (cm day−1)Root Penetration Rate in Depth (cm day−1)Thousand Seed Weight (g)
Root dry matter (mg)1
Root: shoot ratio0.63 *1
Shoot dry matter (mg)0.28−0.551
Total dry matter (mg)0.45−0.390.98 ***1
Plant water potential (MPa)−0.01−0.220.240.231
Average root diameter (mm)−0.210.39−0.69 *−0.69 *−0.66 *1
Length of roots with diameter ≤ 0.2 mm (cm)0.31−0.280.71 **0.72 **0.64 *−0.88 ***1
Root length density (cm cm−3)0.78 **0.090.71 **0.80 **0.39−0.69 *0.74 **1
Root surface area (cm2)0.90 ***0.290.60 *0.72 **0.24−0.490.58 *0.97 ***1
Root tips number0.85 ***0.250.59 *0.71 **0.35−0.64 *0.70 *0.94 ***0.94 ***1
Root volume (cm3)0.95 ***0.530.370.52−0.01−0.120.300.79 **0.92 ***0.80 **1
Shoot length (cm)0.74 **0.540.090.230.10−0.250.260.65 *0.69 **0.63 *0.66 *1
Specific root length (cm mg−1)0.05−0.62 *0.82 **0.77 **0.60 *−0.87 ***0.87 **0.64 *0.450.500.110.101
Specific root surface (cm2 mg−1)−0.06−0.70 *0.80 **0.73 **0.52−0.69 *0.71 **0.550.380.360.080.000.95 ***1
Total root length (cm)0.78 **0.090.71 **0.80 **0.39−0.69 *0.74 **1.000.97 ***0.94 ***0.79 **0.65 *0.64 *0.551
Distance from soil to longest lateral root insertion on tap root (cm)0.60 *0.260.340.430.26−0.350.530.58 *0.60 *0.68 **0.570.160.220.090.58 *1
Root angle 1 (°)0.370.58 *−0.32−0.23−0.380.39−0.37−0.060.090.060.310.00−0.60 *−0.64 *−0.060.551
Root angle 2 (°)0.170.61 *−0.62 *−0.55−0.64 *0.70 *−0.84 ***−0.32−0.13−0.260.130.19−0.80 **−0.71 *−0.32−0.290.531
Root lateral expansion rate (cm day−1)−0.27−0.61*0.470.390.27−0.200.340.110.020.03−0.09−0.200.560.69 *0.11−0.27−0.81 **−0.571
Root penetration rate in depth (cm day−1)0.65 *0.360.260.360.02−0.190.230.64 *0.69 *0.500.68 *0.530.140.110.64 *0.530.480.17−0.491
Thousand Seed Weight (g)0.20−0.59 *0.97 ***0.94 ***0.31−0.69 *0.76 **0.63 *0.510.520.29−0.030.83 ***0.80 **0.63 *0.35-0.36−0.74 **0.520.191
“*”, “**”, “***” indicate that a regression is significant at p < 0.05, p < 0.01, p < 0.001, respectively, according to table proposed by Fisher and Yates (1938) [46].

References

  1. European Commission. Report Form the Commission to the Council and the European Parliament on the Development of Plant Proteins in the European Union; European Commission: Brussels, Belgium, 2018; pp. 1–15. [Google Scholar]
  2. Labalette, F.; Bourrel, C.; Jouffret, P.; Lecomte, V.; Quinsac, A.; Ledoux, S. Panorama et Futur de La Filière Du Soja Français. Oléagineux Corps Gras Lipides 2010, 17, 345–355. [Google Scholar] [CrossRef] [Green Version]
  3. Specht, J.E.; Hume, D.J.; Kumudini, S.V. Soybean Yield Potential-A Genetic and Physiological Perspective Yield ImProvement in Retrospect. Crop Sci. 1999, 39, 1560–1570. [Google Scholar] [CrossRef]
  4. Meckel, L.; Egli, D.B.; Phillips, R.E.; Radcliffe, D.; Leggett, J.E. Effect of Moisture Stress on Seed Growth in Soybeans1. Agron. J. 1984, 76, 647–650. [Google Scholar] [CrossRef]
  5. Maury, P.; Andrianasolo, F.N.; Alric, F.; Berger, M.; Beugniet, G.; Chambert, C.; Champolivier, L.; Doumenc, A.; Estragnat, A.; Gras, A.; et al. Le Semis Très Précoce: Une Stratégie Agronomique Pour Améliorer Les Performances Du Soja En France? OCL Oilseeds Fats 2015, 22. [Google Scholar] [CrossRef]
  6. Blum, A. Effective Use of Water (EUW) and Not Water-Use Efficiency (WUE) Is the Target of Crop Yield Improvement under Drought Stress. Field Crop. Res. 2009, 112, 119–123. [Google Scholar] [CrossRef]
  7. Thorup-Kristensen, K. Are Differences in Root Growth of Nitrogen Catch Crops Important for Their Ability to Reduce Soil Nitrate-N Content, and How Can This Be Measured? Plant Soil 2001, 230, 185–195. [Google Scholar] [CrossRef]
  8. Hunt, J.R.; Lilley, J.M.; Trevaskis, B.; Flohr, B.M.; Peake, A.; Fletcher, A.; Zwart, A.B.; Gobbett, D.; Kirkegaard, J.A. Early Sowing Systems Can Boost Australian Wheat Yields despite Recent Climate Change. Nat. Clim. Chang. 2019, 9, 244–247. [Google Scholar] [CrossRef]
  9. Lynch, J. Root Architecture and Plant Productivity. Plant Physiol. 1995, 109, 7–13. [Google Scholar] [CrossRef] [PubMed]
  10. Turner, N.C.; Wright, G.C.; Siddique, K.H.M. Adaptation of Grain Legumes (Pulses) to Water-Limited Environments. Adv. Agron. 2001, 71, 193–231. [Google Scholar]
  11. Battisti, R.; Sentelhas, P.C. Improvement of Soybean Resilience to Drought through Deep Root System in Brazil. Agron. J. 2017, 109, 1612–1622. [Google Scholar] [CrossRef]
  12. Han, E.; Dresbøll, D.B.; Thorup-Kristensen, K. Core-Labelling Technique (CLT): A Novel Combination of the Ingrowth-Core Method and Tracer Technique for Deep Root Study. Plant Methods 2020, 16, 84. [Google Scholar] [CrossRef] [PubMed]
  13. Svane, S.F.; Jensen, C.S.; Thorup-Kristensen, K. Construction of a Large-Scale Semi-Field Facility to Study Genotypic Differences in Deep Root Growth and Resources Acquisition. Plant Methods 2019, 15, 26. [Google Scholar] [CrossRef] [PubMed] [Green Version]
  14. Zhu, J.; Ingram, P.A.; Benfey, P.N.; Elich, T. From Lab to Field, New Approaches to Phenotyping Root System Architecture. Curr. Opin. Plant Biol. 2011, 14, 310–317. [Google Scholar] [CrossRef] [PubMed]
  15. Boiffin, J.; Durr, C.; Fleury, A.; Maillet, I.; Marin-Laflèche, A. Analysis of the Variability of Sugar Beet (Beta Vulgaris L) Growth during the Early Stages. I. Influence of Various Conditions on Crop Establishment. Agronomie 2007, 12, 515–525. [Google Scholar] [CrossRef] [Green Version]
  16. Fayaud, B.; Coste, F.; Corre-Hellou, G.; Gardarin, A.; Dürr, C. Modelling Early Growth under Different Sowing Conditions: A Tool to Predict Variations in Intercrop Early Stages. Eur. J. Agron. 2014, 52, 180–190. [Google Scholar] [CrossRef]
  17. Lamichhane, J.R.; Constantin, J.; Schoving, C.; Maury, P.; Debaeke, P.; Aubertot, J.N.; Dürr, C. Analysis of Soybean Germination, Emergence, and Prediction of a Possible Northward Establishment of the Crop under Climate Change. Eur. J. Agron. 2020, 113. [Google Scholar] [CrossRef]
  18. Lamichhane, J.R.; Aubertot, J.-N.; Champolivier, L.; Debaeke, P.; Maury, P. Combining Experimental and Modeling Approaches to Understand Genotype x Sowing Date x Environment Interaction Effects on Emergence Rates and Grain Yield of Soybean. Front. Plant Sci. 2020, 11. [Google Scholar] [CrossRef]
  19. Andersen, M.K.; Hauggaard-Nielsen, H.; Weiner, J.; Jensen, E.S. Competitive Dynamics in Two- and Three-Component Intercrops. J. Appl. Ecol. 2007, 44, 1556. [Google Scholar] [CrossRef]
  20. Dayoub, E.; Naudin, C.; Piva, G.; Shirtliffe, S.J.; Fustec, J.; Corre-Hellou, G. Traits Affecting Early Season Nitrogen Uptake in Nine Legume Species. Heliyon 2017, 3, e00244. [Google Scholar] [CrossRef] [Green Version]
  21. Manavalan, L.P.; Guttikonda, S.K.; Phan Tran, L.S.; Nguyen, H.T. Physiological and Molecular Approaches to Improve Drought Resistance in Soybean. Plant Cell Physiol. 2009, 50, 1260–1276. [Google Scholar] [CrossRef] [Green Version]
  22. Thu, N.B.A.; Nguyen, Q.T.; Hoang, X.L.T.; Thao, N.P.; Tran, L.-S.P. Evaluation of Drought Tolerance of the Vietnamese Soybean Cultivars Provides Potential Resources for Soybean Production and Genetic Engineering. Biomed Res. Int. 2014, 2014. [Google Scholar] [CrossRef] [PubMed] [Green Version]
  23. Hirasawa, T.; Tanaka, K.; Miyamoto, D.; Takei, M.; Ishihara, K. Effects of Pre-Flowering Soil Moisture Deficits on Dry Matter Production and Ecophysiological Characteristics in Soybean Plants under Drought Conditions during Grain Filling. Jpn. J. Crop Sci. 1994, 63, 721–730. [Google Scholar] [CrossRef] [Green Version]
  24. Carton, N.; Naudin, C.; Piva, G.; Baccar, R.; Corre-Hellou, G. Differences for Traits Associated with Early N Acquisition in a Grain Legume and Early Complementarity in Grain Legume-Triticale Mixtures. AoB Plants 2018, 10. [Google Scholar] [CrossRef] [PubMed] [Green Version]
  25. Chen, Y.L.; Dunbabin, V.M.; Diggle, A.J.; Siddique, K.H.M.; Rengel, Z. Assessing Variability in Root Traits of Wild Lupinus Angustifolius Germplasm: Basis for Modelling Root System Structure. Plant Soil 2012, 354, 141–155. [Google Scholar] [CrossRef]
  26. McPhee, K. Variation for Seedling Root Architecture in the Core Collection of Pea Germplasm. Crop Sci. 2005, 45, 1758–1763. [Google Scholar] [CrossRef]
  27. Lynch, J.; van Beem, J.J. Growth and Architecture of Seedling Roots of Common Bean Genotypes. Crop Sci. 1993, 33, 1253–1257. [Google Scholar] [CrossRef]
  28. Manavalan, L.P.; Guttikonda, S.K.; Nguyen, V.T.; Shannon, J.G.; Nguyen, H.T. Evaluation of Diverse Soybean Germplasm for Root Growth and Architecture. Plant Soil 2010, 330, 503–514. [Google Scholar] [CrossRef]
  29. Matsuo, N.; Takahashi, M.; Fukami, K.; Tasaka, K.; Tsuchiya, S. Root Growth of Two Soybean [ Glycine Max (L.) Merr.] Cultivars Grown under Different Groundwater Level Conditions. Plant Prod. Sci. 2013, 16, 374–382. [Google Scholar] [CrossRef] [Green Version]
  30. Boote, K.J. Improving Soybean Cultivars to Climate Change an Variability—Chaptitre 17; John Willey and Sons: Chichester, West Sussex, UK, 2011. [Google Scholar]
  31. Martre, P.; Quilot-Turion, B.; Luquet, D.; Memmah, M.-M.O.-S.; Chenu, K.; Debaeke, P. Chapter 14—Model-Assisted Phenotyping and Ideotype Design; Sadras, V.O., Calderini, D.F.B.T.-C.P., Eds.; Academic Press: San Diego, CA, USA, 2015; pp. 349–373. [Google Scholar]
  32. Lynch, J.P. Root Phenes for Enhanced Soil Exploration and Phosphorus Acquisition: Tools for Future Crops. Plant Physiol. 2011, 156, 1041–1049. [Google Scholar] [CrossRef] [Green Version]
  33. Lynch, J.P.; Brown, K.M. Topsoil Foraging—An Architectural Adaptation of Plants to Low Phosphorus Availability. Plant Soil 2001, 237, 225–237. [Google Scholar] [CrossRef]
  34. Richardson, A.E.; Lynch, J.P.; Ryan, P.R.; Delhaize, E.; Smith, F.A.; Smith, S.E.; Harvey, P.R.; Ryan, M.H.; Veneklaas, E.J.; Lambers, H.; et al. Plant and Microbial Strategies to Improve the Phosphorus Efficiency of Agriculture. Plant Soil 2011, 349, 121–156. [Google Scholar] [CrossRef]
  35. Wang, X.; Yan, X.; Liao, H. Genetic Improvement for Phosphorus Efficiency in Soybean: A Radical Approach. Ann. Bot. 2010, 106, 215–222. [Google Scholar] [CrossRef] [PubMed]
  36. Schoving, C.; Stöckle, C.O.; Colombet, C.; Champolivier, L.; Debaeke, P.; Maury, P. Combining Simple Phenotyping and Photothermal Algorithm for the Prediction of Soybean Phenology: Application to a Range of Common Cultivars Grown in Europe. Front. Plant Sci. 2020, 10. [Google Scholar] [CrossRef] [PubMed] [Green Version]
  37. Böhm, W.; Maduakor, H.; Taylor, H.M. Comparison of Five Methods for Characterizing Soybean Rooting Density and Development1. Agron. J. 1977, 69, 415. [Google Scholar] [CrossRef]
  38. Fehr, W.R.; Caviness, C.E. Stages of Soybean Development; Special Report 80; Iowa State University, Agricultural and Home Economics Experiment Station: Ames, IA, USA, 1977. [Google Scholar]
  39. Terres Inovia. myVar-Web Links. Available online: http://www.myvar.fr/ (accessed on 16 December 2020).
  40. Ao, J.; Fu, J.; Tian, J.; Yan, X.; Liao, H. Genetic Variability for Root Morph-Architecture Traits and Root Growth Dynamics as Related to Phosphorus Efficiency in Soybean. Funct. Plant Biol. 2010, 37, 304–312. [Google Scholar] [CrossRef]
  41. Lynch, J.P.; Brown, K.M. New Roots for Agriculture: Exploiting the Root Phenome. Philos. Trans. R. Soc. B Biol. Sci. 2012, 367, 1598–1604. [Google Scholar] [CrossRef]
  42. ImageJ Free Software. Available online: https://imagej.nih.gov/ij/ (accessed on 18 December 2020).
  43. Steduto, P.; Hsiao, T.C.; Raes, D.; Fereres, E. AquaCrop—The FAO Crop Model to Simulate Yield Response to Water: I. Concepts and Underlying Principles. Agron. J. 2009, 101, 426–437. [Google Scholar] [CrossRef] [Green Version]
  44. R Core. A Language and Environment for Statistical Computing; R Foundation for Statistical Computing: Vienna, Austria, 2014. [Google Scholar]
  45. Lê, S.; Josse, J.; Rennes, A.; Husson, F. FactoMineR: An R Package for Multivariate Analysis. JSS J. Stat. Softw. 2008, 25, 1–18. [Google Scholar]
  46. Fisher, R.A.; Yates, F. Statistical Tables for Biological, Agricultural Aad Medical Research; Oliver and Boyd: London, UK, 1938; p. 90. [Google Scholar]
  47. Fried, H.G.; Narayanan, S.; Fallen, B. Characterization of a Soybean (Glycine Max, L. Merr.) Germplasm Collection for Root Traits. PLoS ONE 2018, 13. [Google Scholar] [CrossRef] [Green Version]
  48. Torrion, J.A.; Setiyono, T.D.; Cassman, K.G.; Ferguson, R.B.; Irmak, S.; Specht, J.E. Soybean Root Development Relative to Vegetative and Reproductive Phenology. Agron. J. 2012, 104, 1702–1709. [Google Scholar] [CrossRef] [Green Version]
  49. Kaspar, T.C.; Taylor, H.M.; Shibles, R.M. Taproot-Elongation Rates of Soybean Cultivars in the Glasshouse and Their Relation to Field Rooting Depth1. Crop Sci. 1984, 24, 916–920. [Google Scholar] [CrossRef]
  50. Fenta, B.; Barlow, K.; Burridge, J.; Lynch, J.; Beebe, S.; Foyer, C.; Kunert, K. Field Phenotyping of Soybean Roots for Drought Stress Tolerance. Agronomy 2014, 4, 418–435. [Google Scholar] [CrossRef] [Green Version]
  51. Zhao, J. Characterization of Root Architecture in an Applied Core Collection for Phosphorus Efficiency of Soybean Germplasm. Chinese Sci. Bull. 2004, 49, 1611–1620. [Google Scholar] [CrossRef]
  52. Christopher, J.; Christopher, M.; Jennings, R.; Jones, S.; Fletcher, S.; Borrell, A.; Manschadi, A.M.; Jordan, D.; Mace, E.; Hammer, G. QTL for Root Angle and Number in a Population Developed from Bread Wheats (Triticum Aestivum) with Contrasting Adaptation to Water-Limited Environments. Theor. Appl. Genet. 2013, 126, 1563–1574. [Google Scholar] [CrossRef] [PubMed]
  53. Mace, E.S.; Singh, V.; van Oosterom, E.J.; Hammer, G.L.; Hunt, C.H.; Jordan, D.R. QTL for Nodal Root Angle in Sorghum (Sorghum Bicolor, L. Moench) Co-Locate with QTL for Traits Associated with Drought Adaptation. Theor. Appl. Genet. 2012, 124, 97–109. [Google Scholar] [CrossRef] [Green Version]
  54. Uga, Y.; Sugimoto, K.; Ogawa, S.; Rane, J.; Ishitani, M.; Hara, N.; Kitomi, Y.; Inukai, Y.; Ono, K.; Kanno, N.; et al. Control of Root System Architecture by DEEPER ROOTING 1 Increases Rice Yield under Drought Conditions. Nat. Genet. 2013, 45, 1097–1102. [Google Scholar] [CrossRef]
  55. Joshi, D.C.; Singh, V.; Hunt, C.; Mace, E.; van Oosterom, E.; Sulman, R.; Jordan, D.; Hammer, G. Development of a Phenotyping Platform for High Throughput Screening of Nodal Root Angle in Sorghum. Plant Methods 2017, 13, 287–299. [Google Scholar] [CrossRef] [Green Version]
  56. Singh, V.; van Oosterom, E.J.; Jordan, D.R.; Hunt, C.H.; Hammer, G.L. Genetic Variability and Control of Nodal Root Angle in Sorghum. Crop Sci. 2011, 51. [Google Scholar] [CrossRef]
  57. Manschadi, A.M.; Hammer, G.L.; Christopher, J.T.; DeVoil, P. Genotypic Variation in Seedling Root Architectural Traits and Implications for Drought Adaptation in Wheat (Triticum Aestivum, L.). Plant Soil 2008, 303, 115–129. [Google Scholar] [CrossRef]
  58. Nakamoto, T.; Oyanagi, A. The Direction of Growth of Seminal Roots of Triticum Aestivum, L. and Experimental Modification Thereof. Ann. Bot. 1994, 73, 363–367. [Google Scholar] [CrossRef]
  59. Singh, V.; van Oosterom, E.J.; Jordan, D.R.; Messina, C.D.; Cooper, M.; Hammer, G.L. Morphological and Architectural Development of Root Systems in Sorghum and Maize. Plant Soil 2010, 333, 287–299. [Google Scholar] [CrossRef]
  60. Xiong, R.; Liu, S.; Considine, M.J.; Siddique, K.H.M.; Lam, H.M.; Chen, Y. Root System Architecture, Physiological and Transcriptional Traits of Soybean (Glycine Max, L.) in Response to Water Deficit: A Review. Physiol. Plant. 2020, 1–14. [Google Scholar] [CrossRef]
  61. Guerrero-Campo, J.; Fitter, A.H. Relationships between Root Characteristics and Seed Size in Two Contrasting Floras. Acta Oecologica 2001, 22. [Google Scholar] [CrossRef]
  62. Strock, C.F.; Burridge, J.; Massas, A.S.F.; Beaver, J.; Beebe, S.; Camilo, S.A.; Fourie, D.; Jochua, C.; Miguel, M.; Miklas, P.N.; et al. Seedling Root Architecture and Its Relationship with Seed Yield across Diverse Environments in Phaseolus Vulgaris. F. Crop. Res. 2019, 237, 53–64. [Google Scholar] [CrossRef]
  63. Koester, R.P.; Nohl, B.M.; Diers, B.W.; Ainsworth, E.A. Has Photosynthetic Capacity Increased with 80years of Soybean Breeding? An Examination of Historical Soybean Cultivars. Plant. Cell Environ. 2016, 39. [Google Scholar] [CrossRef]
  64. Lynch, J.P. Steep, Cheap and Deep: An Ideotype to Optimize Water and N Acquisition by Maize Root Systems. Ann. Bot. 2013, 112, 347–357. [Google Scholar] [CrossRef] [Green Version]
  65. Lersten, N.R.; Carlson, J.B. Vegetative Morphology. In Soybeans: Improvement, Production, and Uses; Agronomy Monographs Series; American Society of Agronomy, Inc.: Madison, WI, USA, 2004; pp. 15–57. [Google Scholar]
  66. Brisson, N.; Gary, C.; Justes, E.; Roche, R.; Mary, B.; Ripoche, D.; Zimmer, D.; Sierra, J.; Bertuzzi, P.; Burger, P.; et al. An Overview of the Crop Model STICS. Eur. J. Agron. 2003, 18. [Google Scholar] [CrossRef]
Figure 1. View of the minirhizotrons experimental design under controlled conditions (growth chamber).
Agronomy 11 00188 g001
Figure 2. A diagrammatic representation of root angle measurement of soybean cultivars 10 days after sowing. (α1) is the angle between the longest lateral root and the horizontal line of soil, and (α2) is the angle between the longest lateral root and the horizontal line from the point of insertion of this root on the taproot.
Agronomy 11 00188 g002
Figure 3. Total root length (cm) as a function of the shoot length (cm) for 10 soybean cultivars at 10 days after sowing. Linear regression was carried out for the two soil moisture status. “*”indicates that regression is significant at p < 0.05 according to the table proposed by [46]. (▲) and (∆) for well-watered and water-stressed conditions, which correspond to a volumetric soil water content (mean% ± standard error: 25 ± 1.44 and 14 ± 1.13, respectively). Cvs. Blancas (BL), Ecudor (EC), ES Mentor (ME), ES Pallador (PA), Isidor (IS), Klaxon (KL), RGT Shouna (SH), Santana (SA), Sigalia (SI) and Sultana (SU).
Agronomy 11 00188 g003
Figure 4. (a) Factor loadings for the variables measured on 10 soybean cultivars grown under well-watered “WW” and water-stressed “WS” conditions for the first two axes of the principal component analysis (PCA). Shoot dry matter (Sdm), root dry matter (Rdm), total dry matter (Tdm), root: shoot ratio (R.S), shoot length (Sh), total root length (Rl), root surface area (Rs), average root diameter (Rdi), root volume (Rv), root tips number (Tips), specific root surface (SW), root length density (Rldn), specific root length (LRW), length of roots with diameter ≤ 0.2 mm (Rl ≤ 0.2) root penetration rate in depth (Rdr), root lateral expansion rate (Rlr), root angle 1 (α1), root angle 2 (α2), distance from soil to longest lateral root insertion on taproot (a1) and plant water potential (Yw). (b) Projection of the different cultivars on the first two axes of the PCA. Number of individuals from 1 to 10 (in red) and from 11 to 20 (in black) represent cultivars under well-watered and water-stressed conditions, respectively. The green, blue and brown circles represent the three discriminated cultivars x soil moisture status groups based on the hierarchical clustering.
Agronomy 11 00188 g004
Figure 5. Canopy cover dynamics of cvs. Isidor and Santana for early and conventional sowings in 2013 and 2014. Arrows indicate the R1 stage. The solid and dashed lines represent the fitted exponential functions of canopy cover for cvs. Isidor and Santana, respectively.
Agronomy 11 00188 g005
Figure 6. Design of a potential ideotype of soybean cultivar for drought avoidance during early growth.
Agronomy 11 00188 g006
Table 1. Main characteristics of the soybean cultivars used in this study.
Cultivars 1Maturity GroupBreeding CompanyYear and Country of RegistrationThousand Seed Weight (g) 2Shoot Length ClassificationGrowth Type
BlancasIICaussade Semences2007-Italy177.7MediumIndeterminate
EcudorIIEuralis Semences2006-France213.5TallIndeterminate
ES Mentor0Euralis Semences2009-France204.6ShortSemi-determinate
ES PalladorIEuralis Semences2015-France174.7MediumIndeterminate
IsidorIEuralis Semences2004-France248.3ShortSemi-determinate
Klaxon000(0)RAGT Semences2005-France167.6ShortIndeterminate
RGT Shouna0RAGT Semences2014-France170.4TallIndeterminate
SantanaI/IIRAGT Semences2007-France208.6ShortIndeterminate
Sigalia0RAGT Semences2008-France213.8TallSemi-determinate to indeterminate
Sultana0RAGT Semences2009-France214.5ShortSemi-determinate
1 The information about studied cultivars was obtained from the website of Terres Inovia and the free application myVar® [39]. 2 Thousand seed weight (TSW) was determined from seed samples before the experiment using a seed counter de Chopin (AFNOR NF V03-702 and ISO 720).
Table 2. A comparison of shoot and root morpho-physiological and root architectural traits in ten soybean cultivars under well-watered and water-stressed conditions.
CultivarsShoot Length (cm plant−1)Shoot Dry Matter (mg plant−1)Root Dry Matter (mg plant−1)Root:Shoot RatioTotal Dry Matter (mg plant−1)Total Root Length (cm plant−1)Root Surface Area (cm2)Root Volume (cm3)Root Tips Number Average Root Diameter (mm)Root Angle 1 (°)
Well-watered conditions
Blancas 7.20 ± 0.63 a128.18 ± 4.37 c22.54 ± 3.31 abc0.18 ± 0.03 ab150.71 ± 4.30 c136.05 ± 18.95 bc21.87 ± 2.43 bc0.29 ± 0.03 ab119.88 ± 17.03 bc0.53 ± 0.0444.31 ± 3.83 a
Ecudor 8.71 ± 0.76 a138.11 ± 16.37 bc20.08 ± 4.23 bc0.16 ± 0.03 ab158.19 ± 16.43 bc128.02 ± 18.34 bc21.89 ± 3.49 bc0.30 ± 0.06 ab118.50 ± 19.17 bc0.54 ± 0.0342.91 ± 2.60 a
ES Mentor 9.35 ± 0.91 a152.59 ± 4.03 abc29.96 ± 4.58 ab0.20 ± 0.03 ab182.55 ± 7.06 abc172.21 ± 26.39 abc28.71 ± 4.14 abc0.39 ± 0.06 ab136.75 ± 21.49 abc0.54 ± 0.0354.47 ± 4.28 a
ES Pallador 6.98 ± 1.09 a122.23 ± 10.32 c13.78 ± 2.86 c0.12 ± 0.03 b136.00 ± 10.02 c 93.93 ± 15.89 c15.79 ± 3.05 c0.22 ± 0.05 b 86.00 ± 15.02 c0.54 ± 0.0357.06 ± 4.11 a
Isidor10.92 ± 1.08 a184.72 ± 4.74 a36.68 ± 3.63 a0.20 ± 0.02 ab221.40 ± 6.07 a247.57 ± 27.56 a38.14 ± 3.82 a0.47 ± 0.05 a204.33 ± 18.43 a0.50 ± 0.0253.45 ± 3.06 a
Klaxon 9.32 ± 0.56 a136.67 ± 6.72 bc25.04 ± 2.68 abc0.18 ± 0.02 ab161.71 ± 8.00 bc149.24 ± 11.64 abc26.05 ± 2.01 abc0.37 ± 0.04 ab134.33 ± 12.66 abc0.56 ± 0.0350.12 ± 3.79 a
RGT Shouna11.10 ± 0.54 a133.46 ± 7.25 ab31.03 ± 4.24 ab0.24 ± 0.03 a164.49 ± 8.79 ab189.46 ± 29.74 ab32.44 ± 4.55 ab0.45 ± 0.06 a177.75 ± 28.23 ab0.56 ± 0.0357.42 ± 2.83 a
Santana 7.81 ± 1.51 a156.21 ± 4.57 abc22.06 ± 2.52 abc0.14 ± 0.02 ab178.28 ± 5.13 abc141.65 ± 12.72 abc22.47 ± 1.88 bc0.29 ± 0.03 ab137.88 ± 17.12 abc0.51 ± 0.0344.83 ± 2.63 a
Sigalia 9.41 ± 0.94 a169.02 ± 5.01 bc22.40 ± 2.17 abc0.14 ± 0.02 ab191.42 ± 4.35 bc158.63 ± 13.86 abc25.82 ± 2.17 abc0.34 ± 0.03 ab159.22 ± 11.20 abc0.52 ± 0.0151.37 ± 3.87 a
Sultana 9.40 ± 0.90 a162.31 ± 4.42 abc19.36 ± 3.02 bc0.12 ± 0.02 b181.68 ± 4.10 abc144.24 ± 21.85 bc22.90 ± 3.43 bc0.29 ± 0.04 ab123.75 ± 18.31 abc0.51 ± 0.0256.46 ± 3.12 a
Significance********************NS*
Water-stressed conditions
Blancas 7.68 ± 0.84 a115.83 ± 5.13 bc27.26 ± 2.46 a0.24 ± 0.02 a143.09 ± 5.44 c134.34 ± 14.98 b25.30 ± 2.85 ab0.38 ± 0.05 ab134.63 ± 17.00 abc0.60 ± 0.02 a66.58 ± 4.49
Ecudor 6.63 ± 0.97 a143.41 ± 8.22 abc24.01 ± 5.04 a0.18 ± 0.05 a167.43 ± 4.81 bc125.97 ± 22.77 b22.68 ± 4.20 b0.34 ± 0.07 ab137.75 ± 18.87 abc0.58 ± 0.05 ab62.53 ± 4.41
ES Mentor 8.29 ± 0.77 a149.75 ± 3.61 abc31.90 ± 3.62 a0.22 ± 0.03 a181.65 ± 3.10 b188.38 ± 18.91 ab31.27 ± 3.16 ab0.42 ± 0.05 ab214.75 ± 25.24 ab0.53 ± 0.01 ab67.01 ± 3.48
ES Pallador 7.14 ± 1.03 a122.15 ± 4.38 bc20.04 ± 3.13 a0.17 ± 0.03 a142.19 ± 3.79 c106.17 ± 15.70 b20.02 ± 2.88 b0.30 ± 0.04 ab103.75 ± 15.00 c0.61 ± 0.03 a63.15 ± 3.00
Isidor10.14 ± 1.06 a186.99 ± 7.82 a32.26 ± 3.45 a0.18 ± 0.02 a219.25 ± 7.58 a241.94 ± 20.22 a37.15 ± 3.01 a0.46 ± 0.04 a217.63 ± 14.75 a0.49 ± 0.02 b61.07 ± 3.96
Klaxon 8.30 ± 0.64 a116.56 ± 4.42 c27.93 ± 2.60 a0.24 ± 0.02 a144.49 ± 6.17c137.19 ± 18.29 b25.08 ± 2.95 ab0.37 ± 0.04 ab140.78 ± 16.55 abc0.60 ± 0.02 ab71.39 ± 2.98
RGT Shouna10.05 ± 0.85 a118.56 ± 4.00 bc25.91 ± 3.20 a0.22 ± 0.03 a144.48 ± 5.10 c135.55 ± 17.55 b23.33 ± 3.00 b0.32 ± 0.04 ab144.38 ± 16.30 abc0.55 ± 0.02 ab60.30 ± 5.06
Santana 6.05 ± 1.00 a146.25 ± 11.89 abc18.88 ± 3.21 a0.13 ± 0.03 a165.13 ± 12.82 bc130.00 ± 23.28 b20.63 ± 3.11 b0.27 ± 0.04 b124.25 ± 19.74 c0.53 ± 0.03 ab57.72 ± 2.98
Sigalia 6.91 ± 1.12 a157.36 ± 5.64 ab24.57 ± 3.34 a0.16 ± 0.03 a181.92 ± 5.05 b124.63 ± 13.85 b23.14 ± 2.59 b0.34 ± 0.04 ab122.44 ± 07.83 bc0.59 ± 0.02 ab65.03 ± 2.67
Sultana 6.61 ± 0.80 a149.54 ± 6.68 abc21.26 ± 2.87 a0.15 ± 0.02 a170.80 ± 4.90 b136.51 ± 16.95 b21.64 ± 2.69 b0.28 ± 0.04 ab136.75 ± 15.14 abc0.51 ± 0.02 ab65.66 ± 3.16
Significance********************NS
Means within each column with different letters are significantly different at p < 0.05 (Tukey’s HSD test), when the significant level was low (*), the Tukey’s HSD test was not able to discriminate different groups at p < 0.05. NS: not significant. ***, **, *, indicate significant differences among cultivars at p < 0.001, p < 0.01, p < 0.05, respectively.
Table 3. Means and cultivar range of studied variables and the impact of cultivars (C), soil moisture status (WT) and the interaction between C and WT on each variable.
Well-Watered ConditionsWater-Stressed ConditionsEffect
TraitsVariableMeanCultivar RangeMeanCultivar RangeCWTC*WT
Morpho-physiological traits (shoot or root)Shoot length (cm)9.026.98–10.927.786.05–10.14*****NS
Shoot dry matter (mg)148.35122.23–184.72140.64115.83–186.99****NS
Root dry matter (mg)24.2913.78–36.6825.418.88–32.26***NSNS
Root: shoot ratio0.170.12–0.240.190.13–0.24***NSNS
Total dry matter (mg)172.64136–221.4166.04142.19–219.25****NS
Average root diameter (mm)0.530.50–0.560.560.49–0.61**NS
Specific root surface (cm2 mg−1)1.110.97–1.211.010.89–1.20NS**NS
Specific root length (cm mg−1)6.865.91–7.525.974.89–7.93NS**NS
Total root length (cm)156.193.93–247.57146.07106.17–241.94***NSNS
Root surface area (cm2)25.6115.79–38.1425.0220.02–37.15***NSNS
Root volume (cm3)0.340.22–0.470.350.27–0.46***NSNS
Root tips number139.8486–204.33147.71103.75–217.63***NSNS
Root length density (cm cm−3)0.10.06–0.160.10.07–0.16***NSNS
Length of roots with diameter ≤ 0.2 mm (cm)27.1614.37–49.7521.3512.09–35.30*****NS
Length of roots with diameter between 0.2 and 0.4 mm (cm)55.3737.49–95.8754.9533.04–116.40***NSNS
Length of roots with diameter between 0.4 and 0.6 mm (cm)32.3912.38–45.0127.2110.72–41.80****NS
Length of roots with diameter between 0.6 and 0.8 mm (cm)19.8210.29–31.271811.54–25.98*NSNS
Length of roots with diameter between 0.8 and 1 mm (cm)12.527.68–18.0914.3510.37–22.02NSNSNS
Length of roots with diameter between 1 and 2 mm (cm)7.835.77–10.919.466.90–14.32***NS
Length of roots with diameter between 2 and 3 mm (cm)0.820.58–1.180.580.25–0.76NS**NS
Plant water potential (MPa)−0.34−0.55–−0.18−0.41−0.65–−0.25NSNSNS
Architectural traits (root)Root lateral expansion rate (cm day−1)1.801.44–2.081.230.81–1.45NS***NS
Root penetration rate in depth (cm day−1)3.552.91–4.044.093.66–4.84NS**NS
Root angle 1 (°)51.2442.91–57.4264.0457.72–71.39NS***NS
Root angle 2 (°)39.6732.04–46.7445.6340.31–51.90NS**NS
Distance from soil to longest lateral root insertion on taproot (cm)1.831.23–2.593.451.86–5.22NS***NS
NS: not significant. ***, **, *, indicate significant effects of cultivar (C), soil moisture status (WT) and the interaction between them (C*WT) on the studied variables at p < 0.001, p < 0.01, p < 0.05, respectively.
Table 4. Canopy cover parameters, total shoot dry matter at the R1 stage, number of days from emergence to the R1 stage, and grain yield of two soybean cultivars for conventional and early sowing in 2013 and 2014.
YearSowing DateCultivarCC0 (%)CGCShoot Dry Matter at R1 Stage (g m−2)Number of Days from Emergence to R1 StageGrain Yield (q ha−1)
2013Conventional sowingIsidor2.05 ± 0.08 b0.059 ± 0.001 b146.07 ± 5.91 b59.00 ± 0.00 c45.27 ± 1.41 ab
Santana1.11 ± 0.05 c0.065 ± 0.001 b119.19 ± 4.81 cde58.50 ± 0.22 c49.64 ± 1.32 a
Early sowingIsidor4.18 ± 0.18 a0.036 ± 0.001 e140.68 ± 6.00 bc75.00 ± 0.93 a47.67 ± 1.36 ab
Santana2.04 ± 0.09 b0.040 ± 0.001 de106.79 ± 4.45 de76.00 ± 0.77 a50.31 ± 0.59 a
2014Conventional sowingIsidor1.33 ± 0.22 c0.094 ± 0.005 a202.83 ± 18.54 a47.33 ± 1.20 d45.69 ± 1.49 ab
Santana0.51 ± 0.09 d0.104 ± 0.004 a136.38 ± 05.11 bcd46.67± 0.95 d50.92 ± 1.03 a
Early sowingIsidor3.29 ± 0.45 a0.043 ± 0.005 d89.00 ± 2.43 e63.33 ± 0.33 b43.36 ± 0.58 b
Santana1.59 ± 0.11 bc0.049 ± 0.001 c120.38 ± 8.31 bcde63.50 ± 0.22 b48.08 ± 1.26 ab
EffectsCultivar*********NS***
Year******NS***NS
Sowing date************NS
Cultivar * YearNSNSNSNSNS
Cultivar * Sowing date**********NS
Year * Sowing dateNSNS*******
Cultivar * Year * Sowing dateNSNS******NS
Means within each column with different letters are significantly different at p < 0.05 (Tukey’s HSD test). NS: not significant. ***, **, *, indicate significant differences among cultivars at p < 0.001, p < 0.01, p < 0.05, respectively.
Publisher’s Note: MDPI stays neutral with regard to jurisdictional claims in published maps and institutional affiliations.

