Article

Altering Tetrapyrrole Biosynthesis by Overexpressing Ferrochelatases (Fc1 and Fc2) Improves Photosynthetic Efficiency in Transgenic Barley

by
Dilrukshi S. K. Nagahatenna
1,
Jingwen Tiong
1,
Everard J. Edwards
2,
Peter Langridge
1,3,* and
Ryan Whitford
1
1
School of Agriculture, Food and Wine, University of Adelaide, Waite Campus, PMB1, Glen Osmond, SA 5064, Australia
2
CSIRO Agriculture & Food, Locked Bag 2, Glen Osmond, SA 5064, Australia
3
Wheat Initiative, Julius-Kühn-Institute, Königin-Luise-Str 19, 14195 Berlin, Germany
*
Author to whom correspondence should be addressed.
Agronomy 2020, 10(9), 1370; https://doi.org/10.3390/agronomy10091370
Submission received: 14 August 2020 / Revised: 7 September 2020 / Accepted: 7 September 2020 / Published: 11 September 2020

Abstract

:
Ferrochelatase (FC) is the terminal enzyme of heme biosynthesis. In photosynthetic organisms studied so far, there is evidence for two FC isoforms, which are encoded by two genes (FC1 and FC2). Previous studies suggest that these two genes are required for the production of two physiologically distinct heme pools with only FC2-derived heme involved in photosynthesis. We characterised two FCs in barley (Hordeum vulgare L.). The two HvFC isoforms share a common catalytic domain, but HvFC2 additionally contains a C-terminal chlorophyll a/b binding (CAB) domain. Both HvFCs are highly expressed in photosynthetic tissues, with HvFC1 transcripts also being abundant in non-photosynthetic tissues. To determine whether these isoforms differentially affect photosynthesis, transgenic barley ectopically overexpressing HvFC1 and HvFC2 were generated and evaluated for photosynthetic performance. In each case, transgenics exhibited improved photosynthetic rate (Asat), stomatal conductance (gs) and carboxylation efficiency (CE), showing that both FC1 and FC2 play important roles in photosynthesis. Our finding that modified FC expression can improve photosynthesis up to ~13% under controlled growth conditions now requires further research to determine if this can be translated to improved yield performance under field conditions.

1. Introduction

Production of the major cereal crops needs to improve to feed future food demands driven by population growth. This task will be challenged by production constraints due to increased climatic variability. Improving photosynthetic performance of rain-fed cereals may be a step towards achieving higher crop yields on limited arable land. As photosynthesis is a highly complex and regulated physiological process, the identification of genes and processes capable of enhancing photosynthetic efficiency is a high priority [1,2,3]. Knowledge of these genes and processes will allow researchers and plant breeders to identify, track and ultimately deploy improved photosynthetic traits.
Tetrapyrroles are key components of photosynthesis. All higher plants synthesise two major tetrapyrroles, chlorophyll and heme [4]. In plastids, chlorophyll plays a vital role in the capture and conversion of light energy for photosynthesis [5], whilst heme is an integral component of the photosynthetic cytochrome b6f complex, necessary for photosynthetic electron transport [6,7]. Unlike chlorophyll, heme has a wide distribution within the cell and is required for a number of other cellular functions. For instance, in both the mitochondria and endoplasmic reticulum, heme is involved in electron transport through respiratory cytochromes, cytochrome b5 and P450s. In peroxisomes, it acts as a co-factor for activating enzymes which detoxify reactive oxygen species (ROS) such as, catalase and ascorbate peroxidase [8]. Recently, it was proposed that heme serves as a plastid signal for modulating expression of a number of chloroplast biogenesis-associated nuclear genes (retrograde signalling) [9,10,11,12,13]. Studies to date show that tetrapyrrole biosynthesis is modulated at two strict control points: aminolevulinic acid synthesis [14] and at the branch point between chlorophyll and heme synthesis (Figure 1) [4,15,16,17]. At the branch point, Protoporphyrin IX (Proto IX) serves as the common substrate for tetrapyrrole biosynthesis. Insertion of Mg2+ into Proto IX by Mg-chelatase forms chlorophyll, whereas insertion of Fe2+ by Ferrochelatase (FC) is necessary for heme production [18].
In plants studied so far, there is evidence for two FC isoforms, which are each encoded by a single gene (FC1 and FC2). Both FC isoforms exist as 36–42 kDa monomers [19], and are inferred to have similar catalytic properties, substrate affinity and specificity, based on in vitro assays [20]. However, the two FCs have distinct expression profiles. FC1 is abundantly expressed in all plant tissues, including roots, whereas FC2 transcript levels are found only in aerial plant parts [19,21,22,23,24]. In vitro import assays indicate that both FC1 and FC2 are localized to the stroma, thylakoid and envelope membranes of the chloroplast [20,25,26], while FC1 is additionally imported into mitochondria [21,25,27,28,29]. These differences have led to the proposition that each FC has a distinct role in plant metabolism. Dual targeting of FC1 to both chloroplasts and mitochondria has been disputed in subsequent studies. For example, Lister et al. [30] were unable to detect FC1 in Arabidopsis mitochondria, whilst pea mitochondria, in which previous import assays had been conducted, appeared to accept a variety of chloroplast-specific proteins in addition to Arabidopsis FC1 [30]. Masuda et al. [31] also found that FC1 and FC2 in cucumber are both solely targeted to chloroplasts.
FC2, but not FC1, has recently been demonstrated to positively co-express with light-responsive photosynthetic genes [23]. Arabidopsis fc2 knock-down mutants (fc2–1) exhibited a significant reduction in plastid cytochromes, cytochrome b6f-bound heme and an impairment of photosynthetic electron transport and photosystem II (PSII) efficiency [23,32]. In comparison, Arabidopsis fc1–1 knock-down mutants did not display obvious defects in photosynthetic development but exhibited reduction in cytochromes in microsomal fraction and peroxidase activity, suggesting that only FC2 is directly required for photosynthesis [22,23,32,33]. Taken together with disputed reports of fc1 knock-out mutant lethality [10,23], questions arise as to whether FC1 has a significant role in photosynthetic performance.
This study aimed to gain a deeper understanding of FC contributions to photosynthetic performance in cereals. For this purpose, we used barley (Hordeum vulgare L.) as a model for commercially relevant rain-fed cereal crops. To date, only one barley FC cDNA sequence (FC1) has been identified by complementation of the bacterial fc mutants [34] and detailed investigations are yet to be conducted to elucidate its physiological function. In this study, two barley FCs (HvFCs) were identified and their tissue-specific expression patterns and subcellular protein localization were investigated. HvFC1 and HvFC2 were cloned from the cultivar Golden Promise. Transgenic lines ectopically overexpressing either HvFC1 or HvFC2 were generated and evaluated for photosynthetic performance. Our results show that the two HvFCs have differential tissue expression profiles, with HvFC1 localizing to plastid-like structures. Overexpression of either HvFC1 or HvFC2 increased FC protein content and improved photosynthetic rate, carboxylation efficiency and stomatal conductance in barley, demonstrating that under controlled growth conditions, both FCs either directly or indirectly affect photosynthetic performance.

2. Materials and Methods

2.1. Identification of Two Barley FC Genes

Barley FC sequences were identified by comparison to FC sequences from a number of plant species, including Arabidopsis, cucumber (Cucumis sativus) and grass family members. These sequences were retrieved from the National Centre for Biotechnology Information (NCBI) genomic database. Translated polypeptide sequences were used in a BLASTx search of barley-derived genomic sequences from Leibniz Institute of Plant Genetics and Crop Plant Research (IPK), Gatersleben, Germany (http://webblast.ipk-gatersleben.de/barley). Protein motifs were identified by comparison to sequences in the Pfam database (EMBL, Heidelberg, Germany) (http://pfam.xfam.org). All sequences were carefully evaluated for redundancy, splice forms and conserved catalytic domains.

2.2. Phylogenetic Analysis

Retrieved FC1 and FC2 polypeptide sequences were aligned using the Muscle Alignment web server (http://www.ebi.ac.uk/Tools/muscle/index.html) and viewed in Jalview. N- and C-termini were trimmed from each protein sequence to demark the FC catalytic and chlorophyll A/B binding (CAB) domains. Phylogenetic analysis was carried out using MEGA 5 software and the Maximum Likelihood method (www.megasoftware.net). The reliability of the tree was estimated by bootstrap analysis with 1000 replications [35].

2.3. cDNA Cloning and Binary Plasmid Construction

Total RNA was extracted from whole Hordeum vulgare (cv. Golden Promise) seedlings 6 days post-germination with a RNeasy plant extraction kit (Qiagen, Hilden, Germany). The cDNA was generated using SuperScript™ III RT (Invitrogen, Carlsbad, CA, USA) and random primers. Full-length cDNA sequences from barley were PCR-amplified using either HvFC1 (accession number AK251553)-specific primers (forward, 5′-ATGGAGTGCGTCCGCTCGGG; reverse, 5′-TCACTGAAGAGTGTTCCGGAAAG) or HvFC2 (accession number AK355192)-specific primers (forward, 5′-ATGCTCCACGTTAGGCTC; reverse, 5′-TTAAGGGAGAGGTGGCAAGAT) by using Phusion® Hot Start high-fidelity DNA polymerase (Finnzymes). The PCR amplification included a touch-down (A) and a classical (B) PCR as follows: 5 min at 94 °C, followed by 10 cycles (30 s at 94 °C, 45 s at 60 °C with 1 °C decrease per cycle, and 90 s at 72 °C), 20 cycles (30 s at 94 °C, 45 s at 50 °C, and 90 s at 72 °C), and a final 10 min extension step at 72 °C. The HvFC1 (1455 bp) and HvFC2 (1581 bp) PCR products were purified and cloned in the pCR8-TOPO vector (Invitrogen) prior to sequencing. Sequence verified coding sequences were transferred into Gateway compatible pMBC32-based binary vectors [36] (Curtis and Grossniklaus, 2003) using LR-clonase (Invitrogen). Schematics of sequence verified binary vectors are described in Supplementary Figure S1.

2.4. Barley Transformation and Analysis of Transgenic Plants

The pMDC32-HvFC1 and pMDC32–HvFC2 constructs (Supplementary Figure S1) were transformed into barley (Hordeum vulgare L. cv. Golden Promise) using Agrobacterium-mediated transformation, as described by Tingay et al. and Matthews et al. [37,38]. Transgene integration was confirmed in independent T0 lines by PCR using primer pairs for the hygromycin resistance gene (Hyg) and transgenes (Supplementary Table S1).
HvFC1 and HvFC2 transgene copy numbers were estimated in T0 progeny using Southern blot hybridization as described by Sambrook and Russell [39]. Genomic DNA was digested with HindIII and PvuIII and the Southern blot was probed with the terminator sequence of the nopaline synthase (NOS) gene. Low-copy, independent transgenic lines were selected and total HvFC1 and HvFC2 expression levels were analysed by quantitative RT-PCR, as described by Burton et al. [40], using primers for coding regions of HvFC endogenes. mRNA copy number for each tested gene was normalised against four internal control genes (GAPDH, HSP70, cyclophilin and tubulin). Normalisation factor, derived from the geometric mean of most stably expressed control genes, was calculated using the geNorm program and the normalised transcript abundance of target genes were calculated as described by Burton et al. [40]. Descriptions of the probe and primer sequences used in these experiments are described in Supplementary Table S1.

2.5. Protein Isolation and Immunoblot Assay

Proteins were homogenised in 3× Laemmli buffer (1M Tris/HCl pH 6.8, 20% sodium dodecyl sulfate (SDS) (w/v), 100% glycerol, β-mercaptoethanol, 1% bromophenol blue (w/v) and urea), incubated for 5 min at 100 °C and centrifuged for 10 min. Proteins were fractionated by vertical electrophoresis in a 12% SDS-polyacrylamide gel and transferred to polyvinylidene fluoride (PVDF) membranes (Millipore, Billerica, MA, USA). Non-specific binding of antibodies was blocked with 5% non-fat dried milk in tris-buffered saline (TBS, pH 7.4) for 1 h at room temperature. Membranes were then incubated overnight at 4 °C with diluted primary antibodies specific for FC and cytochrome b6 (1:1000 and 1:10,000 respectively). Immune complexes were detected using horseradish peroxidase (HRP)-conjugated anti-rabbit IgG. The colour was developed with a solution containing 3-3′-diaminobenzidine tetrahydrochloride (DAB) as the horseradish peroxidase (HRP) substrate.

2.6. Transient Expression of HvFC1-Green Fluorescent Protein (GFP) Fusion

For transient expression of GFP fusion constructs, N-terminal partial open reading frames including complete transit peptides of HvFC1 and HvFC2 were fused upstream and in-frame with SpeI and AscI sites of the GFP fusion construct pMDC83 (https://www.unizh.ch/botinst/Devo-Website/curtisvector/), under the control of the 2X cauliflower mosaic virus 35S (2X35SCaMV) promoter. For the N terminus GFP fusion, HvFC1 was amplified from the cDNA clone by PCR using oligonucleotides that contained a SpeI site (ACTAGTATGGAGTGCGTCCGCTCG) and AscI site (GGCGCGCCACTGAAGAGTGTTCCGGAAAG). HvFC2 was amplified by using oligonucleotides that contained a SpeI site (ACTAGTTATGCTCCACGTCAGGCT) and AscI site (GGCGCGCCAAGGGAGAGGTGGCAAGATAC). Arabidopsis HEMA2-RFP fusion construct was used as a control for plastid-targeting protein. Onion (Allium cepa L.) epidermal cells were bombarded with vector DNA-coated gold particles (1350 psi) using a Bio-Rad PDS-1000He Particle Delivery System according to the manufacturer’s instructions. The samples were incubated at 27 °C in darkness, and GFP fluorescence in cells was detected by Nikon A1R confocal microscopy (Axioplan2 and Axiophoto2, Zeiss) after 24 h incubation.

2.7. Plant Material and Growth Conditions

Wild-type barley (Hordeum vulgare L. cv. Golden promise), null segregants and T1 and T2 transgenic barley seeds were grown in pots containing coco-peat under controlled environmental conditions, with 20–22 °C temperature, 50–60% relative humidity and a 12:12 h (light/dark) cycle. For phenotypic analysis, 3- to 4-week-old transgenics were evaluated for plant development parameters including plant height, tiller number, number of leaves and shoot and root dry weights.

2.8. Photosynthetic Measurements

In vivo gas exchange parameters were measured in developmentally equivalent fully expanded leaves from 4- to 6-week-old plants using a LI-6400 portable photosynthesis system (Licor, NE, USA). Measurement periods were from 9:00 am to 5:00 pm. The conditions of the IRGA chamber were set to light intensity of 2000 μmol m−2 s−1, humidity of 50–60%, air temperature 25 °C and reference air CO2 concentration of 400 μmol mol−1. Carboxylation efficiency (CE) = photosynthesis rate under saturated light (Asat)/intracellular CO2 concentration.

2.9. Leaf n and Fe analysis

Total leaf n concentration was determined with an isotope ratio mass spectrometer (Seron, Crewe, Cheshire, UK) by Nitrogen analysis group at the University of Adelaide according to Garnett et al. [41]. Total leaf Fe content was analysed using Inductively Coupled Plasma-Optical Emission Spectrometry (ICP-OES; Wheal et al. [42]) by Waite Analytical Services, University of Adelaide.

2.10. Chlorophyll Content

Chlorophyll was extracted from leaf tissues using dimethyl sulfoxide (DMSO) and determined spectrophotometrically according to Hiscox and Israelstam [43]. Chlorophyll concentrations were calculated using the following equations: Chla (g L−1) = 0.0127 A663 − 0.00269 A645, and Chlb (g L−1) = 0.0229 A645 − 0.00468 A663 (A663 and A645 are absorbances at 663 and 645 nm).

2.11. Statistical Analysis

One-way analysis of variance (ANOVA) was performed using GenStat software, and mean differences were analysed through the least significant difference (LSD) test. Differences were considered statistically significant when p < 0.05.

3. Results

3.1. Identification and Sequence Analysis of Two Types of Ferrochelatases in Barley

Barley FC gene sequences were identified by comparison to publicly available plant FC sequences. As described in other plant species, we found two FC isoforms in barley, each encoded by a single gene. The two barley isoforms are 55.6% and 11.2% identical to each other at the amino acid and nucleotide levels, respectively. Similarity comparisons revealed that the two HvFCs share a high level of identity with their Arabidopsis orthologues (AtFC1 (62.3%) and AtFC2 (71.2%), respectively). As has been described for other plant FCs [28], multiple sequence alignment revealed that the HvFC1 and HvFC2 catalytic domains are highly conserved (Supplementary Figure S2). Several proline and glycine residues, which play vital roles in hydrogen bonding, metal binding, and the stability of the protoporphyrin-interacting loop [14], are also highly conserved. FC2 contains an additional chlorophyll a/b binding (CAB) domain which has a light harvesting complex (LHC) motif (Supplementary Figure S2) [28,44]. This domain is present in many photosynthesis-associated proteins. The putative evolutionary relationship between HvFCs and those from other grass and dicot species was investigated by constructing a phylogenetic tree [35]. The resulting dendrogram demonstrated that the two FC isoforms in all plant species studied so far belong to distinct clades (Figure 2).

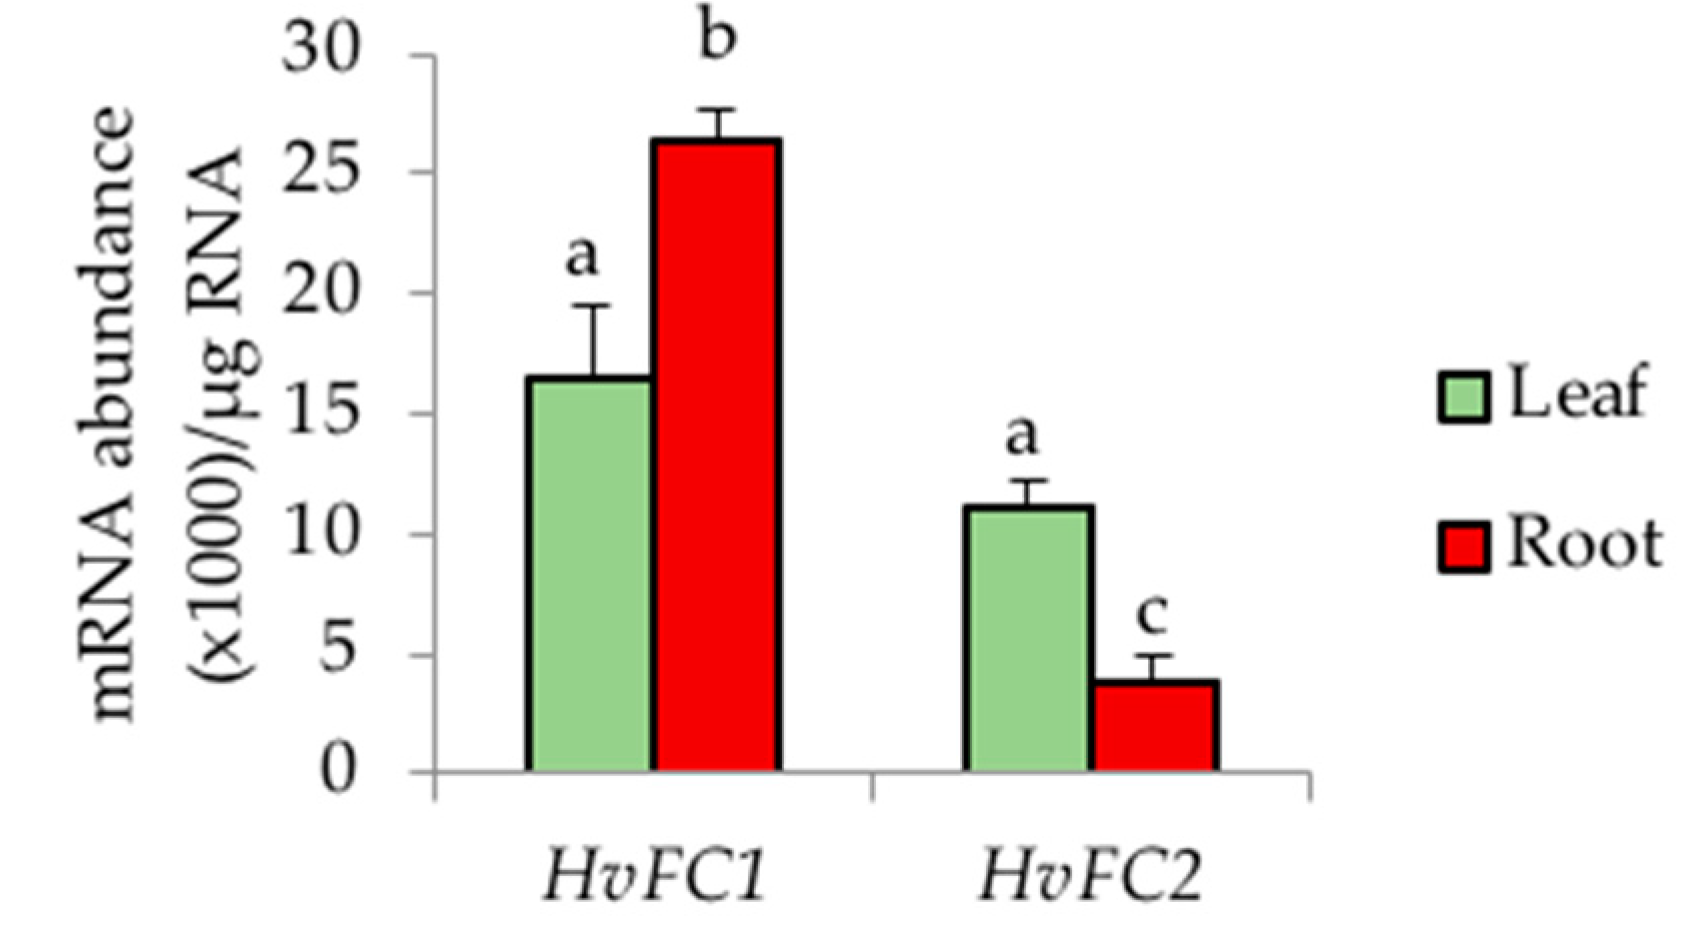
3.2. Two Types of Barley Ferrochelatases Have Differential Tissue-Specific Expression Patterns

To gain insight into the putative function of HvFCs during photosynthesis, we investigated HvFC1 and HvFC2 expression in photosynthetic versus non-photosynthetic tissues by quantitative RT-PCR. HvFC2 expression was predominantly observed in leaves (photosynthetic tissues; Figure 3). Similar levels of leaf HvFC1 expression were also observed, but HvFC1 transcript abundance was significantly higher in roots (non-photosynthetic tissues), suggesting a role for HvFC1 outside photosynthesis.

3.3. Barley FC1 Is Targeted to Plastids

In order to investigate the subcellular localisation of HvFC1, we employed a transient expression assay in onion epidermal cells (Allium cepa L.). HvFC1 fused to green fluorescent protein (GFP) were detected in either irregular or oval-shaped structures (Figure 4c) consistent with the size and morphology of onion cell proplastids and associated stromules [45]. Intriguingly, HvFC1-GFP was found to be colocalised with previously reported plastid marker AtHEMA2-red fluorescent protein (RFP) [10] (Figure 4d). GFP fluorescence was not detected in small punctate structures, as expected if it were localised to mitochondria [29,46,47].

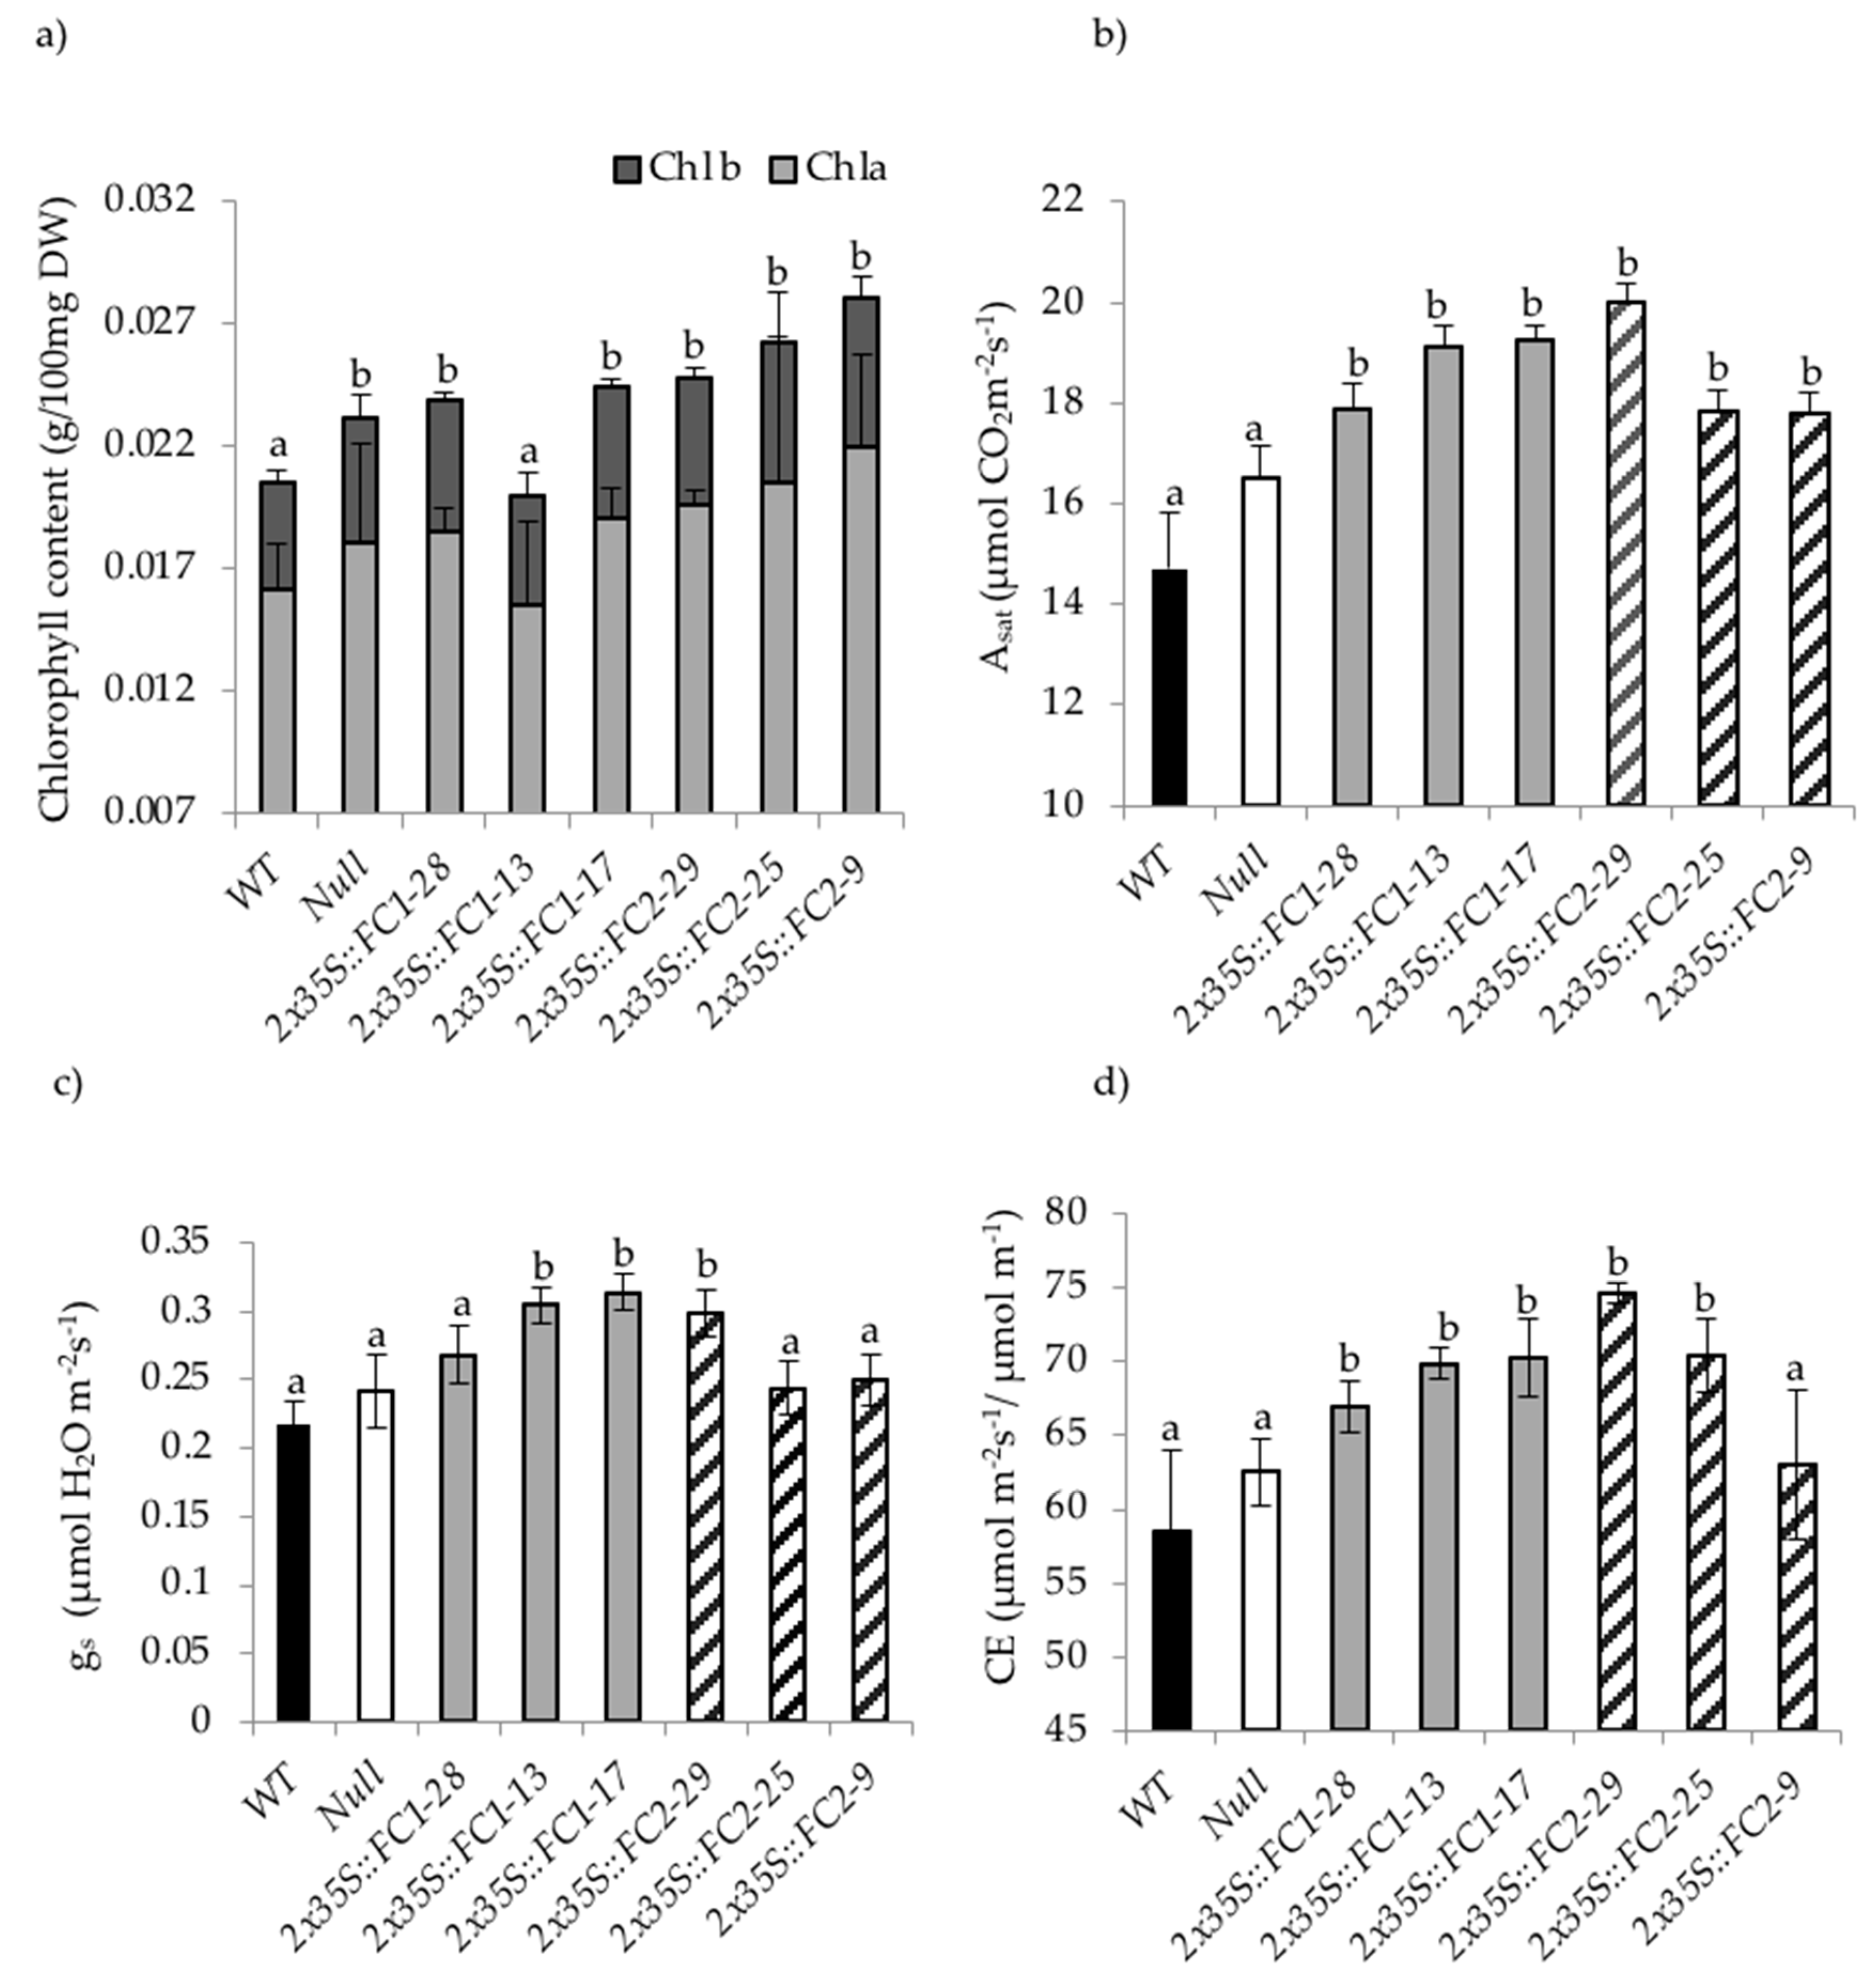
3.4. Increasing HvFC Expression Affects Photosynthetic Performance

To identify whether HvFC1 and HvFC2 have differential roles during photosynthesis, we generated transgenics (cv. Golden Promise) ectopically overexpressing either HvFC1 or HvFC2. Coding regions of FC were cloned into the pMDC32 vector under the control of the 2X35SCaMV promoter (Supplementary Figure S1). Twenty-nine independent T0 transgenic lines were obtained for each FC construct, using Agrobacterium-mediated transformation. Southern blot hybridisation showed that most T0 transgenic lines had 2–5 copies of the transgene. Low copy number transgenic lines were selected and confirmed for transgene copy number by qPCR and subsequently analysed for FC expression by quantitative RT-PCR. Three single-copy transgenic lines, each ectopically overexpressing either HvFC1 or HvFC2, were selected for further analysis (Figure 5a). In order to assess whether the different mRNA levels reflected the changes in HvFC protein levels, immunoblot analysis was performed using a polyclonal FC antibody [48]. The highest HvFC1 and HvFC2 overexpressing transgenic lines demonstrated increased total HvFC protein content in leaves relative to wild-type and null controls (Figure 5b). These results confirm that the observed increase in HvFC transcript abundance results in increased HvFC protein content. Homozygous T2 transgenics were phenotypically evaluated under controlled conditions for growth and development. Untransformed plants and non-transgenic sibs (null segregants) were used as controls. PCR analysis with transgene-specific primers confirmed the presence of FC transgenes in selected T2 transgenic lines and their absence in wild-type and null segregants (Figure 5c).
Molecular characterisation of these transgenic lines confirmed that HvFC1 and HvFC2 were constitutively overexpressed and showed no obvious negative developmental defects relative to untransformed and null controls (Supplementary Table S2). Four-week-old T2 transgenic plants (with the exception of line 2X35S::FC1–17) did not show a significant difference in plant height, leaf number, tiller number and shoot or root biomass when compared to controls. Total chlorophyll content and chlorophyll a/b ratios were similar across all transgenic lines and relative to controls (one-way ANOVA, p < 0.05) (Figure 6a). Importantly, Asat increased 13% when comparing transgenic lines to controls, however no significant differences (one-way ANOVA, p < 0.05) were observed between 2X35S::FC1 and 2X35S::FC2 transgenics (Figure 6b). Stomatal conductance (gs) was observed to be 16% higher in two of the three 2X35S::FC1 lines and only one of the 2X35S::FC2 lines relative to controls (Figure 6c). Whereas, CE was observed to be 11% higher in all three 2X35S::FC1 lines and two of the three 2X35S::FC2 lines when compared to controls (Figure 6d). These findings show that both FC genes, when ectopically overexpressed, are able to increase photosynthetic rate (Asat) in barley grown under controlled conditions, therefore demonstrating that both FC isoforms are likely to play important roles during photosynthesis.
The observed increase in CE by 11% suggests that these plants have either a higher cytochrome b6f content, Rubisco content, increased Rubisco activation or a greater mesophyll conductance. However, our attempts at cytochrome b6f immunoblots revealed cross-reactivity of the commercial antibody (reference) with the highly abundant RbcL proteins (data not shown). Leaf nitrogen content, as a surrogate indicator for the amount of Rubisco [49], was measured in transgenic plants relative to untransformed controls and null segregants. Total leaf n concentration was not significantly different between transgenics and controls (one-way ANOVA, p < 0.05), except for one line (2X35S::FC2–29) which showed a lower concentration (Figure 7a). These results indicate that the improved photosynthetic performance of the transgenic lines under controlled growth conditions is unlikely to be a consequence of increased Rubisco content.
Because FCs catalyse the insertion of ferrous iron (Fe2+) into protoporphyrin IX, it is possible that the observed photosynthetic differences may be a consequence of altered Fe homoeostasis. To test this, we measured total Fe concentration in photosynthesising leaf tissue. No significant differences were observed between leaf Fe concentration of the transgenic and control lines. These results suggest that the observed phenotypic differences in photosynthetic performance are not likely to be the consequence of altered Fe acquisition and/or distribution (Figure 7b).
Collectively, our results suggest that although the two HvFCs have differential expression profiles and encode distinct isoforms, both seem to play important roles in photosynthesis.

4. Discussion

4.1. Two Barley FCs Differ in Structure and Expression

The barley genome contains two genes encoding separate FC isoforms, which are 55.6% and 11.2% identical at the amino acid and nucleotide levels, respectively. Similarity comparisons demonstrate that the two HvFC proteins share conserved amino acids (proline and glycines) important for the tertiary structure in their catalytic domains [14]. This similarity is common to all known plant FCs (Supplementary Figure S2). High amino acid conservation in the catalytic domains is suggestive of shared catalytic function for HvFC1 and HvFC2. FC catalyses the conversion of Proto IX into heme, a terminal step in the tetrapyrrole biosynthesis pathway.
Despite catalytic domain commonality, plant FC polypeptides form two distinct phylogenetic lineages (Figure 2). These two lineages are unlikely to have arisen from segmental duplication [23] and are separated by the presence of a characteristic C-terminal CAB domain containing a conserved LHC motif. HvFC2, as with other plant FC2 sequences, contains this domain (Supplementary Figure S2) which is connected to the FC2 catalytic core by a proline-rich linker sequence (Supplementary Figure S2) and is reported to be essential for enzymatic activity [50]. The LHC motif is abundant in proteins associated with light harvesting complex and is important for anchoring the complex to the chloroplast membrane, binding chlorophyll and carotenoids and facilitating interactions with other co-localised proteins [51]. FC2 is reported not to be associated with the light harvesting complex of the photosystem but regulates its own monomer–dimer transitions [52]. However, the absence of a CAB domain in the only cyanobacterial (Synechocystis sp.) FC (an orthologue of plant FC2) leads to an aberrant accumulation of the chlorophyll precursor, chlorophyllide, under high light stress [50]. This suggests an indirect regulatory role for FC2 in controlling the balance of chlorophyll biosynthesis under stress.
In line with findings from Arabidopsis and cucumber [21,23,24,28], expression of HvFC1 differs compared to HvFC2. HvFC1 and HvFC2 have similar transcript levels within photosynthetic tissues, but HvFC1 is more highly expressed in non-photosynthetic tissues (Figure 3). Together with structural divergence between the two isoforms, these differential expression patterns indicate that HvFC1 and HvFC2 may have distinct roles in barley.

4.2. Both HvFC1 and HvFC2 Are Localised in Chloroplast

FC2 has been shown to be targeted specifically to the chloroplast [21,28,31]. Although a number of studies suggest that FC1 is dual targeted to both chloroplasts and mitochondria, other research indicates that FC1 is unlikely to be imported into mitochondria [30,31]. Our transient expression assay is suggestive of HvFC1 being localised to the chloroplast but not mitochondria (Figure 4), as GFP fluorescence was only detected in large irregular and oval-shaped structures that are typical of onion cell proplastids and their associated stromules [45], as opposed to smaller punctate structures typical of mitochondria [46,47]. This would indicate that in photosynthetic tissues, the primary site of heme biosynthesis is the chloroplast. Given similar levels of FC1 and FC2 expression in photosynthetic tissues, and similar subcellular localisation patterns [30,31], it may be speculated that both isoforms of HvFC have similar functions in these tissues. It is equally plausible that HvFC1 is targeted to mitochondria in non-photosynthetic tissues, such as the root where it is also expressed (Figure 3).

4.3. Both Barley FC Isoforms Contribute to Photosynthetic Performance

To help determine whether HvFCs differentially affect photosynthesis, we generated transgenics ectopically overexpressing either HvFC1 or HvFC2 and measured plant growth and development as well as various photosynthetic performance traits. HvFC1 and HvFC2 transgenics were developmentally equivalent relative to controls, with no obvious defects in plant height, leaf number, tillering or shoot and root dry weights (Supplementary Table S2). These findings are consistent across lines derived from different transformation events. This is in line with the findings of Kang et al. [53] who demonstrated similar phenotypes for rice FC1 and FC2 overexpressing transgenics relative to wild-type.
Since increasing the concentration of heme has been reported to inhibit the activity of the first rate-limiting enzyme of the tetrapyrrole pathway, glutamyl-tRNA reductase (GluTR), in vitro [54], we expected that overexpression of FCs would negatively regulate the pathway and lead to reduced chlorophyll accumulation. However, both HvFC1 and HvFC2 overexpressing transgenics showed no significant difference in total chlorophyll content relative to controls (Figure 6a). In line with this observation, an independent study conducted on rice transgenics overexpressing FC1 and FC2 also showed no reduction in total chlorophyll content [53]. By contrast, Arabidopsis FC1 and FC2 overexpressing transgenics were found to have reduced chlorophyll content, even though heme content relative to controls was similar [10]. However, a recent study by Fan et al. [33] revealed that ectopic overexpression of Arabidopsis FC1 increases chlorophyll accumulation. This indicates that mechanisms controlling tetrapyrrole biosynthesis are highly complex, with further investigations necessary to elucidate interactions between chlorophyll and heme branches.
Photosynthesis is a highly complex and highly regulated process, ultimately determined by three factors (Asat, gs and CE). Our results found that overexpression of HvFC1 and HvFC2 each improve Asat (+13%), gs (+16%) and CE (+11%) (Figure 6b–d), implying that both barley FC isoforms are likely to be either directly involved in photosynthesis or the regulation of its components. In this context, we expect that a greater gs allows a greater rate of CO2 diffusion into the leaf. This in turn improves photosynthetic capacity, as indicated by an improved CE as well as carbon assimilation in both transgenics. Higher CE is unlikely to be a consequence of higher Rubisco content, as both HvFC1 and HvFC2 transgenics had similar leaf n concentrations relative to controls (Figure 7a). Further, more detailed investigations are warranted towards determining whether altered Rubisco activity can explain the improved CE in these transgenics. Furthermore, we found that photosynthetic performance is not a likely result of altered Fe homeostasis (Figure 7b).
To date, there is no direct evidence supporting a role for FC or heme in photosynthesis. However, heme is a part of the cytochrome b6f complex, which has been demonstrated to be important for electron transport between PSI and PSII [6,7]. Therefore, one possible reason for improved carbon assimilation of HvFC overexpressing transgenics could be due to their higher electron transport capacity. In order to investigate whether HvFC overexpressing transgenics contain significantly higher amounts of cytochrome b6, immunoblot assays were conducted. However, a consistent and reliable amount of targeted protein could not be detected. Alternatively, future studies using the material generated in this study should be aimed at investigating the abundance of heme-bound cytochrome b6 in HvFC overexpressing transgenics versus control plants.
Another likely reason for the observed increase in photosynthetic performance of HvFC overexpressing transgenics may be related to the ability of heme to stimulate retrograde signalling. In plant cells, the majority of heme binds covalently and non-covalently to a large number of hemo-proteins, such as nitrate reductase, nicotinamide adenine dinucleotide phosphate (NADPH) oxidases, peroxidases and catalases, as well as b- and c-type cytochromes [9,15,16]. Additionally, a small proportion of the total heme content exists as unbound or in the free heme pool. It has been proposed that this free heme pool can act as a plastid signal for modulating the expression of photosynthesis-associated nuclear genes [9,10,11]. By this mode of action, we would infer that HvFC1 and HvFC2 ectopic over-expressors may induce an increase in the free heme pool, which may, in turn, trigger nuclear gene expression for enzymes that affect carboxylation rate. We have attempted to evaluate the total and free heme pools in these barley transgenic lines by acid acetone extraction (Adrian Lutz pers comm.). However, analysis was confounded by difficulties in measuring free heme because it rapidly undergoes demetalation and is converted to Proto IX. In line with our observations, Espinas et al. [32] reported that there is a substantial risk of losing heme when plant tissues are processed by acid acetone extraction. Therefore, future investigations using the materials we generated should focus on optimising the heme quantification assay. Determination of which photosynthesis-associated nuclear genes are responsive to heme and how they may affect CE should be interrogated.
Even though previous evidence suggests that FC1 and FC2 are involved in distinct cellular functions, collectively, these results indicate that both genes play similar roles in photosynthesis. This study highlights tetrapyrrole biosynthesis as an interesting target towards engineering photosynthesis, a trait that is considered as physiologically complex. The molecular identity of these gene sequences, and the finding that they can modulate photosynthesis, now opens an opportunity to identify native beneficial expression alleles in barley germplasm with a view to stacking these in elite varieties.

5. Patent

The authors declare that a patent was filed and granted for this work (WO20160544624A1).

Supplementary Materials

The following are available online at https://www.mdpi.com/2073-4395/10/9/1370/s1, Figure S1: A schematic illustration of the pMDC32 constitutive expression vector used for barley transformation, which harbours a dual 35S promoter, and either HvFC1 or HvFC2, Figure S2: Similarity comparison of primary polypeptide sequences of barley Ferrochelatase 1 (FC1) and barley Ferrochelatase 2 (FC2) to respective FC counterparts of other plant species, Table S1: Primers used in this study, Table S2: Phenotypic characterization of transgenic lines ectopically overexpressing HvFC1 and HvFC2 relative to WT and null controls.

Author Contributions

Conceptualization, D.S.K.N., E.J.E., R.W. and P.L.; Methodology and Validation, D.S.K.N. and J.T.; Data Curation and Analysis, D.S.K.N.; Manuscript Preparation, D.S.K.N., R.W. and P.L. Funding Acquisition, R.W. and P.L. All authors have read and agreed to the published version of the manuscript.

Funding

This research was supported by the Australian Research Council, the Grains Research and Development Corporation, the Government of South Australia, the University of Adelaide and Dupont Pioneer, USA.

Acknowledgments

We thank Alison Hay and Anzu Okada for generating transgenic vectors, Rohan Singh for barley transformation and Yuan Lee for quantitative RT-PCR analysis. We would also like to thank Julie Hayes, Penny Tricker and Robyn Grove for critical comments on the manuscript.

Conflicts of Interest

The authors declare no conflict of interest.

References

  1. Reynolds, M.; Manes, Y.; Izanloo, A.; Langridge, P. Phenotyping approaches for physiological breeding and gene discovery in wheat. Ann. Appl. Biol. 2009, 155, 309–320. [Google Scholar] [CrossRef]
  2. Reynolds, M.P.; Van-Ginkel, M.; Ribaut, J.M. Avenues for genetic modification of radiation use efficiency in wheat. J. Exp. Bot. 2000, 51, 459–473. [Google Scholar] [CrossRef] [PubMed]
  3. Sharma-Natu, P.; Ghildiyal, M. Potential targets for improving photosynthesis and crop yield. Curr. Sci. 2005, 88, 1918–1928. [Google Scholar]
  4. Tanaka, R.; Tanaka, A. Tetrapyrrole biosynthesis in higher plants. Annu. Rev. Plant Biol. 2007, 58, 321–346. [Google Scholar] [CrossRef] [PubMed]
  5. Chen, M.; Schliep, M.; Willows, R.D.; Cai, Z.-L.; Neilan, B.A.; Scheer, H. A Red-Shifted Chlorophyll. Science 2010, 329, 1318–1319. [Google Scholar] [CrossRef]
  6. Cramer, W.; Soriano, G.; Ponomarev, M.; Huang, D.; Zhang, H.; Martinez, S.; Smith, J. Some new structural aspects and old controversies concerning the cytochrome b 6 f complex of oxygenic photosynthesis. Annu. Rev. Plant Biol. 1996, 47, 477–508. [Google Scholar] [CrossRef]
  7. Kurisu, G.; Zhang, H.; Smith, J.L.; Cramer, W.A. Structure of the cytochrome b6f complex of oxygenic photosynthesis: Tuning the cavity. Science 2003, 302, 1009–1014. [Google Scholar] [CrossRef] [Green Version]
  8. Smith, A.G.; Cornah, J.E.; Roper, J.M. Compartmentation of tetrapyrrole metabolism in higher plants. In A Plant Carbohydrate Metabolism; Bryant, J., Ed.; BIOS Scientific Publishers: Oxford, UK, 1999; pp. 281–294. [Google Scholar]
  9. Terry, M.J.; Smith, A.G. A model for tetrapyrrole synthesis as the primary mechanism for plastid-to-nucleus signaling during chloroplast biogenesis. Front. Plant Sci. 2013, 4, 14. [Google Scholar] [CrossRef] [Green Version]
  10. Woodson, J.D.; Perez-Ruiz, J.M.; Chory, J. Heme synthesis by plastid ferrochelatase i regulates nuclear gene expression in plants. Curr. Biol. 2011, 21, 897–903. [Google Scholar] [CrossRef] [Green Version]
  11. Woodson, J.D.; Perez-Ruiz, J.M.; Schmitz, R.J.; Ecker, J.R.; Chory, J. Sigma factor-mediated plastid retrograde signals control nuclear gene expression. Plant J. 2013, 73, 1–13. [Google Scholar] [CrossRef] [Green Version]
  12. Nagahatenna, D.S.K.; Langridge, P.; Whitford, R. Tetrapyrrole-based drought stress signaling. Plant Biotechnol. 2015, 13, 447–459. [Google Scholar] [CrossRef] [PubMed] [Green Version]
  13. Nagahatenna, D.S.K.; Whitford, R. Ferrochelatase compositions and methods to increase agronomic performance of plants. U.S. Patent WO2016054462A1, 7 April 2016. [Google Scholar]
  14. Al-Karadaghi, S.; Hansson, M.; Nikonov, S.; Jönsson, B.; Hederstedt, L. Crystal structure of ferrochelatase: The terminal enzyme in heme biosynthesis. Structure 1997, 5, 1501–1510. [Google Scholar] [CrossRef]
  15. Cornah, J.E.; Terry, M.J.; Smith, A.G. Green or red: What stops the traffic in the tetrapyrrole pathway? Trends Plant Sci. 2003, 8, 224–230. [Google Scholar] [CrossRef]
  16. Mochizuki, N.; Tanaka, R.; Grimm, B.; Masuda, T.; Moulin, M.; Smith, A.G.; Tanaka, A.; Terry, M.J. The cell biology of tetrapyrroles: A life and death struggle. Trends Plant Sci. 2010, 15, 488–498. [Google Scholar] [CrossRef] [PubMed]
  17. Tanaka, R.; Kobayashi, K.; Masuda, T. Tetrapyrrole metabolism in Arabidopsis thaliana. Arab. Book 2011, 9, e0145. [Google Scholar] [CrossRef] [Green Version]
  18. Moulin, M.; Smith, A. Regulation of tetrapyrrole biosynthesis in higher plants. Biochem. Soc. Trans. 2005, 33, 737–742. [Google Scholar] [CrossRef]
  19. Smith, A.G.; Santana, M.A.; Wallace-Cook, A.D.; Roper, J.M.; Labbe-Bois, R. Isolation of a cDNA encoding chloroplast ferrochelatase from Arabidopsis thaliana by functional complementation of a yeast mutant. J. Biol. Chem. 1994, 269, 13405–13413. [Google Scholar]
  20. Little, H.N.; Jones, O.T. The subcellular loclization and properties of the ferrochelatase of etiolated barley. Biochem. J. 1976, 156, 309–314. [Google Scholar] [CrossRef]
  21. Chow, K.S.; Singh, D.P.; Walker, A.R.; Smith, A.G. Two different genes encode ferrochelatase in Arabidopsis: Mapping, expression and subcellular targeting of the precursor proteins. Plant J. 1998, 15, 531–541. [Google Scholar] [CrossRef]
  22. Nagai, S.; Koide, M.; Takahashi, S.; Kikuta, A.; Aono, M.; Sasaki-Sekimoto, Y.; Ohto, H.; Takamiya, K.; Masuda, T. Induction of isoforms of tetrapyrrole biosynthetic enzymes, AtHEMA2 and AtFC1, under stress conditions and their physiological functions in Arabidopsis. Plant Physiol. 2007, 144, 1039–1051. [Google Scholar] [CrossRef] [PubMed] [Green Version]
  23. Scharfenberg, M.; Mittermayr, L.; Roepenack-Lahaye, E.V.; Schlicke, H.; Grimm, B.; Leister, D.; Kleine, T. Functional characterization of the two ferrochelatases in Arabidopsis thaliana. Plant Cell Environ. 2014, 38, 280–298. [Google Scholar] [CrossRef]
  24. Singh, D.; Cornah, J.; Hadingham, S.; Smith, A. Expression analysis of the two ferrochelatase genes in Arabidopsis in different tissues and under stress conditions reveals their different roles in haem biosynthesis. Plant Mol. Biol. 2002, 50, 773–788. [Google Scholar] [CrossRef] [PubMed]
  25. Papenbrock, J.; Mishra, S.; Mock, H.-P.; Kruse, E.; Schmidt, E.-K.; Petersmann, A.; Braun, H.-P.; Grimm, B. Impaired expression of the plastidic ferrochelatase by antisense RNA synthesis leads to a necrotic phenotype of transformed tobacco plants. Plant J. 2001, 28, 41–50. [Google Scholar] [CrossRef]
  26. Roper, J.M.; Smith, A.G. Molecular localisation of ferrochelatase in higher plant chloroplasts. Eur. J. Biochem. 1997, 246, 32–37. [Google Scholar] [CrossRef] [PubMed]
  27. Chow, K.-S.; Singh, D.P.; Roper, J.M.; Smith, A.G. A Single Precursor Protein for Ferrochelatase-I from Arabidopsis Is Imported in Vitro into Both Chloroplasts and Mitochondria. J. Biol. Chem. 1997, 272, 27565–27571. [Google Scholar] [CrossRef] [Green Version]
  28. Suzuki, T.; Masuda, T.; Singh, D.P.; Tan, F.-C.; Tsuchiya, T.; Shimada, H.; Ohta, H.; Amith, A.G.; Takamiya, K. Two Types of Ferrochelatase in Photosynthetic and Nonphotosynthetic Tissues of Cucumber: Their difference in phylogeny, gene expression, and localization. J. Biol. Chem. 2002, 277, 4731–4737. [Google Scholar] [CrossRef] [Green Version]
  29. Hay, D.; Ortega-Rodes, P.; Fan, T.; Schnurrer, F.; Brings, L.; Hedtke, B.; Grimm, B. Transgenic Tobacco Lines Expressing Sense or Antisense FERROCHELATASE 1 RNA Show Modified Ferrochelatase Activity in Roots and Provide Experimental Evidence for Dual Localization of Ferrochelatase 1. Plant Cell Physiol. 2016, 57, 2576–2585. [Google Scholar] [CrossRef] [Green Version]
  30. Lister, R.; Chew, O.; Rudhe, C.; Lee, M.-N.; Whelan, J. Arabidopsis thaliana ferrochelatase-I and-II are not imported into Arabidopsis mitochondria. FEBS Lett. 2001, 506, 291–295. [Google Scholar] [CrossRef] [Green Version]
  31. Masuda, T.; Suzuki, T.; Shimada, H.; Ohta, H.; Takamiya, K. Subcellular localization of two types of ferrochelatase in cucumber. Planta 2003, 217, 602–609. [Google Scholar] [CrossRef]
  32. Espinas, N.A.; Kobayashi, K.; Sato, Y.; Mochizuki, N.; Takahashi, K.; Tanaka, R.; Masuda, T. Allocation of Heme Is Differentially Regulated by Ferrochelatase Isoforms in Arabidopsis Cells. Front. Plant Sci. 2016, 7, 1326. [Google Scholar] [CrossRef] [PubMed] [Green Version]
  33. Fan, T.; Roling, L.; Meiers, A.; Brings, L.; Ortega-Rodes, P.; Hedtke, B.; Grimm, B. Complementation studies of the Arabidopsis fc1 mutant substantiate essential functions of ferrochelatase 1 during embryogenesis and salt stress. Plant Cell Environ. 2019, 42, 618–632. [Google Scholar] [CrossRef]
  34. Miyamoto, K.; Tanaka, R.; Teramoto, H.; Masuda, T.; Tsuji, H.; Inokuchi, H. Nucleotide Sequences of cDNA Clones Encoding Ferrochelatase from Barley and Cucumber. Plant Physiol 1994, 105, 769–770. [Google Scholar] [CrossRef] [PubMed]
  35. Hall, B.G. Building phylogenetic trees from molecular data with MEGA. Mol. Biol. Evol. 2013, 30, 1229–1235. [Google Scholar] [CrossRef] [PubMed] [Green Version]
  36. Curtis, M.; Grossniklaus, U. A Gateway Cloning Vector Set for High-Throughput Functional Analysis of Genes in Planta. Plant Physiol. 2003, 133, 462–469. [Google Scholar] [CrossRef] [PubMed] [Green Version]
  37. Tingay, S.; McElroy, D.; Kalla, R.; Fieg, S.; Wang, M.; Thornton, S.; Brettell, R. Agrobacterium tumefaciens-mediated barley transformation. Plant J. 1997, 11, 1369–1376. [Google Scholar] [CrossRef]
  38. Matthews, P.R.; Wang, M.-B.; Waterhouse, P.M.; Thornton, S.; Fieg, S.J.; Gubler, F.; Jacobsen, J.V. Marker gene elimination from transgenic barley, using co-transformation with adjacenttwin T-DNAs’ on a standard Agrobacterium transformation vector. Mol. Breed. 2001, 7, 195–202. [Google Scholar] [CrossRef]
  39. Sambrook, J.; Russell, D.W. Molecular Cloning: A Laboratory Manual, 3rd ed.; Cold Spring Harbor: New York, NY, USA, 2001; Volume 5, pp. 35–39. [Google Scholar]
  40. Burton, R.A.; Shirley, N.J.; King, B.J.; Harvey, A.J.; Fincher, G.B. The CesA Gene Family of Barley. Quantitative Analysis of Transcripts Reveals Two Groups of Co-Expressed Genes. Plant Physiol. 2004, 134, 224–236. [Google Scholar] [CrossRef] [Green Version]
  41. Garnett, T.; Conn, V.; Plett, D.; Conn, S.; Zanghellini, J.; Mackenzie, N.; Enju, A.; Francis, K.; Holtham, L.; Roessner, U.; et al. The response of the maize nitrate transport system to nitrogen demand and supply across the lifecycle. New Phytol. 2013, 198, 82–94. [Google Scholar] [CrossRef] [Green Version]
  42. Wheal, M.S.; Fowles, T.O.; Palmer, L.T. A cost-effective acid digestion method using closed polypropylene tubes for inductively coupled plasma optical emission spectrometry (ICP-OES) analysis of plant essential elements. Anal. Methods 2011, 3, 2854–2863. [Google Scholar] [CrossRef]
  43. Hiscox, J.D.; Israelstam, G.F. A method for the extraction of chlorophyll from leaf tissue without maceration. Can. J. Bot. 1979, 57, 1332–1334. [Google Scholar] [CrossRef]
  44. Dittami, S.M.; Michel, G.; Collen, J.; Boyen, C.; Tonon, T. Chlorophyll-binding proteins revisited—A multigenic family of light-harvesting and stress proteins from a brown algal perspective. BMC Evol. Biol. 2010, 10, 365–379. [Google Scholar] [CrossRef] [PubMed] [Green Version]
  45. Natesan, S.K.A.; Sullivan, J.A.; Gray, J.C. Stromules: A characteristic cell-specific feature of plastid morphology. J. Exp. Bot. 2005, 56, 787–797. [Google Scholar] [CrossRef] [PubMed]
  46. Arimura, S.; Tsutsumi, N. A dynamin-like protein (ADL2b), rather than FtsZ, is involved in Arabidopsis mitochondrial division. Proc. Natl. Acad. Sci. USA 2002, 99, 5727–5731. [Google Scholar] [CrossRef] [Green Version]
  47. Arimura, S.; Yamamoto, J.; Aida, G.P.; Nakazono, M.; Tsutsumi, N. Frequent fusion and fission of plant mitochondria with unequal nucleoid distribution. Proc. Natl. Acad. Sci. USA 2004, 101, 7805–7808. [Google Scholar] [CrossRef] [Green Version]
  48. Suzuki, T.; Masuda, T.; Inokuchi, H.; Shimada, H.; Ohta, H.; Takamiya, K. Overexpression, enzymatic properties and tissue localization of a Ferrochelatase of cucumber. Plant Cell Physiol. 2000, 41, 192–199. [Google Scholar] [CrossRef] [Green Version]
  49. Nijs, I.; Behaeghe, T.; Impens, I. Leaf Nitrogen Content as a Predictor of Photosynthetic Capacity in Ambient and Global Change Conditions. J. Biogeogr. 1995, 22, 177–183. [Google Scholar] [CrossRef]
  50. Sobotka, R.; Tichy, M.; Wilde, A.; Hunter, C.N. Functional assignments for the carboxyl-terminal domains of the ferrochelatase from Synechocystis PCC 6803: The CAB domain plays a regulatory role, and region II is essential for catalysis. Plant Physiol. 2011, 155, 1735–1747. [Google Scholar] [CrossRef] [Green Version]
  51. Takahashi, K.; Takabayashi, A.; Tanaka, A.; Tanaka, R. Functional analysis of light-harvesting-like protein 3 (LIL3) and its light-harvesting chlorophyll-binding motif in Arabidopsis. J. Biol. Chem. 2014, 289, 987–999. [Google Scholar] [CrossRef] [Green Version]
  52. Storm, P.; Tibiletti, T.; Hall, M.; Funk, C. Refolding and enzyme kinetic studies on the ferrochelatase of the cyanobacterium Synechocystis sp. PCC 6803. PLoS ONE 2013, 8, e55569. [Google Scholar] [CrossRef] [Green Version]
  53. Kang, K.; Lee, K.; Park, S.; Lee, S.; Kim, Y.; Back, K. Overexpression of Rice Ferrochelatase I and II Leads to Increased Susceptibility to Oxyfluorfen Herbicide in Transgenic Rice. J. Plant Biol. 2010, 53, 291–296. [Google Scholar] [CrossRef]
  54. Vothknecht, U.C.; Kannangara, C.G.; von Wettstein, D. Barley glutamyl tRNA (Glu) reductase: Mutations affecting haem inhibition and enzyme activity. Phytochemistry 1998, 47, 513–519. [Google Scholar] [CrossRef]
Figure 1. The tetrapyrrole biosynthesis pathway with major end products (bold text) and some catalytic enzymes. GluTR; Glutamyl-tRNA reductase, Protogen IX oxidase; Protoporphyrinogen IX oxidase.
Agronomy 10 01370 g001
Figure 2. Phylogenetic relationship of HvFC1 and HvFC2 with other FC from grass and dicot species. At, Arabidopsis (Arabidopsis thaliana); Cs, cucumber (Cucumis sativa); Hv, barley (Hordeum vulgare); Os, rice (Oryza sativa); Sit, foxtail millet (Setaria italica); Sbi, Sorghum (Sorghum bicolor); Zma, Maize (Zea maize). The maximum likelihood tree was constructed, and reliability of the tree was estimated using bootstrap method.
Agronomy 10 01370 g002
Figure 3. Differential expression profiles of HvFC1 and HvFC2 in photosynthetic and non-photosynthetic tissues. Data are presented as means ± standard error of three replicates. Means with the same letter are not significantly different at p < 0.05, one-way analysis of variance (ANOVA).
Agronomy 10 01370 g003
Figure 4. Transient expression of HvFC1-GFP fusion protein in onion epidermal cells. (a) Bright field image. (b) Red-fluorescent signal from plastid localised AtHEMA2-RFP. (c) GFP fluorescence from HvFC1-GFP was located on either irregularly or oval-shaped structures that are typical of onion cell proplastids and their associated stromules (arrows). (d) Merged channels showing green and red colocalisation as yellow. Image was taken 24 h after bombardment. Bar 100 μm.
Agronomy 10 01370 g004
Figure 5. Molecular identification of HvFC overexpression lines. (a) Enhanced transcript levels of HvFC1 and HvFC2, in three selected single-copy independent transformation events (T1) relative to WT and null segregant controls (i.e., Lacking transgene). Data are presented as means ± standard error for six replicates. Means with the same letter are not significantly different at p < 0.05, one-way ANOVA. (b) Immunoblot analysis of HvFC in three biological replicates of the highest overexpressing transgenic lines (2X35S::FC1–28 and 2X35S::FC2–25) relative to WT and null controls. The Coomasie (Coom.)-stained blot served as a loading control. (c) Detection of the presence or absence of HvFC1 and HvFC2 transgenes using polymerase chain reaction (PCR) with transgene-specific primers. Lane (-) is a negative control (water). 1–5, five biological replicates for each independent transformation event.
Agronomy 10 01370 g005
Figure 6. Photosynthetic performance of HvFC overexpressing transgenics relative to controls. (a) Chlorophyll a and b content, (b) photosynthesis rate under saturated light (Asat), (c) stomatal conductance (gs), and (d) carboxylation efficiency (CE) of three independent transformation events overexpressing either HvFCI or HvFC2 relative to WT and null controls. Data are shown as mean values ± standard error from 4 to 5 different plants. Means with the same letter are not significantly different at p < 0.05, one-way ANOVA.
Agronomy 10 01370 g006
Figure 7. (a) Leaf n, and (b) Leaf total Fe concentration of transgenic barley lines over-expressing either HvFC1 or HvFC2 relative to WT and null controls. Data are shown as mean values ± standard error from three different plants. Means with the same letter are not significantly different at p < 0.05, one-way ANOVA.
Agronomy 10 01370 g007

