Article

Characterization and Analysis of Anthocyanin-Related Genes in Wild-Type Blueberry and the Pink-Fruited Mutant Cultivar ‘Pink Lemonade’: New Insights into Anthocyanin Biosynthesis

1
Genetic Improvement of Fruits and Vegetables Laboratory, Henry A.Wallace Beltsville Agricultural Research Center, U.S. Department of Agriculture-Agricultural Research Service, Beltsville, MD 20705, USA
2
Department Genetics, ETSIAM, University of Cordoba, Agrifood Campus of International Excellence (ceiA3), 14071 Cordoba, Spain
3
Genetic Improvement of Fruits and Vegetables Laboratory, at Rutgers University P.E. Marucci Center for Blueberry and Cranberry Research and Extension, U.S. Department of Agriculture-Agricultural Research Service, Chatsworth, NJ 08019, USA
*
Authors to whom correspondence should be addressed.
Agronomy 2020, 10(9), 1296; https://doi.org/10.3390/agronomy10091296
Submission received: 23 July 2020 / Revised: 20 August 2020 / Accepted: 27 August 2020 / Published: 1 September 2020
(This article belongs to the Special Issue Development and Identification of Blueberry Germplasm Resources)

Abstract

:
Blueberries are one of the richest sources of antioxidants, such as anthocyanins, among fruits and vegetables. Anthocyanin mutants, like the pink-fruited cultivar ‘Pink Lemonade’, are valuable resources for investigating anthocyanin biosynthesis in blueberries. In this study, we examined expression of flavonoid pathway genes during fruit development in wild-type, blue-fruited blueberries using quantitative real-time PCR. Expression was also compared between wild-type and the pink-fruited ‘Pink Lemonade’. This revealed significantly lower expression in ‘Pink Lemonade’ than in wild-type of nearly all the structural genes examined suggesting that a transcriptional regulator of the pathway was affected. Hence, we compared expression of three known regulatory genes and found that the gene encoding the transcription factor MYB1 was expressed at a significantly lower level in ‘Pink Lemonade’ than in the wild-type. To validate the capacity of this MYB1 to regulate the transcription of anthocyanin genes in blueberries, a transient expression assay was conducted. Results indicated MYB1 overexpression enhanced anthocyanin production. Comparative sequence analysis between wild-type and mutant MYB1 variants found differences in highly conserved features suggesting a mechanistic explanation for the mutant phenotype. Collectively, the results presented here contribute to a better understanding of mechanisms regulating anthocyanin biosynthesis in Vaccinium.

1. Introduction

The U.S. is the world’s largest producer of blueberries (Vaccinium spp.), but production and consumption of blueberries is expanding worldwide. In 2017, U.S. production reached ~261,000 tons with a market value of $820 million [1]. Production is also dramatically increasing in other global regions, with South America and Europe showing the greatest increases in the last decade [2].
One of the reasons for the steadily increasing demand for blueberries over recent years is the acknowledgement that they are one of the healthiest and nutritious dietary sources, among common fruits and vegetables. This is due primarily to their high antioxidant activity (See for review [3]). Antioxidant activities in fruits are largely attributed to phenolic compounds, like flavonoids. The three common types of flavonoids are the flavonols, proanthocyanidins and anthocyanins [4]. Thus, in the blueberry, the characteristic dark blue colored fruit results from the accumulation of anthocyanins that are mostly located in the skin of the berry [5]. Blueberry cultivars with high anthocyanin contents could have an advantage in marketing to consumers, because the greater understanding of the health benefits of anthocyanins (as antioxidants) has contributed to the public awareness of blueberries as a ‘superfood’ [6]. For decades, breeding programs have predominantly focused on releasing varieties with improved commercial and agronomic traits. Recently, breeding programs have turned their focus to fruit quality and to obtaining cultivars with enhanced nutritional value [6,7,8].
Although environmental conditions (such as light and temperature) have been demonstrated to affect the composition of phenolic compounds [9], genetic factors also play a fundamental role in the regulation of secondary metabolites in Vaccinium berries. The complex program of fruit maturation and ripening is a good example: at the early stages of berry development, proanthocyanidins, and flavonols are the major phenolic compounds, whereas the accumulation of anthocyanins begins at the onset of ripening [10,11]. The coordinated variation in flavonoid profile during berry development determines the biological functions. For instance, the astringent proanthocyanidins in unripe berries are suggested to provide protection against predation [12], while anthocyanins as visible flavonoid pigments attract frugivores that help disperse seeds [13].
Extensive research on anthocyanin biosynthesis in many plants has resulted in the elucidation of the biosynthetic pathway and some key mechanisms involved in the regulation of these secondary metabolites. Central to the control of the structural genes, which encode the enzymes that directly participate in the formation of anthocyanins, and other flavonoids, is the role of transcription factors (regulatory genes) that directly regulate multiple steps of the metabolic pathway. The so-called R2R3-MYB regulators are generally the key factors in determining the spatial and temporal accumulation of anthocyanins [14,15]. Together with the R2R3-MYB transcription factor, studies from model species have elucidated the role of the MYB-bHLH-WD40 (also known as MBW) complex, which is thought to recognize responsive elements and act directly upon the promoters of structural genes in the flavonoid pathway [16].
Blueberry species accumulate high levels of anthocyanins, with up to 27 different types of anthocyanins that have been extensively characterized chemically, and their concentrations vary greatly among cultivars [17,18]. The main anthocyanins present in blueberries are galactosides, glucosides and arabinosides of the anthocyanidins delphinidin, cyanidin, petunidin, peonidin and malvidin [6]. However, only recently have the underlying molecular biological and developmental contexts been addressed. The first efforts to develop genomic resources for the species, including the first blueberry transcriptome [19], a draft diploid blueberry genome [20], and a tetraploid blueberry genome database [21], along with more accurate tools for data analysis, are making new studies on the metabolic pathways and regulation of secondary metabolism in blueberry species possible. Additionally, a number of studies aimed at elucidating the control of phenylpropanoid production [11,22,23] are contributing to help frame an integrated view of the molecular characterization of flavonoid biosynthesis over the course of fruit development.
Nevertheless, producing high-throughput sequence information is only one helpful component of genetic improvement. Another component is the ability to associate all these genomic data with systematic and robust characterization of phenotypes. Developed by the Agricultural Research Service (USDA-ARS), the ornamental blueberry cultivar ‘Pink Lemonade’ (‘PL’) is hexaploid that is half rabbiteye (Vaccinium ashei Reade), half highbush-type germplasm [24]. Flowering time is similar to other southern blueberry germplasm, with flowers developing earlier than hardy northern cultivars such as ‘Bluecrop’. The most popular characteristic, defining its major ornamental use, is the bright pink fruit-color at ripe stage [24]. In a 33 cultivar panel, ‘PL’ showed the lowest antioxidant activity and total anthocyanin content, among other chemical properties tested) [5] (Supplementary Figure S1). Additionally, a comparison of 42 cultivars revealed that ‘PL’ contains the main anthocyanin pigments present in other blueberry fruits but shows significant quantitative differences, being the cultivar with the lowest content of delphinidin, petunidin and malvidin derivatives [17]. Thus, the pink-fruited mutant ‘PL’ represents a valuable contrast to the chemistry and physiology of the standard blue-fruited cultivars, hence, a valuable resource for increasing our understanding of anthocyanin biosynthesis in blueberry (Figure 1).
In this study, we used the pink-fruited cultivar ‘PL’ to provide insights into furthering our understanding of anthocyanin biosynthesis in the blueberry and attempt to identify the affected gene in this mutant. Fruits of wild-type blueberry were first collected during different stages of fruit development, and transcript abundance of the major structural and regulatory anthocyanin pathway genes were measured across the time-course of development by quantitative real-time PCR (qPCR). Next, levels of the structural and regulatory genes were compared in wild-type blueberry and the pink-fruited cultivar ‘PL’. We developed a simple method for transient gene expression in the blueberry. Thus, transient expression assays through agroinfiltration were performed on wild-type and mutant fruit using constructs of the best candidate genes to test for mutation complementation. The candidate gene was then isolated and sequenced from mutant and wild-type cultivars, providing valuable new information on the regulation of flavonoid biosynthesis in the blueberry.

2. Materials and Methods

2.1. Search for Anthocyanin Pathway Structural Genes

Using gene names and annotations as descriptive terms under the ‘search sequence’ field, we mined the blueberry transcriptome dataset (BBGD; http://bioinformatics.towson.edu/BBGD454/) to identify genes involved in anthocyanin biosynthesis (CHS, CHI, F3H, F3′H, F3′5′H, DFR, ANS, and UFGT). The BBGD website houses our own blueberry assembled transcriptome sequences from fruit at different stages of development, leaves, and an overall transcriptome assembly. For each gene, a number of contigs were aligned and we obtained a consensus sequence.

2.2. Search for Anthocyanin Pathway Regulatory Genes
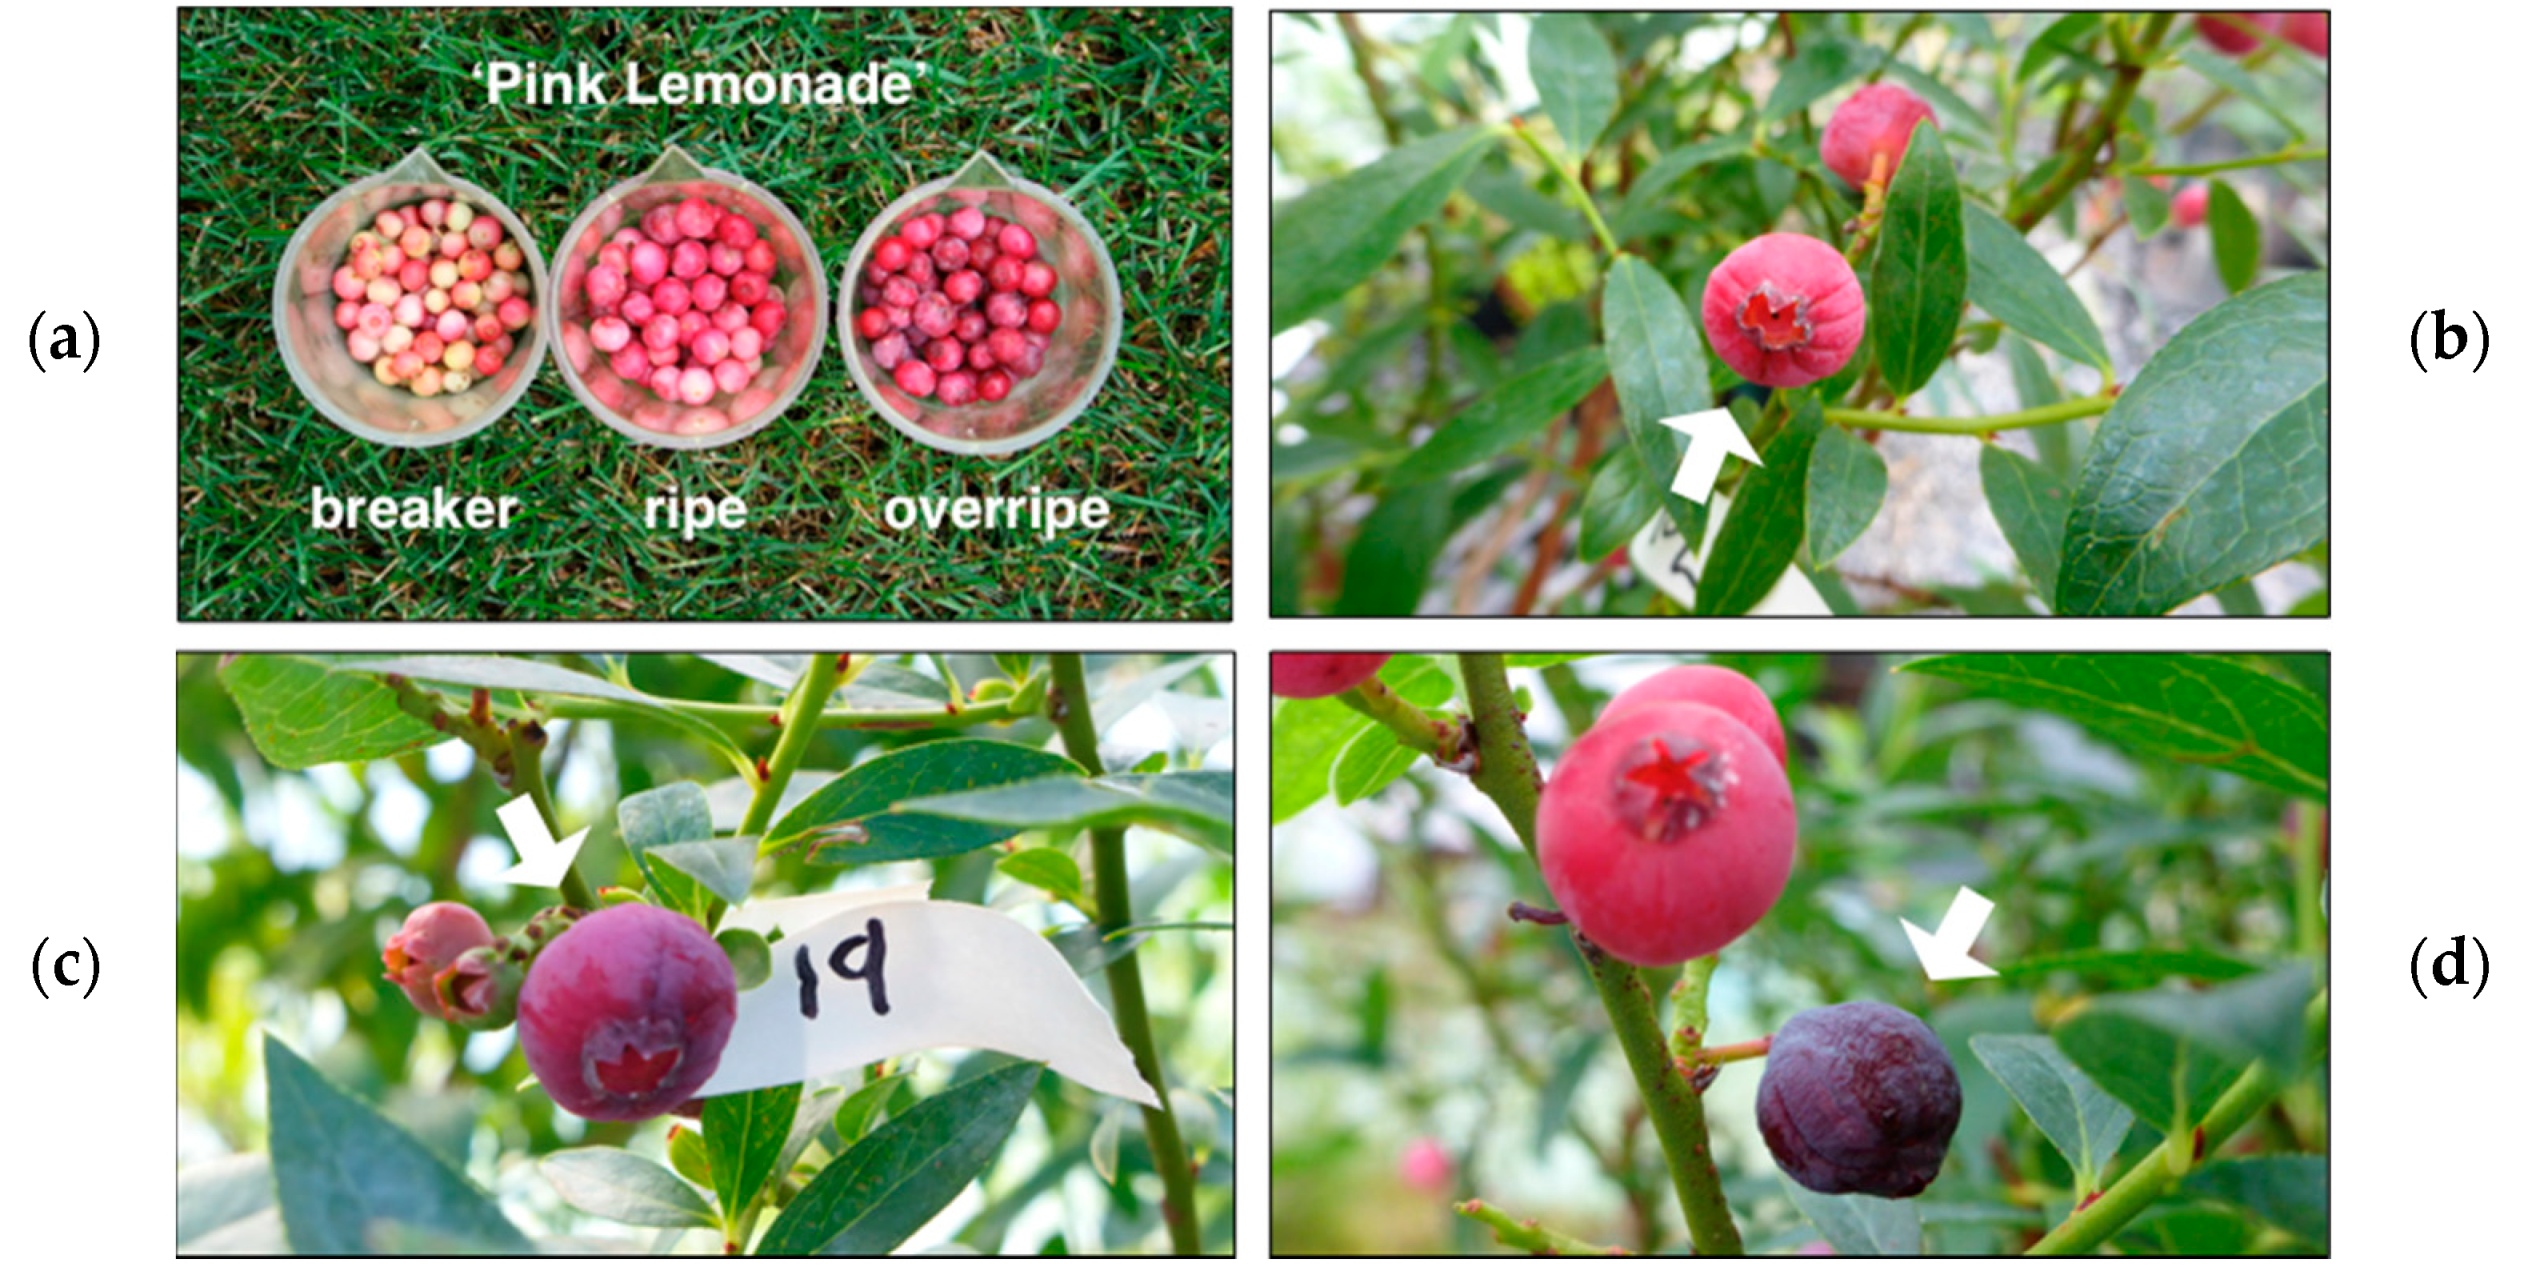
To find anthocyanin pathway regulatory genes from blueberry, sequences of grape (Vitis vinifera L.) transcription factors MYBA1, MYCA1, and WDR1 [25,26] were blasted against the blueberry W85-20 draft genome (www.Vaccinium.org). Resulting scaffold sequences were then blasted against the blueberry transcriptome database (http://bioinformatics.towson.edu/BBGD454/), and blueberry ESTs available in the EST database of NCBI.

2.3. Plant Material

Several fruits were collected from a minimum of five plants of the blue-fruited rabbiteye cultivar ‘Tifblue’ (Vaccinium ashei, 2n = 6x = 72) grown at the USDA-ARS, Beltsville Agricultural Research Center, Beltsville, MD, for each sampling time (four stages of ripening), which we refer to according to the color of the fruit: green, white, pink and ripe (or blue), spanning an interval of ~1.5 months (early June to mid-July). ‘Tifblue’ served as the wild-type control plants. Similarly, fruits of the pink mutant ‘PL’ (ARS 96-138, 2n = 6x = 72) [24] were collected at the ripe stage of development (pink for ‘PL’ and softening). Biological replicates for each time point were collected over two growing seasons. All samples were frozen in liquid nitrogen immediately after harvest and stored at −80 °C.

2.4. RNA Isolation and Quality Controls

For total RNA extractions, each tissue sample made of several leaves, stems and/or fruits, respectively, was ground in liquid nitrogen and incubated at 65 °C in pre-warmed CTAB extraction buffer. Two or three chloroform:IAA (24:1) extractions were performed followed by overnight precipitation with LiCl [27]. RNA pellets were resuspended in DEPC-treated water, precipitated again with ethanol and NaOAc, washed, and finally resuspended in 1 mL DEPC-treated water. RNA concentrations were determined by measuring the optical density at 260 nm using a NanoDrop ND-1000 spectrophotometer (Nanodrop Technologies, Wilmington, DE, USA). RNA quality was assessed by combining information from several control steps. First, purity was inferred from the absorption ratios using the NanoDrop. Only the RNA samples with A260/A280 ratio between 1.70 and 1.95 and A260/A230 greater than 2.0 were used in the analysis. Then, RNA samples were visualized on 1% agarose gels stained with ethidium bromide.

2.5. cDNA Synthesis and Quality Controls

RNA extracts were treated with TURBO™ DNase I (Life Technologies, Carlsbad, CA, USA), prior to cDNA synthesis. Two micrograms of DNase I-treated total RNA were used for the synthesis of cDNA. Complementary DNAs was synthesized by priming with oligo-dT12-18 (Life Technologies), using SuperScriptIII reverse transcriptase (Life Technologies) following the instructions of the provider. Tests for presence of genomic DNA (gDNA) contamination, and qualitative assessment of the reverse transcriptase reaction and the RNA integrity were performed as have been described elsewhere [28]. Briefly, we used a primer pair designed from two different exons of an alcohol dehydrogenase-like blueberry sequence that amplifies a product of 1140 bp using gDNA as template or 528 bp using cDNA as template (primers: NA799F, 5′-CCGCTGGTGATTGAAGAAGT-3′; NA799R, 5′-TTTCGCAACATTTAGCATGG-3′). In tests for gDNA contamination, the 1140 bp band was not amplified from any of the samples. For assessment of the intactness of mRNA and the efficiency of cDNA synthesis we used a 3′:5′ amplification ratio assessment by measuring the integrity of a ubiquitin carboxyl-terminal hydrolase blueberry sequence (UBP14). The 3′:5′ amplification ratio of the UBP14 cDNA fragments was calculated using the comparative Cq method [29]. All ratios were <3.91 (1.66 ± 0.43; mean ± SD). Only if ratios were >4.5-fold would RNA quality be deemed inadequate [30]. Therefore, the cDNAs were judged to be suitable for qPCR analysis.

2.6. Primer Design and qPCR Assay

Primers for qPCR were designed using Primer3 software [31] and the following criteria: Tm of 60 ± 2 °C and PCR amplicon lengths of 65–100 bp, yielding primer sequences with lengths of 20–23 nucleotides and GC contents of 40–60% (Supplementary Table S1). All qPCR primers were tested for specificity using NCBI’s BLAST software [32]. For predicting the secondary structure of the amplicons, we used MFOLD version 3.4 software with default settings of minimal free energy, 50 mM Na+, 3 mM Mg2+, and an annealing temperature of 60 °C [33]. We chose primers that would yield amplicons with minimal secondary structures and melting temperatures that would not hamper annealing. Designed primers were synthesized by Integrated DNA Technologies (Coralville, IA, USA).
PCR was carried out in an IQ5 (Bio-Rad, Hercules, CA, USA) thermal cycler using iQTM SYBR Green Supermix (Bio-Rad) to monitor dsDNA synthesis. Reactions contained 1 μL of the diluted cDNA as a template and 0.150 μM of each primer in a total reaction volume of 20 μL. Master mix was prepared and dispensed into individual wells using electronic Eppendorf Xplorer multipipettes (Eppendorf AG, Hamburg, Germany). The following standard thermal profile was used for all PCRs: polymerase activation (95 °C for 3 min), amplification and quantification cycles repeated 40 times (95 °C for 30 s, 60 °C for 1 min). The specificity of the primer pairs was checked by melting-curve analysis performed by the PCR machine after 40 amplification cycles (60–95 °C). Fluorescence was analyzed using iQ5 2.1 standard optical system analysis software v2.1 (Bio-Rad). All amplification plots were analyzed using a baseline threshold of 30 relative fluorescence units (RFU) to obtain Cq (quantification cycle) values for each gene-cDNA combination. Supplementary Table S1 shows the overall mean qPCR amplification efficiency of each primer pair (PCR E) estimated from the data obtained from the exponential phase of each individual amplification plot and the equation (1 + E) = 10slope using LinReg software and the criteria of including three–five fluorescent data points with R2 ≥ 0.998 to define a linear regression line [34].

2.7. qPCR Data Analysis

Calculations were performed using the advanced quantification model with efficiency correction, multiple reference gene normalization, and use of error propagation rules described by [35]. Normalization was performed using two stably expressed blueberry reference genes identified previously: ubiquitin-conjugating enzyme (UBC28) and the sequence encoding a hypothetical protein Vc4g26410 (Vc410) [36]. PCR E of the references was: E_UBC28 = 0.948 ± 0.063; E_Vc410 = 0.968 ± 0.065 (mean ± SD). To confirm the stable expression of the references in our material, we calculated the mean of their normalized relative quantities over all of the samples and the values were closely distributed around 1-fold (1.082 for UBC28 and 0.943 for Vc410). Maximum fold expression difference between samples was 1.56 and 1.57 for UBC28 and Vc410, respectively.

2.8. Phylogenetic Analysis

Amino acid sequences of functionally characterized flavonoid biosynthesis genes related to MYB family proteins were obtained from Genbank and aligned using MUSCLE. A phylogenetic tree was constructed based on the alignment of the R2R3 DNA-binding domains by using the maximum likelihood (ML) method with the MEGA software version 6.06 [37]. The evolutionary distances were computed using the Poisson correction method implemented in MEGA and are in the units of the number of amino acid substitutions per site. The reliability of the tree was evaluated by bootstrap analysis with 1000 replicates. The protein sequence data were obtained from the protein database (DDBJ/EMBL/GenBank) and are as follows: AtPAP1 (AAG42001), AtPAP2(NP_176813), AtTT2 (Q9FJA2), AtMYB12 (NP_182268), AtMYB111 (NP_199744), CaA (CAE75745), DkMYB2 (BAI49719), DkMYB4 (BAI49720.1), FvR2R3 (ABX79948), MdMYB1 (ABK58136), MdMYB10 (ABB84753), MrMYB1 (ADG21957), PaR2R3 (ADY15304), PaMYB10 (AJB28489), PpR2R3 (ABX79945), PhANS2 (ADQ00392), PhPH4 (AAY51377), PcMYB10 (ABX71487), SIANT1 (AAQ55181), VcMYBPA1 (AEV21970), VmMYB2 (ADK79068), VuMYBPA1 (AKC94840), VvMYBA1 (ABD72953), VvMYBA2 (BAD18978), VvMYB5a (AAS68190), VvMYB5b (AAX51291), VvMYBF1 (ACT88298), VvMYBPA1 (CAJ90831), VvMYBPA2 (ACK56131). The blueberry MYB sequence has been deposited in GenBank as accession MT022440.

2.9. Transient Expression Assay

The deduced coding sequences of the F3′5′H gene and MYB transcription factor were used to design primers in order to amplify the full open reading frame of each. Amplified products were gel-extracted, inserted into pCR 2.1-TOPO vector (TOPO TA cloning kit, Invitrogen, Carlsbad, CA, USA) and sequenced (Macrogen, Rockville, MD, USA) using M13 forward and reverse primers to confirm gene identity. Next, the F3′5′H gene and MYB transcription factor were each cloned into the Xba 1 and Sac 1 sites of pBI121, transformed into Escherichia coli for plasmid propagation, purified and electroporated into Agrobacterium tumefaciens LB44004 cells using a BioRad Gene Pulser II Electroporation System (Bio-Rad Laboratories, Hercules, CA, USA). Colonies were transferred to 15 mL polypropylene tubes containing 4 mL of yeast–mannitol liquid medium amended with 50 µg/mL of kanamycin. Cultures were incubated for two days at 28 °C with shaking (175 rpm). Cells were collected by centrifugation and resuspended in minimal medium. Acetosyringone was added at 1 µl/mL and cells incubated for 3 h with shaking at 100 rpm to prime cells for infiltration. Transient expression assays were performed through overexpression of the ‘Tifblue’ F3′5′H gene (before the ripe developmental stage in wild-type and mutant) and MYB transcription factor driven by the cauliflower mosaic virus (CaMV) 35S promoter. Control treatments used Agrobacterium cells harboring the native pBI121 vector without additional inserts. The inoculations involved making small incisions, with a syringe needle, on the berry skin followed by infiltration of about 5 microliters of Agrobacterium suspension. There were about three infiltrations per berry.

2.10. Sequence Analysis

The deduced proteins from MYB sequences (MYB1) cloned from wild-type and ‘PL’ were aligned using the default settings of the MUSCLE program implemented in Geneious R7 software. For comparative purposes, we used the highly conserved R2R3 region as well as the functional motif SG6 ((K/R)P(Q/R)P(Q/R)(S/T)F).

3. Results

3.1. Search for Anthocyanin Genes in the Blueberry Genome and Isolation of Candidate Genes

A total of 25 contigs potentially involved in anthocyanin biosynthesis were identified from searches of the blueberry transcriptome dataset. This dataset includes next generation 454 sequences from cDNA libraries of the V. corymbosum L. cultivar Bluecrop, prepared from fruit at four stages of development (green, white, pink, and blue), flower buds at four stages of cold acclimation, and leaves. We aligned the resulting contigs and used the consensus sequence to annotate full-length blueberry genes (with the exception of F3′H, which was a partial sequence). These candidate sequences represent most of the genes of the flavonoid pathway. Most of the contigs contributing to these genes came from the assembly of all the ‘berry’ sequences together or the ‘pink stage’ library, whereas the ‘green stage’ library did not contain any anthocyanin-related contigs. The ‘pink stage’ library was also the only library containing contigs that were predicted to encode the 8 proteins (Supplementary Table S2). The deduced amino acid sequences ranged from 218 to 512 aa. To confirm the annotation of the sequences, we performed blastp searches using the deduced protein from each consensus sequence as query against the NCBI non-redundant (nr) protein database and identified the best scoring protein for each search. Each blueberry protein exhibited 74% to 100% identity to the corresponding best-scoring proteins from the other species (Supplementary Table S3).

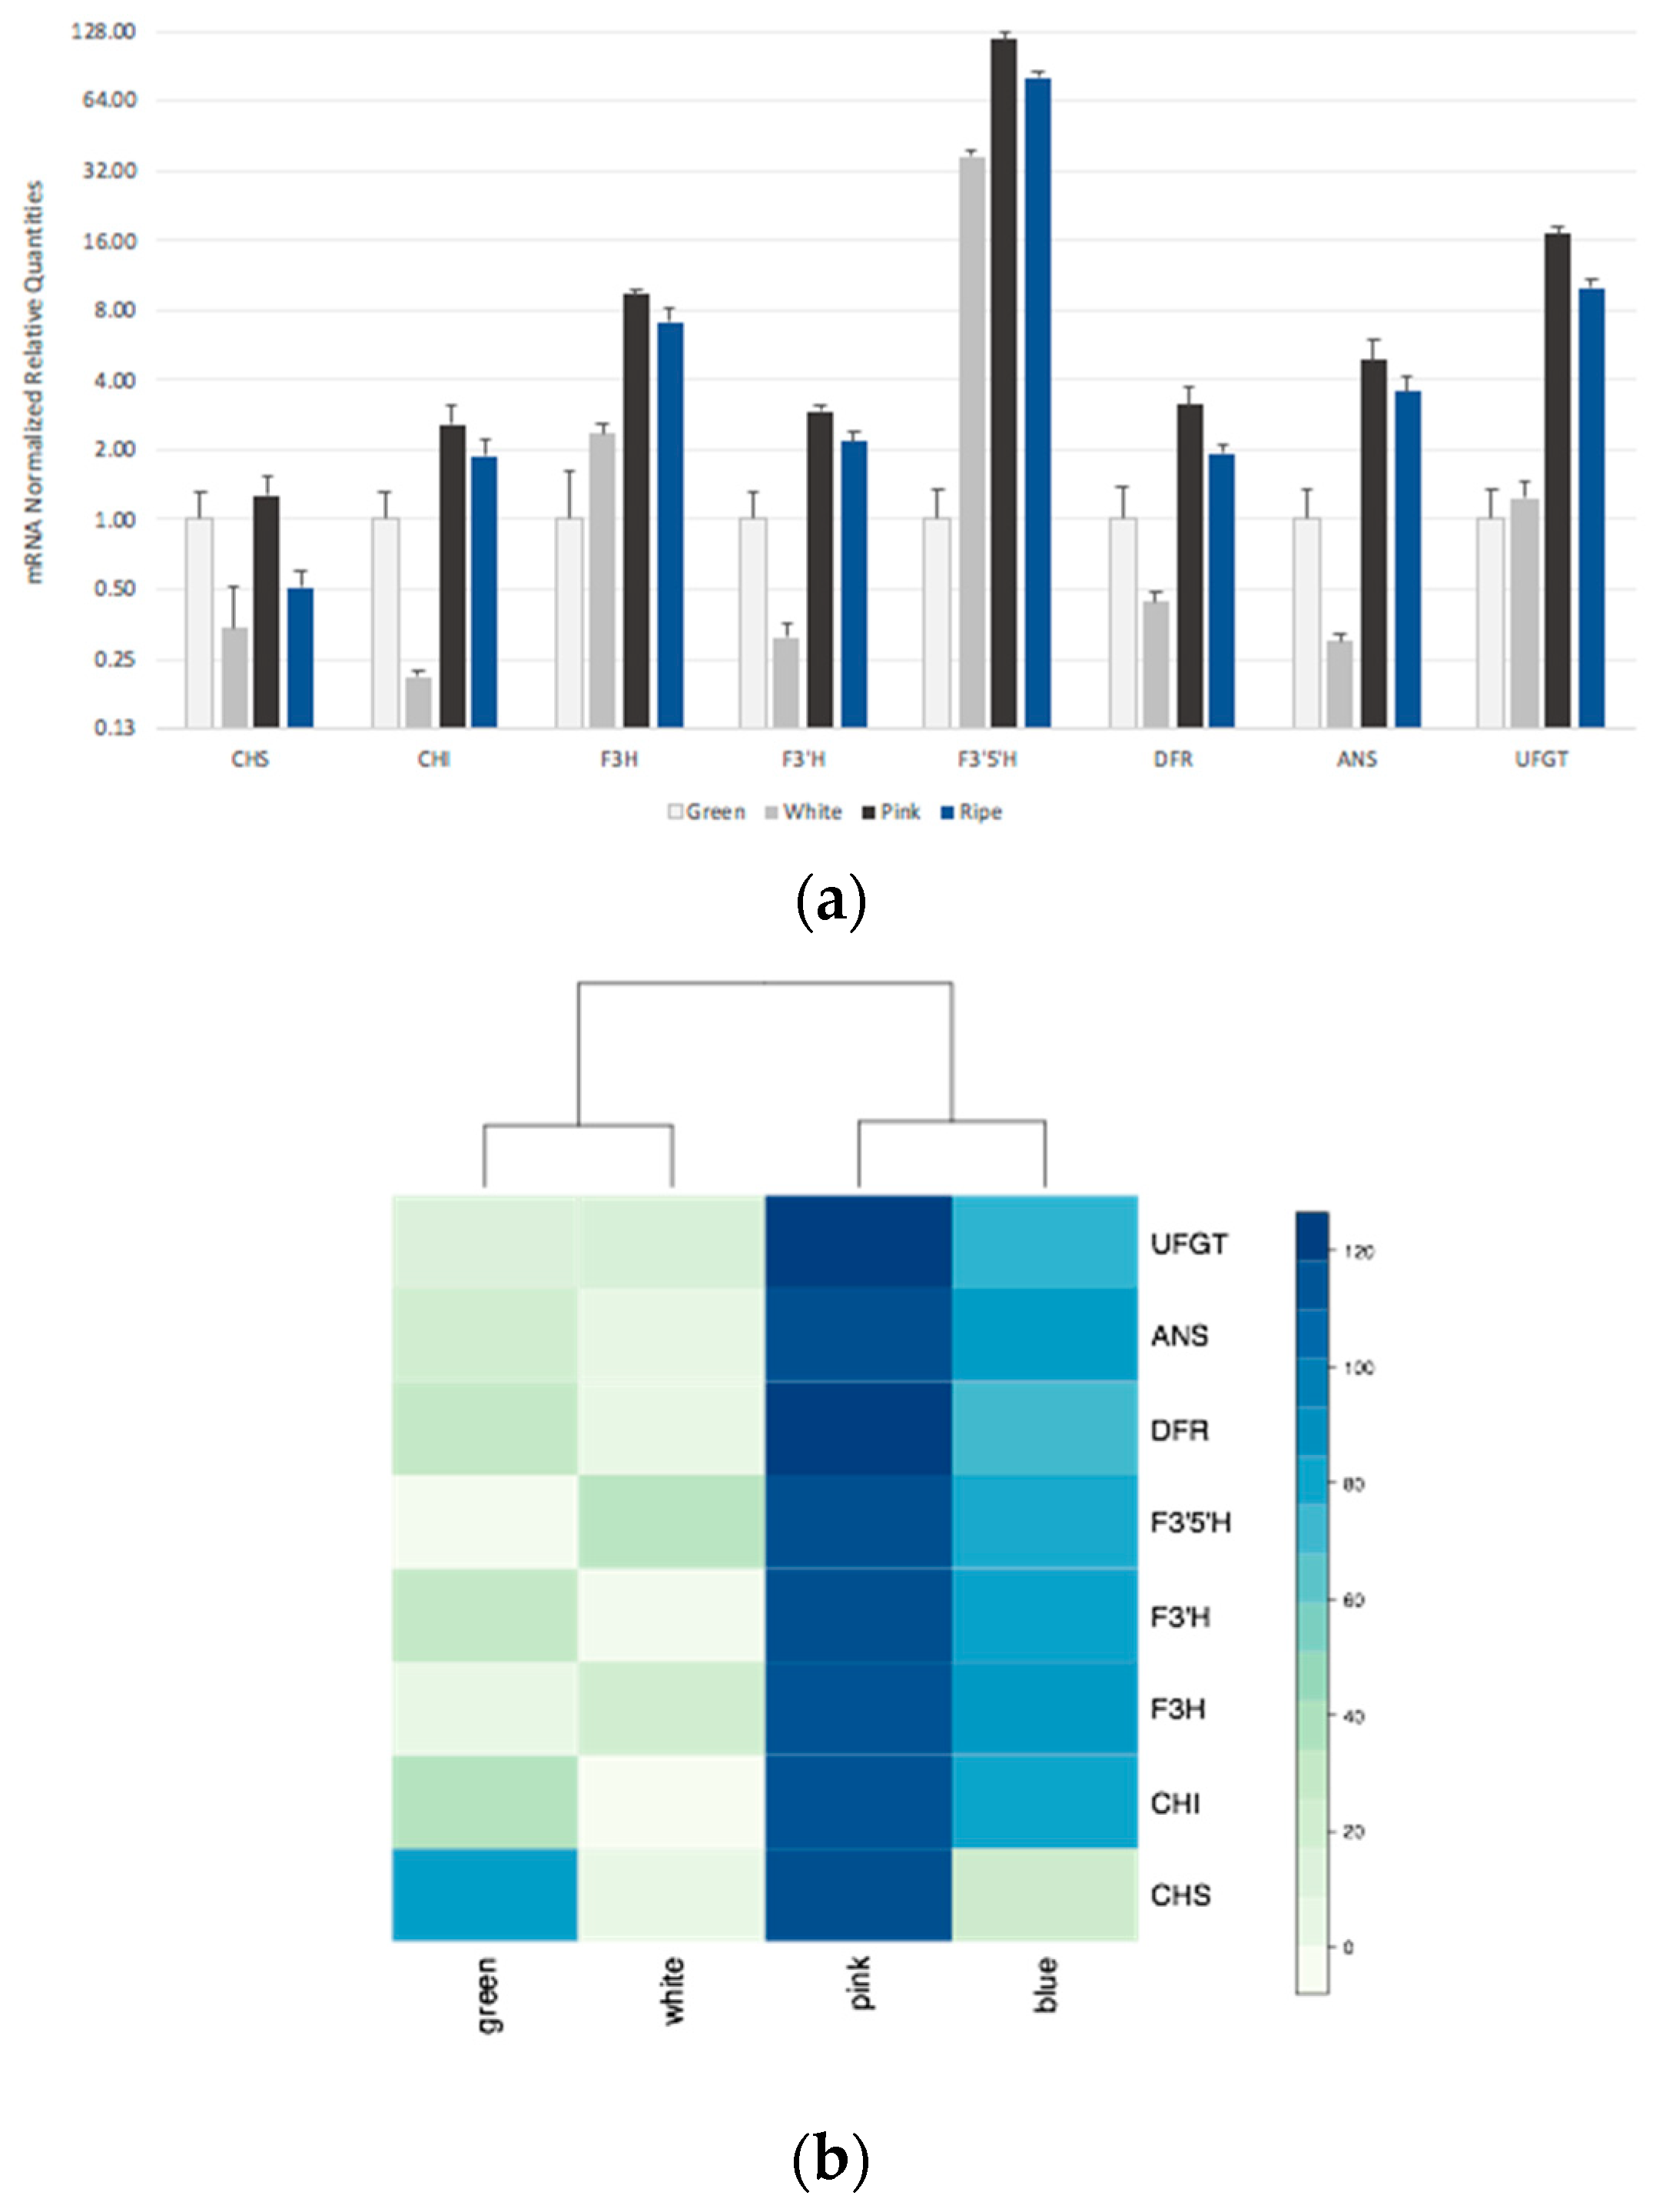
3.2. Expression of Structural Genes in Developing Fruits of Wild-Type Berries

The expression of eight flavonoid pathway genes (CHS, CHI, F3H, F3´H, F3´5´H, DFR, ANS and UFGT) was investigated in samples collected at four different stages of fruit development in the wild-type ‘Tifblue’ by qPCR. All the genes were expressed in berries (Figure 2a). The genes were highly expressed at the later stages of ripening (pink and blue stages) when the fruit color development occurs. However, some genes exhibited a biphasic abundance pattern (CHS, CHI, F3′H, DFR, ANS) with early (green stage) and late (pink stage) peak profiles, while F3H, F3′5′H, and UFGT gene transcripts increased more steadily until reaching the pink stage and then began to decline. The expression of F3′5′H transcripts at the pink stage was the highest level represented in the upregulated gene set (~130-fold higher relative to the green stage), suggesting that F3′5′H transcription, which catalyzes two hydroxylations in the 3′ and 5′ positions of flavonoids, may play a significant role in driving the accumulation of anthocyanins. We performed hierarchical clustering of the expression levels of the flavonoid pathway genes, and our analysis indicated a functional correlation based on both developmental phases: green–white vs. pink–blue (Figure 2b), which suggests coordinated temporal control of the anthocyanin biosynthesis pathway.

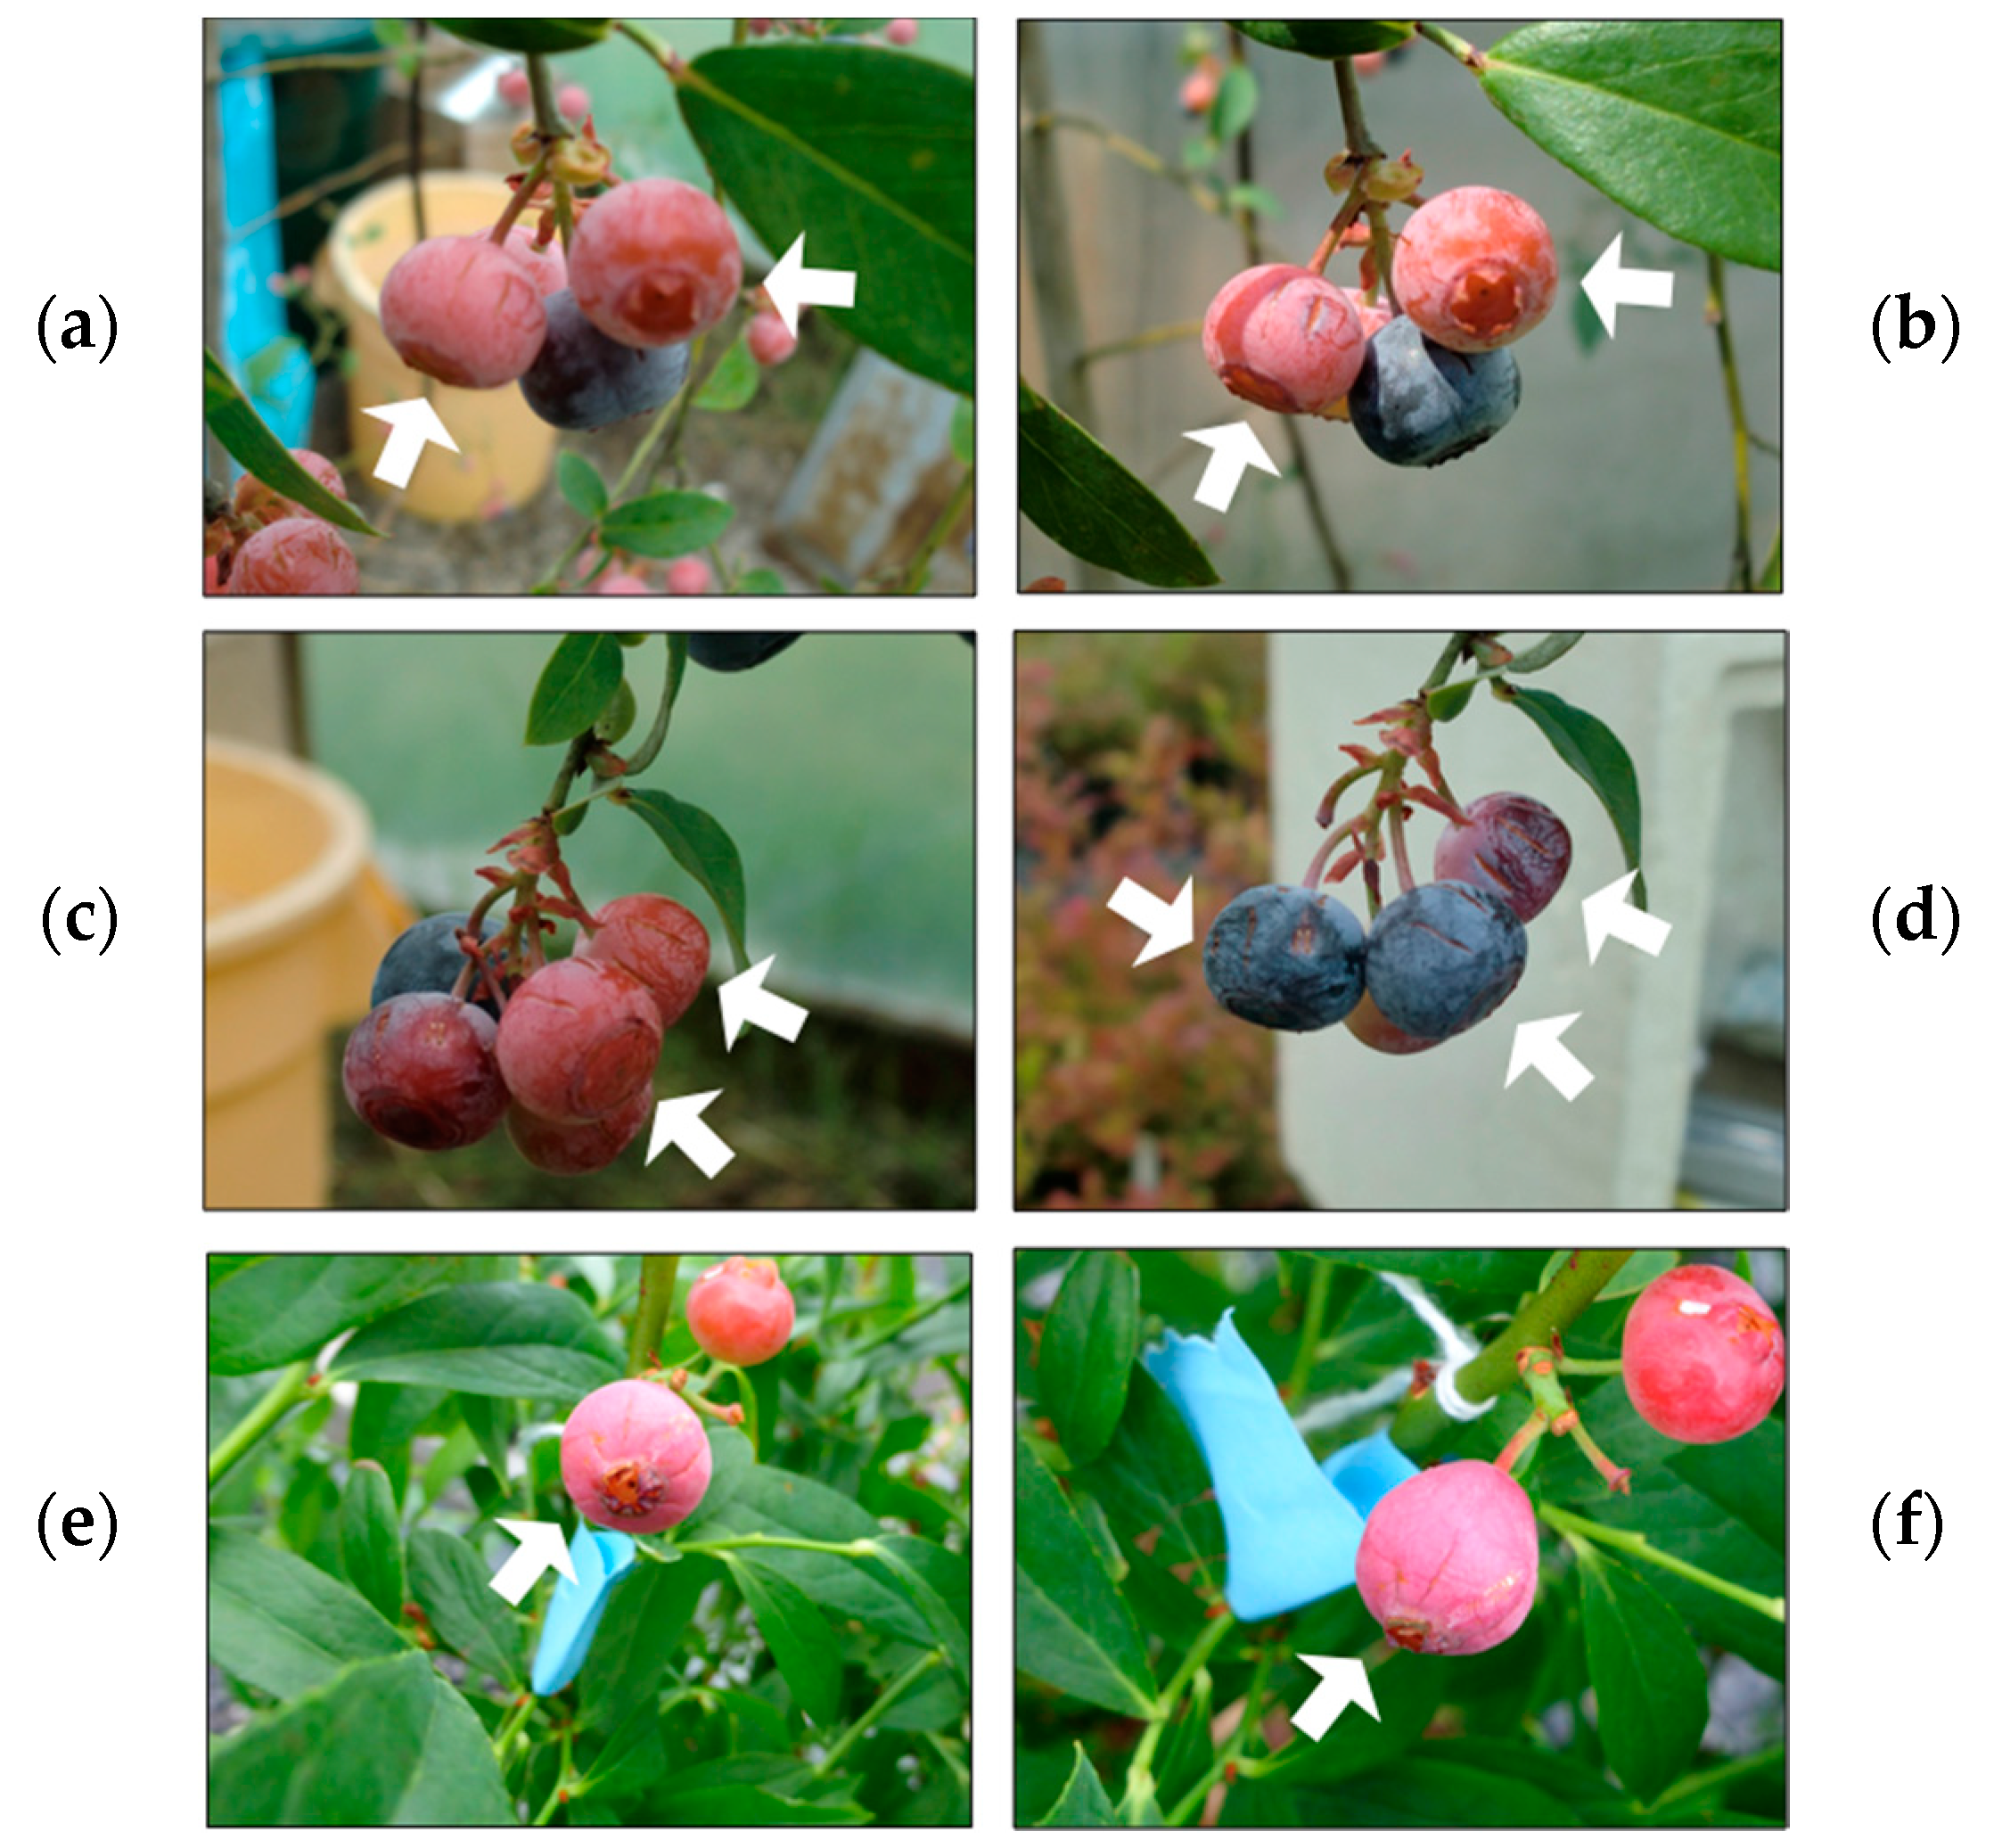
3.3. Transient Expression of F3′5′H in Developing Fruits of Wild-Type and Color Mutants

To further characterize the activity of the F3′5′H gene, we performed transient Agrobacterium infiltration assays on berries of both the wild-type and the color mutant species. The analysis of the F3′5′H gene was studied at the pink stage, when its expression level in berries was at its maximum (Figure 2). In the wild-type ‘Tifblue’, the overexpression of the F3′5′H gene resulted in a change in coloration, from pink to blue, as soon as 48 h post-infiltration (hpi), whereas the negative control berries (no overexpression of any genes) remained at the pink stage even one week later. To confirm that activation of anthocyanin biosynthesis based on overexpression of F3′5′H was not genotype-dependent, we also infiltrated other wild-type plants and obtained similar results (Supplementary Figure S2). However, infiltration of the mutant ‘PL’ berries with F3′5′H did not show any change in color (Figure 3).

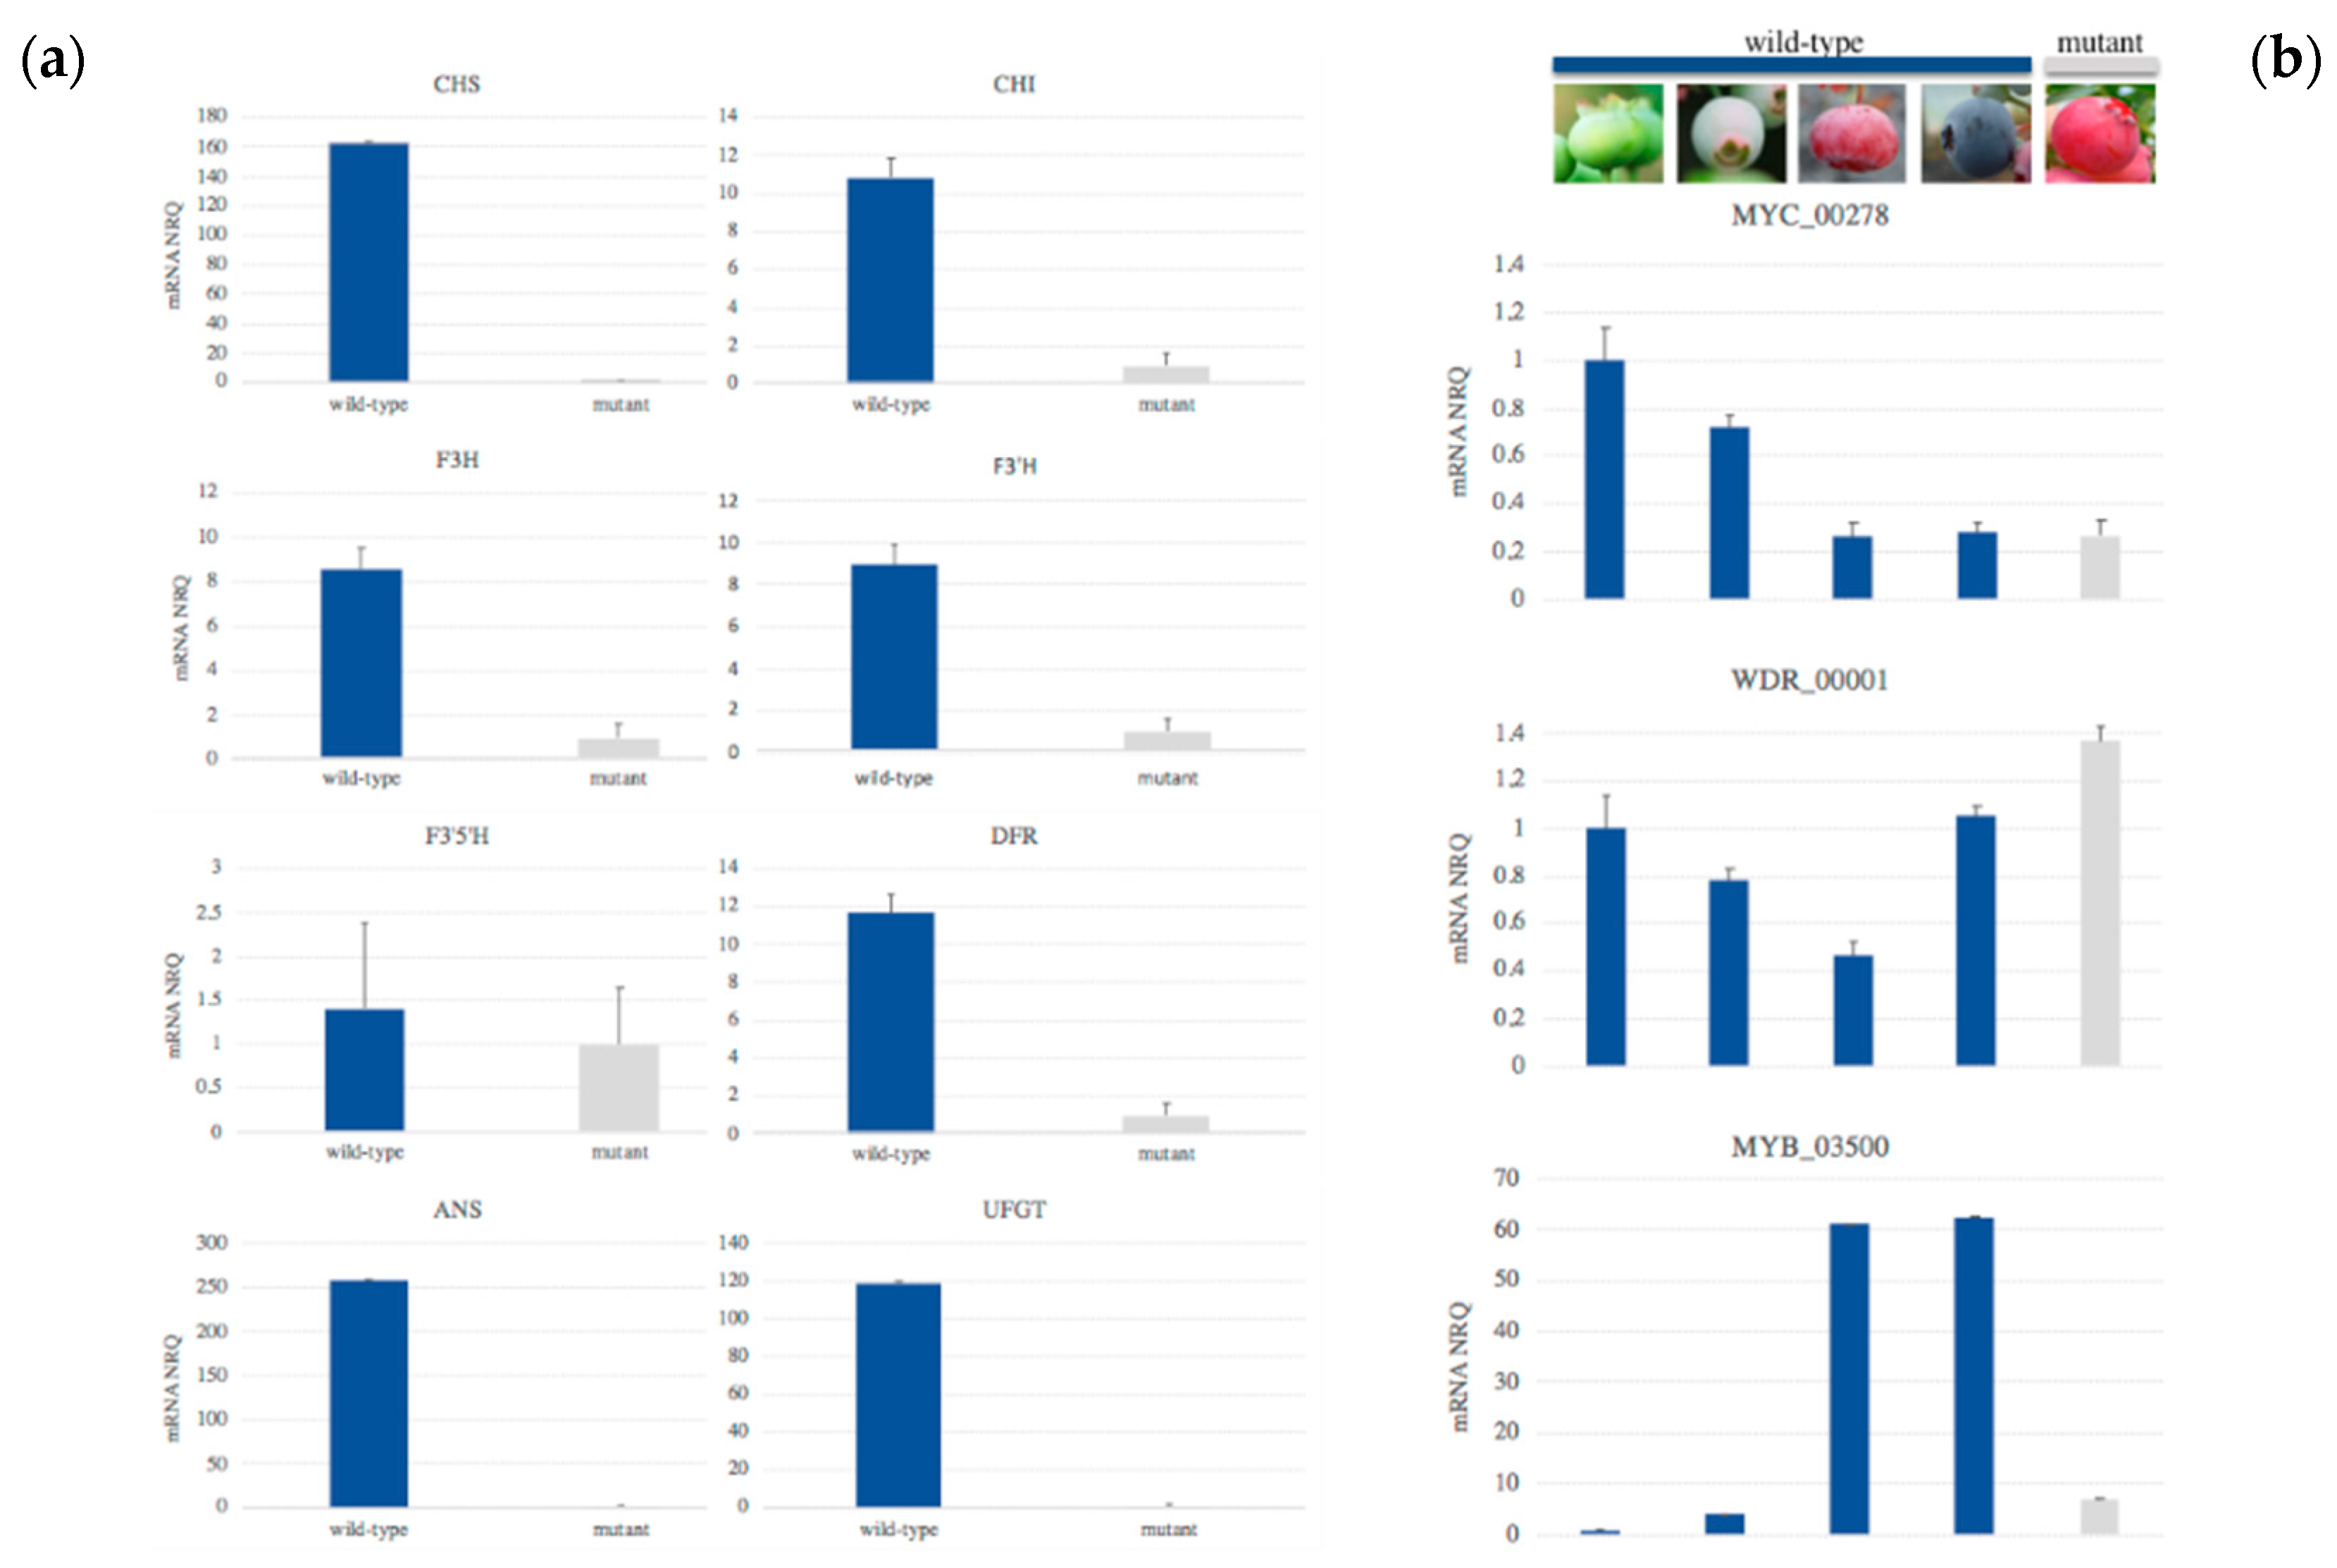
3.4. Expression of Structural Genes in Developed Fruits of Mutant Berries

Since we did not observe any change in color of ‘PL’ mutant berries after F3′5′H overexpression, the transcript levels of this gene and other structural genes of the flavonoid pathway were examined at the ripe stage of development of ‘PL’ and compared to levels in the wild-type ‘Tifblue’ cultivar at the ripe stage. Based on qPCR assays, we were able to detect expression levels of the eight genes in the mutant. However, most of the genes clearly showed much higher expression levels in the wild-type, with CHS, ANS, and UFGT showing >100-fold higher levels, than those in the mutant. Notably, however, the expression of F3′5′H at the transcript level was similar between the wild-type and mutant berries (Figure 4a).

3.5. Candidate Regulatory Genes

As the expression analysis of the structural genes showed that nearly the whole pathway is down-regulated in the mutant compared to wild-type, we next aimed to examine the expression of the major transcriptional regulators of the anthocyanin biosynthesis pathway. Like with the structural genes, we examined RNA expression by qPCR over the course of fruit development in the wild-type ‘Tifblue’ and compared expression in the later stage between ‘Tifblue’ and ‘PL’. We studied the transcriptional activity of the three major transcription factor candidates: MYC, WDR, and MYB (Supplementary Materials File S1 and Figure 4b).
Analysis of expression of the candidate regulatory genes showed different profiles over the course of fruit development in the wild-type. Transcripts of MYC_00278 (shares 65% identity at the amino acid level with the grape anthocyanin regulatory bHLH protein MYCA1, Genbank accession number ABM92332) were detected at the highest levels early in fruit development (green and white stages) and then at lower levels later (pink and blue stages), suggesting that MYC_00278 is most active in young fruits. Expression of WDR_00001 (shares 85% identity at the amino acid level with the grape anthocyanin regulatory protein WDR1, Genbank accession number ABF66625) showed a moderate biphasic pattern. Expression was high early in berry development, decreased to a minimum by mid fruit development (pink stage) and then increased again in the full ripe fruit. Expression analysis of MYB_03500 (shares 56.5% identity at the amino acid level with the grape anthocyanin regulatory protein MYBA1, Genbank accession number BAD18977) showed strong up-regulation at the ripening stages compatible with the expression pattern of the anthocyanin structural genes, suggesting it may be involved in regulating anthocyanin biosynthesis.
In the comparison of expression of these three transcription factors in ripe berries of wild-type and mutant, we found fairly similar transcript levels of MYC_00278 and WDR_00001. There was, in fact, no significant difference in MYC_00278 expression, while WDR_0001 was slightly higher (~1.3-fold) in ‘PL’ than in ‘Tifblue’. On the other hand, we found a major difference in expression of MYB_03500, an approximately 10-fold higher level of expression of MYB_03500 in ‘Tifblue’ than in ‘PL’. This result suggested that the MYB transcription factor could at least partially explain the low expression values that we observed for most of the structural genes in ‘PL’ at the ripe stage of development.

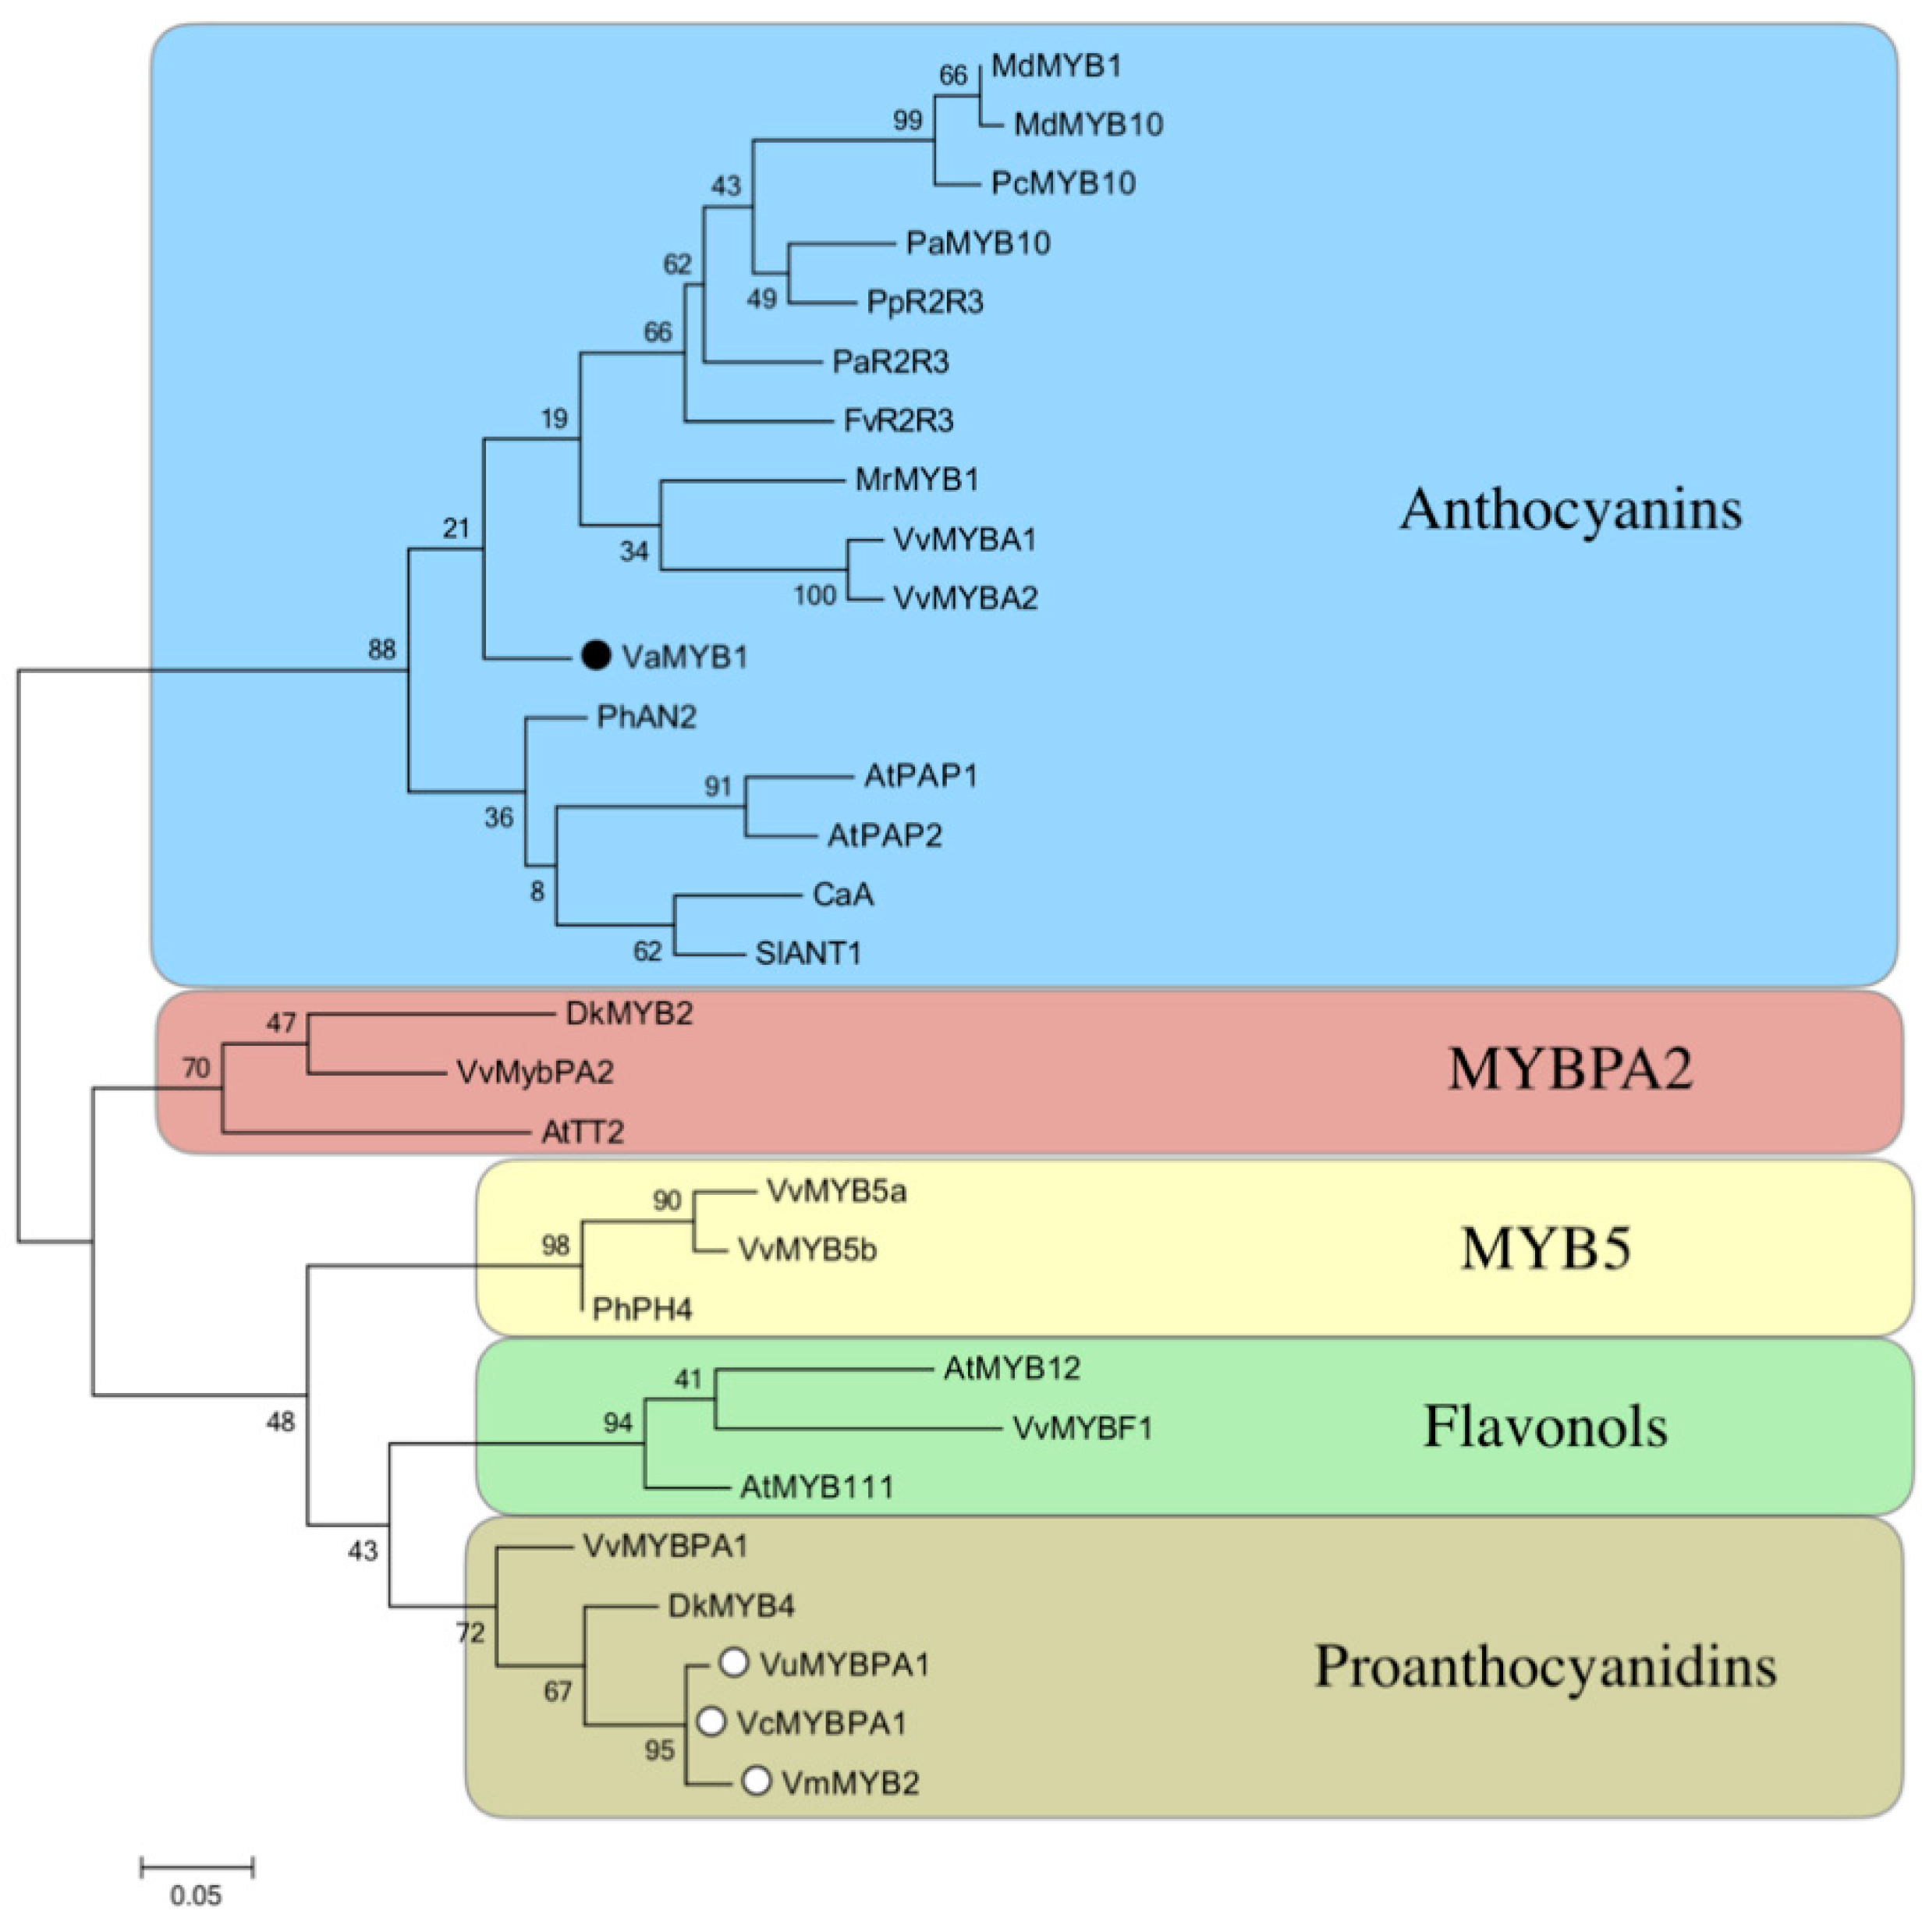
3.6. Phylogenetic Analysis

Because the expression analysis suggested that the MYB_03500 sequence is a good candidate for involvement in anthocyanin biosynthesis, and that it may be affected in ‘PL’, we carried out a phylogenetic analysis, comparing the blueberry MYB protein predicted sequence (from the blueberry transcriptome database) with other previously identified MYB proteins related to flavonoid biosynthesis in other plants, including the Vaccinium species: V. corymbosum L. MYBPA1, V. myrtillus L. MYB2, and V. uliginosum L. MYBPA1. The phylogenetic tree indicates that blueberry MYB_03500 is clustered within the anthocyanin subclade, which contains known anthocyanin regulators, rather than flavonol, proanthocyanidin, and general flavonoid MYB regulators, which clustered in different clades (Figure 5). The blueberry MYB_03500 has the closest similarity, at the amino acid level, with MYB1 from Morella rubra Lour. (51% identity for the protein sequence overall and 85.58% identity for the R2R3 domains).

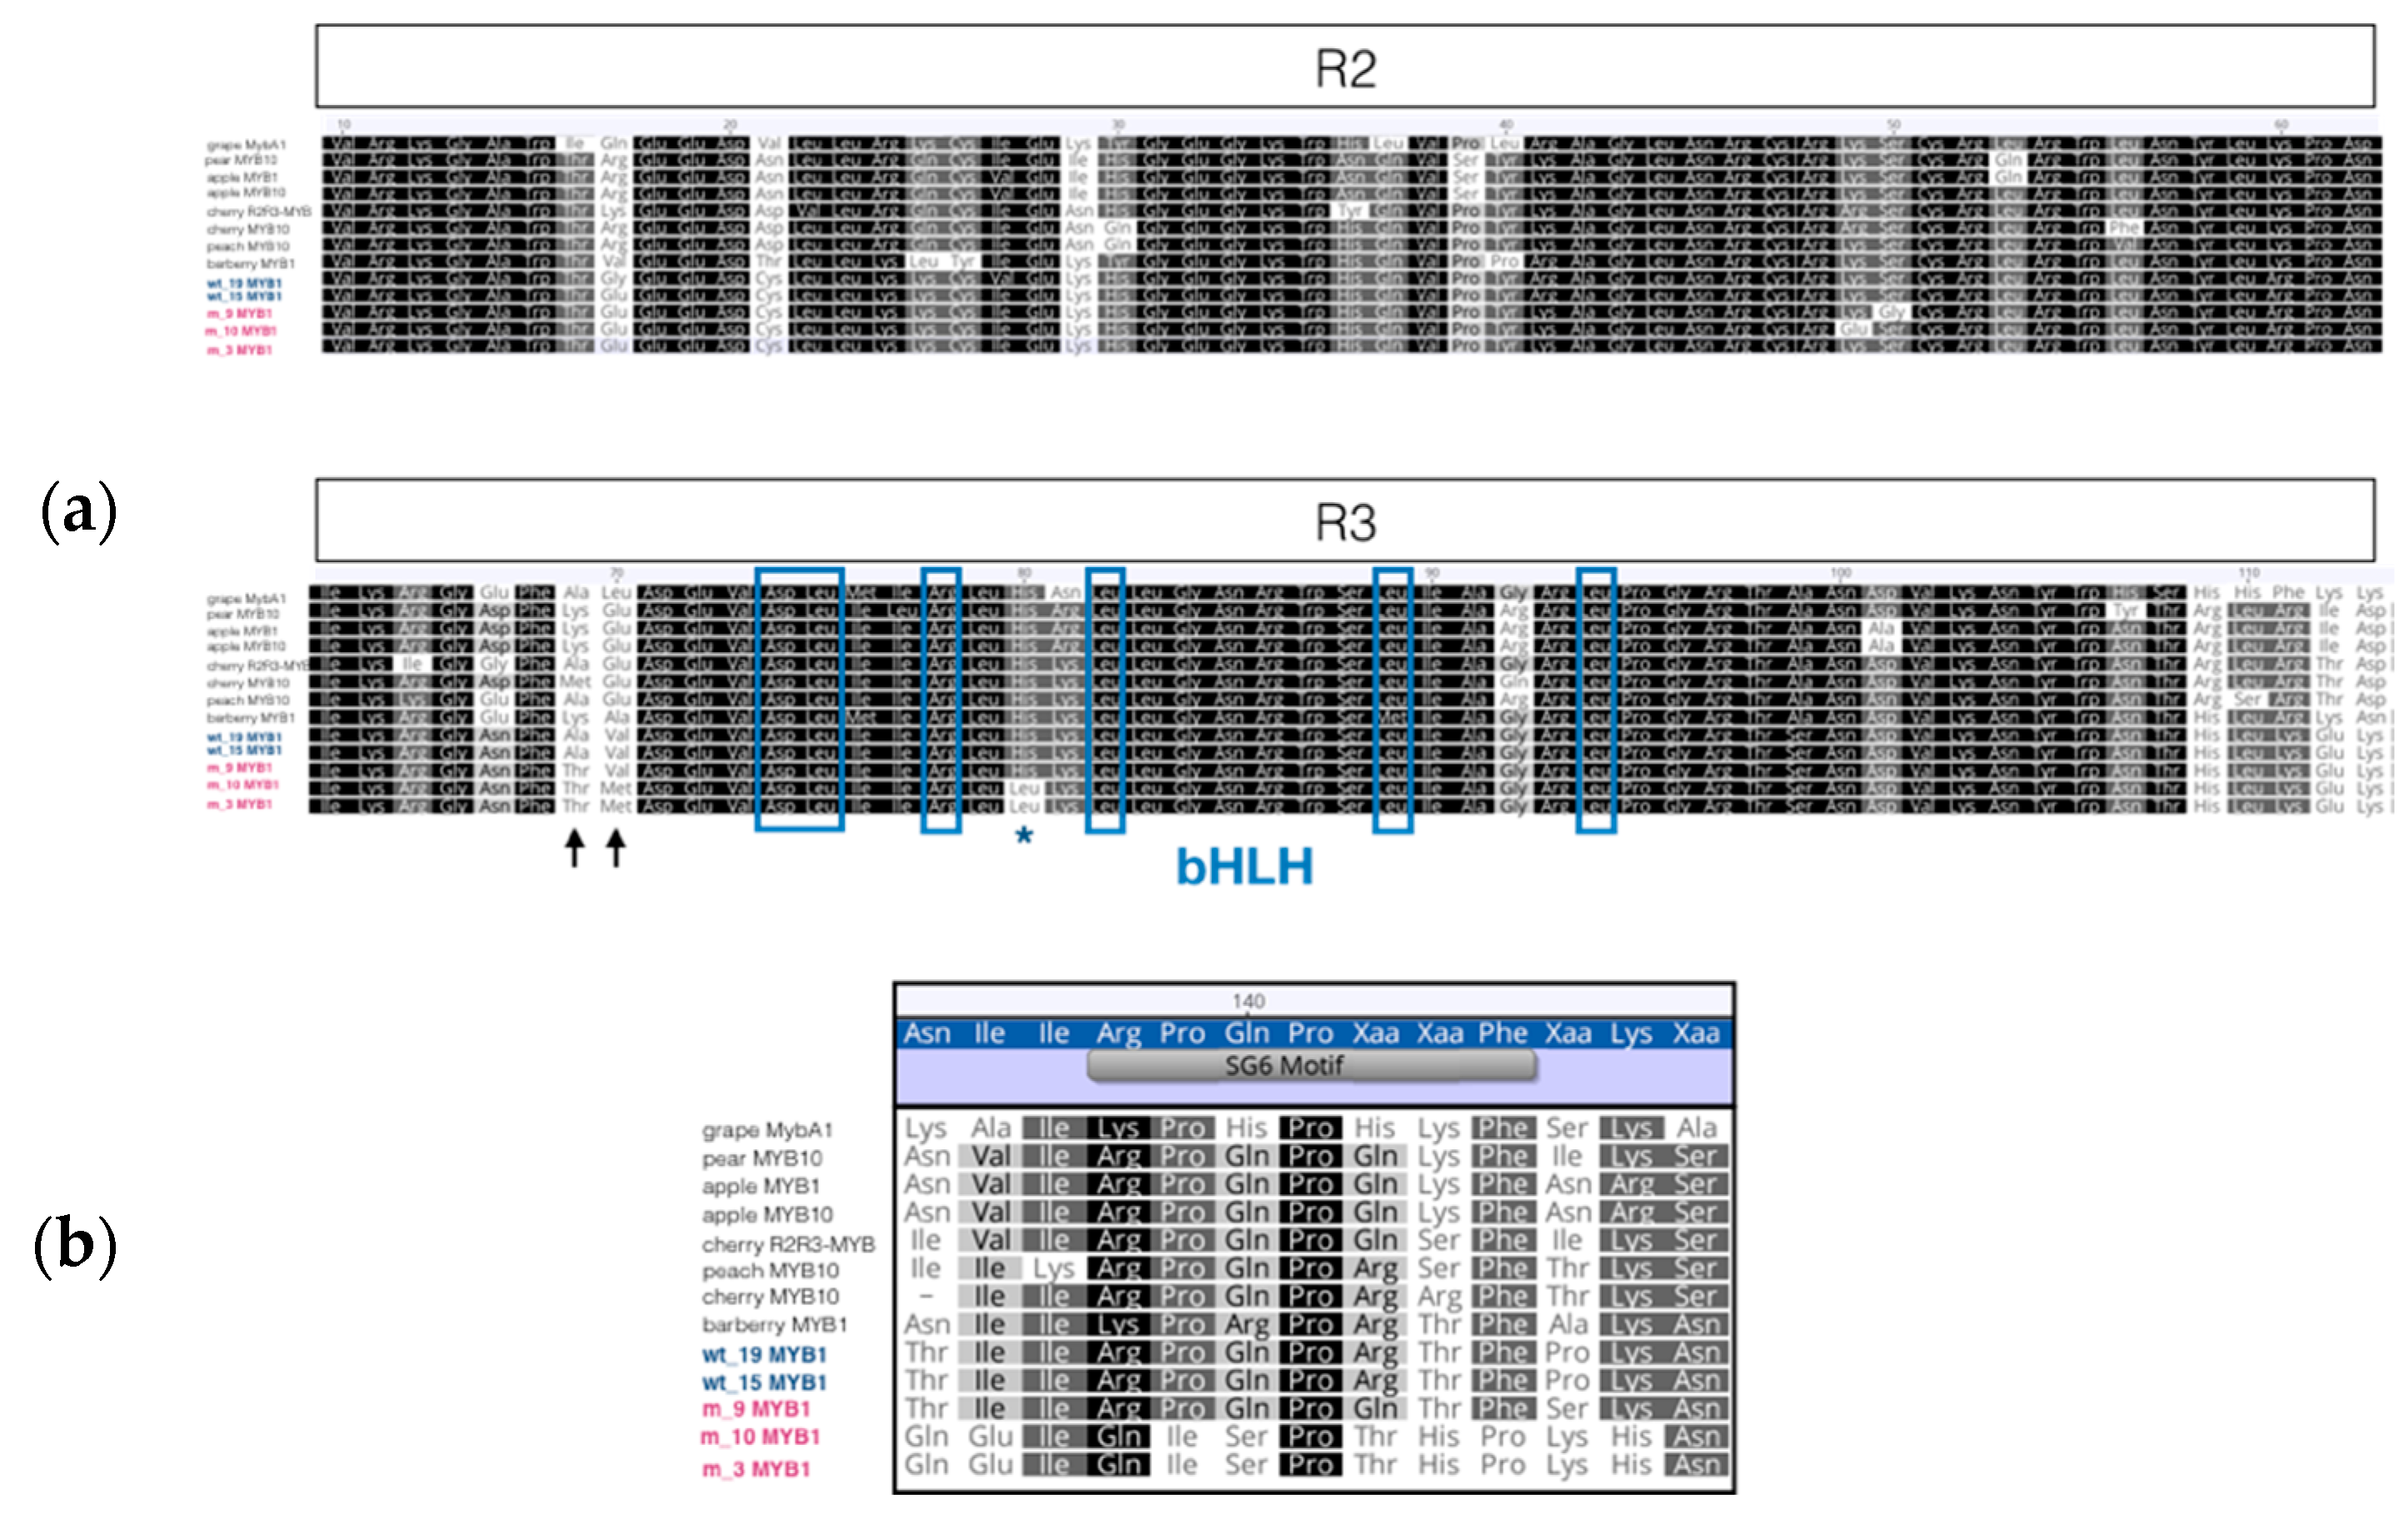
3.7. Sequence Analysis of MYB Transcription Factor

To understand the low level of the MYB transcript in the mutant ‘PL’, we sequenced full-length cDNAs from both ‘PL’ and the wild-type ‘Tifblue’. Two single cDNA fragments of 783 bp were obtained from inserts containing the MYB sequence in the wild-type (GenBank accession MT022440), whereas two different-sized cDNA inserts (781 and 661 bp) were obtained from the mutant. The two 783-bp MYB full-length sequences from ‘Tifblue’ shared 99.5% identity between them (98.9 at the amino acid level); the 783-bp MYB sequences from wild-type and the 781-bp sequence from the mutant shared 96.4% identity (94.3–95.4% at aa level). The 783-bp MYB sequences from wild-type and the 661-bp sequence from the mutant shared 96.1–96.9% identity (92.4–94.1 at aa level). The short cDNA full-length fragments from ‘PL’ have two deletions in the 3′ region of the sequences compared to the wild-type forms and contain at least four stop codons in the 3′ end at positions 475, 478, 514, and 625 bp. This suggests that the mutant expresses some alternative MYB forms that would be predicted to be truncated at their C-terminal end (Supplementary Materials File S2).
Next, we aligned the deduced amino acid sequences from the wild-type and mutant to compare them with known MYBs involved in anthocyanin regulation from other woody species. Specifically, we focused on the R2R3 DNA-binding domains. The wild-type fragments were most closely related to the sweet cherry PaMYB1, with ~85% amino acid identity over the R2R3 DNA-binding domain. The fragments from the mutant had the same identity (~85%) to the sweet cherry (Prunus avium L.) PaMYB10 (Figure 6). The blueberry sequences had the key amino acid residues that specify interaction with bHLH proteins (positions 74–94 in the R2R3 domain consensus, (DE)Lx2(RK)x3Lx6Lx3R; [38]). Moreover, the sequences had the amino acids, which account for most of the interaction stability, in the right positions (Figure 6). However, within this region, the short fragments from the mutant showed a specific change from His to Leu (at position 80), changing the polarity and hydrophobicity of this residue. Upstream of this domain, there is a less-conserved region that also showed differences between the mutant and wild-type sequences. A Thr residue was specific to the MYB sequences from the blueberry mutant at position 69, and the short mutant fragments also had a unique Met residue at position 70. Within the variable C-terminal region, the motif SG6 has been identified as indicative of the anthocyanin-related proteins [39,40]. Of the distinguishing residues (K/R)P(Q/R)P(Q/R)(S/T)F, the wild-type MYB and the long MYB transcript from the mutant were fully conserved, whereas the short MYB transcripts from the mutant contained only two of the seven SG6 residues.

3.8. MYB Activates Anthocyanin Biosynthesis in Planta

As MYB_03500 has close identity with several MYB transcription factors, which have been shown to be involved in the regulation of anthocyanins in other species, and the expression profile in the wild-type was compatible with a function for MYB_03500 in anthocyanin biosynthesis, we attempted to test whether the MYB gene product is a direct regulator of genes required for anthocyanin biosynthesis. To test the ability of the wild-type MYB to complement the apparent inactive mutant MYB, we performed in vivo transcriptional activation assays using transient expression in ‘PL’ fruits coupled with gene expression analysis. Overexpression of the wild-type MYB (from ‘Tifblue’) in the mutant ‘PL’ berries (before becoming ripe fruits) induced a change in coloration of the treated berries as early as 2–3 days after infiltration. The fruits never reached the characteristic dark blue color of the wild-type berries, but the general pattern we observed over two experimental years is that they changed from pink to purple and were darker than any of the overripe mutant fruit (Figure 7).
We also examined the expression levels of the structural genes of the anthocyanin biosynthesis pathway in treated fruits (35S:MYB) and compared them with those from fruits infiltrated with an empty vector (35S) and untreated mutant fruits (control). The expression levels of the anthocyanin structural genes were consistently higher in treated fruits, suggesting that MYB activates anthocyanin synthesis by recruiting and inducing the transcriptional activity of the structural gene machinery (Supplementary Figure S3). It was notable, however, that expression of F3′5′H in treated mutants was at the same level as untreated fruits, indicating that overexpression of the wild-type MYB in ‘PL’ did not result in up-regulation of that particular structural gene.

4. Discussion

Since the first blueberry EST sequences became available over a decade ago [41], significant advances in genomic research of the blueberry have been made. At the inception of this study, several transcriptome databases were available [11,20,41,42,43]. These efforts generated large collections of both Sanger and next generation ESTs, which have proven to be, and continue to be, valuable resources, providing insights into cellular processes and transcriptional regulation in relation to blueberry fruit and flower bud development [36]. In 2012, we reported the first next-generation sequencing transcriptome (from 454 sequencing) of the species [19]. More recently, in 2019, we published a transcriptome from an RNA-seq analysis aimed at identifying gene(s) important for wax accumulation on blueberry fruit [44,45].
In this present study, we mined the 454 transcriptome dataset [19], which included transcript sequences and assemblies from fruit at four different stages of development, for the purpose of identifying genes involved in anthocyanin biosynthesis. The gene expression levels influence the amount of read sequence required to ensure a comprehensive coverage of genes expressed in a library. The identification/annotation of full-length blueberry genes, predicted to encode most of the enzymes of the anthocyanin biosynthesis pathway, demonstrated that this collection of NGS ESTs is an important resource for the scientific community. Following data mining and sequence analysis, we compared expression of these genes, and other regulatory genes involved in anthocyanin biosynthesis, between wild-type and pink-fruited blueberry varieties. Our qPCR protocol was designed to conform to the Minimum Information for Publication of Quantitative Real-Time PCR (MIQE guidelines; [46], carefully controlling and assuring for every quality component of the qPCR workflow that could affect the reliability of the data during the analysis.

4.1. The Expression Profile of Anthocyanin Biosynthetic Genes Suggests Coordinated Regulation in Blueberry Fruit Development

Anthocyanins are markers for ripening, because in most Vaccinium berries, the accumulation of anthocyanins begins at the onset of ripening [47]. In the blueberry, the content and composition of anthocyanins has been described previously [5,17]. During berry development, the ripening-related changes in metabolism typically occur quickly, and berries (even from the same flowering time and same plant) can ripen at slightly different rates. Thus, when analyzing gene expression data during ripening, it is important to look at trends in gene expression rather than focus on differences in exact values at a single time point [48]. From analysis of our transcriptome data, we found that expression of flavonoid pathway genes occurs in two phases (green–white vs. pink–blue), which suggests coordinated temporal control of the anthocyanin biosynthesis pathway. The role of the enzyme F3´5´H is to direct the biosynthesis of flavonoids to the biosynthesis of myrcetin (flavonols), prodelphinidins (condensed tannins), and delphinidin-type anthocyanins, and their derivatives petunidin and malvidin glycosides [48]. In our dataset, the very high expression level observed for F3′5′H transcripts at the pink stage, and the further agroinfiltration transient expression assays on several wild-type phenotypes, suggested that F3′5′H transcription may play a significant role in driving the accumulation of anthocyanins.

4.2. Expression of Structural Genes in Developed Fruits of Mutant Berries Suggests the Action of Regulatory Genes

We explored the possibility that the mutant pink-skinned ripe blueberries of this cultivar may have lost the ability to complete pigmentation due to a mutation in one or more biosynthetic gene(s). Our first thought was to develop a transient expression assay and test whether overexpressing the normally highly expressed F3′5′H gene (in the wild-type) could complement the mutation in ‘PL’. Although F3′5′H seemed like a promising candidate, we did not observe any change in color of mutant berries after F3′5′H overexpression. Therefore, we next methodically compared the transcript levels of all the major structural genes of the flavonoid pathway in the mutant and wild-type berries by real-time qPCR and found two interesting results. Firstly, the expression levels of most of the biosynthetic genes in the mutant were markedly lower compared to wild-type berries. This is consistent with the extremely low levels of anthocyanins found previously in the profile of ripe ‘PL’ compared to the standard blue-fruited cultivars [5,17]. Secondly and notably, the expression level of F3′5′H was similar between the mutant and wild-type berries. This would explain why overexpressing the F3′5′H gene in the mutant resulted in no change in berry coloration, as we were increasing the transcript levels of the only gene in the pathway whose expression was the same as in the wild-type. It is highly interesting that a similar pattern has been reported in bog bilberries (Vaccinium uliginosum), where the expression level of F3´5´H in berries of a white mutant was the same as that in wild-type berries. An important conclusion from that study was that the F3´5´H gene is regulated separately from the other flavonoid pathway genes [48].

4.3. The MYB Transcription Factor is A Regulator of Anthocyanin Biosynthesis and Might be Mutated in ‘PL’

Because gene expression of the whole flavonoid biosynthetic pathway was down-regulated in ‘PL’ compared to the wild-type (except for the F3´5´H gene), we next attempted to identify potential regulators of the anthocyanin pathway. Based on literature searches and mining of blueberry genomic and transcriptomic data, we identified three major transcription factor candidates and characterized their expression profile during fruit development. Only one, a MYB gene, was expressed at a much lower level in ‘PL’ than in the wild-type. In addition, the transcriptional profile of MYCA_00278 over fruit development indicated that MYC is most active at the early stages of berry development (green and white stages) and expressed lower at the period of anthocyanin accumulation. This suggests that the MYCA_00278 profile is correlated more with the accumulation of proanthocyanidins than anthocyanins [48,49]. The moderate biphasic pattern exhibited by the transcription factor WDR_00001 may be characteristic for genes required for both proanthocyanidin and anthocyanin synthesis. By contrast, transcript levels of the transcription factor MYB_03500 steadily increased during ripening, closely paralleling the expression of the structural genes, suggesting that it could be involved in regulating anthocyanin biosynthesis. Additional support for a role of the MYB gene (‘MYB1′) as a molecular regulator of the pathway and that it is affected in ‘PL’ is provided by: (i) the lower expression level of the MYB1 gene in the mutant compared to wild-type, along with the lower expression values of most of the structural genes during the ripening stage; (ii) the blueberry MYB amino acid sequence clustering clearly in the clade specifically known to be comprised of anthocyanin regulators; (iii) the wild-type MYB cDNA sequence being able to partially functionally complement the endogenous MYB regulator in ‘PL’ by inducing darker berry pigmentation; and iv) MYB overexpression correlating with the induction of most of the structural genes of the pathway in the mutant.
It is interesting that the induction of pigmentation in ‘PL’ by overexpression of MYB1 appears to be based on recruitment of the transcriptional machinery of the structural genes of the pathway but does not include the F3′5′H gene. In fact, we did not detect differences in F3´5´H-message levels between ripe ‘PL’ and wild-type berries either with or without transient overexpression of MYB1. In grape, only VvMYBA1 is able to bind the F3′5′H promoter, thus activating the tri-hydroxylated branch of the anthocyanin pathway, whereas other MYB genes are not effective at regulating F3´5´H [50].
A recently published report describes a blueberry candidate anthocyanin-related MYB sequence [51]. The authors’ approach differed from our own, in that they identified the transcription factor through 5´/3′-RACE amplification and ectopically expressed the blueberry MYB in petal cells of Antirrhinum L. restoring pink anthocyanin pigmentation, as well as in Nicotiana benthamiana Domin. leaves, resulting in purple pigmentation. The MYB sequences from their and our studies share 98% identity, indicating that both groups identified the same regulator. Thus, results from both studies support the idea that this particular MYB transcription factor is a key activator of the flavonoid pathway for the biosynthesis of anthocyanin pigments in berries.

4.4. Sequence Analysis of MYB-cDNAs from Wild-Type and ‘PL’ Indicates ‘PL’ Expresses Normal and Mutated MYB Alleles

After cDNA cloning and sequence analysis, we found that certain MYB alleles expressed in ‘PL’ appeared normal compared to wild-type ‘Tifblue’, whereas others were short and would be predicted to encode a protein that was truncated at the C-terminus. An alignment of the MYB-predicted amino acid sequence from ‘PL’ with MYB anthocyanin regulators from other species did show differences in highly conserved features that could explain the mutant phenotype. In addition, from our transient expression studies, we found that overexpression of the wild-type MYB from ‘Tifblue’ could partially complement the mutation in ‘PL’, resulting in darker purple berries but not fully blue berries. Therefore, here we hypothesize that ‘PL’ expresses truncated MYB variants, which might compete with other ‘wild-type’ MYB proteins for DNA targeting via sequestration of DNA binding sites. This could explain not only the pink phenotype of ‘PL’ but also the inability to fully complement the mutation by overexpression of the normal MYB proteins from ‘Tifblue’.

5. Concluding Remarks and Future Directions

In conclusion, this is the first report, to our knowledge, using the agroinfiltration transient expression system in the blueberry. It provides a foundation for further systematic development of the technique in the species, which would be very useful to the blueberry community. At present, there is no direct evidence for other transcription factors inducing the anthocyanin pathway in Vaccinium spp. (Figure 5). The differential regulation of F3´5´H from the other structural genes of the anthocyanin biosynthesis pathway in Vaccinium berries constitutes a specific difference from other dicots. At this point, however, we cannot rule out the possibility that the F3´5´H promoter requires interaction with other co-factors, such as those from the MBW complex (bHLH or WD40 transcription factors) or others, whose levels could be low or lacking in ‘PL’, in addition to MYB1. However, from qPCR analyses, we did not find that ‘PL’ expresses lower levels of MYC or WDR genes than the wild-type ‘Tifblue’, at least not those genes which we examined.
‘PL’ does express lower transcript levels of the MYB1 gene, as well as all the structural genes of the anthocyanin biosynthesis pathway, except for the F3′5′H gene, than does the wild-type ‘Tifblue’ cultivar. This, along with the presence of sequence variants in the MYB1 gene in ‘PL’, suggests that the MYB1 gene variants at least contribute to the pink-fruited phenotype of ‘PL’, although another regulatory gene/co-factor could be involved as well. Further data and functional analyses will be needed to address the presence of additional regulators, their interaction with the structural genes, and their general role as regulators of anthocyanin biosynthesis in blueberry fruits.

Supplementary Materials

The following are available online at https://www.mdpi.com/2073-4395/10/9/1296/s1, Figure S1: Contribution of total phenolics for wild-type ‘Tifblue’ and mutant ‘PL’cultivars, Figure S2: Representative fruits from the transient assay, Figure S3: Expression profile of the anthocyanin structural genes in ‘PL’ with transient overexpression of the MYB1 gene, Table S1: Primer sequences for qPCR, Table S2: Represented contigs in the blueberry 454 EST libraries, Table S3: Comparison of structural genes from blueberry with protein sequences from other plants, File S1: WDR and MYC fasta, File S2: MYB sequencing fasta.

Author Contributions

Conceptualization, J.V.D., R.W.J. and L.J.R.; Formal analysis L.J.R.; Investigation, J.V.D., E.L.O. and L.J.R.; Methodology, J.V.D., R.W.J. and E.L.O.; Resources, M.K.E.; Supervision, L.J.R.; Writing—original draft, J.V.D. and L.J.R.; Writing—review and editing, R.W.J., E.L.O., M.K.E. and L.J.R. All authors have read and agreed to the published version of the manuscript.

Funding

This research received no external funding.

Conflicts of Interest

The authors declare no conflict of interest.

References

  1. NASS; USDA. Noncitrus Fruits and Nuts 2017 Summary. Available online: https://www.nass.usda.gov/Publications/Todays_Reports/reports/ncit0618.pdf#:~:text=104%20Noncitrus%20Fruits%20and%20Nuts%202017%20Summary%20%28June,7%2C200%2C%20up%203%20percent%20from%20the%20previous%20year (accessed on 30 June 2018).
  2. FAOSTAT; FAO. Crop Statistics. Available online: http://faostat.fao.org (accessed on 20 November 2018).
  3. Nicoletti, A.M.; Gularte, M.A.; Elias, M.C.; dos Santos, M.S.; Ávila, B.P.; Fernandes, J.L.; Peres, W. Blueberry Bioactive Properties and Their Benefits. IJNTR 2015, 1, 51–57. [Google Scholar]
  4. Prior, R.L.; Lazarus, S.A.; Cao, G.; Muccitelli, H.; Hammerstone, J.F. Identification of procyanidins and anthocyanins in blueberries and cranberries (Vaccinium spp.) using high-performance liquid chromatography/mass spectrometry. J. Agric. Food Chem. 2001, 49, 1270–1276. [Google Scholar] [CrossRef] [PubMed]
  5. Wang, S.Y.; Camp, M.J.; Ehlenfeldt, M.K. Antioxidant capacity and α-glucosidase inhibitory activity in peel and flesh of blueberry (Vaccinium spp.) cultivars. Food Chem. 2012, 132, 1759–1768. [Google Scholar] [CrossRef]
  6. Scalzo, J.; Stevenson, D.; Hedderley, D. Blueberry estimated harvest from seven new cultivars: Fruit and anthocyanins. Food Chem. 2013, 139, 44–50. [Google Scholar] [CrossRef]
  7. Wang, S.Y.; Chen, H.; Camp, M.J.; Ehlenfeldt, M.K. Genotype and growing season influence blueberry antioxidant capacity and other quality attributes. Int. J. Food Sci. Technol. 2012, 47, 1540–1549. [Google Scholar] [CrossRef]
  8. Yousef, G.G.; Lila, M.A.; Guzman, I.; Ballington, J.R.; Brown, A.F. Impact of interspecific introgression on anthocyanin profiles of southern highbush blueberry. J. Amer. Soc. Hort. Sci. 2014, 139, 99–112. [Google Scholar] [CrossRef] [Green Version]
  9. Zoratti, L.; Karppinen, K.; Luengo Escobar, A.; Häggman, H.; Jaakola, L. Light-controlled flavonoid biosynthesis in fruits. Front. Plant Sci. 2014, 5, 534. [Google Scholar] [CrossRef]
  10. Jaakola, L.; Määttä, K.; Pirttilä, A.M.; Törrönen, R.; Kärenlampi, S.; Hohtola, A. Expression of genes involved in anthocyanin biosynthesis in relation to anthocyanin, proanthocyanidin, and flavonol levels during bilberry fruit development. Plant Physiol. 2002, 130, 729–739. [Google Scholar] [CrossRef] [Green Version]
  11. Zifkin, M.; Jin, A.; Ozga, J.A.; Zaharia, L.I.; Schernthaner, J.P.; Gesell, A.; Abrams, S.R.; Kennedy, J.A.; Constabel, C.P. Gene expression and metabolite profiling of developing highbush blueberry fruit indicates transcriptional regulation of flavonoid metabolism and activation of abscisic acid metabolism. Plant Physiol. 2012, 158, 200–224. [Google Scholar] [CrossRef] [Green Version]
  12. Sanoner, P.; Guyot, S.; Marnet, N.; Molle, D.; Drilleau, J.P. Polyphenol profiles of French cider apple varieties (Malus domestica spp.). J. Agric. Food Chem. 1999, 47, 4847–4853. [Google Scholar] [CrossRef]
  13. Willson, M.F.; Whelan, C.J. The evolution of fruit color in fleshy-fruited plants. Am. Nat. 1990, 136, 790–809. [Google Scholar] [CrossRef]
  14. Naing, A.H.; Kim, C.K. Roles of R2R3-MYB transcription factors in transcriptional regulation of anthocyanin biosynthesis in horticultural plants. Plant Mol. Biol. 2018, 98, 1–18. [Google Scholar] [CrossRef]
  15. Albert, N.W.; Lewis, D.H.; Zhang, H.; Schwinn, K.E.; Jameson, P.E.; Davies, K.M. Members of an R2R3-MYB transcription factor family in Petunia are developmentally and environmentally regulated to control complex floral and vegetative pigmentation patterning. Plant J. 2011, 65, 771–784. [Google Scholar] [CrossRef] [PubMed]
  16. Davies, K.M.; Albert, N.W.; Schwinn, K.E. From landing lights to mimicry: The molecular regulation of flower colouration and mechanisms for pigmentation patterning. Func. Plant Biol. 2012, 39, 619. [Google Scholar] [CrossRef]
  17. Wang, S.Y.; Chen, H.; Camp, M.J.; Ehlenfeldt, M.K. Flavonoid constituents and their contribution to antioxidant activity in cultivars and hybrids of rabbiteye blueberry (Vaccinium ashei Reade). Food Chem. 2012, 132, 855–864. [Google Scholar] [CrossRef]
  18. Timmers, M.A.; Grace, M.H.; Yousef, G.G.; Lila, M.A. Inter- and intra-seasonal changes in anthocyanin accumulation and global metabolite profiling of six blueberry genotypes. J. Food Comp. Anal. 2017, 59, 105–110. [Google Scholar] [CrossRef]
  19. Rowland, L.J.; Alkharouf, N.; Darwish, O.; Ogden, E.L.; Polashock, J.J.; Bassil, N.V.; Main, D. Generation and analysis of blueberry transcriptome sequences from leaves, developing fruit, and flower buds from cold acclimation through deacclimation. BMC Plant Biol. 2012, 12, 46. [Google Scholar] [CrossRef] [Green Version]
  20. Gupta, V.; Estrada, A.D.; Blakley, I.; Reid, R.; Patel, K.; Meyer, M.D.; Andersen, S.U.; Brown, A.F.; Lila, M.A.; Loraine, A.E. RNA-Seq analysis and annotation of a draft blueberry genome assembly identifies candidate genes involved in fruit ripening, biosynthesis of bioactive compounds, and stage-specific alternative splicing. Gigascience 2015, 4, 5. [Google Scholar] [CrossRef] [Green Version]
  21. Colle, M.; Leisner, C.P.; Wai, C.M.; Ou, S.; Bird, K.A.; Wang, J.; Wisecaver, J.H.; Yocca, A.E.; Alger, E.I.; Tang, H.; et al. Haplotype-phased genome and evolution of phytonutrient pathways of tetraploid blueberry. Gigascience 2019, 8. [Google Scholar] [CrossRef] [Green Version]
  22. Li, L.; Zhang, H.; Liu, Z.; Cui, X.; Zhang, T.; Li, Y.; Zhang, L. Comparative transcriptome sequencing and de novo analysis of Vaccinium corymbosum during fruit and color development. BMC Plant Biol. 2016, 16, 223. [Google Scholar] [CrossRef] [Green Version]
  23. Lin, Y.; Wang, Y.; Li, B.; Tan, H.; Li, D.; Li, L.; Liu, X.; Han, J.; Meng, X. Comparative transcriptome analysis of genes involved in anthocyanin synthesis in blueberry. Plant Physiol. Biochem. 2018, 127, 561–572. [Google Scholar] [CrossRef] [PubMed]
  24. Ehlenfeldt, M.K.; Finn, C.E. G-435 and ARS 96-138, Pink-fruited Blueberry Selections. HortScience 2007, 42, 172–173. [Google Scholar] [CrossRef] [Green Version]
  25. Matus, J.T.; Poupin, M.J.; Cañón, P.; Bordeu, E.; Alcalde, J.A.; Arce-Johnson, P. Isolation of WDR and bHLH genes related to flavonoid synthesis in grapevine (Vitis vinifera L.). Plant Mol. Biol. 2010, 72, 607–620. [Google Scholar] [CrossRef] [PubMed]
  26. Cadle-Davidson, M.M.; Owens, C.L. Genomic amplification of the Gret1 retroelement in white-fruited accessions of wild vitis and interspecific hybrids. Theor. Appl. Genet. 2008, 116, 1079–1094. [Google Scholar] [CrossRef]
  27. Chang, S.; Puryear, J.; Cairney, J. A simple and efficient method for isolating RNA from pine trees. Plant Mol. Biol. Rep. 1993, 11, 113–116. [Google Scholar] [CrossRef]
  28. Die, J.V.; Rowland, L.J. Elucidating cold acclimation pathway in blueberry by transcriptome profiling. Environ. Exp. Bot. 2014, 106, 87–98. [Google Scholar] [CrossRef]
  29. Schmittgen, T.D.; Livak, K.J. Analyzing real-time PCR data by the comparative CT method. Nat. Protoc. 2008, 3, 1101–1108. [Google Scholar] [CrossRef]
  30. Die, J.V.; Obrero, Á.; González-Verdejo, C.I.; Román, B. Characterization of the 3’:5’ ratio for reliable determination of RNA quality. Anal. Biochem. 2011, 419, 336–338. [Google Scholar] [CrossRef]
  31. Untergasser, A.; Cutcutache, I.; Koressaar, T.; Ye, J.; Faircloth, B.C.; Remm, M.; Rozen, S.G. Primer3–New capabilities and interfaces. Nucleic Acids Res. 2012, 40, e115. [Google Scholar] [CrossRef] [Green Version]
  32. Altschul, S.F.; Gish, W.; Miller, W.; Myers, E.W.; Lipman, D.J. Basic local alignment search tool. J. Mol. Biol. 1990, 215, 403–410. [Google Scholar] [CrossRef]
  33. Zuker, M. Mfold web server for nucleic acid folding and hybridization prediction. Nucleic Acids Res. 2003, 31, 3406–3415. [Google Scholar] [CrossRef] [PubMed]
  34. Ramakers, C.; Ruijter, J.M.; Deprez, R.H.L.; Moorman, A.F.M. Assumption-free analysis of quantitative real-time polymerase chain reaction (PCR) data. Neurosci. Lett. 2003, 339, 62–66. [Google Scholar] [CrossRef]
  35. Hellemans, J.; Mortier, G.; De Paepe, A.; Speleman, F.; Vandesompele, J. qBase relative quantification framework and software for management and automated analysis of real-time quantitative PCR data. Genome Biol. 2007, 8, R19. [Google Scholar] [CrossRef] [PubMed] [Green Version]
  36. Die, J.V.; Rowland, L.J. Superior cross-species reference genes: A blueberry case study. PLoS ONE 2013, 8, e73354. [Google Scholar] [CrossRef] [PubMed]
  37. Tamura, K.; Stecher, G.; Peterson, D.; Filipski, A.; Kumar, S. MEGA6: Molecular evolutionary genetics analysis version 6.0. Mol. Biol. Evol. 2013, 30, 2725–2729. [Google Scholar] [CrossRef] [Green Version]
  38. Zimmermann, I.M.; Heim, M.A.; Weisshaar, B.; Uhrig, J.F. Comprehensive identification of Arabidopsis thaliana MYB transcription factors interacting with R/B-like BHLH proteins. Plant J. 2004, 40, 22–34. [Google Scholar] [CrossRef]
  39. Yamagishi, M.; Shimoyamada, Y.; Nakatsuka, T.; Masuda, K. Two R2R3-MYB genes, homologs of Petunia AN2, regulate anthocyanin biosyntheses in flower tepals, tepal spots and leaves of Asiatic hybrid lily. Plant Cell Physiol. 2010, 51, 463–474. [Google Scholar] [CrossRef] [Green Version]
  40. Stracke, R.; Werber, M.; Weisshaar, B. The R2R3-MYB gene family in Arabidopsis thaliana. Curr. Opin. Plant Biol. 2001, 4, 447–456. [Google Scholar] [CrossRef]
  41. Dhanaraj, A.L.; Slovin, J.P.; Rowland, L.J. Analysis of gene expression associated with cold acclimation in blueberry floral buds using expressed sequence tags. Plant Sci. 2004, 166, 863–872. [Google Scholar] [CrossRef]
  42. Dhanaraj, A.L.; Alkharouf, N.W.; Beard, H.S.; Chouikha, I.B.; Matthews, B.F.; Wei, H.; Arora, R.; Rowland, L.J. Major differences observed in transcript profiles of blueberry during cold acclimation under field and cold room conditions. Planta 2007, 225, 735–751. [Google Scholar] [CrossRef]
  43. Li, X.; Sun, H.; Pei, J.; Dong, Y.; Wang, F.; Chen, H.; Sun, Y.; Wang, N.; Li, H.; Li, Y. De novo sequencing and comparative analysis of the blueberry transcriptome to discover putative genes related to antioxidants. Gene 2012, 511, 54–61. [Google Scholar] [CrossRef] [PubMed]
  44. Qi, X.; Ogden, E.L.; Ehlenfeldt, M.K.; Rowland, L.J. Dataset of de novo assembly and functional annotation of the transcriptome of blueberry (Vaccinium spp.). Data Brief 2019, 25, 104390. [Google Scholar] [CrossRef] [PubMed]
  45. Qi, X.; Ogden, E.L.; Die, J.V.; Ehlenfeldt, M.K.; Polashock, J.J.; Darwish, O.; Alkharouf, N.; Rowland, L.J. Transcriptome analysis identifies genes related to the waxy coating on blueberry fruit in two northern-adapted rabbiteye breeding populations. BMC Plant Biol. 2019, 19, 460. [Google Scholar] [CrossRef] [PubMed]
  46. Bustin, S.A.; Benes, V.; Garson, J.A.; Hellemans, J.; Huggett, J.; Kubista, M.; Mueller, R.; Nolan, T.; Pfaffl, M.W.; Shipley, G.L.; et al. The MIQE guidelines: Minimum information for publication of quantitative real-time PCR experiments. Clin. Chem. 2009, 55, 611–622. [Google Scholar] [CrossRef] [PubMed] [Green Version]
  47. Karppinen, K.; Zoratti, L.; Nguyenquynh, N.; Häggman, H.; Jaakola, L. On the developmental and environmental regulation of secondary metabolism in Vaccinium spp. Berries. Front. Plant Sci. 2016, 7, 655. [Google Scholar] [CrossRef] [Green Version]
  48. Primetta, A.K.; Karppinen, K.; Riihinen, K.R.; Jaakola, L. Metabolic and molecular analyses of white mutant Vaccinium berries show down-regulation of MYBPA1-type R2R3 MYB regulatory factor. Planta 2015, 242, 631–643. [Google Scholar] [CrossRef] [Green Version]
  49. Terrier, N.; Torregrosa, L.; Ageorges, A.; Vialet, S.; Verriès, C.; Cheynier, V.; Romieu, C. Ectopic expression of VvMybPA2 promotes proanthocyanidin biosynthesis in grapevine and suggests additional targets in the pathway. Plant Physiol. 2009, 149, 1028–1041. [Google Scholar] [CrossRef] [Green Version]
  50. Matus, J.T.; Cavallini, E.; Loyola, R.; Höll, J.; Finezzo, L.; Dal Santo, S.; Vialet, S.; Commisso, M.; Roman, F.; Schubert, A.; et al. A group of grapevine MYBA transcription factors located in chromosome 14 control anthocyanin synthesis in vegetative organs with different specificities compared with the berry color locus. Plant J. 2017, 91, 220–236. [Google Scholar] [CrossRef] [Green Version]
  51. Plunkett, B.J.; Espley, R.V.; Dare, A.P.; Warren, B.A.W.; Grierson, E.R.P.; Cordiner, S.; Turner, J.L.; Allan, A.C.; Albert, N.W.; Davies, K.M.; et al. MYBA from blueberry (Vaccinium section Cyanococcus) is a subgroup 6 type R2R3MYB transcription factor that activates anthocyanin production. Front. Plant Sci. 2018, 9, 1300. [Google Scholar] [CrossRef]
Figure 1. Blueberry fruits. (a) Standard blue-fruited cultivar ‘Tifblue’. (b) Pink mutant cultivar ‘Pink Lemonade’ (‘PL’).
Agronomy 10 01296 g001
Figure 2. (a) Normalized expression levels from qPCR on fruit developmental stages. (b) Hierarchical clustering. The heatmap was constructed using the expression levels of each gene rescaled to the ‘green’ stage. Columns represent samples, while rows represent genes. Color scale is shown in the bar.
Agronomy 10 01296 g002
Figure 3. Representative fruits from the transient assay. Wild-type ‘Tifblue’ infiltrated with an empty vector at 24 hpi (a) and 72 hpi (b) Wild-type ‘Tifblue’ infiltrated with the vector construction containing the F3′5′H gene at 24 hpi (c) and 72 hpi (d) Mutant ‘PL’ infiltrated with the vector construction containing the F3′5′H gene at 24 hpi (e) and 72 hpi (f) The arrows point to each infiltrated fruit.
Agronomy 10 01296 g003
Figure 4. qPCR data analysis. (a) Comparative expression analysis of anthocyanin structural genes at the ripe stage of development of the wild-type ‘Tifblue’ and mutant ‘PL’ genotypes. Normalized Relative Quantities (NRQ) are rescaled to ‘PL’. (b) Expression profiles of three transcription factors on fruit developmental stages of ‘Tifblue’ compared to the ripe stage of the mutant ‘PL’. NRQ are rescaled to the ‘green’ stage. NRQ represent average values from 2013–2014 (‘Tifblue’) and 2014–2015 (‘PL’). Mean expression level (+SEM) is shown.
Agronomy 10 01296 g004
Figure 5. Phylogenetic relationships between blueberry MYB03500 transcription factor (black circle) and other MYBs involved in flavonoid pathways. Numbers next to the nodes indicate bootstrap values. Scale bar represents the number of substitutions per site. MYB transcription factors from Vaccinium species are indicated with white circles.
Agronomy 10 01296 g005
Figure 6. Sequences alignment. (a) R2R3 amino acid residues that specify interaction with bHLH proteins are indicated. Amino acids which account for most of the interaction stability are shown in blue boxes. Arrows indicate residues specific to the blueberry mutant. (b) SG6 anthocyanin motif.
Agronomy 10 01296 g006
Figure 7. Pink Lemonade at different stages of natural development (a) and 6 days after construction infiltration. A mock effector construct (empty vector) was used as a control (b). Constructs containing the MYB transcription factor driven by the 35S promoter (c,d). The arrows point to each infiltrated fruit.
Agronomy 10 01296 g007

