Abstract
Grazing is one of the predominant human activities taking place today inside protected areas, with both direct and indirect effects on the vegetation community. We analyzed the effects of grazing intensity on grass composition during four grazing seasons containing 78 plant species belonging to eight plant functional groups, which include perennial tall grass (6 species), perennial short grass (6 species), shrubs (3 species), legumes (9 species), Liliaceae herb (8 species), annual/biennial plants (11 species), perennial short forbs (16 species) and perennial tall forbs (18 species). We estimated grazing intensity at four levels, control, light, moderate and heavy grazing intensity corresponding to 0.00, 0.23, 0.46 and 0.92 animal units ha−1, respectively. We found that each plant functional group showed a different response to grazing intensity. Perennial tall grasses that were dominated by high palatable mesophyte and mesoxerophyte grass showed a significant decrease with grazing intensity, while the medium palatable xerophyte and widespread grasses that were the predominant short perennial increases with grazing intensity. The perennial tall forbs that were dominated by the mesophyte grass also decreased, but the decrease was statistically insignificant. The influence of grazing density on species is also related to soil factors (soil nutrient, soil moisture and soil temperature and soil bulk density). Some functional groups such as tall fescue and Liliaceae herbs, remained stable—which may be related to the changes in the soil environment caused by grazing activities. The findings of this study could provide a standpoint for assessing the current grazing management scenarios and conducting timely adaptive practices to maintain the long-term ability of grassland systems to perform their ecological functions.
1. Introduction
Grazing is not only a concern in Inner Mongolia, but also in all the grasslands of the world. Grazing impacts not only plant species by defoliation and selective grazing behavior, but also by mechanical pressure (trampling), which together, contribute to a decline in biomass as the livestock rate increases [1]. Rainfall has been considered as a key factor in controlling productivity and determining suitable grazing intensity in temperate grasslands [2,3]. However, management policies for grazing can mediate the productivity of grasslands. Both the duration and intensity of grazing are important, controllable factors affecting the response of plant communities. For example, long-term grazing changed the plant species composition and had an impact on grassland composition, whereas grazing intensity can have positive effect [2,4].
The comprehensive changes of species or growth patterns of plant functional groups indicate that in research related to grazing management, it is necessary to classify different climate species of vegetation to meet ecosystem targets and respond to the needs of animals [5,6].
However, non-grazing can result in a decrease or slight modification in species diversity and species composition because of the discrimination and complementarities of environmental retailers among species [7,8]. However, grazing intensity has effects on the semi-arid steppe through overgrazing and desertification. Therefore, there is an urgent need to develop a sustainable livestock production strategy to protect vegetation and meet the economic interests of farmers. More validation will be done using aboveground biomass measurements.
Integrative changes in plant diversity may not co-occur across the completely different management grazing. Changes in dominant species are sensitive to dynamical environmental factors than to changing grazing variables [9]. Grazing is especially important because it disturbs natural processes, influences species persistence and changes the composition and structure of grass communities [10]. Previous studies have shown that the annual change of plant functional groups and species composition has significant influence on community composition [11].
Covering an area of 1069 square kilometers, the Hulunbuir grassland is a part of temporal grassland ecosystem in Inner Mongolia, and is one of the largest temperate grasslands in the world. Although a considerable part of the land has been converted into cultivated land in the past 50 years, a large part of the land is still used as natural or semi-natural grassland for seasonal or continuous grazing of cattle and sheep, resulting in the degradation of the available grazing land by 50% [12,13]. To date, appropriate grazing intensity restriction is one of the most critical and urgent means to support adaptive management and sustainable development of the grassland. The grassland is suitable for hay and grazing due to the rich and palatable grass species available [14,15].
Moreover, as the study aims to assess the effect of grazing intensity in Hulunbuir grasslands, in order to understand better how grazing intensity influences aboveground biomass, we need to perform a measurable experiment to examine the effect of the grazing intensity on aboveground biomass—where grazing compression and topography are variables. With an increasing demand for animal derived food, the human population is also growing. Therefore, it is necessary to strengthen animal husbandry production.
Grazing resistance is a vague term used to describe the relative ability of plants to survive under grazing conditions. However, there are great differences among plant species and forms of expression in response to grazing strategies. More insights can be gained by organizing grazing resistance into tolerance and avoidance components [16,17]. Avoidance mechanisms reduce the possibility and severity of defoliation (escape mechanisms), while tolerance mechanisms promote post-defoliation growth (i.e., rapid leaf-replacement mechanisms). The ability of a species to survive in a grazing environment is undoubtedly a combination of these two components, but in some species and specific environmental conditions, one component may be superior to the other.
The processes and mechanisms of grassland degradation as a result of grazing intensity in Inner Mongolia are poorly understood. Therefore, the focus of this study was to explain whether the change of vegetation composition caused by grazing could be mitigated [18,19].
To find an alternative management strategy to conventional livestock husbandry, we examined the effects of grazing intensity on plant functional group composition and clarified the potential response of herbaceous species to grazing intensity. We conducted a controlled grazing experiment on the effect of cattle grazing on vegetation composition in the Hulunbuir area (northeast Inner Mongolia) under four grazing levels, from control to heavy grazing. This range of grazing intensities may be useful for a wide-ranging analysis of vegetation composition responses to grazing intensities [19,20]. The result of this study may considerably contribute to sustainably managing the grassland of the study area.
2. Materials and Methods
2.1. Study Area
This study was conducted at Hulunbuir Grassland Ecosystem Observation and Research Station, Hulunbuir Grassland Center (49°19′~49°20′ N, 119°56′~119°57′ E), Inner Mongolia, China, with a total area of 7.86 × 10⁴ km2, east–west width of 350 km, north–south length of 300 km. It is located to the east of Ergun River, the west of Hinggean, the south of Gen River and the north of Khalkha River, bordering Baikal Lake and Mongolia, including Hailar City, Manzhouli City, New Barag banner, New Barag Right Banner, Evenk Autonomous Banner and Erguna and south of Yakeshi. The Hulunbuir grassland is flat, vast and undulating. From east to west, it can be divided into three types: middle and low mountains in the west of Greater Khingan, high depression in Hulunbuir and low mountains in the west of Hulunbuir Lake.
The climate is temperate semi-arid continental, with an average annual frost-free period of 110 days. The average annual precipitation is between 350 and 400 mm. The annual average temperature is between −5 °C and −2 °C. The monthly average temperature and precipitation of the study site from 2014 to 2017 are shown in Figure 1. The annual precipitation sums were 405.9, 289.9, 350.5 and 210.9, respectively from season 2014 to season 2017. The soil type is chernozem or chestnut soil. The vegetation is typical meadow grassland. The dominant species based on importance values are Leymus chinensis, Scutellaria baicalensis, Carex duriscula and Filifolium sibiricum. Active plant growth occurs between June and October when temperatures rise above 15 °C.
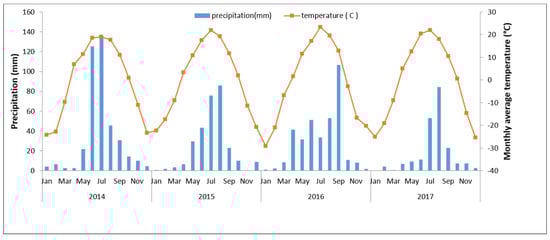
Figure 1.
Monthly average temperature and precipitation over selected periods at the experimental site in the meadow steppe of Hulunbuir, Inner Mongolia. Left y-axis—annual mean precipitation and right y-axis—annual mean temperature from 2014 to 2017. Season 2014 was the highest precipitation.
2.2. Experimental Design
The grazing experiment was established in 2009 at the Hulunbuir Grassland Ecosystem Observation and Research Station located at Xiertala farm in the center of the Hulunbuir meadow steppe (49°19′349″ N, 119°56′521″ E) in the northeastern region of Inner Mongolia, China. Experiment was setup in a split plot design with three replicate paddocks (each 167 × 300 m) per grazing treatment (Figure A1). Four grazing intensities were tested; control, light, moderate and high (with an animal number of 0, 2, 4 and 8 young cows, with a weight of 250–300 kg). Considering an animal unit equals a 500 kg adult cow, the treatments corresponded 0.00, 0, 0.23, 0.46 and 0.92 animal units (AU)/ha (i.e., G0.00, G0.23, G0.46 and G0.92, respectively). The grazing animals were kept in the pasture day and night; an outside water source was used to supply drinking water. The grazing period was from June to October and lasted for 120 days each year. Accordingly, three replicate paddocks were used for each grazing intensity and covering a 5-hectre paddock, 12 paddocks were randomly distributed.
2.3. Field Measurements and Calculations
Aboveground biomass (AGB) was measured at peak of biomass at the beginning of August in 2014, 2015, 2016 and 2017. AGB was determined by measuring five random samples (1 m2) selected in each grazing area. In each sample quadrat, species composition, canopy height and coverage were measured. The coverage was determined using a 50 × 50 cm grid with and 100 crosshairs (each grid cell 5 × 5 cm2). The natural heights of plants were measured by the straight edge multipoint method and the average value was taken. The biomass was dried at 65 °C for 48 h to constant weight. The importance value of plant species (IV) was calculated as follows:
where RC is the relative coverage of the total species per quadrat (%), RD is the relative density(species/m2) and RB is the relative biomass (g/m2) [21].
Species pattern ranked based on the species response to grazing intensity to sex groups, 1—Decreaser (DD) species dominance decreased along grazing gradient, 2—Compensator (ID) species dominance increased in light grazing and then declined in higher grazing intensity, 3—Increaser (II) species dominance increased along grazing gradient, 4—Neutral (FL) species dominance fluctuated stably, has weak relationship with grazing intensity, 5—Randomer (RA) species appeared randomly in community, take opportunity and occupied the empty niche and 6—Rare (RARE) species appeared only once in research period.
2.4. Soil Nutrient Contents
In early August of each grazing season, the soil nutrient contents were analyzed. Soil nutrients: 5 points were randomly selected by soil drill from each sample plot to collect surface soil samples for mixing (Depth: 0–20 cm). After removing rocks and plant and animal residues from soil samples, dried and determined soil nutrients [22].
Soil particle size distribution was measured by Mastersizer 2000-laser particle size analyzer (0–2000 μm), soil organic carbon content (SOC) was determined by dichromate oxidation method, total nitrogen content (TN) was determined by semi micro Kjeldahl method and total phosphorus (TP) was determined by molybdenum antimony method, were calculated by using the following equations [23].
where c = 0.8000 mol·L−1 (1/6 K2Cr2O7) the concentration of the standard solution, 5 = volume added to standard solution of potassium dichromate (mL), V0 = the blank titration uses the de-FeSO4 volume (mL), V = the sample was titrated with FeSO4 volume (mL) 1000, 3.0 = 1/4 molar mass of a carbon atom (g·mol−1), 10−3 = convert mL to L, 1.1 = oxidation correction factor, m = air-dried soil sample quality (g) and k = the air-dried soil sample converted into the coefficient of drying soil [24].
where V = the volume of the standard solution of acid used in the titrate (mL), V0 = the volume of the acid standard solution used when titrating blank (mL), c = 0.01 mol·L−1 (1/2 H2SO4) or HCl standard solution concentration, 14.0 = the molar mass of the nitrogen atom (g·mol−1), 10−3 = convert mL to L and m = quality of dried soil samples (g) [14].
where ρ = the mass concentration of phosphorus in the solution to be measured (g/kg−1), V = the number of mL of the sample preparation solution, m = dried soil quality (g), V1 = extract filtrate mL, V2 = volume of colored solution (mL) and 10−3 = Convert μg to g·kg−1.
SOC (g/kg−1) = c × 5V0 × (V0 − V) × 10−3 × 3.0 × 1.1 m × k × 1000
TN (g/kg−1) = (V − V0) × c(12H2SO4) × 14.0 × 10−3 m × 103
TP (g/kg−1) = ρ × Vm × V2V1 × 10−3
2.5. Soil Moisture and Temperature Measurements
The 5TE sensors recorded soil temperature and moisture every 10 s and averaged every 10 min for final storage. In 12 experimental plots, 1-m soil profiles were created to measure the soil-moisture content and soil temperature at depths of 20 cm with a total of 60 sensors. All sensors were installed from 2014 to 2017 [25].
Bulk density: Four layers (0–5 5–10 10–20 20–30) were taken from each sample plot by ring–knife method. The wet weight was determined after returning to the laboratory. The dry weight was determined after drying at 105 °C for 24 h.
2.6. Palatability Measurements
The palatability of each species was calculated by dividing the daily feed intake by the maximum feed intake and expressed as a percentage average as shown by the following formula [26], high palatability (>60%), moderate palatability (35%–55%) and low palatability (<25%) [27,28].
2.7. Cover and Species Richness
The ground cover percentage was estimated per each quadrat for total species, the plant species richness index (R) was calculated using the Margalef index [29].
where N is the number of individual plants in the population and S is the number of species.
2.8. Data Analysis
We classified species in eight plant functional groups based on traits. First, we divided the species to annual and perennial plant. Then, we divided it into grass and forbs, with the legumes and Liliaceae herb separated from the forbs based on the roots structure.
We used the importance value (IV) of each species as data species and plant functional groups (all plant species) in each of the quadrats. For each replication of grassland, one-way analysis of variance (ANOVA) was employed to test the differences in composition among top dominant species or eight plant functional groups. Statistical analyses were performed using the SAS program (9). Tukey’s honest significance test was used to compare the variation in soil nutrient and soil moisture (10, 20, 40 and 60 cm) among grazing densities at p < 0.05. Canonical correspondence analysis (CCA) was conducted on plant species–environmental variable matrices using the software CANOCO4.5 [30].
3. Results
3.1. Grazing Impact on Community Characteristics
There was a significant effect of grazing intensity on the aboveground biomass, coverage and species richness for total plant functional groups (Figure 2). The intensity of grazing led to significant differences (p < 0.05) among the grazing intensities for the aboveground biomass, coverage and species richness (Figure 2a,b,d). No significant difference was observed in the species abundance among the grazing intensity (Figure 2c). The aboveground biomass, coverage and species richness decreased with grazing intensity from 213.88, 340 and 31, respectively in heavy grazing density to 60.24, 175 and 25 in control.
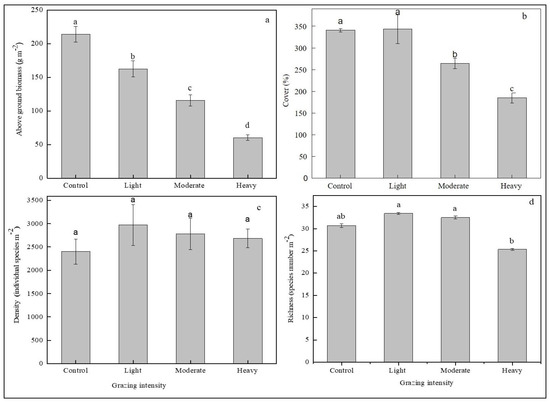
Figure 2.
Grazing effect on community composition. Means (±SE) of (a) biomass, (b) cover, (c) species abundance and (d) species richness. Species richness refers to the number of species in the area. Species abundance refers to the number of individuals per sample of the eight plant functional groups under different grazing density. Different letters over the bars indicate significant differences at p < 0.05.
The similarity of community composition is one of the most basic and significant characteristics to distinguish different grassland ecosystems. Traditional community similarity estimation is based on the difference of species occurrence rate or abundance (such as Bray–Curtis similarity index). However, the diversity of community is affected not only by the difference of species occurrence rate or abundance, but also by the biologic heterogeneity among species.
We analyzed 78 grass species at a 95% similarity level. The Bray–Curtis similarity index software was used to perform the similarity pattern recognition [31]. From the data set of the four grazing seasons, all the grazing intensity clustered together at a level of approximately 95% similarity (Figure 3). A clear trend was observed, in which the same grazing densities had over 80% similarity in plant community composition from 2015 to 2017. In the 2014 wet season, the precipitation was higher than in other grazing seasons and showed an 85% similarity between control and the other grazing densities. This trend was also similar between light grazing and moderate grazing in the dry seasons of 2015 to 2017.
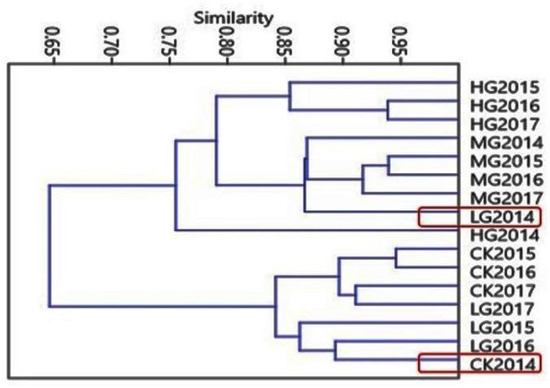
Figure 3.
Hierarchical cluster of all grass species having coherent dynamics similarity between grazing intensity in different grazing seasons, the Y right axes the grazing intensity from season 2014 to 2017.
3.2. Response of Plant Functional Groups to Grazing Intensities
We considered eight plant functional groups under the four grazing density levels. The species numbers were different-with-different functional groups; perennial tall grass (6 species), perennial short grass (6 species), shrubs (3 species), legumes (9 species), Liliaceae herb (8 species), annual/biennial plant (11species), perennial short forbs (16 species) and perennial tall forbs (18 species). The perennial tall and short grass functional groups were the main contributors to the palatable biomass consumed by the cattle and were affected by the grazing intensities. Tall perennial grasses were sensitive to grazing intensities, whereas perennial short grass significantly increased with grazing densities (Figure 4). The reduction in biomass as a result of grazing was more in tall species (perennial tall grass and perennial tall forbs) and Liliaceae herbs than in the short species (perennial short grass and perennial short forbs) and legumes. With heavy grazing, the shrubs and annual/biennial functional groups significantly increased with grazing densities. The perennial tall forbs functional group decline with grazing density, but there was no significant difference between the grazing density.
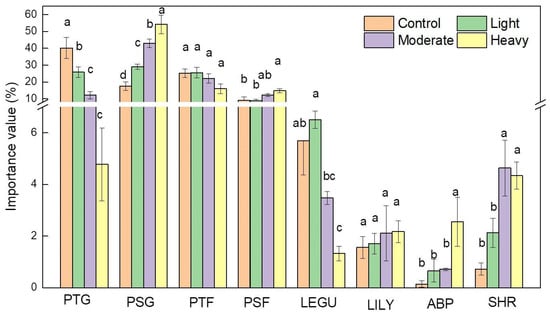
Figure 4.
Effect of grazing intensity on plant functional groups: PTG—perennial tall grass; PSG—perennial short grass; PTF—perennial tall forbs; PSF—perennial short forbs; LEGU—legumes; LILY—Liliaceae herb; ABP—annual/biennial plant; SHR—shrub. Error bars indicate the standard error (SE) of the means (p ≤ 0.05).
The change of plant functional group is closely related to the water ecotype and palatability of different species. Through the increase of grazing intensity, the dominance of the mesophyte decreased, xerophyte and widespread species increased and mesoexerophyte species did not change, which may be related to the soil environment change caused by grazing activity. With regards to the palatability, the dominance of high palatable species declined while medium palatable and poisonous species increased with grazing intensity (Figure 5).

Figure 5.
Change of water ecotypes and palatability of species in different plant functional group. (a,b) Species number and dominance (total IV of the species) of different water ecotypes in each functional group, respectively; (c) dominance of each water ecotype under different grazing intensity. M—mesophyte; MX—mesoxerophyte; X—xerophyte; WS—widespread. (d,e) species number and dominance with different palatability in each functional group, respectively; (f) dominance of each palatability level along with grazing intensity: HP—high palatability; MP—medium; LP—low palatability; PP—poisonous. Different letters over the bars indicate significant differences at p < 0.05.
The perennial tall grass was dominated by high palatable mesophyte and mesoexerophyte grasses while medium palatable xerophyte and widespread grass were the predominant PSG, which may explain the significant decrease in the dominance of PTG and increase of PSG along with the grazing intensity. The PTF was also dominated by the mesophyte species, however, most of the species had medium or low palatability, therefore, the dominance of PTF change slightly with grazing intensity. The PSF, Legume, ABP and SHR were dominated by medium and low palatable xerophyte species and the dominance of these functional groups raised with grazing pressure except Liliaceae functional group (Figure 5).
3.3. Change of Plant Species Functional Groups in Grazing Succession
The palatability of most of the species were medium palatability belonging to annual/biennial plant, Liliaceae herbs, shrub and forbs functional groups which represents close to 65.38% of the total plant cover. Tall and short grass functional groups were the main highly palatable species (17.95%) and included the perennial grass Leymus chinensis. Other dominant species are less palatable (short and tall forbs functional groups, 14.10%) and poisonous (legumes, 2.57%). The grazing intensity had a significant effect on palatable species, high palatable species significantly decreased with grazing intensity (Table 1, Table 2 and Figure A2a). The results showed a different response for species with grazing density and there were higher increases in dominant species with grazing intensity (II). There are differences among functional groups and species palatability, the dominance species decreased with grazing density (DD) and this was greater in the perennial tall grass functional group (17.56%) group (17.55%) (Table 1 and Table 2 and Figure A2b). The results also showed that most of the dominant species that decreases with grazing intensity had high palatability (Table 2, Figure A2c). The lowest palatability was noted in the dominant species that increased with the grazing density. The pattern of different species water ecotype showed that most of the species that decrease belong to the mesophyte water ecotype, while the most of increased species belong to widespread. Most of the compensatory “species dominance increased in light grazing and then declined in higher grazing intensity (ID)”, fluctuated stability “species dominance fluctuated stability has weak relationship with grazing intensity (FL)” and rare species belong to mesoxerophyte “species whose tolerance to moisture is intermediate between that of a mesophyte and a xerophyte” (Table 2 and Figure A2d).

Table 1.
Hulunbuir grassland community species ranks by dominance.
Table 2.
Species change pattern along grazing succession and their distribution in different functional groups, water ecotype and palatability level.
We classified species into six species patterns based on species response to grazing intensity. The results showed a different response for species to grazing density. Thirteen of the total 78 species decreased with grazing intensity, and 14 species increased. Most of the species belong to randomer species pattern “species appeared randomly in community, take opportunity and occupied the empty niche” (Table 1).
3.4. Relationship between Plant Functional Group and Soil Factors
We used CCA to analyze how the community parameters change along with the grazing intensity in four grazing seasons from 2014 to 2017 (Figure 6). CCA1 and CCA2 explained 16.29% of the total variance in samples and plant functional groups and 11.34% of species pattern. Soil moisture is mainly related to control and light grazing density, while soil temperature, soil bulk density and soil nutrients are mainly affected by medium and heavy grazing density (Figure 6a). Perennial short forbs, annual/biennial plants and legume functional groups are mainly affected by various soil factors, while perennial tall grass is not affected by soil bulk density (Figure 6b).
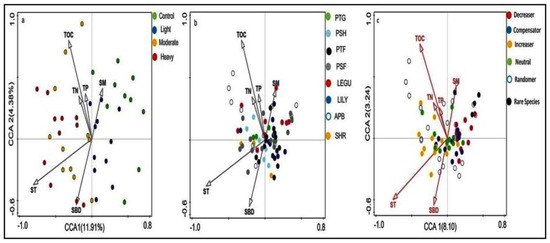
Figure 6.
Relationship between plant functional groups and species change patterns in succession with soil factors. (a) Sample plots; (b,c) species plots grouped by functional group and succession change pattern of the species, respectively. Vectors shown represent the major explanatory soil factors. SBD—soil bulk density SM—soil moisture; ST—soil temperature; TOC—total organic carbon; TN—total nitrogen; TP—total phosphorus.
In species pattern change, the dominant species that appear randomly in the community were widespread and associated with all soil factors. In addition, dominant species increased along the grazing gradient and has positive associations with soil temperature, soil bulk density and total nitrogen. Whereas the dominant decreased and rare species is positively associated with soil moisture (Figure 6c). DD (species dominance decreased along grazing gradient) was significantly and positively correlated with soil moisture, but negatively correlated with soil bulk density and soil temperature. In addition, there is a positive association between soil temperature and II (species dominance increased along the grazing gradient). In addition, the RA (species that appear randomly in the community) is widespread and associated with all soil factors.
4. Discussion
4.1. Grazing Impact on Community Characteristics
Animals are part of the ecosystem of grasslands, and their feeding behaviors directly affect aboveground plant biomass and plant community composition [32,33]. As a result, the aboveground biomass value in the non-grazed plots was significantly higher than values in grazing plots (Figure 2a) and this was consistent with previous studies [34]. It is likely that biting, trampling and other behaviors of animals during grazing lead to a decline in plant leaf area, thereby reducing photosynthetic capacity and changes in species composition. These ultimately affect the aboveground biomass of plant communities [3].
Livestock trampling is a common effect of grazing [35]. Cover is generally thought to be susceptible to grazing density which can cause marked changes in cover and species composition [36,37].
Our findings in the study area show that grazing can lead to a reduction in coverage (Figure 2b). Control and light grazing density had no significant difference in their effects on coverage, whereas moderate and heavy grazing densities led to a decline of more than 50% in coverage (Figure 2b), indicating that the degree of grazing effect on coverage depends on grazing densities. This is in agreement with previous studies that have reported that there is little effect of light grazing on the cover [38].
Our results indicated that species number does not give any indices on ecosystem functioning when abundance ranking in different plant functional groups and water ecotypes (Table 2 and Figure A2). This trend has been repeatedly predicted in theory and has been observed in previous studies [39,40]. Moreover, we found that the species abundance response to grazing can partly be explained by the species distribution. We also found that species richness increased in lightly and moderately grazed plots compared to control and heavy grazing. This partly agreed with the expectation that richness will decrease with grazing intensity [41]. The difference in species richness of different PFGs also led to the change of community structure. The short grass and short forb functional groups increased with grazing densities, while tall grass like Liliaceous herb functional groups declines. Animals accidentally eat certain plants as they graze; animals eager to eat fresh young grass may accidentally bite off the crown of poisonous species. As these are usually eaten only when animals have nothing else to eat, this may explain the decrease of Liliaceous functional group with grazing intensities.
Therefore, species richness may not be influenced by grazing, but by community composition. This difference in the functional properties of different plant functional groups and the way they interact with grazing may be an important step to better understand the response of ecosystems to different grazing densities [42] and certainly needs further attention. The similarity of community composition is one of the most significant characteristics of the grassland ecosystem [43]. Assessing compositional similarity between grazing intensities is an important issue because the similarities between grazing intensity can reveal certain mechanisms that maintain community composition and specific habitat effects that shape community structure and composition [44]. Similarity does not mean “the same”. When we state that different grazing density is the same, we should not neglect those differences that we choose to ignore [45].
In our result, the Bray–Curtis similarities based on the importance value of functional groups exhibit a similar tendency (e.g., a closer association between control and light grazing density; a greater association between moderate and heavy grazing intensities). This is due to the different similarities between species in different functional groups. For example, in the same perennial tall grass functional groups, there is a dissimilarity between Leymus chinensis (decrease with grazing density) and Stipa capillata (increase with grazing density). Furthermore, in perennial short grass, there is a dissimilarity between Heteropappus altaicus (decrease with grazing density) and Pulsatilla turczaninovii (increase with grazing density).
The physical compositions of plant communities are often changed only by grazing. [46,47] report several examples where defoliation by grazing herbivores altered plant height and canopy cover and changed species composition to include structurally different types of plants. Trampling may also change the structure of plant communities by beating and breaking down vegetation.
In this study, we classified species into eight major PFGs based on the relevant trait response to grazing density, associated with variations in life form, leaf traits and rooting depth [48,49,50,51,52]. Grazing densities can strongly change plant community compositions in grassland ecosystems to resemble the effect of ecosystems engineered in wild environments [53,54].
4.2. Response of Plant Functional Groups to Grazing Intensities
The results obtained in this study showed that the grazing intensities of cattle affects the composition and structure of Hulunbuir plant communities, which may be related to the change in soil environment caused by grazing activity. First, it was observed that grazing intensity can affect the composition of Hulunbuir grass communities—mainly between the heavy and light grazing intensities. As also observed by [55], the densities of Leymus chinensis decreased with grazing density while Carex duriuscula species increase with grazing densities. This result is consistent with [56], who found that the decrease of Chinese Leymus chinensis and its deductive species (a perennial gramineous plant, which is also the most popular and high-quality feed plant) were mainly due to the priority of selective grazing by cattle, while the rapid increase of C. duriuscula, P. acaulis, P. bifurca and A. frigida, was mainly because of their low palatability.
The effect of grazing densities on plant functional groups at species and community levels did not show a systematic pattern of intraspecific variation. However, the contribution of particular species (Figure 4) of plant functional groups to the total above-ground biomass of each grazing density varied considerably. These results indicate that species composition and occurrence of plant functional groups on meadow steppe are sensitive to grazing.
The change of plant species composition apparent in plant functional groups reflected plant functional groups composition (Figure 4). Leymus chinensis decreased with grazing density while Stipa capillata species increased with grazing density. The comparison of non-grazing and grazing densities under short-term grazing in the Hulunbuir grassland area showed that the composition of the most dominant grass species and plant functional groups had different responses to grazing densities. Most of the tall plants decrease with grazing density proportionally to total plant functional groups, and the short plant species increase with grazing density, due to palatability or competition. These differences between plant species resulted from interspecific differences in plant functional groups and differences in species abundance between grazing densities [57,58]. More than 90% of the grassland area is grazed by herbivores [59].
Stable grassland production not only maintains the function of the grassland ecosystem, but also supports the development of grassland animal husbandry. The results showed that grazing density reduced plant productivity and changed plant community composition while grazing intensity did not affect ecosystem stability. There is an optimal grazing intensity to maintain the structure and function of ecosystems [8], Heavy grazing may reduce biodiversity and productivity [60] while light grazing density may also lead to composition changes and species invasion [61]. The moderate grazing could be the optimal grazing intensity according to our results.
4.3. Change of Plant Species Functional Groups in Grazing Succession
Under grazing conditions, with the changes of grazing intensity and composition, the number of highly palatable species such as Leymus chinensis, Festuca ovina, Achnatherum sibiricum and Melissilus ruthenicus decreased gradually. In general, grazing density significantly affects plant community composition [3].
However, the directional change of community composition under different grazing densities is determined by environmental conditions and grassland types [62]. In many steppe areas, grazing has resulted in changes in highly palatable species such as perennial grasses being replaced by forbs [63]. Grazing also reduced the dominance of Leymus chinensis, Poa pratensis, Agropyron cristatum, Hierochloe glabra, Bromus inermis and Koeleria cristata. Animal preference led to the decrease of perennial grass and the increase of forbs [64].
However, some perennial grasses, such as Stipa capillata have no response to grazing [65]. The palatability of species depends in part on the resistance of selective animal bites to grazing. For example, animals like to eat perennial grass, rather than other functional groups [66].
Water ecotypes also affect plant composition. In our study, mesophytes and mesoxerophytes decreased with grazing density while xerophytes and widespreads increased with grazing density (Figure 4c) because the most dominant species belong to xerophyte which has low palatability (Iris ventricosa, Iris tigridia, Pulsatilla turczaninovii, Potentilla acaulis, Heteropappus altaicus and Cymbaria dahurica).
In addition, xerophytes and widespread species distribution are characterized by the stable fluctuation of species dominance with the increase of grazing gradient and high resistance to grazing; community stability is closely related to productivity and temporal variability of productivity [67]. In grassland areas, grazing usually creates a more stable vegetation pattern than non-grazing [68,69]. The results showed that community stability is related to the resilience of species, but not to the resistance of plants. The regeneration ability of plants after grazing may be more important than the resistance to maintain stable biomass production.
4.4. Relationship between Plant Functional Group and Soil Factors
Grazing density affects perennial plants exposed to grazing during their long life cycle that may be strongly damaged, preventing their regeneration [70,71,72].
The CCA result showed perennial forbs groups are characterized by variability in traits. This functional redundancy explains its widespread in different environmental factors because there is a higher probability of species tolerant to grazing within the group. Changes in soil moisture and soil temperature in our studied ecosystem appeared to be governed primarily by functional groups and rainfall. Therefore, grazing can be predicted to decrease productivity (i.e., canopy cover and biomass) due to the lower amount of soil water storage in the early grazing seasons [73]. The results showed that grazing density was mainly distinguished due to soil moisture and soil temperature. Among the grazing densities, the soil water content of the control plots did not increase significantly over the light and medium grazing density [74]. The results of our study suggest that important references for assessing the scenarios of grazing management can be provided through monitoring changes in environmental variables, species composition, species diversity, aboveground biomass and species photosynthetic pathways in the communities of grassland and applying timely adaptive practices to maintain the ability of long-term grassland for sustainable productivity.
5. Conclusions
Grazing density is one of the major factors influencing community composition and ecosystem function in natural grasslands. In this study, different sensitive indices “species composition and species diversity “of long -term grazing were identified.
Grazing intensity had a significant effect on cover and aboveground biomass, in which biomass and vegetation cover significantly decreased as grazing density increased.
The gradient of grazing intensity reflects grazing pressure from control to heavy grazing intensity. The aboveground biomass and importance value can be used as a potential long-term sensitive index. In this study, light and heavy grazing intensities represent the best and worst response of aboveground biomass to grazing intensity, respectively. We found that dominant perennial tall grass functional group (high palatable) were shown significant decrease with grazing intensity, while perennial short grass functional group was increase with grazing intensity. In addition, this study also showed that the effect of grazing density on grassland varies according to plant functional groups response to grazing intensity.
The result of this study may considerably contribute to managing the grassland of the study area sustainably. Therefore, we recommend that further studies could be needed to understand the scenarios of the effect of grazing on plant functional groups.
In addition, the findings of this study may provide a standpoint for assessing current grazing management scenarios and conducting timely adaptive practices to maintain the long-term ability of grassland systems to perform their ecological functions.
Author Contributions
Conceptualization, Y.M.Z.; data curation, Y.M.Z.; writing—original draft preparation, Y.M.Z.; writing—review and editing, X.X.; supervision, X.X.; project administration, X.X.; funding acquisition, R.Y.; methodology, R.Y.; software, X.X.; validation, Y.M.Z., Y.Y. and R.Y.; formal analysis, A.I.A., L.H. and Y.Z.; visualization. All authors have read and agreed to the published version of the manuscript.
Funding
This study was supported by the National Key Research and Development Program of China (2016YFC0500608), the Natural Science Foundation of China (31971769), the Fundamental Research Funds for Central Nonprofit Scientific Institution (1610132019031, Y2019YJ13) and Special Funding for Modern Agricultural Technology Systems from the Chinese Ministry of Agriculture (CARS-34).
Acknowledgments
We thank Hulunbuir Grassland Ecosystem Research Station for their efforts in field sampling and our colleagues from the Agricultural Resources and Regional Planning Institute for helping us to make these figures.
Conflicts of Interest
The authors declare no conflict of interest.
Appendix A

Figure A1.
Experimental design. Values 0.00, 0.23, 0.46 and 0.92 AU ha−1 correspond to the no grazing (CK), light grazing (LG), moderate grazing (MG) and heavy grazing (HG) treatments, respectively (where 1 AU = 500 kg of adult cattle). We achieved the stocking rates used. 0, 2, 4 or 8 young cattle (250–300 kg) per plot [74].

Figure A2.
Species change pattern along grazing succession and their distribution in different functional groups, water ecotype and palatability level. Different letters over the bars indicate significant differences at p < 0.05. (a) Changing pattern of species along different grazing intensity: DD—species dominance decreased along grazing gradient, ID— species dominance increased in light grazing and then declined in higher grazing intensity; II—species dominance increased along grazing gradient; FL—species dominance fluctuated stable; RA—species appeared randomly in community; RARE—species appeared only once in the research period; (b–d) are, respectively the dominance of different functional groups, palatability levels and water ecotypes with different succession changes. Data were calculating at peak biomass time (August) to determine the change in species pattern along grazing intensity.
References
- Christiansen, S.; Svejcar, T. Grazing effects on shoot and root dynamics and above- and below-ground non-structural carbohydrate in Caucasian bluestem. Grass Forage Sci. 1988, 43, 111–119. [Google Scholar] [CrossRef]
- Biondini, M.E.; Patton, B.D.; Nyren, P.E. Grazing intensity and ecosystem processes in a northern mixed-grass prairie, USA. Ecol. Appl. 1998, 8, 469–479. [Google Scholar] [CrossRef]
- Milchunas, D.G.; Lauenroth, W.K. Quantitative Effects of Grazing on Vegetation and Soils Over a Global Range of Environments. Ecol. Monogr. 1993, 63, 327–366. [Google Scholar] [CrossRef]
- McNaughton, S.J.; Milchunas, D.G.; Frank, D.A. How can net Primary Productivity be Measured in Grazing Ecosystems? Ecology 1996, 77, 974–977. [Google Scholar] [CrossRef]
- Cingolani, A.M.; Noy-Meir, I.; Díaz, S. Grazing effects on rangeland diversity: A synthesis of contemporary models. Ecol. Appl. 2005, 15, 757–773. [Google Scholar] [CrossRef]
- Lavorel, S.; Díaz, S.; Cornelissen, J.H.C.; Garnier, E.; Harrison, S.P.; McIntyre, S.; Pausas, J.G.; Pérez-Harguindeguy, N.; Roumet, C.; Urcelay, C. Plant Functional Types: Are We Getting Any Closer to the Holy Grail? Springer-Verlag: Berlin, Germany, 2007; pp. 149–164. [Google Scholar]
- Hallett, L.; Stein, C.; Suding, K.N. Functional diversity increases ecological stability in a grazed grassland. Oecologia 2017, 183, 831–840. [Google Scholar] [CrossRef]
- Li, W.; Xu, F.; Zheng, S.; Taube, F.; Bai, Y. Patterns and thresholds of grazing-induced changes in community structure and ecosystem functioning: Species-level responses and the critical role of species traits. J. Appl. Ecol. 2016, 54, 963–975. [Google Scholar] [CrossRef]
- Oñatibia, G.R.; Boyero, L.; Aguiar, M.R. Regional productivity mediates the effects of grazing disturbance on plant cover and patch-size distribution in arid and semi-arid communities. Oikos 2018, 127, 1205–1215. [Google Scholar] [CrossRef]
- Proulx, M.; Mazumder, A. Reversal of grazing impact on plant species richness in nutrient-poor vs. nutrient-rich ecosystems. Ecology 1998, 79, 2581–2592. [Google Scholar] [CrossRef]
- Ganjurjav, H.; Gornish, E.S.; Hu, G.; Wan, Y.; Li, Y.; Danjiu, L.; Gao, Q. Temperature leads to annual changes of plant community composition in alpine grasslands on the Qinghai-Tibetan Plateau. Environ. Monit. Assess. 2018, 190, 585. [Google Scholar] [CrossRef]
- Katoh, K.; Takeuchi, K.; Jiang, D.; Nan, Y.; Kou, Z. Vegetation restoration by seasonal exclosure in the Kerqin Sandy Land, Inner Mongolia. Plant Ecol. 1998, 139, 133–144. [Google Scholar] [CrossRef]
- Yan, Y.; Lu, X. Is grazing exclusion effective in restoring vegetation in degraded alpine grasslands in Tibet, China? PeerJ 2015, 3, e1020. [Google Scholar] [CrossRef] [PubMed]
- Renzhong, W.; A Ripley, E. Effects of grazing on a Leymus chinensis grassland on the Songnen plain of North-Eastern China. J. Arid. Environ. 1997, 36, 307–318. [Google Scholar] [CrossRef]
- Schönbach, P.; Wan, H.; Schiborra, A.; Gierus, M.; Bai, Y.; Müller, K.; Glindemann, T.; Wang, C.; Susenbeth, A.; Taube, F. Short-term management and stocking rate effects of grazing sheep on herbage quality and productivity of Inner Mongolia steppe. Crop. Pasture Sci. 2009, 60, 963–974. [Google Scholar] [CrossRef]
- Briske, D.D. Plant response to defoliation: Morphological considerations and allocation priorities. In Rangelands: A Resource under Siege, Proceedings of the 2nd International Rangeland Congress, Adelaide, Australia, 13–18 May 1984; Cambridge University Press: Cambridge, UK; New York, NY, USA, 1986; pp. 425–427. [Google Scholar]
- Stuart-Hill, G.; Tainton, N.; Barnard, H. The influence of an Acacia karroo tree on grass production in its vicinity. J. Grassl. Soc. S. Afr. 1987, 4, 83–88. [Google Scholar] [CrossRef]
- Ma, L.; Yuan, F.; Liang, H.; Rong, Y. The effects of grazing management strategies on the vegetation, diet quality, intake and performance of free grazing sheep. Livest. Sci. 2014, 161, 185–192. [Google Scholar] [CrossRef]
- Patton, B.D.; Dong, X.; Nyren, P.E.; Nyren, A. Effects of Grazing Intensity, Precipitation, and Temperature on Forage Production. Rangel. Ecol. Manag. 2007, 60, 656–665. [Google Scholar] [CrossRef]
- McNaughton, S.J. Grazing as an Optimization Process: Grass-Ungulate Relationships in the Serengeti. Am. Nat. 1979, 113, 691–703. [Google Scholar] [CrossRef]
- Kent, M. Vegetation Description and Data Analysis: A Practical Approach, 2nd ed.; Wiley-Blackwell: Hoboken, NJ, USA, 2011; p. 428. [Google Scholar]
- Bao, S.D. Soil Agricultural Chemical Analysis, 3rd ed.; China Agricultural Press: Beijing, China, 2000; pp. 265–267. [Google Scholar]
- Wang, Z.; Johnson, D.A.; Rong, Y.; Wang, K. Grazing effects on soil characteristics and vegetation of grassland in northern China. Solid Earth 2016, 7, 55–65. [Google Scholar] [CrossRef]
- Zhao, Y.; Peth, S.; Krümmelbein, J.; Horn, R.; Wang, Z.; Steffens, M.; Hoffmann, C.; Peng, X. Spatial variability of soil properties affected by grazing intensity in Inner Mongolia grassland. Ecol. Model. 2007, 205, 241–254. [Google Scholar] [CrossRef]
- Li, X.-Y.; Zhang, S.-Y.; Peng, H.-Y.; Hu, X.; Ma, Y.-J. Soil water and temperature dynamics in shrub-encroached grasslands and climatic implications: Results from Inner Mongolia steppe ecosystem of north China. Agric. For. Meteorol. 2013, 171, 20–30. [Google Scholar] [CrossRef]
- Larbi, A.; Osakwe, I.I.; Lambourne, J.W. Variation in relative palatability to sheep among Gliricidia sepium provenances. Agrofor. Syst. 1993, 22, 221–224. [Google Scholar] [CrossRef]
- Lambert, M.G.; Jung, G.A.; Fletcher, R.H.; Budding, P.J.; Costall, D.A. Forage shrubs in North Island hill country 2. Sheep and goat preferences. N. Z. J. Agric. Res. 1989, 32, 485–490. [Google Scholar] [CrossRef]
- Obour, R.; Oppong, S.K. Forage palatability of Broussonetia papyrifera an invasive species in Ghana: Relative preference and palatability by sheep and goats. J. Energy Nat. Resour. Manag. 2015, 2, 63–70. [Google Scholar] [CrossRef]
- Margalef, R. On Certain Unifying Principles in Ecology. Am. Nat. 1963, 97, 357–374. [Google Scholar] [CrossRef]
- Ter Braak, C.J.F.; Šmilauer, P. CANOCO Reference Manual and CanoDraw for Windows User’s Guide: Software for Canonical Community Ordination (version). 2002. Available online: www.canoco.com (accessed on 19 August 2020).
- Yoshioka, P. Misidentification of the Bray-Curtis similarity index. Mar. Ecol. Prog. Ser. 2008, 368, 309–310. [Google Scholar] [CrossRef]
- Milchunas, D.G.; Lauenroth, W.K.; Chapman, P.L.; Kazempour, M.K. Effects of grazing, topography, and precipitation on the structure of a semiarid grassland. Vegetatio 1989, 80, 11–23. [Google Scholar] [CrossRef]
- Na, Y.; Li, J.; Hoshino, B.; Bao, S.; Qin, F.; Myagmartseren, P. Effects of Different Grazing Systems on Aboveground Biomass and Plant Species Dominance in Typical Chinese and Mongolian Steppes. Sustainability 2018, 10, 4753. [Google Scholar] [CrossRef]
- Li, S.; Wang, Q.; Jing, Z.; Wang, W. The effects of protective enclosure on vegetation diversity, and productivity of degraded alpine Kobresia meadow (Qinghai-Tibetan Plateau). Pol. J. Ecol. 2009, 57, 495–502. [Google Scholar]
- Warren, S.D.; Eldridge, D.J. Biological Soil Crusts and Livestock in Arid Ecosystems: Are They Compatible? In Biological Soil Crusts: Structure, Function, and Management; Belnap, J., Lange, O.L., Eds.; Springer: Berlin, Germany, 2001; Volume 150, pp. 401–415. [Google Scholar]
- Liu, H.; Han, X.; Li, L.; Huang, J.; Liu, H.; Li, X. Grazing Density Effects on Cover, Species Composition, and Nitrogen Fixation of Biological Soil Crust in an Inner Mongolia Steppe. Rangel. Ecol. Manag. 2009, 62, 321–327. [Google Scholar] [CrossRef]
- Yates, C.J.; Norton, D.A.; Hobbs, R.J. Grazing effects on plant cover, soil and microclimate in fragmented woodlands in south-western Australia: Implications for restoration. Austral Ecol. 2000, 25, 36–47. [Google Scholar] [CrossRef]
- Anderson, J.L. Exclosures on the Beaver Dam slope in Arizona and Utah. Rangelands 1994, 16, 184–188. [Google Scholar]
- McIntyre, S.; Lavorel, S. Livestock grazing in subtropical pastures: Steps in the analysis of attribute response and plant functional types. J. Ecol. 2001, 89, 209–226. [Google Scholar] [CrossRef]
- Vesk, P.A.; Westoby, M. Predicting plant species’ responses to grazing. J. Appl. Ecol. 2002, 38, 897–909. [Google Scholar] [CrossRef]
- Díaz, S.; Lavorel, S.; McIntyre, S.; Falczuk, V.; Casanoves, F.; Milchunas, D.G.; Skarpe, C.; Rusch, G.M.; Sternberg, M.; Noy-Meir, I.; et al. Plant trait responses to grazing ? a global synthesis. Glob. Chang. Boil. 2007, 13, 313–341. [Google Scholar] [CrossRef]
- McIntyre, S.; Lavorel, S.; Landsberg, J.; Forbes, T. Disturbance response in vegetation–towards a global perspective on functional traits. J. Veg. Sci. 1999, 10, 621–630. [Google Scholar] [CrossRef]
- Jost, L.; Chao, A.; Chazdon, R.L. Compositional similarity and β (beta) diversity. In Biological Diversity: Frontiers in Measurement and Assessment, 1st ed.; Magurran, A.E., McGill, B.J., Eds.; Oxford University Press: Oxford, UK, 2011; pp. 66–84. [Google Scholar]
- Socolar, J.B.; Gilroy, J.J.; Kunin, W.E.; Edwards, D.P.; Information, P.E.K.F.C. How Should Beta-Diversity Inform Biodiversity Conservation? Trends Ecol. Evol. 2016, 31, 67–80. [Google Scholar] [CrossRef]
- Hao, M.; Corral-Rivas, J.J.; González-Elizondo, M.S.; Ganeshaiah, K.N.; Nava-Miranda, M.G.; Zhang, C.; Zhao, X.; Von Gadow, K. Assessing biological dissimilarities between five forest communities. For. Ecosyst. 2019, 6, 30. [Google Scholar] [CrossRef]
- Fleischner, T.L. Ecological Costs of Livestock Grazing in Western North America. Conserv. Boil. 1994, 8, 629–644. [Google Scholar] [CrossRef]
- Huntly, N. Herbivores and the dynamics of communities and ecosystems. Annu. Rev. Ecol. Syst. 1991, 22, 477–503. [Google Scholar] [CrossRef]
- Cornelissen, J.H.C.; Lavorel, S.; Garnier, E.; Díaz, S.; Buchmann, N.; Gurvich, D.E.; Reich, P.B.; Ter Steege, H.; Morgan, H.D.; Van Der Heijden, M.G.A.; et al. A handbook of protocols for standardised and easy measurement of plant functional traits worldwide. Aust. J. Bot. 2003, 51, 335–380. [Google Scholar] [CrossRef]
- Díaz, S.; Noy-Meir, I.; Cabido, M. Can grazing response of herbaceous plants be predicted from simple vegetative traits? J. Appl. Ecol. 2001, 38, 497–508. [Google Scholar] [CrossRef]
- Jauffret, S.; Lavorel, S. Are plant functional types relevant to describe degradation in arid, southern Tunisian steppes? J. Veg. Sci. 2003, 14, 399–408. [Google Scholar] [CrossRef]
- Navarro, T.; Alados, C.; Cabezudo, B. Changes in plant functional types in response to goat and sheep grazing in two semi-arid shrublands of SE Spain. J. Arid. Environ. 2006, 64, 298–322. [Google Scholar] [CrossRef]
- Rusch, G.M.; Pausas, J.G.; Lepš, J. Plant functional types in relation to disturbance and land use: Introduction. J. Veg. Sci. 2003, 14, 307–310. [Google Scholar] [CrossRef]
- Derner, J.D.; Lauenroth, W.K.; Stapp, P.; Augustine, D.J. Livestock as Ecosystem Engineers for Grassland Bird Habitat in the Western Great Plains of North America. Rangel. Ecol. Manag. 2009, 62, 111–118. [Google Scholar] [CrossRef]
- Sala, O.E. The effect of herbivory on vegetation structure. In Plant Form and Vegetation Structure; Werger, M.J.A., van der Aart, P.J.M., During, H.J., Verhoeven, J.T.A., Eds.; SPB Academic Publishing: Hague, The Netherlands, 1988; pp. 317–330. [Google Scholar]
- Liu, C.; Song, X.; Wang, L.; Wang, D.; Zhou, X.; Liu, J.; Zhao, X.; Li, J.; Lin, H. Effects of grazing on soil nitrogen spatial heterogeneity depend on herbivore assemblage and pre-grazing plant diversity. J. Appl. Ecol. 2015, 53, 242–250. [Google Scholar] [CrossRef]
- Yan, R.; Xin, X.; Yan, Y.; Wang, X.; Zhang, B.; Yang, G.; Liu, S.; Deng, Y.; Li, L. Impacts of Differing Grazing Rates on Canopy Structure and Species Composition in Hulunber Meadow Steppe. Rangel. Ecol. Manag. 2015, 68, 54–64. [Google Scholar] [CrossRef]
- Albert, C.H.; Thuiller, W.; Yoccoz, N.; Douzet, R.; Aubert, S.; Lavorel, S. A multi-trait approach reveals the structure and the relative importance of intra- vs. interspecific variability in plant traits. Funct. Ecol. 2010, 24, 1192–1201. [Google Scholar] [CrossRef]
- Roche, P.; Díaz-Burlinson, N.; Gachet, S. Congruency analysis of species ranking based on leaf traits: Which traits are the more reliable? Plant Ecol. 2004, 174, 37–48. [Google Scholar] [CrossRef]
- Reid, R.S.; Galvin, K.A.; Kruska, R.S. Global Significance of Extensive Grazing Lands and Pastoral Societies: An Introduction. In Fragmentation in Semi-Arid and Arid Landscapes; Springer: Dordrecht, The Netherlands, 2008; pp. 1–24. [Google Scholar]
- Ganjurjav, H.; Zhang, Y.; Gornish, E.S.; Hu, G.; Li, Y.; Wan, Y.; Gao, Q. Differential resistance and resilience of functional groups to livestock grazing maintain ecosystem stability in an alpine steppe on the Qinghai-Tibetan Plateau. J. Environ. Manag. 2019, 251, 109579. [Google Scholar] [CrossRef] [PubMed]
- Porensky, L.; Derner, J.D.; Augustine, D.J.; Milchunas, D.G. Plant Community Composition After 75 Yr of Sustained Grazing Intensity Treatments in Shortgrass Steppe. Rangel. Ecol. Manag. 2017, 70, 456–464. [Google Scholar] [CrossRef]
- Semmartin, M.; Aguiar, M.R.; Distel, R.A.; Moretto, A.S.; Ghersa, C.M. Litter quality and nutrient cycling affected by grazing-induced species replacements along a precipitation gradient. Oikos 2004, 107, 148–160. [Google Scholar] [CrossRef]
- Jones, W.M.; Fraser, L.H.; Curtis, P.J. Plant community functional shifts in response to livestock grazing in intermountain depressional wetlands in British Columbia, Canada. Biol. Conserv. 2011, 144, 511–517. [Google Scholar] [CrossRef]
- Yang, Z.; Xiong, W.; Xu, Y.; Jiang, L.; Zhu, E.; Zhan, W.; He, Y.; Zhu, D.; Zhu, Q.; Peng, C.; et al. Soil properties and species composition under different grazing intensity in an alpine meadow on the eastern Tibetan Plateau, China. Environ. Monit. Assess. 2016, 188, 678. [Google Scholar] [CrossRef]
- Miehe, G.; Miehe, S.; Bach, K.; Nölling, J.; Hanspach, J.; Reudenbach, C.; Kaiser, K.; Wesche, K.; Mosbrugger, V.; Yang, Y.; et al. Plant communities of central Tibetan pastures in the Alpine Steppe/Kobresia pygmaea ecotone. J. Arid. Environ. 2011, 75, 711–723. [Google Scholar] [CrossRef]
- Adler, P.; Milchunas, D.G.; Sala, O.E.; Burke, I.C.; Lauenroth, W.K. Plant traits and ecosystem grazing effects: Comparison of U.S. sagebrush steppe and patagonian steppe. Ecol. Appl. 2005, 15, 774–792. [Google Scholar] [CrossRef]
- Tilman, D. The ecological consequences of changes in biodiversity: A search for general principles. Ecology 1999, 80, 1455–1474. [Google Scholar]
- Dumont, B.; Rossignol, N.; Loucougaray, G.; Carrère, P.; Chadoeuf, J.; Fleurance, G.; Bonis, A.; Farruggia, A.; Gaucherand, S.; Ginane, C.; et al. When does grazing generate stable vegetation patterns in temperate pastures? Agric. Ecosyst. Environ. 2012, 153, 50–56. [Google Scholar] [CrossRef]
- Pillar, V.D.; Blanco, C.C.; Müller, S.C.; Sosinski, E.E.; Joner, F.; Duarte, L.D.S. Functional redundancy and stability in plant communities. J. Veg. Sci. 2013, 24, 963–974. [Google Scholar] [CrossRef]
- Bermejo, L.; De Nascimento, L.; Mata, J.; Fernandez-Lugo, S.; Camacho, A.; Arévalo, J.R. Responses of plant functional groups in grazed and abandoned areas of a Natural Protected Area. Basic Appl. Ecol. 2012, 13, 312–318. [Google Scholar] [CrossRef]
- Naeem, S. Species Redundancy and Ecosystem Reliability. Conserv. Boil. 1998, 12, 39–45. [Google Scholar] [CrossRef]
- Wellnitz, T.; Poff, N.L. Functional redundancy in heterogeneous environments: Implications for conservation. Ecol. Lett. 2001, 4, 177–179. [Google Scholar] [CrossRef]
- Yuan, W.; Zhou, G. Responses of three Stipa communities net primary productivity along Northeast China Transect to seasonal distribution of precipitation. J. Appl. Ecol. 2005, 16, 605–609. [Google Scholar]
- Yan, Y.; Yan, R.; Chen, J.; Xin, X.; Eldridge, D.J.; Shao, C.; Wang, X.; Lv, S.; Jin, D.; Chen, J.; et al. Grazing modulates soil temperature and moisture in a Eurasian steppe. Agric. For. Meteorol. 2018, 262, 157–165. [Google Scholar] [CrossRef]
© 2020 by the authors. Licensee MDPI, Basel, Switzerland. This article is an open access article distributed under the terms and conditions of the Creative Commons Attribution (CC BY) license (http://creativecommons.org/licenses/by/4.0/).