Article

The Diurnal Rhythm of Brassica napus L. Influences Contents of Sulfur-Containing Defense Compounds and Occurrence of Vascular Occlusions during an Infection with Verticillium longisporum

by
Sofia Isabell Rupp
1,
Johann Hornbacher
1,
Ina Horst-Niessen
1,
Frank Schaarschmidt
2,
Anja Riemenschneider
1 and
Jutta Papenbrock
1,*
1
Institute of Botany, Leibniz University Hannover, Herrenhäuserstr. 2, D-30419 Hannover, Germany
2
Institute of Cell Biology and Biophysics, Leibniz University Hannover, Herrenhäuserstr. 2, D-30419 Hannover, Germany
*
Author to whom correspondence should be addressed.
Agronomy 2020, 10(9), 1227; https://doi.org/10.3390/agronomy10091227
Submission received: 27 July 2020 / Revised: 8 August 2020 / Accepted: 17 August 2020 / Published: 20 August 2020
(This article belongs to the Special Issue Defense Metabolites in Brassicas Crops)

Abstract

:
Reduction in atmospheric sulfur and intensified agriculture have led to sulfur deficiency, often correlated with a higher susceptibility to pathogens. The spread of fungal pathogens, such as the soil-born Verticillium longisporum, was observed. Defense responses of infected plants are linked to sulfur-containing compounds including glucosinolates (GSLs). Some pathogens infect their hosts at specific time periods during the day. To investigate the relation of sulfur-containing metabolites with diurnal effects of infection time points, Brassica napus plants cultivated at two different sulfur supplies, were infected with V. longisporum at four different time points during the day. It was demonstrated that 3, 7 and 14 days after inoculation the infected plants differed in their infection rate depending on the time point of infection. Additionally, infected plants had higher contents of sulfur-containing metabolites, such as specific GSLs, in comparison to non-infected plants. Sufficient sulfur fertilization was always reflected in higher contents of sulfur-containing compounds as well as a lower rate of infection compared to sulfur-deprived plants. On the microscopic level vascular occlusions in the hypocotyl were visible and the amount was dependent on the time point of infection. The results might be used to optimize sulfur fertilization to reduce susceptibility to V. longisporum.

1. Introduction

Human existence depends on agricultural crops which provide food, feed for livestock, oil, fuel and other important materials. The Brassicaceae family includes many important agriculturally used plant species like Brassica napus, which is not only used for vegetable oil production, but also for livestock food and biodiesel production. But especially Brassicaceae crop yields are prone to plant pathogens accounting for 16% of annual crop losses [1]. A major group accounting for 70–80% of all plant pathogens consists of fungi, among them Verticillium longisporum [2].
In the last 20 years, the number of identified fungal plant pathogens has more than quadrupled [3]. However, this is not only due to better detection methods, but seems to be rather a direct result of high yielding crop cultivation and intensive agroecosystem management practices [4]. Due to continuous farming, it is possible that unknown or even host-specific plant pathogens such as V. longisporum occur [5,6].
Verticillium stem striping is caused by an infection of B. napus with V. longisporum and is especially threatening in the northern hemisphere [7,8]. The pathogen enters the plant by penetration of roots and further spreading through xylem vessels. As a result of the infection, plants are stunted and yields are drastically reduced. The use of conventional fungicides is not able to cope with any life stage of V. longisporum, leading to resting microsclerotia in the soil up to several years before suitable host plants can be planted again [9]. Hence, it is essential to understand the host-pathogen interaction in more detail to be able to develop alternative strategies in order to control this disease. In case of infections with vascular pathogens, recognition may be mediated by either extracellular or intracellular receptors, which leads to a defense reaction within the xylem vessels. In order to prevent the pathogen from spreading further up in the xylem vessels, the plant mediates extensive physical defense reactions. Formation of physical barriers in the form of occlusions are well described defense mechanism exhibited by B. napus when infected with V. longisporum. These occlusions can consist of crushed cells surrounding the xylem vessels, bubble-like outgrowths called tyloses, or gels consisting of phenolic compounds. Over time these occlusions become lignified through oxidation of phenolic compounds in the occlusion site and prevent the pathogen from spreading further upwards in the plant [10].
In the late 1980s, it became apparent that sulfur plays an essential role in crop resistance against pathogens, as the reduction of atmospheric sulfur depositions has led to a widespread nutrient disturbance in European agriculture [11,12,13]. In addition to that, increased crop yields draw great amounts of sulfur out of the soil, which calls for sufficient sulfur replacements [14].
The macronutrient sulfur is taken up by roots from the soil as inorganic sulfate. The rate of uptake and assimilation of sulfur is mainly controlled by the sulfur content of the plant and by the growing stage-dependent requirements [15]. The first stable organic compound in the sulfur assimilation, cysteine, is an important amino acid which is a part of the metabolic crossroad of primary and secondary metabolism. Among being the precursor for proteins and vitamins, it is the source of sulfur-containing defense compounds (SDCs). Sulfur-containing defense compounds, which include glucosinolates (GSLs), glutathione (GSH), sulfur-containing proteins, phytoalexins and H2S, are not primarily synthesized for pathogen-specific defense mechanisms [16]. Part of the cysteine pool is used for the biosynthesis of the tripeptide GSH. Levels of cysteine and GSH have been suggested as markers for the elevated activity of primary sulfur metabolism after pathogen infection because of their contribution to secondary compounds, i.e., GSLs [17]. The levels of GSH and GSLs were shown to be regulated diurnally [18] and some genes involved in GSL biosynthesis are controlled by the circadian clock [19].
Glucosinolates are amino acid-derived thioglycosides, which occur generally in the order Brassicales and can be found in almost all plant organs [20,21]. There are approximately 130 described GSLs, which share a chemical structure consisting of a β-D-glucopyranose residue linked through a sulfur atom to a (Z)-N-hydroximino-sulfate ester and a variable side chain (R), which is derived from modified amino acids [22,23]. Based on the amino acid the GSLs are derived from, they can be divided into three main groups. Glucosinolates derived from alanine, leucine, isoleucine, methionine and valine yield aliphatic GSLs (aGSL). Benzylic GSLs (bGSL) are derived from phenylalanine and tyrosine, and indolic GSLs (iGSL) from tryptophan [22,24]. Glucosinolates present in Brassicaceae are a well described example of SDCs [25,26]. Glucosinolates and β-thioglucosidases (myrosinases) are spatially separated within plant tissues [27]. Intact GSLs are mostly inert, but if the plant is subjected to tissue disruption GSLs come into contact with myrosinases [26].
In the 1990’s, the concept of increased plant resistance to fungal pathogens based on sulfur was developed [28], also in the context of new cultivars low in both erucic acid and GSLs. Experiments performed with sulfur-deficient B. napus showed a higher susceptibility towards V. longisporum highlighting the importance of a sufficient sulfur supply [29].
Regarding a successful pathogenic invasion and consequent disease development, it is necessary that pathogen, susceptible host and favorable environmental conditions come together at a certain time point. Conversely, the susceptibility of the host and the virulence of the pathogen may vary during the day, as well as the stage of development of the two organisms involved [30]. Various publications showed that the interaction between plants and their pathogens correlates with light, indicating that there are direct effects of light on both organisms [31,32,33,34]. Results from Wang et al. [35] indicate that defense genes are under circadian control, allowing plants to detect infections at dawn when the pathogens disperse spores and time immune responses by perceiving pathogenic signals upon infection. Temporal control of the defense genes by CIRCADIAN AND CLOCK ASSOCIATED 1 (CCA1) differentiate their involvement in (I) basal defense mechanisms and (II) defense based on specific resistance (R) genes. The studies revealed a key functional link between the circadian clock and plant immunity. Mutants overexpressing CCA1 showed enhanced resistance against downy mildew supporting a direct interaction of the circadian clock with plant immunity [35]. In recent studies, infection experiments with A. thaliana at different time points were performed analyzing a clock-mediated variation in resistance [36,37]. Plants in these experiments showed a decreased susceptibility when infected at dawn with a bacterial pathogen and a fungus, respectively. In addition, there are emerging evidences for a relationship between the nutrient status and circadian rhythm in plants [38]. For nitrate metabolism and during nitrate deficiency, respectively, interactions with the circadian clock could already be shown [39]. A number of key genes in metabolic pathways including the sulfur metabolism have been already reported as regulated in a circadian way in A. thaliana [40]. In a study by Hornbacher et al. [18] performed with B. napus diurnal oscillations of the expression of genes involved in the transport and reduction of sulfate as well as of GSH contents were shown, comparable to the oscillations of CCA1 expression. It was also demonstrated that GSLs display ultradian oscillations that were altered by the sulfur supply of the plants.
To investigate the degree of susceptibility of B. napus plants depending on the time point, plants were infected with V. longisporum at different time points of the day. Furthermore, the effect of different sulfur fertilizations on the infection of the plants was analyzed.

2. Materials and Methods

2.1. Plant Material and Growth Conditions

Seeds from the MSL-hybrid (Male Sterility Lembke) winter oilseed rape cultivar Genie were obtained from the Deutsche Saatveredelung AG (DSV) (Lippstadt, Germany; breeder: RAPOOL-Ring GmbH, Isernhagen, Germany). The cultivar has a good overall health, a higher GSL content in seeds in comparison to other cultivars from the DSV and an excellent resistance against aggressive stem canker triggering pathogens (Leptosphaeria maculans; L. biglobosa) (Sortenkatalog Winterraps 2012 RAPOOL). Plants were grown as described in Weese et al. [41] in climatic chambers equipped with ESC 300 software interface (Johnson Controls; Mannheim, Germany). The seeds needed 7 d under following settings to germinate: 12 h light, 22 °C, 70% humidity; 12 h night, 20 °C, 70% humidity; Photosynthetic Photon Flux Density (PPFD): 350 µmol m−2 s−1; lamp type CMT 360 LS/W/BH-E40) (Eye Lighting Europe Ltd., Uxbridge, United Kingdom). Sulfur-sufficient and deficient fertilization was obtained by using Blake-Kalff (BK) media [42] with 1 mM MgSO4 (+S) and 0.01 mM MgSO4 (−S), which are described in Weese et al. [41].

2.2. Verticillium longisporum Material, Growth and Cultivation

The V. longisporum strain VL43 WT (wild-type) was obtained from Prof. Dr. Andreas von Tiedemann (Department of Crop Sciences, Division of Plant Pathology and Crop Protection, Georg-August-University, Göttingen, Germany). The strain was first isolated from OSR in Mecklenburg/Germany in 1990 [43].
Two media from Difco™ were used for the cultivation of V. longisporum, which were prepared as specified by the manufacturer. In order to achieve a uniform mycelium formation, and the highest possible sporulation rate for V. longisporum, it was cultivated in two steps. For the first step of cultivation, 250 mL potato dextrose broth (PDB) was prepared and autoclaved. 900 μL of glycerol VL43 WT spore stock solution (1 × 10⁶ spores per ml) was added to the medium after cooling down and aluminum foil was used to keep the culture in the dark. After 2 to 3 weeks of shaking at 22 °C at 120 rpm, the mycelium was separated under sterile conditions with the aid of gaze (0.2 µm) and transferred to glass flasks with 250 mL of autoclaved Czapek-Dox broth (CDB). Cultures were wrapped with aluminum foil and were shaken at 22 °C and 110 rpm for 2 more weeks.

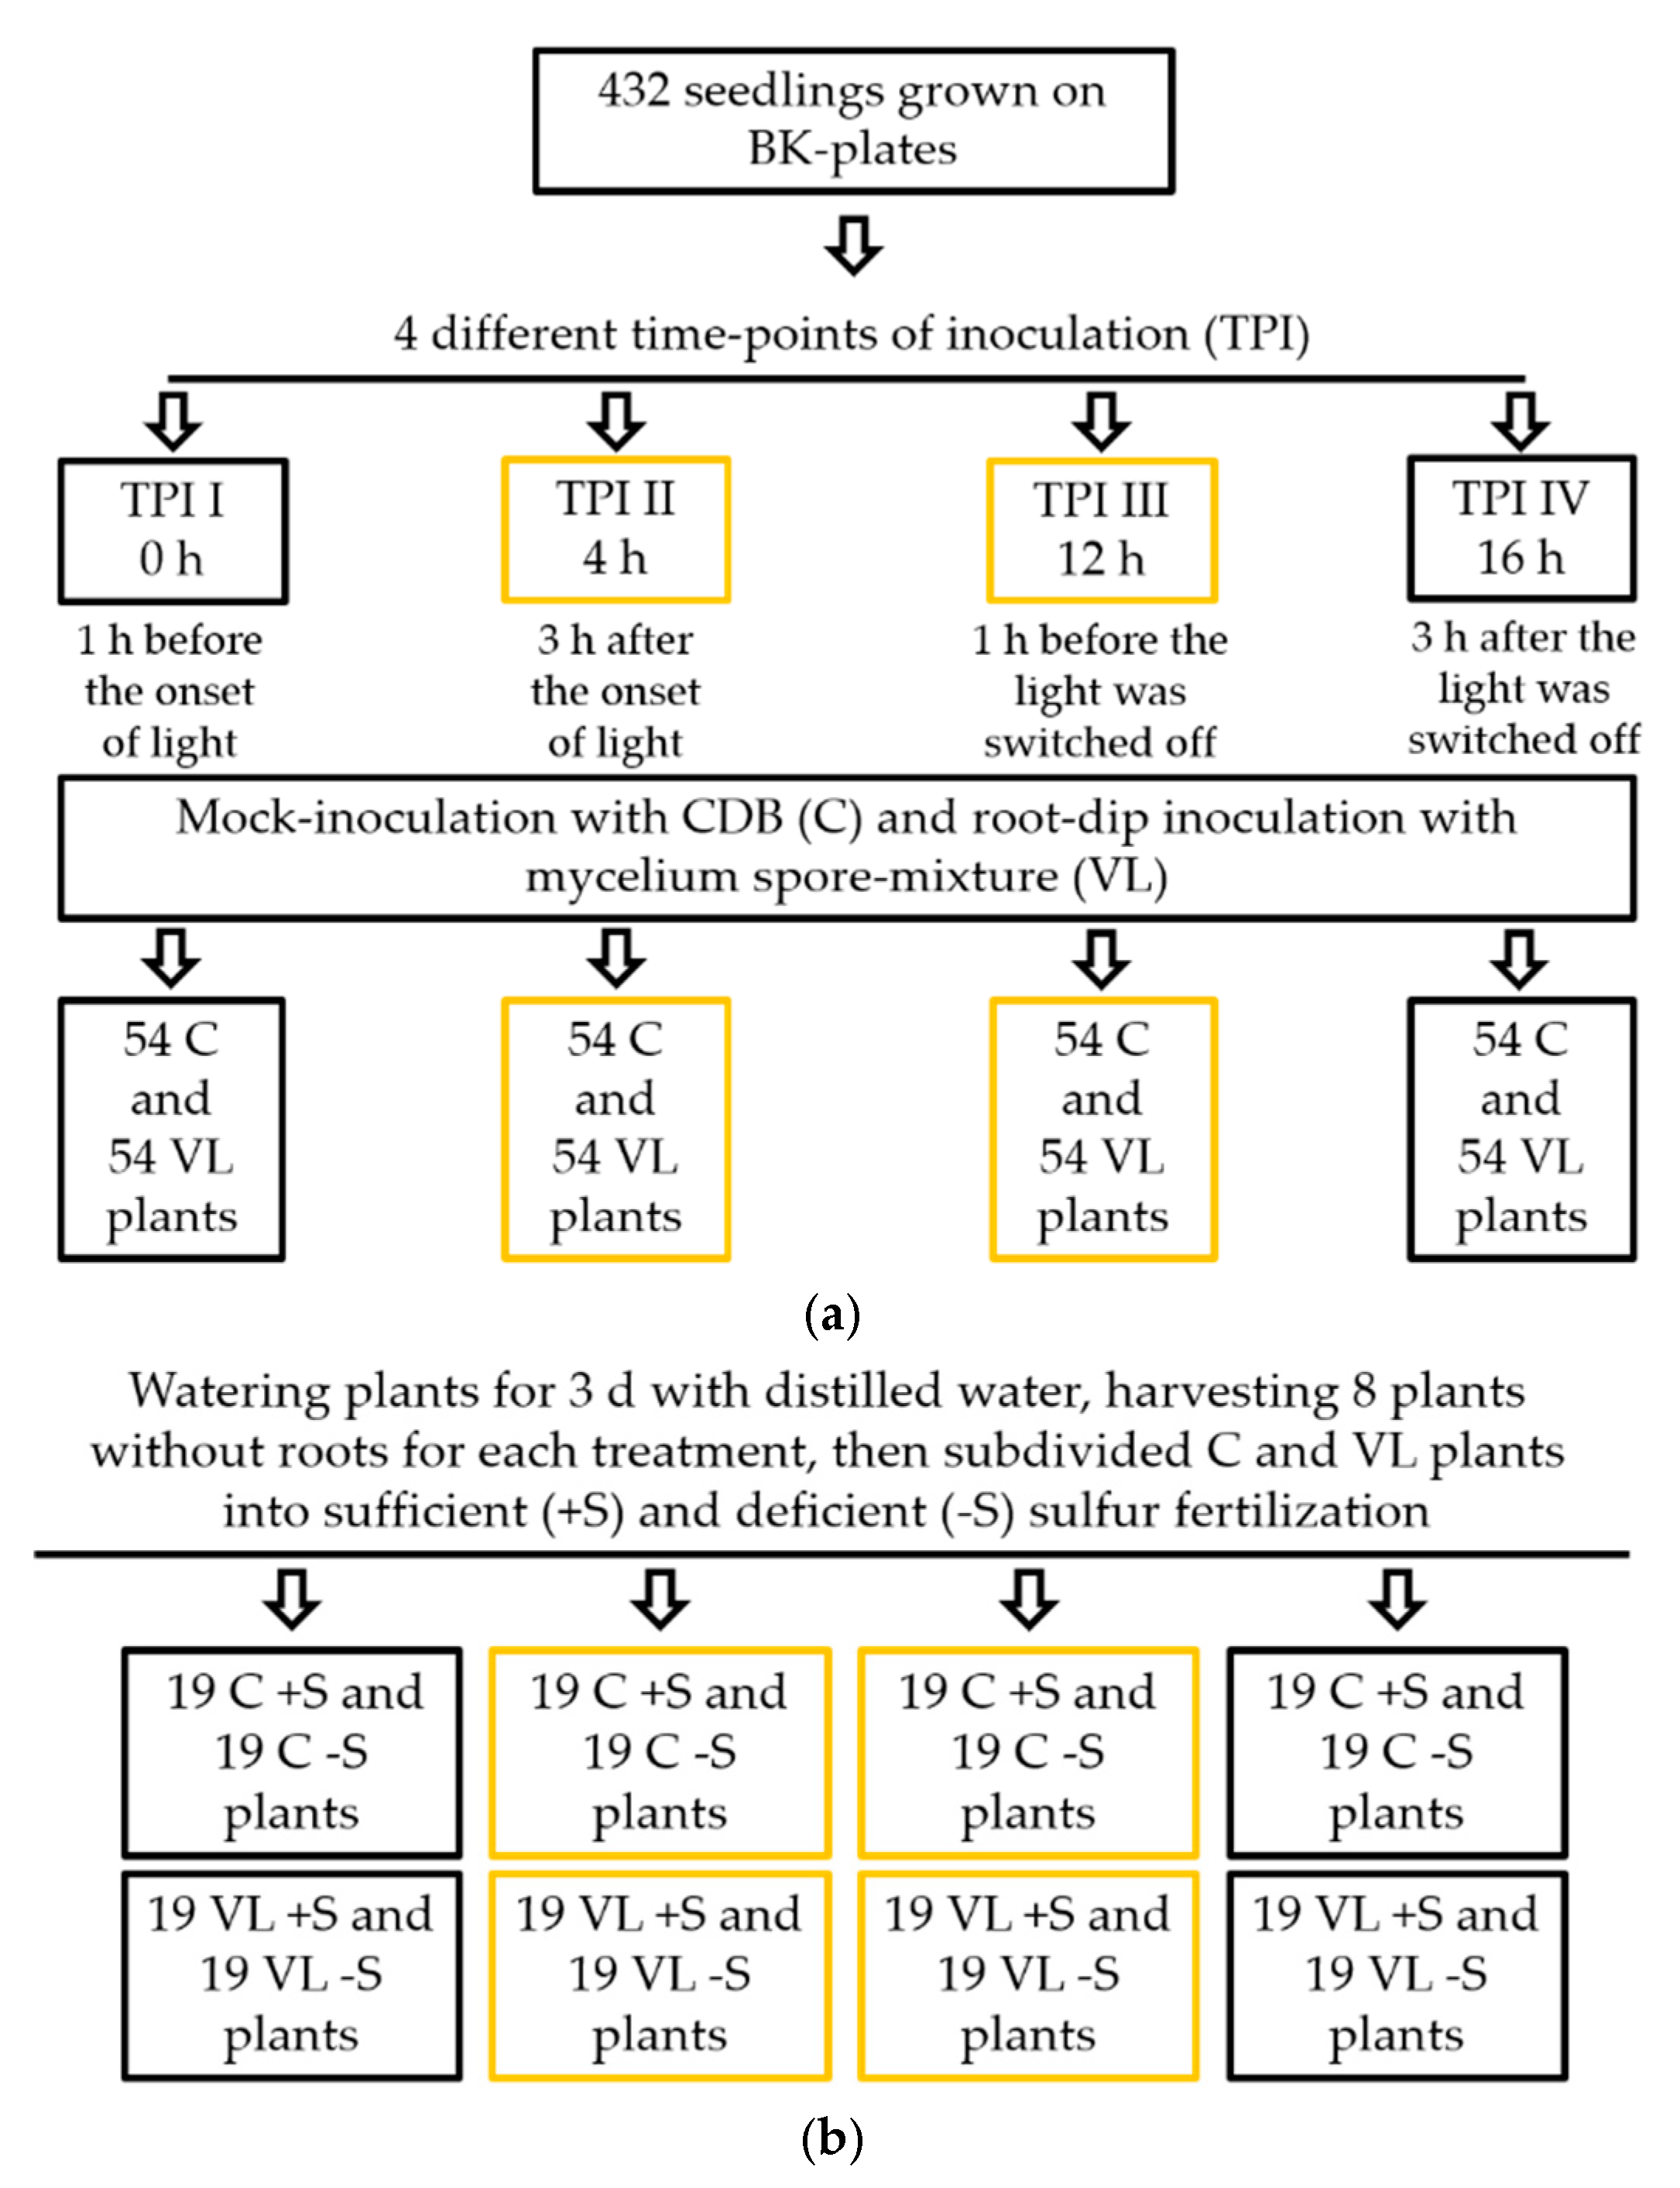
2.3. Inoculation Procedure of Brassica napus with Verticillium longisporum

Seven days old B. napus seedlings were mock-inoculated with CDB or root dip-inoculated for 45 min in a mycelium-spore mixture. In this study seedlings were infected at four different time points (Figure 1a) according to the harvesting time points chosen in Rumlow et al. [44]. Infection for the time points 0 h and 16 h were performed in the dark. All plants were watered for 3 d with distilled water. At 3 d post inoculation (dpi), above ground plant material of eight plants for each treatment was harvested and tested for the infection status using qPCR (Table 1). The remaining plants were then divided into sufficient (+S) and deficient (−S) sulfur-fertilized groups (Figure 1b). After 7 dpi and 14 dpi, above ground plant material of eight plants for each treatment was harvested and directly frozen into liquid nitrogen. Frozen samples were ground to a fine powder and stored at −80 °C until further analysis (Table 1). For histological examination, the hypocotyl of one plant for each treatment was harvested at 14 dpi and 21 dpi and initially conserved in formaldehyde-alcohol-acetic acid (FAA). This experiment was performed two times.

2.4. DNA Extraction

The DNeasy Plant Mini Kit (Qiagen, Hilden, Germany) was used for extraction of V. longisporum DNA from B. napus. The extraction was carried out as specified by the manufacturer with the following modifications. For each sample approx. 50 mg of ground and frozen plant material was used. After the incubation at 65 °C, tubes were placed on ice for about 1–2 min to cool down to room temperature (RT). Centrifugation steps were carried out at 16,100 g. In order to remove the residual EtOH from the spin column, the tubes were left open for approximately 1-2 min at RT prior to elution with 50 µL Buffer AE. The DNA concentration of the samples was determined photometrically at 260 nm with a Microplate-Reader (Synergy Mix, Multi-Mode Microplate Reader) (BioTek Instruments GmbH, Bad Friedrichshall, Germany).

2.5. Real-Time Quantitative PCR

The real-time quantitative polymerase chain reaction (qPCR) was used for the detection and quantification of V. longisporum DNA in B. napus. The qPCR works with two fluorescent dyes, contained in the used Platinum® SYBR® Green qPCR SuperMix UDG with ROX (Invitrogen™ by Thermo Fisher Scientific GmbH, Dreieich, Germany). For the samples, a master mix without template DNA was prepared. 18 µL of master mix were placed in the 96-well plates (white; without frame; 0.2 mL, Sarstedt, Nümbrecht, Germany), to which 2 µL diluted sample DNA (final concentration between 0.5–1 ng µL−1), standard DNA of V. longisporum or pure H2O (negative controls) were pipetted. For the standard series 1 ng µL 1− standard DNA was prepared from extracted DNA of pure V. longisporum VL43 WT culture (standard series from 1 ng VL-DNA µL 1− to approx. 1 pg VL-DNA µL−1). For this study the primers OLG70 (CAGCGAAACGCGATATGTAG) and OLG71 (GGCTTGTAGGGGGTTTAGA) from Eynck et al. [45] were selected. The primers were adapted to the used qPCR program by base modification (OLG70: CGCAGCGAAACGCGATATGTAG; OLG71: CGGGCTTGTAGGGGGTTTAGA). The qPCR analysis was performed with the 7300 Real Time System (Applied Biosystems by Thermo Fisher Scientific, CA, USA). The used software was Abi 7300 System SDS (Applied Biosystems by Thermo Fisher Scientific). The qPCR program consisted of four stages starting with a 50 °C step for 2 min. PCR amplification was carried out using an initial denaturation step for 2 min at 95 °C, which was followed by 40 reaction cycles consisting of a 15 s denaturation step at 95 °C and an annealing and elongation step for 1 min at 60 °C. To verify amplification of the specific target DNA, a melting curve analysis was included. Additionally, the PCR product was checked by agarose gel electrophoresis for correct size. By using the Ct values of the individual samples in the logarithmic straight-line equation of a standard series with samples of defined concentration, the concentration of the examined DNA sequence can be calculated.

2.6. Elemental Analysis and Analysis of Soluble Thiol Compounds

The analysis of elements was carried out as described in Weese et al. [41]. The determination of thiols was done according to Riemenschneider et al. [46].

2.7. Analysis of Glucosinolates

The analysis of GSLs was performed as described in Hornbacher et al. [18] with one modification. The content of GSLs was determined using 500–700 mg of ground and frozen plant material for the extraction step.

2.8. Histological Analysis

For histological examination the hypocotyls were preserved in FAA (70% EtOH, 100% acetic acid, 37% formaldehyde; 18:1:1, v/v/v) and then dehydrated in an ascending alcohol series (70% EtOH for 60 min; 80%, 90% and 99% EtOH for each 120 min). Next, 80% EtOH was mixed with Eosin Y (Eosin yellowish) (Carl Roth GmbH + Co. KG, Karlsruhe, Germany). The dye slightly stains the hypocotyl pieces without affecting the subsequent staining method and thus facilitates the orientation during embedding. The samples were embedded with Technovit ® 7100 (Kulzer GmbH, Hanau, Germany). The pre-infiltration, infiltration and polymerization were carried out as specified by the manufacturer with the following modifications. The infiltration step was done for about 18 h. The hardening of the samples at the polymerization step required about 24 h in the embedding moldings (Polyethylene Molding Cup Trays, 6 × 8 × 5 mm hexagon; nine cavities) (Polysciences Europe GmbH, Hirschberg an der Bergstrasse, Germany). Subsequently, the hardened resin blocks were taken out of the molding cups and dried for approximately further 48 h at RT before they were cut. The cross sections (25 µm thick) of the embedded hypocotyls were made with a rotary microtome (R. Jung AG 1960, Heidelberg, Germany) using a d-blade (16 cm steel-blade, d-profile) (Leica Mikrosysteme Vertrieb GmbH, Wetzlar, Germany). The cross sections were threaded onto slides wetted with distilled water. On each slide eight cross sections were placed in two rows. The slides were dried at 140 °C on a heating plate for histology slides (HB 300) (Gestigkeit Harry GmbH, Düsseldorf, Germany) for 1–2 h. In order to detect vascular occlusions hypocotyl cross sections were stained with 0.05% (w/v) toluidine blue (Sigma-Aldrich Chemie GmbH, Taufkirchen, Germany) for 10 min at 60 °C [47]. The slides were washed with distilled water and then dried at 100 °C for 1 h. The cross sections were mounted with Eukitt® (Sigma-Aldrich Chemie GmbH) for permanent conservation. Images of samples were taken with a light microscope in bright field (Microscope: CX31; Camera: U-CMA D3) (Olympus Europa SE & Co. KG, Hamburg, Germany) (Software: NIS Elements, Version 4.50 64-bit) (Nikon GmbH, Düsseldorf, Germany). From each hypocotyl sample at least two slides with each eight cross sections were prepared. For the evaluation microscopic images of five cross sections were made and the following parameters have been defined: number of total tracheas in the xylem, number of occlusions in the mid area of the xylem (mXy) and number of occlusions in the periphery of the xylem (pXy). Figure 2a shows the distribution of different tissue types in a cross section of a hypocotyl of B. napus, starting from the middle with pith (Pi), xylem (Xy), cambium (Cam) and phloem (Ph). Figure 2b shows the definition of the counting range of occlusions. This area had to be redefined for each microscopic image. From the Pi to half of the Xy became the mXy counting region, the other half the pXy counting region. Counting was performed with help of the open source image processing package “Fiji” [48].

2.9. Statistical Analysis

Glucosinolate concentrations as well as cysteine and glutathione concentrations were log-transformed before analysis due to finding right skewed distributions and variance increasing with mean. The transformed data were analyzed in general linear models with four factors and all two-way interactions between the four factors. Based on the fitted models, analysis of variance was performed to test the significance of main effects and interactions and Tukey tests for the model-based means of factor TPI were performed jointly across all other factor levels and separately for VL-infected and mock-infected groups.
To analyze the histological data of occlusions in the xylem vessels of infected plants, the counted total number of mid occlusions among the total number of tracheae per plant was analyzed in a generalized linear model with logit link and assumption of over dispersed binomial data [49]. The model contained main effects for the three factors dpi, TPI and different sulfur supply and their two-way interactions. After model fit, F-tests in analysis of deviance were used to test the significance of these effects. Data of the elements sulfur, calcium, potassium and iron were analyzed without transformation in a model with four factors and their two-way interactions. Based on the fitted Modell ANOVA-tables and multiple comparisons of model-based means were performed (R package emmeans).
Log-transformed qPCR data were analyzed using a three-factorial model with effects dpi (3, 7 and 14) and TPI (I, II, III and IV) crossed, including an interaction term and effect of sulfur supply nested in effect of dpi. Based on the fitted model, analysis of variance tables was computed and multiple comparisons were performed using R package emmeans. Analysis was performed in R 3.6.1 [49] using the add-on package emmeans (version 1.4) [50] for model-based comparisons of means. In order to verify the success of the infection, a qPCR analysis was carried out at 3 dpi, afterwards the fertilization began with sufficient and deficient sulfur supply. Hence, it seems to be useful to include the infection status, from which the different fertilization began, in comparison with the results of the elemental and metabolite analysis from 7 and 14 dpi. However, the two runs of the experiment proceeded differently with respect to the qPCR results, which means that the VL-infected groups are differentially infected, resulting in varying responses of host plants. Therefore, the two experiments had to be analyzed statistically separately. The results of one experiment are analyzed and discussed below as an example. The data of the other experiment can be found in the Supplement data (Tables S1–S7; Figures S1–S3).

3. Results

3.1. Detection and Verification of the Infection with V. longisporum in B. napus

In order to investigate spreading of V. longisporum after infection in the plant, qPCR analysis was performed with samples collected at 3, 7 and 14 dpi using primers for the amplification of ITS. The amount of V. longisporum (VL) DNA was calculated in VL DNA g−1 fresh weight (FW) of the plant material. Samples of 3 dpi were not differentially fertilized yet, therefore, the data shows the mean of two biological replicates. Only the data of VL-infected plants are shown in Table 2 because control samples showed a maximum of 5% of the values of infected plants, or the amount of the VL-DNA was below the limit of detection or below limit of quantification, respectively (data not shown).
At 3 dpi the content of VL-DNA was the highest in plants of TPI IV compared to TPI I in both groups that were not fertilized differently at that time (p = 0.002). At 7 dpi the amount of VL-DNA was higher in VL-infected +S (54%) and −S (43%) groups at TPI I compared to the plants of 3 dpi. The contents in plants of TPI II-IV were lower in both VL-infected groups compared to 3 dpi. At 14 dpi the content of VL-DNA was lower in both VL-infected groups at all TPIs compared to plants at 7 dpi. Most importantly, the contents of VL-infected +S plants were significantly lower compared to −S plants. In summary, significant effects for TPI depending on dpi (p = 0.01) and significant effects for sulfur supply depending on dpi (p = 0.01) were observed.

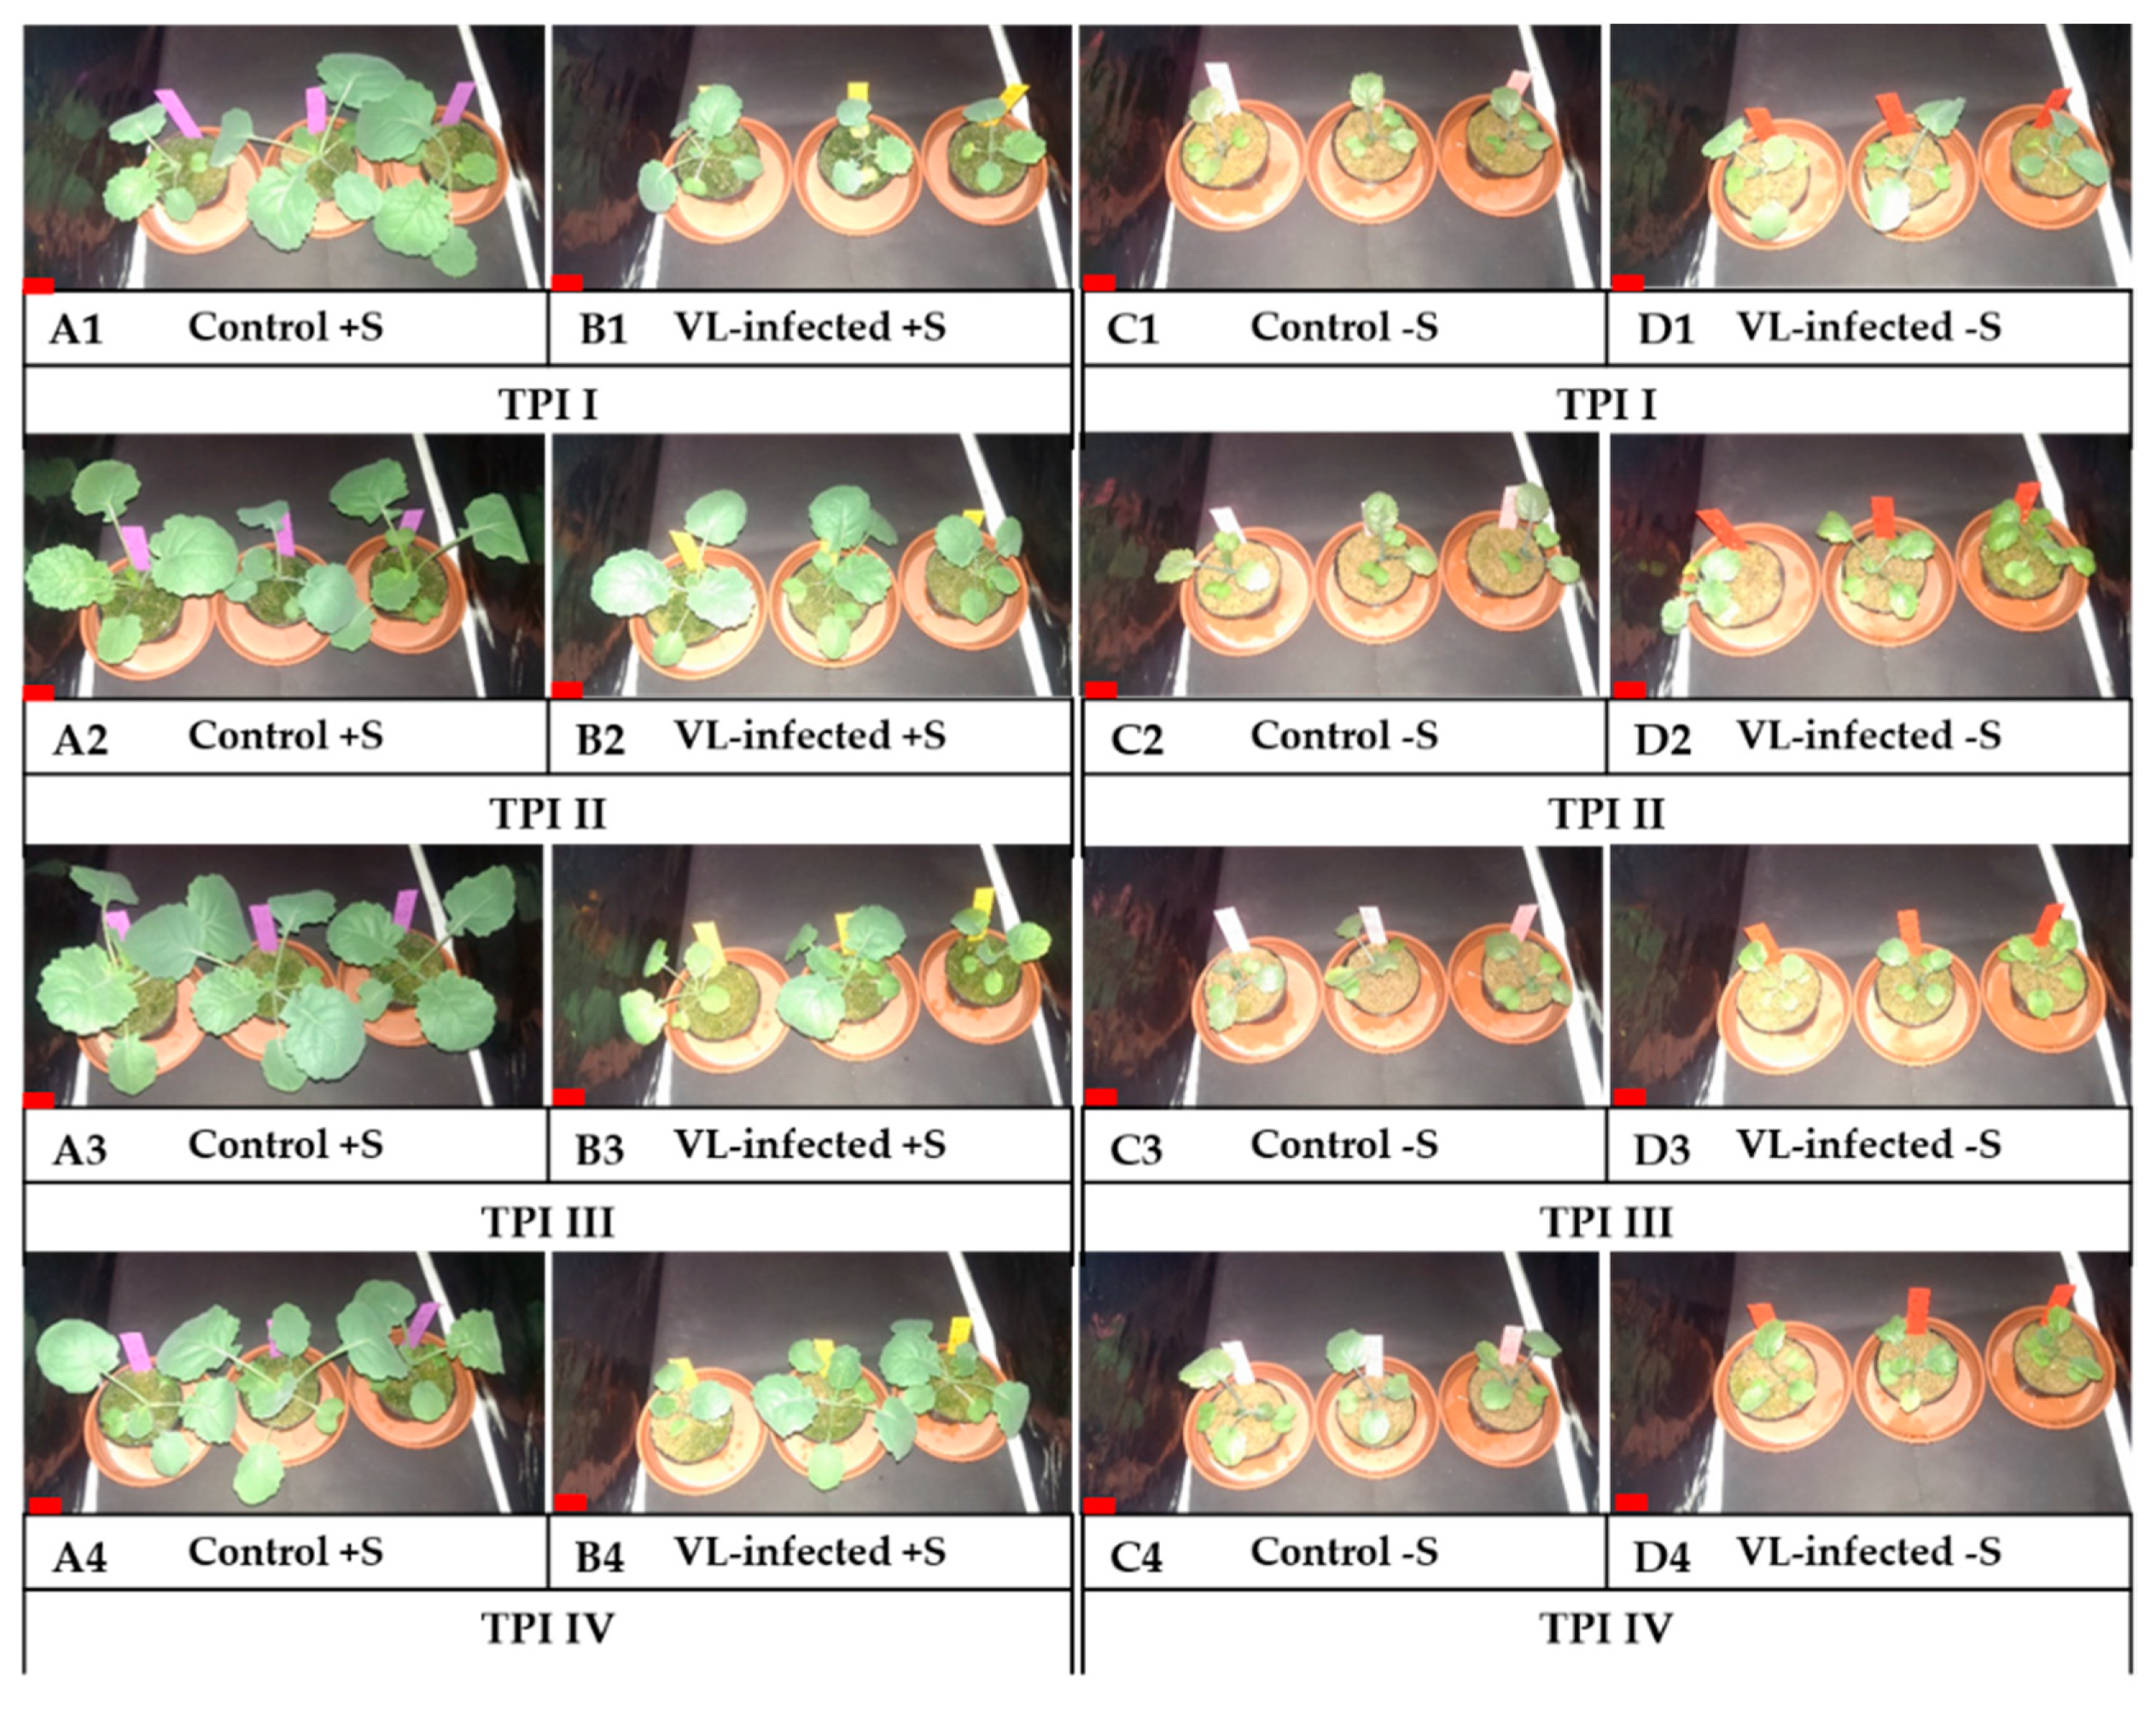
3.2. Stunting of B. napus Plants Infected with the V. longisporum Strain VL43

Three plants of all treatments were selected and photographically documented at 14 dpi. VL-infected plants, which were fertilized with sufficient sulfur were smaller compared to non-infected control plants at 14 dpi (Figure 3; A1–A4: control plants; B1–B4: VL-infected plants).
The non-infected and VL-infected plants, which were cultivated under sulfur-limited conditions showed a decreased growth rate manifested in lower plant height, smaller leaves and overall stunting (Figure 3). Leaves were partially chlorotic and purple in color, with the leaf surface feeling leathery and, in some areas, slightly broken off. In addition, the leaf margin of some plants bulged inward or outward. Overall, infection itself, but not the TPI, had an effect on the plant’s appearance.

3.3. Levels of Indolic, Aliphatic and Benzylic GSLs in Mock-Treated and Plants Infected with V. longisporum at Different TPIs and Under Different Sulfur Supplies

As GSLs are known to be part of the plant’s response to pathogens, contents of GSLs in samples of 7 dpi and 14 dpi were analyzed by HPLC. Overall, contents of all GSLs were lower in sulfur-deficient plants compared to sulfur-sufficient plants at all TPIs and changes became more pronounced at 14 dpi (Table 3). Contents of glucobrassicin were higher in VL-infected plants at all TPIs compared to non-infected plants. Even at 14 dpi when glucobrassicin contents were much lower compared to 7 dpi in non-infected plants, infected plants showed higher contents compared to non-infected plants (Table 3). Small changes were observed in neoglucobrassicin contents between the TPIs, with contents being higher in TPI IV compared to TPI I at 7 dpi in plants of both fertilization groups. Lower contents of neoglucobrassicin were observed at 14 dpi in plants of all groups, but no major differences were observed between infected and non-infected sulfur-sufficient plants.
Sulfur-deficient and infected plants on the other hand showed higher contents compared to non-infected sulfur-deficient plants. Sufficiently sulfur-fertilized and infected plants showed higher contents of 4-hydroxyglucobrassicin at 7 dpi compared to non-infected controls but only in sulfur-sufficient plants contents were higher at TPI VI. Contents were lower in infected and sulfur-deficient plants, compared to non-infected and sulfur-deficient plants. At 14 dpi, contents of 4-hydroxyglucobrassicin were higher in sulfur-sufficient non-infected plants, but were lower in all other groups compared to 7 dpi. The differences between 7 and 14 dpi (p = 0.00002) and the effect of different sulfur supply (p = 0.00005) were significant. Overall, the entirety of iGSLs showed significant differences between control and VL-infected plants (p = 0.00003).
Contents of aGSLs were also lower in sulfur-deficient plants compared to sulfur-sufficient plants, which became more pronounced at 14 dpi compared to 7 dpi (Table 4). Infected and sulfur-sufficient plants showed higher contents of all aGSL at 7 dpi compared to non-infected plants, whereas at 14 dpi the contents of aGSL where only higher in TPI I in infected sulfur-deficient plants compared to non-infected plants.
At 14 dpi, contents of aGSLs were lower in infected and sulfur-sufficient plants infected at TPI II to TPI IV compared to infected sulfur-sufficient plants harvested at 7dpi infected at the same TPIs. This effect was less pronounced in contents of glucoalyssin, glucoraphanin and glucobrassicanapin at TPI I. Contents of progoitrin were consistently higher in infected sulfur-deficient plants at 14 dpi compared to non-infected plants, whereas contents of other aGSLs were lower with a few exceptions regarding the TPIs. Overall, aGSLs showed a significant effect in terms of dpi on the average over the other factors (p = 0.0004) and significant differences between control and VL-infected plants (p = 0.02).
Contents of gluconasturtiin were higher in all infected plants, when compared to non-infected plants, even regardless of sulfur-fertilization, or TPIs (Table 5). Highest contents were observed in infected and sulfur-sufficient plants. Like other GSLs, gluconasturtiin contents were lower at 14 dpi in sulfur-deficient non-infected plants, when compared to 7 dpi, but levels were up to 5 times higher in sulfur-deficient and infected plants, when compared to non-infected plants. Infected and sulfur-sufficient plants at 14 dpi had lower contents compared to plants harvested at 7 dpi from the same group, but still had higher contents compared to non-infected plants.
Overall, contents of glucobrassicin as well as gluconasturtiin were always higher in infected plants, when compared to non-infected plants. Although sulfur-deficiency led to lower contents of these GSLs in non-infected and infected plants, amounts were still higher in the latter ones. On the other hand, contents of aGSLs were observed to be lowered in a higher manner by sulfur-deficiency compared to the other GSLs analyzed. Infected plants showed only higher contents of aGSLs at all TPIs at 7 dpi and when supplied with sufficient sulfur.
The contents within the TPIs in control +S- and VL-infected -S-groups were nearly similar, while contents in control −S-groups were overall the lowest. The differences in the levels of gluconasturtiin in control and VL-infected plants were significant (p = 0.003).

3.4. Levels of Cysteine and Glutathione

Since the cysteine pool is essential for sulfur metabolism and is used to synthesize sulfur- containing secondary metabolites, its contents were analyzed alongside with GSH, which is used for the synthesis of secondary metabolites, for detoxification purposes and as an antioxidant.
Contents of cysteine as well as GSH were severely lower in sulfur-deficient plants compared to sulfur-sufficient plants. The effects became more pronounced in plants harvested at 14 dpi (Table 6).
Sufficiently sulfur-fertilized and infected plants showed slightly higher contents of cysteine, when compared to non-infected plants only at 7 dpi. Infected sulfur-deficient plants had higher contents of cysteine at TPI II - TPI IV compared to non-infected plants, which shifted in plants harvested at 14 dpi, where contents were higher at all TPIs except for TPI II. The infection had no clear effects on the content of GSH in sulfur-sufficient plants at 7 dpi, whereas at 14 dpi contents were much higher in infected plants, compared to non-infected ones. Even though sulfur deficiency led to lower contents of GSH at 7 dpi and most notably at 14 dpi, contents were much higher in infected plants, compared to non-infected plants at both dpis. Levels of GSH showed a significant difference when the control and VL-infected plants were compared (p = 0.002).

3.5. Levels of Sulfur, Calcium, Potassium and Iron

The amounts of sulfur (Table 7), calcium, potassium and iron (Table S8) were analyzed in control and VL-infected samples of 7 and 14 dpi with ICP-OES to get an insight on the effects of infection and sulfur deficiency on the contents of other essential elements.
Reduced amounts of sulfur in the nutrient solution led to lower levels of sulfur in both non-infected and infected plants, with contents being higher in the latter ones compared to non-infected plants. Sulfur contents were lower in sulfur-deficient plants at 14 dpi compared to plants at 7 dpi (Table 7). The infection had no clear effect on sulfur contents in plants supplied with sufficient sulfur. The difference in the sulfur content between 7 and 14 dpi was significant (p = 0.0001). The difference in the potassium content between 7 and 14 dpi was significant (p = 0.003). Comparing 7 and 14 dpi with control- and VL-infected plants, the differences in iron contents were significant (p = 0.006).

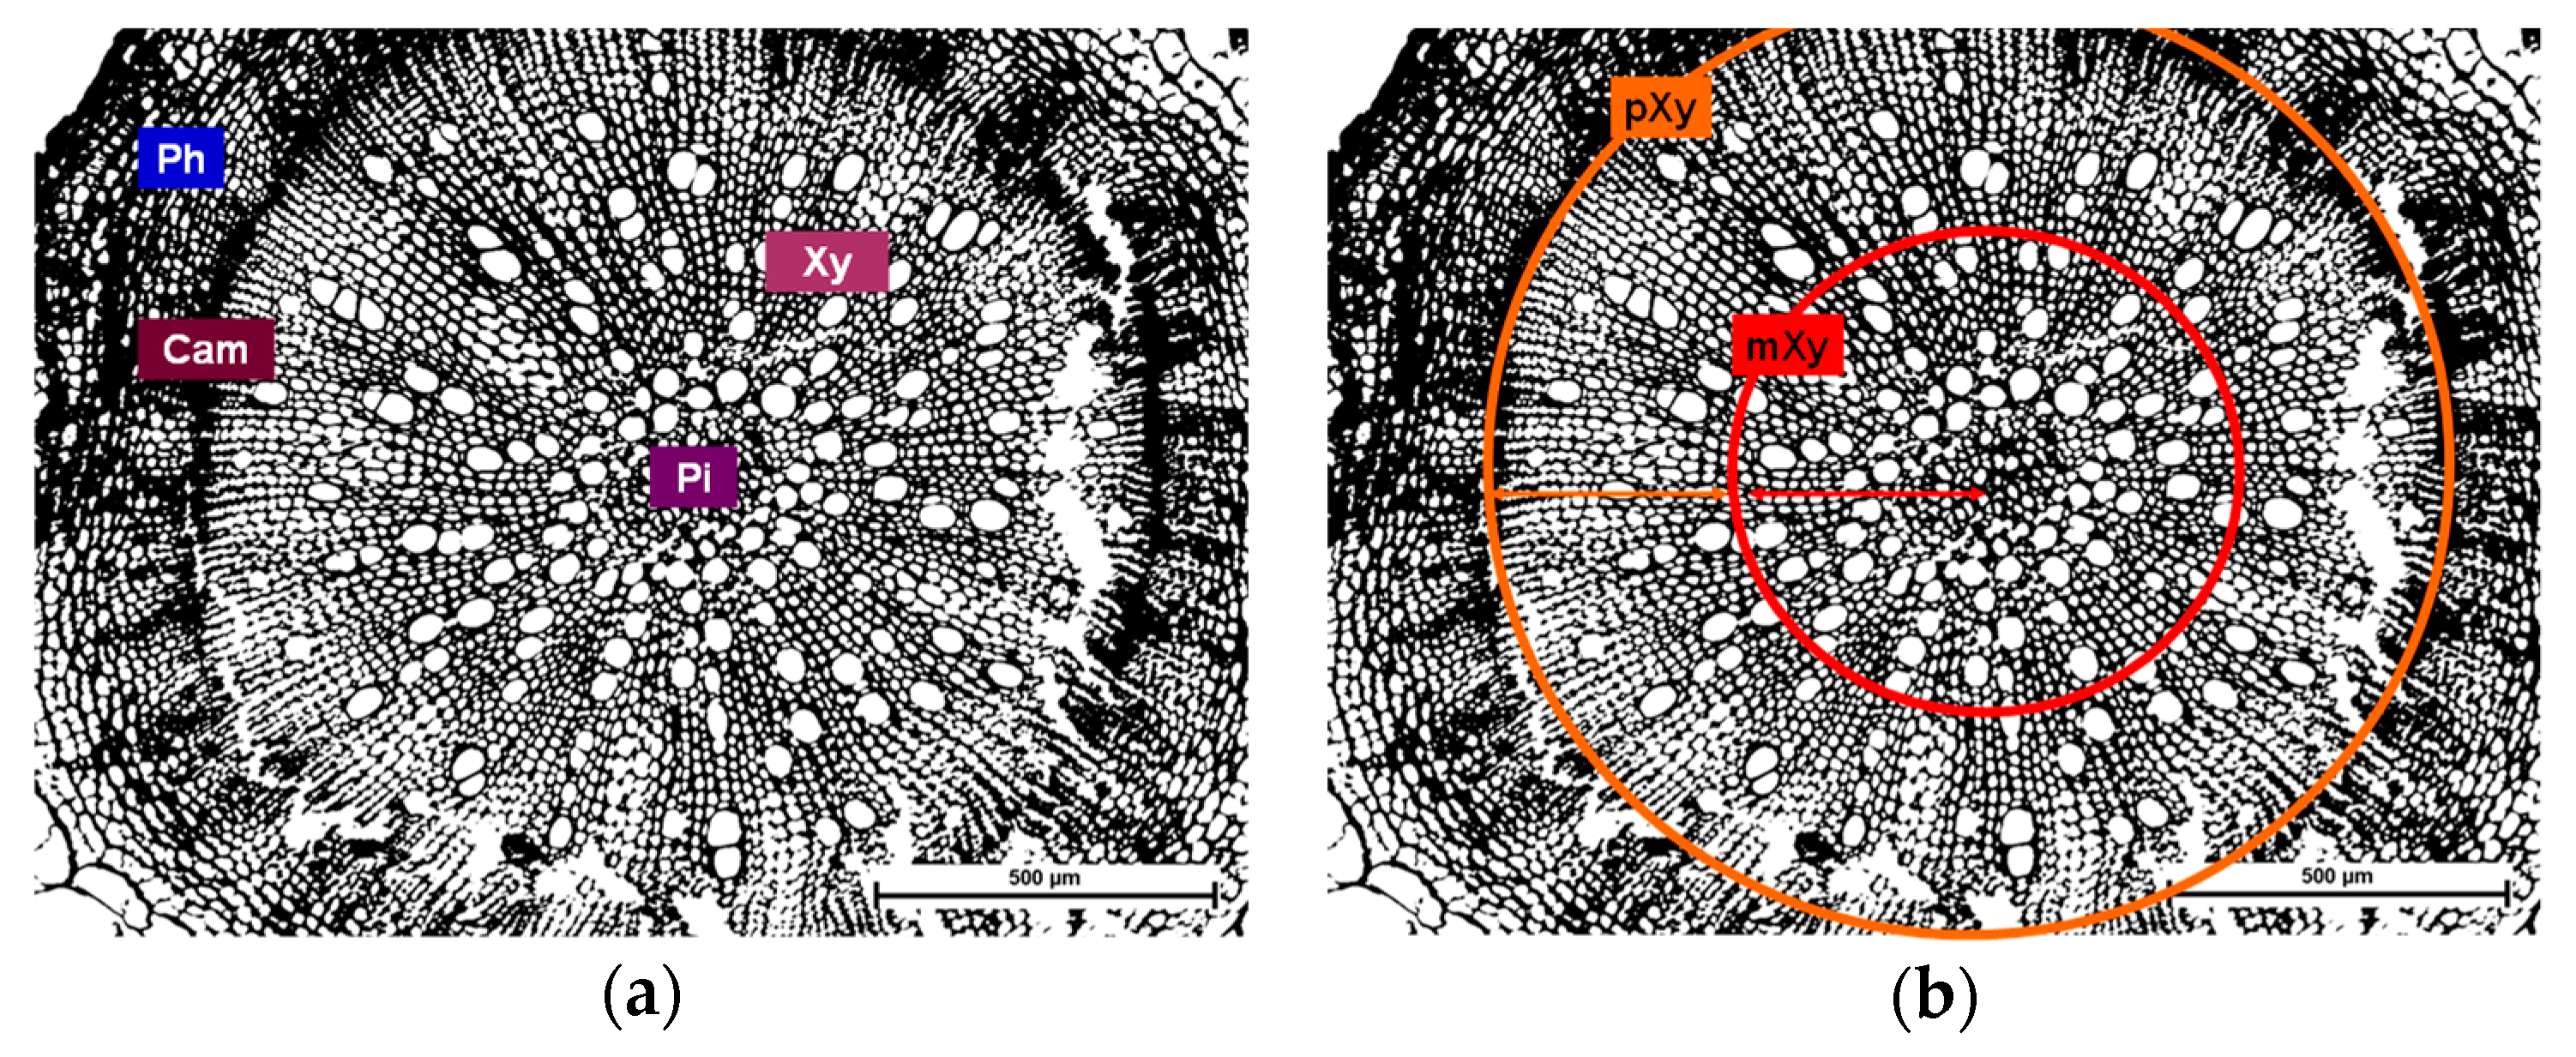
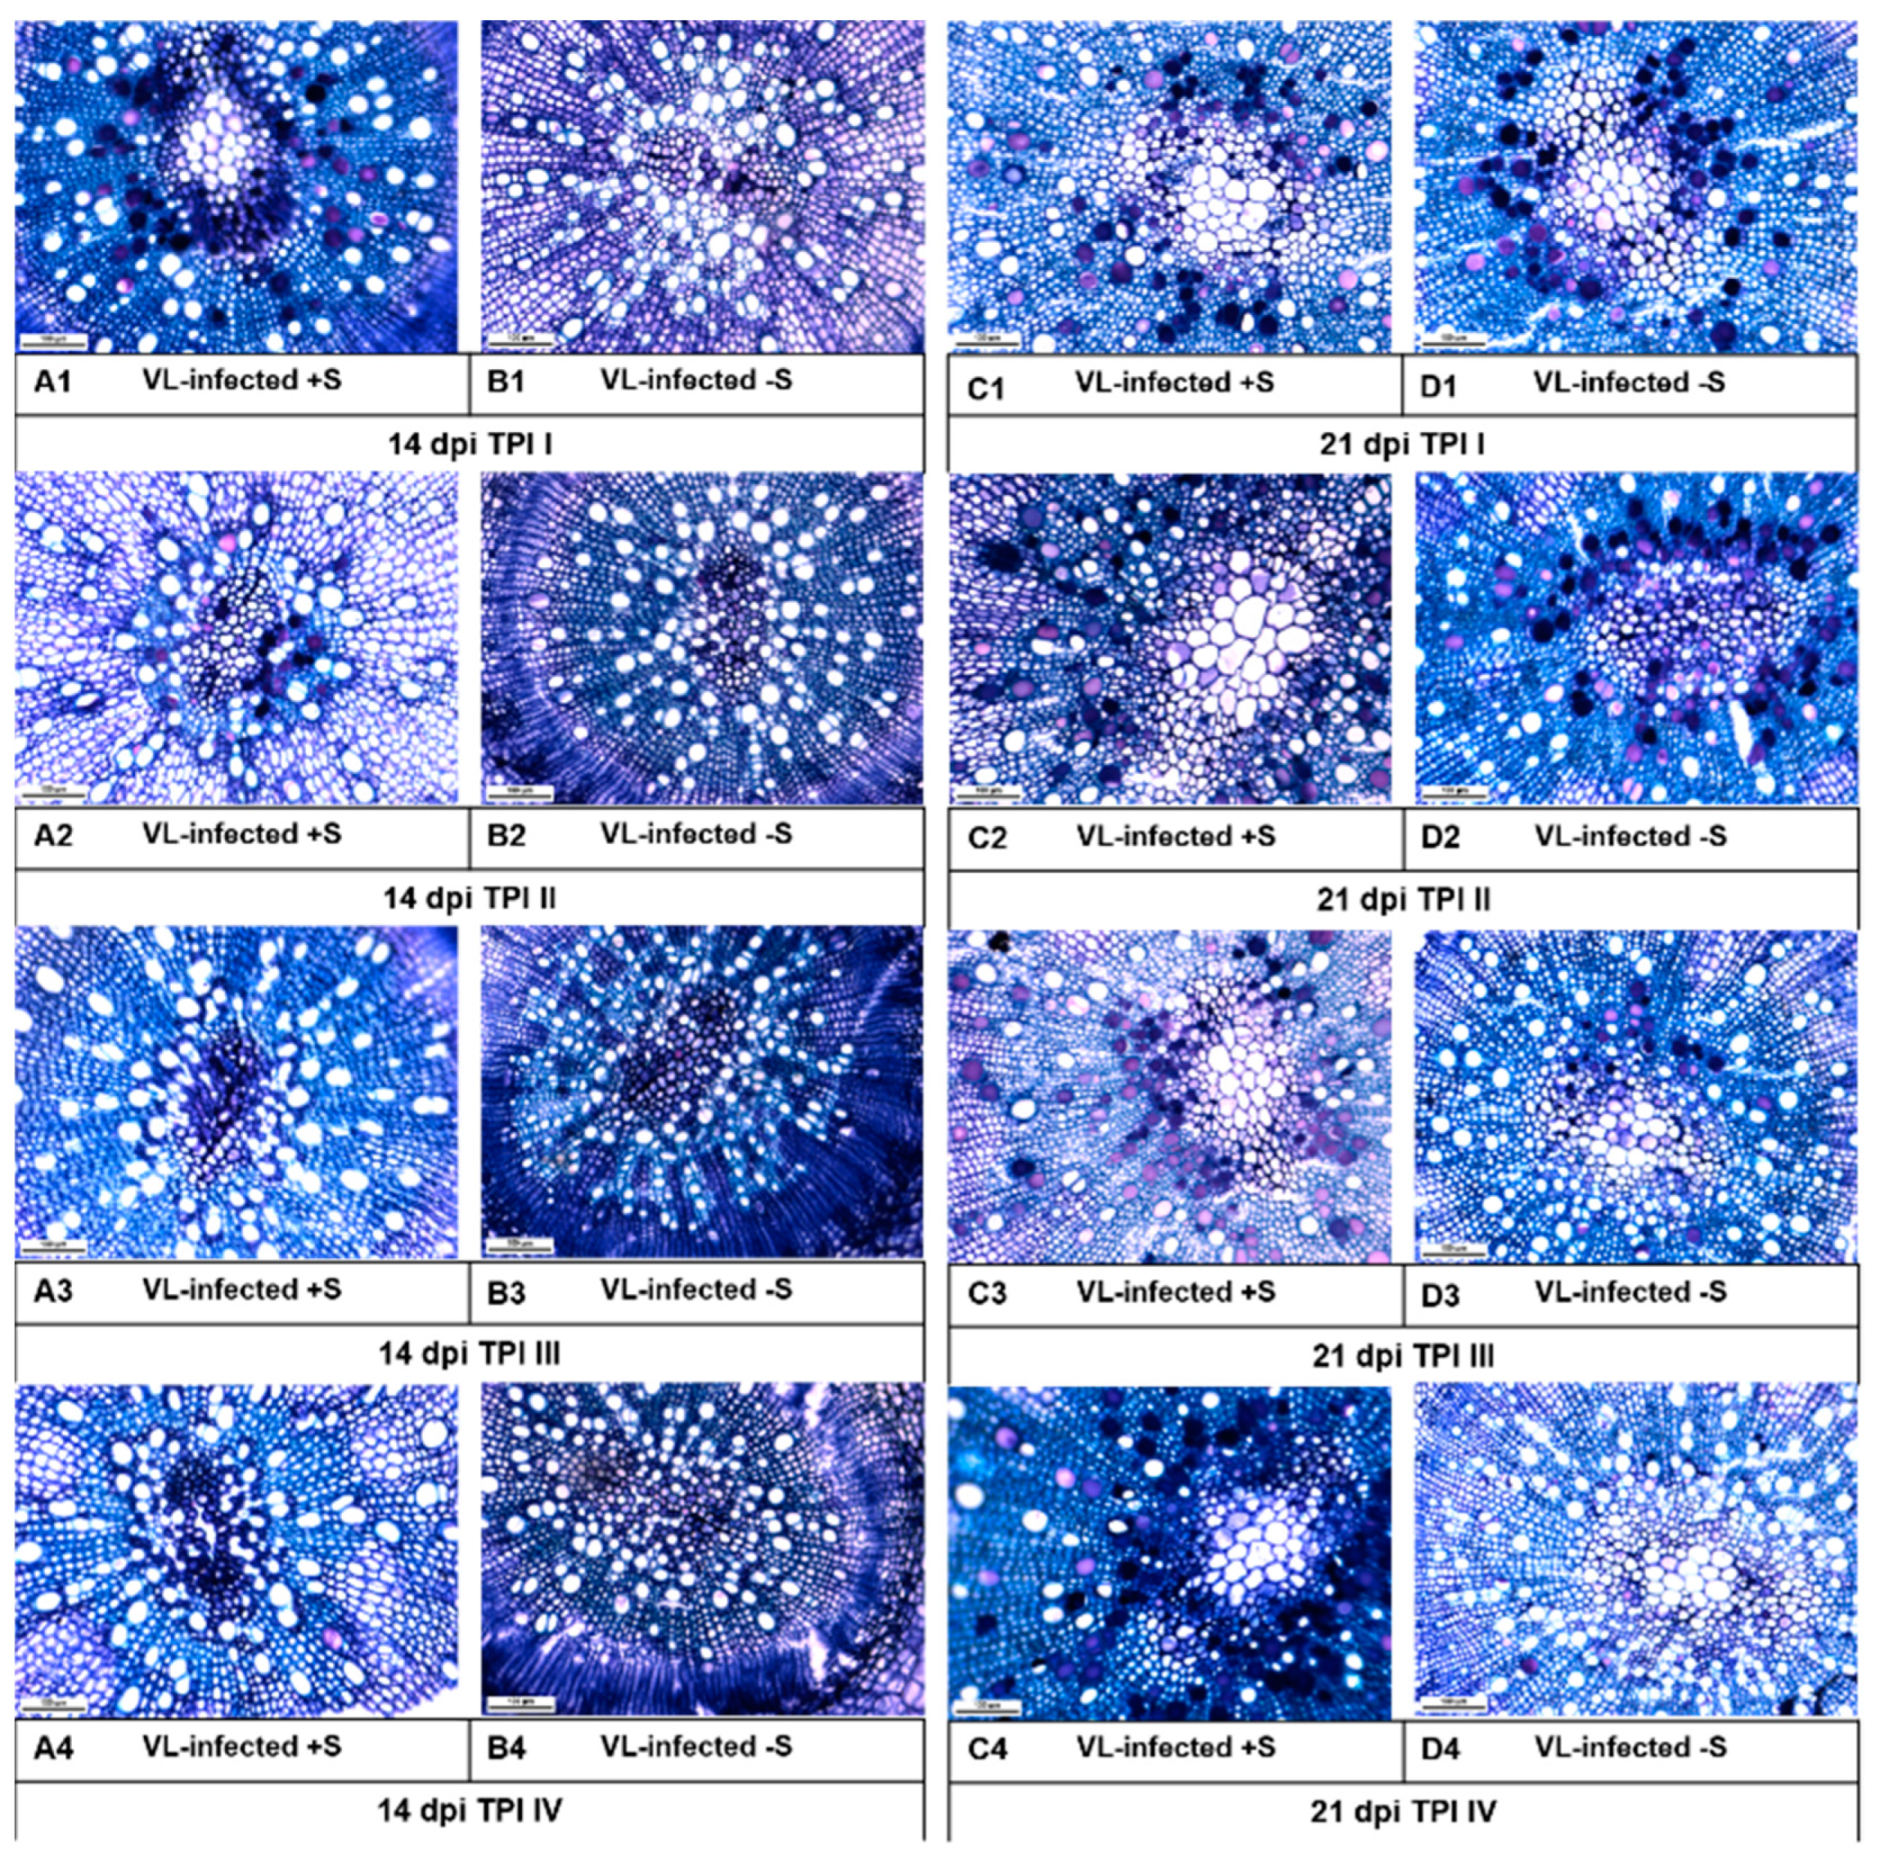
3.6. The Influence of Different TPIs and Different Sulfur Supply on the Occurrence of Occlusions in the Xylem of B. napus Infected with V. longisporumSstrain VL43

It is known that in B. napus the formation of blockages in the xylem is induced to protect against the spread of V. longisporum, whereby resistant plants are characterized by a significantly stronger appearance of occlusions in the tracheae vessel elements [10,51]. Based on these observations, histological sections of hypocotyls were prepared in order to establish a possible correlation between the occurrence and severity of occlusions within TPIs and different sulfur fertilization conditions. Hypocotyls of plants were harvested at 14 and 21 dpi and cross sections of control and VL-infected plants were stained with toluidine blue. Figure 4 shows a representative selection of microscopic pictures of hypocotyls of VL-infected plants grown under sufficient and deficient sulfur supply from 14 and 21 dpi. Control plants occasionally showed occlusions in the peripheral area and were therefore not listed in the statistics or microscopic pictures (Figure S4).
The number of occlusions in tracheae of the mid area of the xylem was counted and calculated as the percentage of total tracheae in the pictured area (Table 8).
Infected plants fertilized with sufficient sulfur showed much more occlusions compared to sulfur-deficient plants at 7 dpi. The amount of occlusions was the highest at TPI I and was lower the later the plants were infected. The TPI with the least occlusions found in infected plants was at TPI IV. This pattern was the same in sulfur-sufficient plants harvested at 21 dpi and occurred in sulfur-deficient plants as well. The amount of occlusions was significantly higher in infected sulfur-deficient plants at 21 dpi when compared to 7 dpi at all TPIs. The number of occlusions differed significantly between TPI I and TPI III, as well as TPI I and TPI IV (p = 0.03). The difference between 14 and 21 dpi was also significant (p = 0.0005).

4. Discussion

This work focused on the question whether the susceptibility of B. napus to an infection with V. longisporum differs over the course of the day. In addition, the influence of sufficient and deficient sulfur fertilization on the course of the infection was of interest. In order to gain insight into this relation, plants were inoculated at different TPIs with a mycelium-spore mixture of V. longisporum and were subsequently fertilized with different sulfur supplies (+S/−S). In order to detect an infection with V. longisporum, the DNA content of the pathogen was carried out using qPCR analysis (Table 1). In case of artificial inoculation under laboratory conditions, there is no resting phase for the host plant as well as for the fungus, therefore colonization of the vascular system is probably more rapid [52] and disease symptoms are different compared to plants growing in field conditions [53]. Using the entire plant (without roots) shows a more realistic picture of the state of infection of B. napus compared to analysis of only the hypocotyls of the plant. By activating defense mechanisms in B. napus it is possible that the spread of V. longisporum is slowed down or even stopped. Since the DNA extraction procedure extracts DNA from living and dead tissue of the fungus, analysis performed only with hypocotyls would reflect an inaccurate picture of the severity of the infection.
A special focus was put onto the role of GSLs in pathogen defense mechanisms, as previous studies unveiled their positive effects against the infection with V. longisporum [5,54,55,56].

4.1. Higher Sulfur-Containing Compound Levels in Infected Plants–Battle (f)or Survival?

Verticillium longisporum-infected and sulfur-deficient plants showed higher sulfur levels at all TPIs compared to non-infected sulfur-deficient plants (Table 7). The difference in the uptake of sulfur by the plants became even more pronounced at 14 dpi compared to 7 dpi, indicating that sulfur is taken up at a higher rate by infected plants, compared to non-infected controls. Similar results were obtained by Weese et al. [41], where B. napus plants infected with V. longisporum also contained more sulfur compared to non-infected controls regardless of the sulfur supply. Verticillium longisporum invades the amino acid-poor xylem, but since it needs them to thrive and grow to the upper parts of the plants the transcription factor VlCPC1 involved in the regulation of amino acid biosynthesis is induced [57]. Enhanced synthesis might therefore trigger uptake of elements essential to keep up with higher rates of amino acid synthesis.
The higher uptake of sulfur is reflected in the contents of the sulfur-containing amino acid cysteine in infected sulfur-sufficient plants at 7 dpi. Accordingly, sulfur fertilization of oilseed rape was shown to significantly enhance contents of sulfur, cysteine and glutathione in a field experiment [58]. Additionally, a positive correlation between cysteine contents and the cysteine degrading enzyme L-cysteine desulfhydrase releasing H2S, which is toxic to fungi, were observed in this study.
Similar levels in infected and non-infected and sulfur-sufficient plants could be explained by higher usage of cysteine by the growing pathogen or the incorporation of cysteine in sulfur-containing secondary metabolites like GSLs.
Contents of GSH are severely influenced by the sulfur supply of plants with contents being twice as high in sulfur-sufficient plants compared to sulfur-deficient plants at 7 dpi and contents being ten times higher in sulfur-sufficient plants compared to sulfur-deficient plants at 14 dpi underlining the severity of sulfur deprivation (Table 6). Since GSH is involved in detoxification of ROS and is oxidized to the disulfide form GSSG [59], it was expected that contents of GSH would be lower in infected plants compared to non-infected controls. Astonishingly, infected and sulfur-deprived plants manage to synthesize higher amounts of GSH compared to non-infected sulfur-deficient plants indicating a higher de-novo biosynthesis in sulfur-deprived infected plants compared to sulfur deficient non-infected controls. Similarly, although not as pronounced, GSH contents are higher in infected and sulfur-sufficient plants compared to non-infected sulfur-sufficient controls, especially at 14 dpi indicating the need of more reducing equivalents to combat stress induced by the pathogen. Accordingly, it was shown that artificially increased GSH levels in Nicotiana tabacum significantly reduced its susceptibility to Euoidium longipes. It is hypothesized, that an initial increase of GSSG is needed for the activation of a defense response against biotrophic pathogens [60]. Additionally, to its ROS scavenging ability, GSH is used as primary sulfur donor in the biosynthesis of GSLs, indicating a higher biosynthesis rate of GSH which is only partially reflected in its contents in the plants [61].
The role of the GSL gluconasturtiin has to be emphasized: contents of gluconasturtiin were higher in VL-infected plants compared to non-infected controls, independent on sulfur supply (Table 5). Eynck et al. [45] proposed gluconasturtiin to be especially important in the resistance of B. napus against V. dahliae because of its direct inhibitory activity against the pathogen. It was further hypothesized that V. longisporum probably adapted to B. napus to being its host by either suppressing or even avoiding initiation of gluconasturtiin synthesis. With up to more than 3 times higher contents of gluconasturtiin in VL-infected sulfur-sufficient plants compared to non-infected controls and up to about 1.5 times higher contents even in sulfur-deficient infected plants it seems highly unlikely that the analyzed V. longisporum strain is able to suppress the synthesis of gluconasturtiin in the B. napus cultivar Genie (Table 5). Either the V. longisporum strain used is simply not able to counteract gluconasturtiin synthesis or if it is, the used cultivar Genie could be able to elevate gluconasturtiin levels despite the pathogens obstructive approach.
An infection with V. longisporum also seems to enhance the synthesis of iGSLs in B. napus which is especially extraordinary in sulfur-deprived plants (Table 3). Despite the fact that these plants are very deficient in sulfur (Figure 3; Table 7), they managed to synthesize more iGSLs compared to their infected sulfur-sufficient counterparts at all TPIs. Although sulfur is needed for the synthesis of amino acids, which are then used by the plant and the pathogen alike, the very scarce element, at least in sulfur-deficient conditions, is used to synthesize iGSLs highlighting their importance. A gene encoding a key enzyme in the synthesis of iGSLs, CYP79B2/CYP79B3, was found to be transcribed in higher amounts in V. longisporum-infected A. thaliana plants compared to non-infected controls. Additionally, post-translational activation of pen2, which encodes for an alternative thioglucosidase/myrosinase proposed to be involved in iGSL breakdown, was found in infected plants [54]. The breakdown of iGSLs by pen2 can yield indole-3-acetonitrile and through further modification with cyp71B15, camalexin, which was found to inhibit growth of V. longisporum [6]. Furthermore, indole-3-acetonitrile can yield the auxin indole-3-acetic acid (IAA) through modification with nit1-3 in A. thaliana. Auxin-related compounds were hypothesized to be involved in the formation of occlusions preventing the pathogen from spreading further through the plants’ vascular system [62].

4.2. Occlusions: The Physiochemical Barrier of B. napus against the spread of V. longisporum

Analysis of xylem vessels in the hypocotyl of V. longisporum-infected B. napus plants were found to form occlusions (Figure 4). The percentage of occlusions in sulfur-deficient plants was almost always lower compared to sulfur-sufficient plants, indicating that sulfur is needed for the formation of occlusions. Higher transcription of CYP79B2/CYP79B3 could be induced by the plant to not only synthesize toxic breakdown-products derived from iGSLs, but also to access the pool of iGSLs to form the auxin IAA. It was shown that auxin alongside with ethylene was released in high amounts into infected xylem vessels leading to the formation of occlusions. Furthermore, the oxidative burst occurring when high amounts of IAA are released could harm trapped spores and hyphae at the occlusion forming site [63]. Occlusions are formed by the induction of lateral growth which can result in crushing of xylem vessels or formation of bladder-like outgrowths called tyloses. Furthermore, secretion of gels into the xylem can also form occlusions. It was already shown that gels are secreted in the vessels of B. napus [45]. Accordingly, analysis of hypocotyls (Figure 4) also shows the secretion of gels into the xylem, because no breakages or outgrowths could be detected in the microscopic analyses. All formed structures in the vessels are then lignified by the oxidation of secreted phenolic compounds at the occlusion site forming an impassable barrier for spores and hyphae. Although sulfur-deprived plants showed lower percentages of occlusions at 7 dpi compared to sulfur-sufficient controls, the difference between the two sulfur fertilizations became less pronounced at 14 dpi, indicating that occlusion formation happens more slowly in sulfur-deprived plants. Time point and intensity of occlusion formation can vary widely, based on the compatibility of the host-pathogen interaction. Thus, occlusions are formed in resistant plants much faster and more extensively than in susceptible plants in accordance with Fradin and Thomma [64] and Eynck et al. [45].

4.3. Importance of Diurnal Rhythm in the Defense against V. longisporum

Hypocotyls of plants analyzed in this work showed lower numbers of occlusions the later the TPI was (Figure 4), indicating a correlation between formation of occlusions and the TPI. The formation of occlusions depending on the TPI could be directly linked to auxin. Its biosynthesis, conjugation, transcription and effect on specific gene expression was shown to be highly regulated by the circadian clock [65]. Biosynthesis as well as conjugation of auxin peaked during mid-day as well as at the beginning of the day as shown by Covington and Harmer [65]. Similarly, in this work formation of occlusions was shown to be the highest when plants were infected at TPI I and TPI II. Since infection with V. longisporum is probably followed by a delayed perception of the plant, infections happening at dawn and at the beginning of the dark phase (TPI III and TPI IV) would trigger auxin biosynthesis when it could be at its lowest, leading to less pronounced formations of occlusions. The other way around, plants infected at TPI I and TPI II, could trigger auxin biosynthesis adding up to already high auxin contents and leading to numerous formations of occlusions. Possibly supporting this hypothesis are the contents of the iGSL glucobrassicin, which contents were not only higher in infected plants, but also when infection happened later in the day (TPI III and TPI IV) compared to non-infected plants and plants infected earlier in the day. Infected plants possibly try to enhance auxin biosynthesis by using alternative pathways including the synthesis and breakdown of glucobrassicin. Plants infected at a later TPI could have higher contents of glucobrassicin compared to earlier TPIs in order to combat mentioned minimums of auxin contents at the time point of perception of the pathogen. Additionally, contents of VL-DNA were shown to be the highest when plants were infected at a later TPI at 3 dpi (Table 2), showing a higher infection of plants inoculated later in the day. Similarly, studies have shown a stronger defense reaction of plants during the day compared to the night [32,36].
The direct clock target gene ICS1 encodes a key enzyme in the biosynthesis of SA, and its expression is driven by the evening-phased clock transcription factor CHE [66]. It was shown that ICS1 gene expression as well as a SA levels peaked in the middle of the night indicating an anticipation of infections in the morning, since SA is an important signal molecule in induced pathogen defense mechanisms [67,68]. In a study by Zheng et al. [69] it is assumed that V. longisporum is able to form a certain effector that intervenes in the biosynthesis of SA. In susceptible B. napus cultivars this could lead to a reduction in the SA levels, which in turn would allow higher infection rates.
It was shown, that misexpression of several clock genes, including CCA1, impairs resistance to the bacterial pathogen P. syringae and to the oomycete Hyaloperonospora arabidopsidis [70]. It could not be shown that LATE ELONGATED HYPOCOTYL (LHY) plays a defensive role against H. arabidopsidis although the lhy mutants have a similarly shortened circadian period as the cca1 mutants [35]. Overall, it has been shown that genes involved in defense are controlled in a circadian way by CCA1 [71]. Thus, plants are able to perceive infections in the morning when, for example, pathogenic fungi spread their spores [35]. The timed defense includes the ability of plants to incorporate external and internal time cues to anticipate likely attacks from invading pathogens at different times of the day, whereby immediate defense reactions are available for rapid use against a variety of pathogens at a particular time of day [33].
But not only the induced immune responses are regulated in a circadian way. A study by Kerwin et al. [19] showed that genes involved in the biosynthesis of GSLs are also subject to circadian regulation. In addition, there is a connection between the nutrient status and the daily rhythm of plants [38]. Furthermore, key genes of the major pathways of primary metabolism, carbon, nitrate, and sulfur assimilation show distinct diurnal and/or circadian rhythmicity [72,73,74]. The formation of SDCs appears to be under a complex control, involving not only a variety of endogenous and exogenous signals, but also regulation at various transcriptional to post-translational levels [16]. A number of key genes involved in various metabolic pathways, including sulfur metabolism, have been described as regulated in a circadian way in A. thaliana [75]. Diurnal rhythms were described for a variety of secondary compounds involved in interactions between plants and herbivores. Some plant species show higher accumulations during the day, while other species, which are mainly attacked by nocturnal insects, show higher accumulations at night [76,77]. The diurnal regulation is often associated with light regulation. Recently, a study was published investigating an interaction between the circadian clock and the sulfur status in B. napus [18]. In this study it the diurnal oscillation of genes involved in the transport and reduction of sulfate was shown. The observed period is comparable to that of CCA1. Another result of the same study demonstrated that GSLs display ultradian oscillations that were altered by the sulfur supply of the plants. Therefore, it was hypothesized that the concentration of individual GSLs is not regulated in a circadian, but in an ultradian way, probably to be prepared over the day when pathogens are present.

5. Conclusions

Plants are exposed daily to different abiotic and biotic stress factors. The pathogenic defense mechanisms are sometimes very complex and build upon each other. Plants have a whole “arsenal of weapons” that they can use against pathogens (Figure 5). For example, they can build up mechanical barriers, produce toxic metabolites and use their innate immunity. In addition to a sufficient supply of nutrients, the right timing plays a crucial role as well, which decides on success or failure of the defense. This work has attempted to show a distinction of different infection times in the patho-system B. napus - V. longisporum. An additional factor was the fertilization with sufficient and deficient sulfur supply. Although a large amount of data was produced, it was still relatively small for the factors to be investigated, which led to challenges in the statistical evaluation. The different sulfur supply led to significant differences in the plants, which was reflected both in the phenotype and in the measurements. Plants in which the infection with V. longisporum was successful differed clearly compared to corresponding control plants. There were differences in the GSL contents, especially in the bGSL gluconasturtiin and in the formation of occlusions in the xylem vessels. A difference in the four TPIs could only be determined in parts. However, the hypotheses, which assumed an influence of the time point on the severity of the infection and an effect of different sulfur supply on the course of the infection, could be demonstrated in parts. Therefore, the time point of (sulfur) fertilizer application might be critical for the induction of metabolite-based defense mechanisms.

Supplementary Materials

The following are available online at https://www.mdpi.com/2073-4395/10/9/1227/s1, Table S1: Amount of V. longisporum VL43-DNA detected by qPCR with ITS primers in B. napus. Table S2: Contents of iGSLs (glucobrassicin, neoglucobrassicin and 4-hydroxyglucobrassicin) in mock- and mycelium-spore inoculated plants at 7 dpi and 14 dpi. Table S3: Contents of aGSLs (progoitrin, glucoalyssin, glucoraphanin, glucobrassicanapin and gluconapin) in mock- and mycelium-spore inoculated plants at 7 dpi and 14 dpi. Table S4: Contents of the bGSL gluconasturtiin in mock- and mycelium-spore inoculated plants at 7 dpi and 14 dpi. Table S5: Thiol analysis by HPLC: contents of cysteine and glutathione (GSH) in mock- and mycelium-spore inoculated plants at 7 and 14 dpi. Table S6: Elemental analysis: contents of sulfur in mock- and mycelium-spore inoculated plants measured by ICP-OES at 7 and 14 dpi. Table S7: Occurrence of occlusions at 14 and 21 dpi in the mid area of the xylem of B. napus plants infected with V. longisporum strain VL43. Table S8: Elemental analysis: contents of calcium, potassium and iron in mock- and mycelium-spore inoculated plants measured by ICP-OES at 7 and 14 dpi. Figure S1: Brassica napus plants at 14 dpi cultivated at two different sulfur regimes and either infected with the V. longisporum strain VL43 or non-infected. Figure S2: Occurrence of occlusions in the xylem of B. napus: toluidine blue stained cross sections of hypocotyls of mycelium-spore inoculated plants. Figure S3: Cross sections of hypocotyls of control plants at 14 and 21 dpi. Figure S4: Cross sections of hypocotyls of control plants at 14 and 21 dpi.

Author Contributions

Conceptualization, A.R. and J.P.; methodology, S.I.R., J.H., I.H.-N., A.R. and J.P.; validation and formal analysis, S.I.R., J.H., I.H.-N. and J.P.; investigation, S.I.R., J.H. and I.H.-N.; resources, J.P.; statistical analysis, F.S.; writing—original draft preparation, S.I.R.; writing—review and editing, S.I.R., J.H., I.H.-N. and J.P.; visualization, S.I.R.; supervision, J.P. All authors have read and agreed to the published version of the manuscript.

Funding

This research received no external funding. The publication of this article was funded by the Open Access Fund of the Leibniz Universität Hannover.

Acknowledgments

We acknowledge the Deutsche Saatveredelung AG, Lippstadt, Germany, for providing us with seeds of the Brassica napus cultivar.

Conflicts of Interest

The authors declare no conflict of interest.

References

  1. Oerke, E.-C. Crop losses to pests. J. Agric. Sci. 2005, 144, 31–43. [Google Scholar] [CrossRef]
  2. Zeilinger, S.; Gupta, V.K.; Dahms, T.E.S.; Silva, R.N.; Singh, H.B.; Upadhyay, R.S.; Gomes, E.V.; Tsui, C.K.-M.; Nayak, S.C. Friends or foes? Emerging insights from fungal interactions with plants. FEMS Microbiol. Rev. 2015, 40, 182–207. [Google Scholar] [CrossRef] [PubMed] [Green Version]
  3. Fisher, M.C.; Henk, D.A.; Briggs, C.J.; Brownstein, J.S.; Madoff, L.C.; McCraw, S.L.; Gurr, S.J. Emerging fungal threats to animal, plant and ecosystem health. Nature 2012, 484, 186–194. [Google Scholar] [CrossRef] [PubMed]
  4. Meena, V.S.; Maurya, B.R.; Meena, S.K.; Meena, R.K.; Kumar, A.; Verma, J.P.; Singh, N.P. Can Bacillus Species Enhance Nutrient Availability in Agricultural Soils? In Bacilli and Agrobiotechnology; Springer Science and Business Media LLC: Berlin/Heidelberg, Germany, 2016; pp. 367–395. [Google Scholar]
  5. DePotter, J.R.L.; Deketelaere, S.; Inderbitzin, P.; Von Tiedemann, A.; Höfte, M.; Subbarao, K.V.; Wood, T.A.; Thomma, B.P. Verticillium longisporum, the invisible threat to oilseed rape and other brassicaceous plant hosts. Mol. Plant Pathol. 2016, 17, 1004–1016. [Google Scholar] [CrossRef] [PubMed] [Green Version]
  6. Singh, S.; Braus-Stromeyer, S.A.; Timpner, C.; Tran, V.T.; Lohaus, G.; Reusche, M.; Knüfer, J.; Teichmann, T.; Von Tiedemann, A.; Braus, G.H. Silencing of Vlaro2 for chorismate synthase revealed that the phytopathogen Verticillium longisporum induces the cross-pathway control in the xylem. Appl. Microbiol. Biotechnol. 2009, 85, 1961–1976. [Google Scholar] [CrossRef] [PubMed] [Green Version]
  7. Dunker, S.; Keunecke, H.; Steinbach, P.; von Tiedemann, A. Impact of Verticillium longisporum on yield and morphology of winter oilseed rape (Brassica napus) in relation to systemic spread in the plant. J. Phytopathol. 2008, 156, 698–707. [Google Scholar] [CrossRef]
  8. Heale, J.B. Diversification and speciation in Verticillium-an overview. In Adv. Verticillium Res. Disease Manag.; APS Press: St Paul, MN, USA, 2000; pp. 1–14. [Google Scholar]
  9. Heale, J.B.; Karapapa, V.K. The Verticillium threat to canada’s major oilseed crop: Canola. Can. J. Plant Pathol. 1999, 21, 1–7. [Google Scholar] [CrossRef]
  10. Eynck, C.; Koopmann, B.; Karlovsky, P.; Von Tiedemann, A. Internal Resistance in Winter Oilseed Rape Inhibits Systemic Spread of the Vascular Pathogen Verticillium longisporum. Phytopathology 2009, 99, 802–811. [Google Scholar] [CrossRef] [Green Version]
  11. Booth, E.J.; Walker, K.C. The effect of site and foliar sulfur on oilseed rape: Comparison of sulfur responsive and non-responsive seasons. Phyton 1992, 32, 9–13. [Google Scholar]
  12. Pedersen, C.A.; Knudsen, L.; Schnug, E. Sulphur Fertilisation. In Nutrients in Ecosystems; Springer Science and Business Media LLC: Berlin/Heidelberg, Germany, 1998; pp. 115–134. [Google Scholar]
  13. Richards, I.R. Sulphur as a crop nutrient in the United Kingdom. Sulphur Agric. 1990, 14, 8–9. [Google Scholar]
  14. Schnug, E. Sulphur nutritional status of European crops and consequences for agriculture. Sulphur Agric. 1991, 15, 7–12. [Google Scholar]
  15. De Kok, L.J.; Westerman, S.; Stuiver, C.E.E.; Stulen, I. Atmospheric H2S as plant sulfur source: Interaction with pedospheric sulfur nutrition–a case study with Brassica oleracea L. In Sulfur Nutrition and Sulfur Assimilation in Higher Plants: Molecular, Biochemical and Physiological Aspects’; Brunold, C., Rennenberg, H., De Kok, L.J., Stulen, I., Davidian, J.C., Eds.; Haupt Verlag: Bern, Switzerland, 2000; pp. 41–55. [Google Scholar]
  16. Rausch, T.; Wachter, A. Sulfur metabolism: A versatile platform for launching defence operations. Trends Plant Sci. 2005, 10, 503–509. [Google Scholar] [CrossRef] [PubMed]
  17. Kruse, C.; Jost, R.; Lipschis, M.; Kopp, B.; Hartmann, M.; Hell, R. Sulfur-Enhanced Defence: Effects of Sulfur Metabolism, Nitrogen Supply, and Pathogen Lifestyle. Plant Biol. 2007, 9, 608–619. [Google Scholar] [CrossRef] [PubMed]
  18. Hornbacher, J.; Rumlow, A.; Pallmann, P.; Turcios, A.E.; Riemenschneider, A.; Papenbrock, J. The Levels of Sulfur-containing Metabolites in Brassica napus are Not Influenced by the Circadian Clock but Diurnally. J. Plant Biol. 2019, 62, 359–373. [Google Scholar] [CrossRef]
  19. Kerwin, R.E.; Jiménez-Gómez, J.M.; Fulop, D.; Harmer, S.L.; Maloof, J.N.; Kliebenstein, D.J. Network Quantitative Trait Loci Mapping of Circadian Clock Outputs Identifies Metabolic Pathway-to-Clock Linkages in Arabidopsis. Plant Cell 2011, 23, 471–485. [Google Scholar] [CrossRef] [Green Version]
  20. Andersson, D.; Chakrabarty, R.; Bejai, S.; Zhang, J.; Rask, L.; Meijer, J. Myrosinases from root and leaves of Arabidopsis thaliana have different catalytic properties. Phytochemistry 2009, 70, 1345–1354. [Google Scholar] [CrossRef]
  21. Mithen, R.; Campos, H. Genetic variation of aliphatic glucosinolates in Arabidopsis thaliana and prospects for map based gene cloning. In Proceedings of the 9th International Symposium on Insect-Plant Relationships, Gwatt, Switzerland, 24–30 June 1995; Springer Science and Business Media LLC: Berlin/Heidelberg, Germany, 1996; pp. 202–205. [Google Scholar]
  22. Fahey, J.W.; Zalcmann, A.T.; Talalay, P. The chemical diversity and distribution of glucosinolates and isothiocyanates among plants. Phytochemistry 2001, 56, 5–51. [Google Scholar] [CrossRef]
  23. Hopkins, R.; Van Dam, N.M.; Van Loon, J.J. Role of Glucosinolates in Insect-Plant Relationships and Multitrophic Interactions. Annu. Rev. EÈntomol. 2009, 54, 57–83. [Google Scholar] [CrossRef]
  24. Mithen, R. Glucosinolates—Biochemistry, genetics and biological activity. Plant Growth Regul. 2001, 34, 91–103. [Google Scholar] [CrossRef]
  25. Bednarek, P. Sulfur-containing secondary metabolites from Arabidopsis thaliana and other Brassicaceae with function in plant immunity. ChemBioChem 2012, 13, 1846–1859. [Google Scholar] [CrossRef]
  26. Wittstock, U.; Halkier, B.A. Glucosinolate research in the Arabidopsis era. Trends Plant Sci. 2002, 7, 263–270. [Google Scholar] [CrossRef]
  27. Bones, A.M.; Rossiter, J.T. The myrosinase-glucosinolate system, its organisation and biochemistry. Physiol. Plant. 1996, 97, 194–208. [Google Scholar] [CrossRef]
  28. Schnug, E.; Booth, E.; Haneklaus, S.; Walker, K.C. Sulphur supply and stress resistance in oilseed rape. In Proceedings of the 9th International Rapeseed Congress, Cambridge, UK, 4–7 July 1995; Volume 1995, pp. 229–231. [Google Scholar]
  29. Davidson, R.M.; Goss, R.L. Effects of P, S, N, lime, chlordane, and fungicides on ophiobolus patch disease of turf. Plant Disease Rep. 1972, 56, 565–567. [Google Scholar]
  30. Roden, L.C.; Ingle, R.A. Lights, Rhythms, Infection: The Role of Light and the Circadian Clock in Determining the Outcome of Plant–Pathogen Interactions. Plant Cell 2009, 21, 2546–2552. [Google Scholar] [CrossRef] [Green Version]
  31. Chandra-Shekara, A.C.; Gupte, M.; Navarre, D.; Raina, S.; Raina, R.; Klessig, D.; Kachroo, P. Light-dependent hypersensitive response and resistance signaling against Turnip Crinkle Virus in Arabidopsis. Plant J. 2006, 45, 320–334. [Google Scholar] [CrossRef]
  32. Griebel, T.; Zeier, J. Light Regulation and Daytime Dependency of Inducible Plant Defenses in Arabidopsis: Phytochrome Signaling Controls Systemic Acquired Resistance Rather Than Local Defense. Plant Physiol. 2008, 147, 790–801. [Google Scholar] [CrossRef] [Green Version]
  33. Lu, H.; McClung, C.R.; Zhang, C. Tick Tock: Circadian Regulation of Plant Innate Immunity. Annu. Rev. Phytopathol. 2017, 55, 287–311. [Google Scholar] [CrossRef] [Green Version]
  34. Oberpichler, I.; Rosen, R.; Rasouly, A.; Vugman, M.; Ron, E.Z.; Lamparter, T. Light affects motility and infectivity of Agrobacterium tumefaciens. Environ. Microbiol. 2008, 10, 2020–2029. [Google Scholar] [CrossRef]
  35. Wang, W.; Barnaby, J.Y.; Tada, Y.; Li, H.; Tör, M.; Caldelari, D.; Lee, D.-U.; Fu, X.-D.; Dong, X. Timing of plant immune responses by a central circadian regulator. Nature 2011, 470, 110–114. [Google Scholar] [CrossRef]
  36. Bhardwaj, V.; Meier, S.; Petersen, L.N.; Ingle, R.A.; Roden, L.C. Defence Responses of Arabidopsis thaliana to Infection by Pseudomonas syringae Are Regulated by the Circadian Clock. PLoS ONE 2011, 6, e26968. [Google Scholar] [CrossRef] [Green Version]
  37. Ingle, R.A.; Stoker, C.; Stone, W.; Adams, N.; Smith, R.; Grant, M.; Carré, I.A.; Roden, L.C.; Denby, K. Jasmonate signalling drives time-of-day differences in susceptibility of Arabidopsis to the fungal pathogen Botrytis cinerea. Plant J. 2015, 84, 937–948. [Google Scholar] [CrossRef] [Green Version]
  38. Haydon, M.J.; Roman, A.; Arshad, W. Nutrient homeostasis within the plant circadian network. Front. Plant Sci. 2015, 6, 299. [Google Scholar] [CrossRef] [PubMed] [Green Version]
  39. Chiasson, D.; Loughlin, P.C.; Mazurkiewicz, D.; Mohammadi-Dehcheshmeh, M.; Fedorova, E.E.; Okamoto, M.; McLean, E.; Glass, A.D.M.; Smith, S.E.; Bisseling, T.; et al. Soybean SAT1 (Symbiotic Ammonium Transporter 1) encodes a bHLH transcription factor involved in nodule growth and NH4+ transport. Proc. Natl. Acad. Sci. USA 2014, 111, 4814–4819. [Google Scholar] [CrossRef] [PubMed] [Green Version]
  40. Michael, T.P.; McClung, C.R. Enhancer Trapping Reveals Widespread Circadian Clock Transcriptional Control in Arabidopsis1[w]. Plant Physiol. 2003, 132, 629–639. [Google Scholar] [CrossRef] [PubMed] [Green Version]
  41. Weese, A.; Pallmann, P.; Papenbrock, J.; Riemenschneider, A. Brassica napus L. cultivars show a broad variability in their morphology, physiology and metabolite levels in response to sulfur limitations and to pathogen attack. Front. Plant Sci. 2015, 6, 9. [Google Scholar] [CrossRef]
  42. Blake-Kalff, M.M.; Harrison, K.R.; Hawkesford, M.J.; Zhao, F.J.; McGrath, S.P. Distribution of Sulfur within Oilseed Rape Leaves in Response to Sulfur Deficiency during Vegetative Growth. Plant Physiol. 1998, 118, 1337–1344. [Google Scholar] [CrossRef] [Green Version]
  43. Zeise, K.; Von Tiedemann, A. Morphological and Physiological Differentiation among Vegetative Compatibility Groups of Verticillium dahliae in Relation to V. longisporum. J. Phytopathol. 2001, 149, 469–475. [Google Scholar] [CrossRef]
  44. Rumlow, A.; Keunen, E.; Klein, J.; Pallmann, P.; Riemenschneider, A.; Cuypers, A.; Papenbrock, J. Quantitative Expression Analysis in Brassica napus by Northern Blot Analysis and Reverse Transcription-Quantitative PCR in a Complex Experimental Setting. PLoS ONE 2016, 11, e0163679. [Google Scholar] [CrossRef]
  45. Eynck, C.; Koopmann, B.; Grunewaldt-Stoecker, G.; Karlovsky, P.; Von Tiedemann, A. Differential interactions of Verticillium longisporum and V. dahliae with Brassica napus detected with molecular and histological techniques. Eur. J. Plant Pathol. 2007, 118, 259–274. [Google Scholar] [CrossRef]
  46. Riemenschneider, A.; Wegele, R.; Schmidt, A.; Papenbrock, J. Isolation and characterization of a D-cysteine desulfhydrase protein from Arabidopsis thaliana. FEBS J. 2005, 272, 1291–1304. [Google Scholar] [CrossRef]
  47. Feder, N.E.D.; O’Brien, T.P. Plant microtechnique: Some principles and new methods. Am. J. Bot. 1968, 55, 123–142. [Google Scholar] [CrossRef]
  48. Schindelin, J.; Arganda-Carreras, I.; Frise, E.; Kaynig, V.; Longair, M.; Pietzsch, T.; Tinevez, J.Y. Fiji: An open-source platform for biological-image analysis. Nat. Methods 2012, 9, 676. [Google Scholar] [CrossRef] [PubMed] [Green Version]
  49. McCullagh, P.; Nelder, J. Generalized Linear Models, 2rd ed.; Chapman & Hall: London, UK, 1989. [Google Scholar]
  50. Lenth, R. Emmeans Package: Estimated Marginal Means, aka Least-Squares Means. R Package Version 1.3. 5.1. 2019. Available online: http://packages.renjin.org/package/org.renjin.cran/emmeans (accessed on 18 August 2020).
  51. Kamble, A.; Koopmann, B.; Von Tiedemann, A. Induced resistance to Verticillium longisporum in Brassica napus by β-aminobutyric acid. Plant Pathol. 2012, 62, 552–561. [Google Scholar] [CrossRef]
  52. Dunker, S.; Keunecke, H.; von Tiedemann, A. Verticillium longisporum in winter oilseed rape-Impact on plant development and yield. IOBC WPRS Bull. 2006, 29, 361. [Google Scholar]
  53. Lopisso, D.T.; Knüfer, J.; Koopmann, B.; Von Tiedemann, A. The Vascular Pathogen Verticillium longisporum Does Not Affect Water Relations and Plant Responses to Drought Stress of Its Host, Brassica napus. Phytopathology 2017, 107, 444–454. [Google Scholar] [CrossRef] [Green Version]
  54. Iven, T.; König, S.; Singh, S.; Braus-Stromeyer, S.A.; Bischoff, M.; Tietze, L.F.; Braus, G.H.; Lipka, V.; Feussner, I.; Dröge-Laser, W. Transcriptional Activation and Production of Tryptophan-Derived Secondary Metabolites in Arabidopsis Roots Contributes to the Defense against the Fungal Vascular Pathogen Verticillium longisporum. Mol. Plant 2012, 5, 1389–1402. [Google Scholar] [CrossRef] [Green Version]
  55. Rygulla, W.; Friedt, W.; Seyis, F.; Lühs, W.; Eynck, C.; Von Tiedemann, A.; Snowdon, R.J. Combination of resistance to Verticillium longisporum from zero erucic acid Brassica oleracea and oilseed Brassica rapa genotypes in resynthesized rapeseed (Brassica napus) lines. Plant Breed. 2007, 126, 596–602. [Google Scholar] [CrossRef]
  56. Witzel, K.; Hanschen, F.S.; Schreiner, M.; Krumbein, A.; Ruppel, S.; Grosch, R. Verticillium Suppression Is Associated with the Glucosinolate Composition of Arabidopsis thaliana Leaves. PLoS ONE 2013, 8, e71877. [Google Scholar] [CrossRef] [Green Version]
  57. Timpner, C.; Braus-Stromeyer, S.A.; Tran, V.T.; Braus, G.H. The Cpc1 Regulator of the Cross-Pathway Control of Amino Acid Biosynthesis Is Required for Pathogenicity of the Vascular Pathogen Verticillium longisporum. Mol. Plant Microbe Interact. 2013, 26, 1312–1324. [Google Scholar] [CrossRef] [Green Version]
  58. Bloem, E.; Riemenschneider, A.; Volker, J.; Papenbrock, J.; Schmidt, A.; Salac, I.; Haneklaus, S.; Schnug, E. Sulphur supply and infection with Pyrenopeziza brassicae influence L-cysteine desulphydrase activity in Brassica napus L. J. Exp. Bot. 2004, 55, 2305–2312. [Google Scholar] [CrossRef] [Green Version]
  59. Bloem, E.; Haneklaus, S.; Kleinwächter, M.; Paulsen, J.; Schnug, E.; Selmar, D. Stress-induced changes of bioactive compounds in Tropaeolum majus L. Ind. Crop. Prod. 2014, 60, 349–359. [Google Scholar] [CrossRef]
  60. Künstler, A.; Kátay, G.; Gullner, G.; Király, L. Artificial elevation of glutathione contents in salicylic acid-deficient tobacco (Nicotiana tabacum cv. Xanthi NahG) reduces susceptibility to the powdery mildew pathogen Euoidium longipes. Plant Biol. 2019, 22, 70–80. [Google Scholar] [CrossRef] [Green Version]
  61. Geu-Flores, F.; Møldrup, M.E.; Böttcher, C.; Olsen, C.E.; Scheel, D.; Halkier, B.A. Cytosolic γ-Glutamyl Peptidases Process Glutathione Conjugates in the Biosynthesis of Glucosinolates and Camalexin in Arabidopsis. Plant Cell 2011, 23, 2456–2469. [Google Scholar] [CrossRef] [Green Version]
  62. Talboys, P.W. Chemical control of Verticillium wilts. Phytopathol. Mediterr. 1984, 23, 163–175. [Google Scholar]
  63. Beckman, C.H. Phenolic-storing cells: Keys to programmed cell death and periderm formation in wilt disease resistance and in general defence responses in plants? Physiol. Mol. Plant Pathol. 2000, 57, 101–110. [Google Scholar] [CrossRef]
  64. Fradin, E.F.; Thomma, B.P. Physiology and molecular aspects of Verticillium wilt diseases caused by V. dahliae and V. albo-atrum. Mol. Plant Pathol. 2006, 7, 71–86. [Google Scholar] [CrossRef] [PubMed]
  65. Covington, M.F.; Harmer, S.L. The Circadian Clock Regulates Auxin Signaling and Responses in Arabidopsis. PLoS Biol. 2007, 5, e222. [Google Scholar] [CrossRef] [PubMed] [Green Version]
  66. Zheng, X.-Y.; Zhou, M.; Yoo, H.; Pruneda-Paz, J.L.; Spivey, N.W.; Kay, S.A.; Dong, X. Spatial and temporal regulation of biosynthesis of the plant immune signal salicylic acid. Proc. Natl. Acad. Sci. USA 2015, 112, 9166–9173. [Google Scholar] [CrossRef] [PubMed] [Green Version]
  67. Liu, T.; Song, T.; Zhang, X.; Yuan, H.; Su, L.; Li, W.; Xu, J.; Liu, S.; Chen, L.; Chen, T.; et al. Unconventionally secreted effectors of two filamentous pathogens target plant salicylate biosynthesis. Nat. Commun. 2014, 5, 4686. [Google Scholar] [CrossRef] [Green Version]
  68. Spoel, S.H.; Dong, X. How do plants achieve immunity? Defence without specialized immune cells. Nat. Rev. Immunol. 2012, 12, 89–100. [Google Scholar] [CrossRef]
  69. Zheng, X.; Koopmann, B.; Von Tiedemann, A. Role of Salicylic Acid and Components of the Phenylpropanoid Pathway in Basal and Cultivar-Related Resistance of Oilseed Rape (Brassica napus) to Verticillium longisporum. Plants 2019, 8, 491. [Google Scholar] [CrossRef] [PubMed] [Green Version]
  70. Shin, J.; Heidrich, K.; Sanchez-Villarreal, A.; Parker, J.E.; Davis, S.J. TIME FOR COFFEE Represses Accumulation of the MYC2 Transcription Factor to Provide Time-of-Day Regulation of Jasmonate Signaling in Arabidopsis. Plant Cell 2012, 24, 2470–2482. [Google Scholar] [CrossRef] [PubMed] [Green Version]
  71. Oliverio, K.A.; Crepy, M.; Martin-Tryon, E.L.; Milich, R.; Harmer, S.L.; Putterill, J.; Yanovsky, M.J.; Casal, J. GIGANTEA Regulates Phytochrome A-Mediated Photomorphogenesis Independently of Its Role in the Circadian Clock. Plant Physiol. 2007, 144, 495–502. [Google Scholar] [CrossRef] [Green Version]
  72. Kopriva, S.; Muheim, R.; Koprivova, A.; Trachsel, N.; Catalano, C.; Suter, M.; Brunold, C. Light regulation of assimilatory sulphate reduction in Arabidopsis thaliana. Plant J. 1999, 20, 37–44. [Google Scholar] [CrossRef] [Green Version]
  73. Pilgrim, M.L.; Caspar, T.; Quail, P.H.; McClung, C.R. Circadian and light-regulated expression of nitrate reductase in Arabidopsis. Plant Mol. Boil. 1993, 23, 349–364. [Google Scholar] [CrossRef] [PubMed]
  74. Zeeman, S.C.; Smith, S.M.; Smith, A.M. The diurnal metabolism of leaf starch. Biochem. J. 2006, 401, 13–28. [Google Scholar] [CrossRef]
  75. Harmer, S.L. The Circadian System in Higher Plants. Annu. Rev. Plant Boil. 2009, 60, 357–377. [Google Scholar] [CrossRef] [Green Version]
  76. De Moraes, C.M.; Mescher, M.C.; Tumlinson, J.H. Caterpillar-induced nocturnal plant volatiles repel conspecific females. Nature 2001, 410, 577–580. [Google Scholar] [CrossRef]
  77. Kim, S.-G.; Yon, F.; Gaquerel, E.; Gulati, J.; Baldwin, I.T. Tissue Specific Diurnal Rhythms of Metabolites and Their Regulation during Herbivore Attack in a Native Tobacco, Nicotiana attenuata. PLoS ONE 2011, 6, e26214. [Google Scholar] [CrossRef]
  78. Karapetyan, S.; Dong, X. Redox and the circadian clock in plant immunity: A balancing act. Free. Radic. Boil. Med. 2017, 119, 56–61. [Google Scholar] [CrossRef]
  79. Zechmann, B. Diurnal changes of subcellular glutathione content in Arabidopsis thaliana. Biol. Plant. 2017, 61, 791–796. [Google Scholar] [CrossRef]
  80. Zhang, C.; Xie, Q.; Anderson, R.G.; Ng, G.; Seitz, N.C.; Peterson, T.; McClung, C.R.; McDowell, J.M.; Kong, D.; Kwak, J.M.; et al. Crosstalk between the Circadian Clock and Innate Immunity in Arabidopsis. PLoS Pathog. 2013, 9, e1003370. [Google Scholar] [CrossRef] [PubMed] [Green Version]
  81. Rosa, E.A.; Rodrigues, P.M.F. The effect of light and temperature on glucosinolate concentration in the leaves and roots of cabbage seedlings. J. Sci. Food Agric. 1998, 78, 208–212. [Google Scholar] [CrossRef]
Figure 1. Experimental design. (a) Scheme for the infection experiment at different time points of inoculation (TPI). Control plants (C) were germinated in Blake Kalff medium (BK), mock-inoculated with Czapek-Dox broth (CDB) and infected plants (VL) with mycelium-spore mixture. (b) C and VL plants were watered for 3 d with distilled water, then subdivided into C and VL with sufficient (+S) and deficient (−S) sulfur fertilization.
Agronomy 10 01227 g001
Figure 2. Different tissue types in the cross section of a hypocotyl from B. napus and the definition of the counting range of the occlusions. (a) The tissue distribution of a hypocotyl cross section of B. napus: Pi: Pith; Xy: Xylem; Cam: Cambium; Ph: Phloem. (b) A simplified representation of the counting ranges of the occlusions for mid area of the xylem (mXy; red circle, red arrow) and periphery of the xylem (pXy; orange circle, orange arrow). For each cross section, the range from Pi to Cam was measured. The measured distance was divided in half and defined to mXy and pXy.
Agronomy 10 01227 g002
Figure 3. Brassica napus plants at 14 dpi cultivated at two different sulfur regimes and either infected with the V. longisporum strain VL43 or non-infected. Plants under sufficient (1 mM MgSO4: +S) and deficient (0.01 mM MgSO4: −S) sulfur supply at 14 dpi; A1–A4: control plants +S; B1–B4: VL-infected plants +S; C1–C4: control plants −S; D1–D4: VL-infected plants −S; red scale bar 5 cm.
Agronomy 10 01227 g003
Figure 4. Occurrence of occlusions in the xylem of B. napus: toluidine blue stained cross sections of hypocotyls of mycelium-spore inoculated plants. 14 dpi: A1-A4: VL-infected +S at TPI I-IV; B1–B4: VL-infected −S at TPI I-IV; 21 dpi: C1–C4: VL-infected +S at TPI I-IV; D1–D4: VL-infected −S at TPI I–IV; scale bar 100 µm.
Agronomy 10 01227 g004
Figure 5. Major observations of the experiment: occurrence of occlusions in the xylem, increased content of gluconasturtiin (benzylic GSL; bGSL) in VL-infected plants and a higher susceptibility of B. napus at the end of the day to V. longisporum. B. napus seems to be more susceptible to V. longisporum at TPI III/TPI IV, while the contents of measured VL-DNA were about *60% higher compared to the contents of TPI I/TPI II; right side: bGSL content at 7 dpi of samples from TPI I/TPI II compared to the corresponding control plants; occurrence of occlusions at 14 dpi of plants from TPI I/TPI II compared to plants from TPI III/TPI IV; left side: bGSL content at 7 dpi of samples from TPI III/TPI IV compared to the corresponding control plants and VL-infected plants from TPI I/TPI II; percentages were calculated from the values of the combined contents of TPI I with TPI II or TPI III and TPI IV, respectively; cf.: comparing; image of circadian clock is adapted from Karapetyan and Dong [78]; 1Zechmann [79]; 2Zhang et al. [80]; 3Kopriva et al. [72]; 4Rosa and Rodrigues [81]; 5Hornbacher et al. [18].
Agronomy 10 01227 g005
Table 1. Overview of the fertilization procedure, sampling and conducted methods.
FertilizationHarvesting Sample Size of Each GroupMethod
Distilled water as required3 dpiEight plants without rootDNA-extraction
qPCR
Distilled water as required and Corresponding BK medium (+S/−S) 1: 150 mL each pot weekly7 dpiEight plants without rootDNA-extraction
qPCR
Elemental analysis via ICP-OES
GSL analysis via HPLC
Cysteine and glutathione analysis via HPLC
14 dpiEight plants without root
Histology: hypocotyl of one plant
DNA-extraction
qPCR
Elemental analysis via ICP-OES
GSL analysis via HPLC
Cysteine and glutathione analysis via HPLC
Histology: Toluidine blue staining
21 dpiOnly histology: hypocotyl of 1 plantHistology: Toluidine blue staining
1 +S BK medium with 1 mM MgSO4; −S BK medium with 0.01 mM MgSO4; start of fertilization after the first sampling at 3 dpi.
Table 2. Amount of V. longisporum VL43-DNA detected by qPCR with ITS primers in B. napus. Status of infection rate in mycelium-spore inoculated plants calculated in ng VL DNA g−1 FW; VL without +S/-S fertilization: samples, consisting of eight pooled plants, at 3 dpi without different sulfur fertilization, only distilled water as required; 7 dpi and 14 dpi: plants were fertilized with different sulfur supply; due to the limited plant material, only one measurement could be carried out. TPI I, 1 h before the onset of the light; TPI II, 3 h after the onset of the light; TPI III, 1 h before the light is switched off; TPI IV, 3 h after the light is switched off. Significant change in the measured values over the harvest period 3, 7 and 14 dpi (p = 0.002); Significant difference between TPI I and TPI IV (p = 0.008); Significant effects for TPI depending on dpi (p = 0.01); Significant effects of sulfur supply depending on dpi (p = 0.01); Significant effects for VL +S between 7 and 14 dpi (p = 0.0001) and between VL +S and VL −S at 14 dpi (p = 0.0003).
3 dpi/ng VL DNA g−1 FWVL without +S/−S FertilizationVL without +S/−S Fertilization
TPI I6.177.05
TPI II13.8510.54
TPI III17.2219.54
TPI IV27.1227.20
7 dpi/ng VL DNA g−1 FWVL +SVL −S
TPI I13.5412.37
TPI II4.037.68
TPI III8.0112.50
TPI IV8.158.27
14 dpi/ng VL DNA g−1 FWVL +SVL −S
TPI I0.294.79
TPI II1.065.87
TPI III0.511.82
TPI IV0.335.45
Table 3. Contents of iGSLs (glucobrassicin, neoglucobrassicin and 4-hydroxyglucobrassicin) in mock- and mycelium-spore inoculated plants at 7 dpi and 14 dpi; data from 7 and 14 dpi represent the result of one measurement; hypothetical SDs of samples from 7 dpi based on previous measurements can range between 2–25%; random SDs of samples from 14 dpi based on three dependent technical replicates; the reason for only one measurement is the low amount of the plant material due to space limitation in climatic chambers.
Glucobrassicin [nmol g−1 DW]
7 dpiC +SVL +SC −SVL −S14 dpiC +SVL +SC −SVL −S
TPI I195.99304.14136.91328.44TPI I92.52 ± 4.30158.54 ± 7.700.4110.76
TPI II231.11348.42162.56230.67TPI II109.19123.300.06 ± 0.022.75 ± 0.78
TPI III262.87356.19202.76297.80TPI III97.09 ± 9.92165.790.3211.91
TPI IV351.40456.19213.60267.74TPI IV106.38139.87 ± 3.861.1112.31 ± 0.84
Neoglucobrassicin [nmol g−1 DW]
7 dpiC +SVL +SC −SVL −S14 dpiC +SVL +SC −SVL −S
TPI I28.8329.8720.6239.53TPI I20.71 ± 3.5817.77 ± 1.302.935.83
TPI II37.8040.1228.4447.18TPI II22.7420.012.60 ± 0.236.20 ± 1.45
TPI III37.1428.9528.3721.53TPI III19.05 ± 2.7819.584.056.99
TPI IV41.0843.1833.6031.21TPI IV23.3223.62 ± 1.645.188.27 ± 0.82
4-Hydroxyglucobrassicin [nmol g−1 DW]
7 dpiC +SVL +SC −SVL −S14 dpiC +SVL +SC −SVL −S
TPI I9.0420.1919.243.47TPI I14.94 ± 1.4219.80 ± 5.840.400.19
TPI II9.9722.8318.440.96TPI II15.006.740.29 ± 0.020.22 ± 0.03
TPI III4.9320.202.085.30TPI III14.76 ± 2.874.000.270.32
TPI IV16.2410.777.351.42TPI IV25.939.16 ± 4.340.290.32 ± 0.04
Table 4. Contents of aGSLs (progoitrin, glucoalyssin, glucoraphanin, glucobrassicanapin and gluconapin) in mock- and mycelium-spore inoculated plants at 7 dpi and 14 dpi; data from 7 and 14 dpi represent the result of one measurement; hypothetical SDs of samples from 7 dpi based on previous measurements can range between 3–35%; random SDs of samples from 14 dpi based on three dependent technical replicates; the reason for only one measurement is the low amount of the plant material due to space limitation in climatic chambers.
Progoitrin [nmol g−1 DW]
7 dpiC +SVL +SC −SVL −S14 dpiC +SVL +SC −SVL −S
TPI I93.98171.3468.43210.08TPI I58.07 ± 1.60104.17 ± 9.410.750.97
TPI II89.62219.13111.4972.20TPI II95.2797.671.43 ± 0.430.90 ± 0.25
TPI III61.33169.0146.83109.53TPI III105.96 ± 12.33108.960.480.73
TPI IV170.73241.14103.43113.41TPI IV95.63107.59 ± 8.890.891.04 ± 0.05
Glucoalyssin [nmol g−1 DW]
7 dpiC +SVL +SC −SVL −S14 dpiC +SVL +SC −SVL −S
TPI I69.5699.8030.68119.98TPI I54.31 ± 1.7395.48 ± 11.294.740.65
TPI II54.13183.4756.2647.09TPI II84.8870.566.51 ± 0.662.98 ± 0.33
TPI III29.23116.9318.6142.17TPI III91.62 ± 10.6679.632.912.95
TPI IV115.74203.6950.5739.80TPI IV108.3387.88 ± 11.793.723.28 ± 0.36
Glucoraphanin [nmol g−1 DW]
7 dpiC +SVL +SC −SVL −S14 dpiC +SVL +SC −SVL −S
TPI I14.3914.352.699.09TPI I9.93 ± 0.3414.83 ± 1.612.153.91
TPI II3.5825.616.822.11TPI II13.258.232.91 ± 0.703.54 ± 0.19
TPI III1.5617.261.542.30TPI III11.81 ± 2.108.210.886.72
TPI IV13.4027.654.444.16TPI IV17.898.52 ± 2.382.007.54 ± 1.14
Glucobrassicanapin [nmol g−1 DW]
7 dpiC +SVL +SC −SVL −S14 dpiC +SVL +SC −SVL −S
TPI I23.8945.0313.6865.71TPI I27.14 ± 1.3043.01 ± 3.900.500.50
TPI II42.3554.8426.6220.18TPI II45.3661.280.30 ± 0.030.32 ± 0.27
TPI III20.5437.2215.4123.31TPI III56.59 ± 6.9466.760.440.21
TPI IV43.8752.5330.0113.38TPI IV46.3962.48 ± 3.260.600.33 ± 0.13
Gluconapin [nmol g−1 DW]
7 dpiC +SVL +SC −SVL −S14 dpiC +SVL +SC −SVL −S
TPI I35.3370.2111.3039.84TPI I22.13 ± 0.9338.01 ± 2.251.470.77
TPI II28.1077.6524.918.63TPI II39.3528.641.60 ± 0.380.34 ± 0.09
TPI III11.1855.268.4811.70TPI III55.56 ± 7.9932.101.950.35
TPI IV70.0177.8016.6912.60TPI IV45.3029.42 ± 2.942.170.37 ± 0.09
Table 5. Contents of the bGSL gluconasturtiin in mock- and mycelium-spore inoculated plants at 7 dpi and 14 dpi; data from 7 and 14 dpi represent the result of one measurement; hypothetical SDs of samples from 7 dpi based on previous measurements can range between 1–25%; random SDs of samples from 14 dpi based on three dependent technical replicates; the reason for only one measurement is the low amount of the plant material due to space limitation in climatic chambers.
Gluconasturtiin [nmol g−1 DW]
7 dpiC +SVL +SC −SVL −S14 dpiC +SVL +SC −SVL −S
TPI I98.71215.1292.05171.25TPI I52.05 ± 1.43125.92 ± 8.1410.4055.84
TPI II69.16190.75107.36183.82TPI II44.0786.905.69 ± 0.0935.56 ± 6.55
TPI III55.98240.5284.85191.47TPI III51.71 ± 4.10142.956.9250.17
TPI IV123.95263.75101.10230.38TPI IV59.60109.09 ± 2.7810.2245.62 ± 1.56
Table 6. Thiol analysis performed with HPLC: contents of cysteine and glutathione (GSH) in mock- and mycelium-spore inoculated plants at 7 and 14 dpi; data of 7 dpi represents the result of one measurement; the reason for only one measurement is the low amount of the plant material due to space limitation in climatic chambers.; data of 14 dpi represents the mean of three dependent technical replicates ± SD.
Cysteine [nmol g−1 FW]
7 dpiC +SVL +SC −SVL −S14 dpiC −SVL +SC −SVL −S
TPI I27.4128.0313.806.57TPI I17.73 ± 1.4219.66 ± 1.582.95 ± 0.524.60 ± 0.30
TPI II20.5728.438.6216.29TPI II22.07 ± 1.3021.42 ± 1.331.93 ± 0.201.99 ± 0.60
TPI III18.5724.6613.7015.43TPI III23.35 ± 0.9121.72 ± 2.051.98 ± 0.363.41 ± 0.17
TPI IV28.5130.2611.8512.00TPI IV20.20 ± 1.5018.77 ± 1.971.79 ± 0.884.10 ± 0.26
GSH [nmol g−1 FW]
7 dpiC +SVL +SC −SVL −S14 dpiC +SVL +SC −SVL −S
TPI I559.17420.96278.54568.68TPI I671.79 ± 26.98707.66 ± 22.2766.21 ± 4.98136.38 ± 13.05
TPI II646.72629.21276.83464.82TPI II690.45 ± 13.15750.78 ± 20.1368.52 ± 9.7863.00 ± 3.03
TPI III519.29588.02312.53348.69TPI III630.34 ± 47.26720.24 ± 37.5765.16 ± 1.7384.59 ± 2.99
TPI IV522.86544.11253.71379.52TPI IV705.57 ± 31.60725.97 ± 12.4758.99 ± 2.2098.21 ± 6.30
Table 7. Elemental analysis: contents of sulfur content in mock- and mycelium-spore inoculated plants measured by ICP-OES at 7 and 14 dpi; data represent the mean of three dependent technical replicates ± SD.
Sulfur [mg g−1 DW]
7 dpiC +SVL +SC −SVL −S14 dpiC +SVL +SC −SVL −S
TPI I8.63 ± 0.02 7.74 ± 0.02 1.33 ± 0.01 3.12 ± 0.02TPI I6.32 ± 0.045.29 ± 0.020.73 ± 0.001.02 ± 0.00
TPI II10.11 ± 0.06 9.52 ± 0.06 2.09 ± 0.01 2.58 ± 0.02 TPI II6.91 ± 0.006.51 ± 0.010.71 ± 0.011.19 ± 0.00
TPI III10.72 ± 0.00 8.62 ± 0.02 2.13 ± 0.00 3.01 ± 0.00 TPI III5.31 ± 0.026.71 ± 0.050.57 ± 0.000.61 ± 0.00
TPI IV8.70 ± 0.01 7.95 ± 0.04 2.07 ± 0.01 2.15 ± 0.01 TPI IV5.61 ± 0.026.00 ± 0.030.63 ± 0.000.72 ± 0.00
Table 8. Occurrence of occlusions at 14 and 21 dpi in the mid area of the xylem of B. napus plants infected with V. longisporum strain VL43; data represent the mean of five dependent technical replicates ± SD.
Occurrence of Occlusions in the Mid Area of the Xylem [%]
14 dpiVL +SVL −S21 dpiVL +SVL −S
TPI I34.60 ± 0.527.75 ± 0.50TPI I38.17 ± 0.6434.42 ± 0.38
TPI II21.42 ± 0.329.33 ± 0.52TPI II33.89 ± 0.5030.44 ± 0.61
TPI III8.18 ± 0.173.56 ± 0.30TPI III29.60 ± 0.3220.11 ± 0.39
TPI IV3.29 ± 0.245.13 ± 0.67TPI IV27.99 ± 0.208.90 ± 0.30

