Article

Identification of Non-Pleiotropic Loci in Flowering and Maturity Control in Soybean

1
Department of Biology, California State University, Northridge, CA 91330, USA
2
Department of Crop Sciences, University of Illinois at Urbana-Champaign, Urbana-Champaign, IL 61801, USA
3
USDA-Agricultural Research Service, Soybean/Maize Germplasm, Pathology, and Genetics Research Unit, Department of Crop Sciences, University of Illinois at Urbana-Champaign, Urbana-Champaign, IL 61801, USA
4
Plant Pathology and Plant-Microbe Biology Section, Cornell University, Geneva, NY 14456, USA
*
Author to whom correspondence should be addressed.
Agronomy 2020, 10(8), 1204; https://doi.org/10.3390/agronomy10081204
Submission received: 30 June 2020 / Revised: 29 July 2020 / Accepted: 9 August 2020 / Published: 17 August 2020
(This article belongs to the Special Issue Genetics, Genomics, and Breeding of Legume Crops)

Abstract

:
Pleiotropy is considered to have a significant impact on multi-trait evolution, but its roles in the evolution of domestication-related traits in crop species have been unclear. In soybean, several known quantitative trait loci (QTL) controlling maturity, called the maturity loci, are known to have major effects on both flowering and maturity in a highly correlated pleiotropic manner. Aiming at the identification of non-pleiotropic QTLs that independently control flowering and maturity and dissecting the effects of pleiotropy in these important agronomic traits, we conducted a QTL mapping experiment by creating a population from a cross between domesticated soybean G. max and its wild ancestor G. soja that underwent stringent selection for non-pleiotropy in flowering and maturity. Our QTL mapping analyses using the experimental population revealed novel loci that acted in a non-pleiotropic manner: R1-1 controlled primarily flowering and R8-1 and R8-2 controlled maturity, while R1-1 overlapped with QTL, affecting other agronomic traits. Our results suggest that pleiotropy in flowering and maturity can be genetically separated, while artificial selection during soybean domestication and diversification may have favored pleiotropic loci such as E loci that control both flowering and maturity. The non-pleiotropic loci identified in this study will help to identify valuable novel genes to optimize soybean’s life history traits and to improve soybean’s yield potential under diverse environments and cultivation schemes.

1. Introduction

Genetic pleiotropy, correlation among traits due to genes that possess pleiotropic roles or the linkage of multiple genes, is known to have a major impact on the multi-trait evolution of organisms. Neutral theories and evolutionary models suggest that pleiotropy is a cause of evolutionary constraints, preventing organisms from evolutionary progress [1,2]. In contrast, recent genome-wide observations indicate that pleiotropy promotes the evolution of complexity [3,4]. Crop domestication provides a unique opportunity to dissect the effects of pleiotropy on multi-trait evolution. Intense selection by humans during crop domestication and diversification processes causes rapid and directional changes in a set of traits, typically including non-seed shattering, reduced branching, apical dominance, large fruit or grain size, and synchronized flowering, which is known as the domestication syndrome [5]. However, much remains unknown about the extent of pleiotropy among domestication-related traits and its consequences in the evolution of crop species.
Cultivated soybean (Glycine max) is considered to be domesticated from its wild ancestor Glycine soja approximately 6000 to 9000 years ago [6,7]. Preceding the domestication event, recent discoveries suggest a prolonged period of low intensity management or semi-domestication of wild soybeans at multiple locations in East Asia [8]. Compared with its ancestor, G. max shows reduced pod dehiscence, branching and lodging, larger seeds, and more synchronized flowering and maturation. A handful of genes that are implicated in soybean domestication, diversification, and improvement processes have been identified. Among them, three genes are thought to have played central roles at the early stage of soybean domestication: SHAT1-5 controlling pod dehiscence [9,10], GmHs1-1 controlling seed hardness [11], and GmFT2c controlling photoperiodic flowering [12].
An emphasis of soybean domestication and diversification was selection for plants adapted to regional photoperiods that confines soybean varieties carrying differing photoperiod sensitivities for flowering and maturity to specific latitudinal boundaries [13,14]. Several QTL controlling diversity in flowering and maturity among cultivated soybean varieties have been identified: the maturity loci E1E10 and J [15,16]. The E1 locus encodes a transcription factor carrying a B3 domain [17], E2 is an ortholog of the Arabidopsis flowering regulator GIGANTEA [18], and E3 and E4 are homologs of the photoreceptor PHYTOCHROME A (PHYA) [19,20]. Recently, additional maturity loci E9 and J are identified as the FLOWERING LOCUS T homolog GmFT2a [21] and the circadian clock gene EARLY FLOWERING 3 [22], respectively. Major maturity loci are observed to affect both flowering and maturity in a highly correlated manner [23,24]: early flowering is associated with early maturity, while late flowering is associated with late maturity, suggesting that the pleiotropy of these loci controlling both flowering and maturity may have been a limiting factor for the diversification of soybean’s life cycle in breeding programs.
In order to dissect the effects of pleiotropy in the evolution of flowering and maturity control in soybean, in this study, we conducted a selection experiment by creating a population from a cross between G. max and G. soja that underwent stringent selection for non-pleiotropy in flowering and maturity, and carried out QTL mapping analysis to identify novel loci that independently control flowering or maturity in a non-pleiotropic manner.

2. Materials and Methods

2.1. Mapping Population

The initial cross between the G. max reference variety Williams 82 (Maturity group III) and the G. soja accession PI 549046 (Maturity group III) was made in 1996 (Figure 1). The F1 plants were backcrossed to Williams 82 in 1997, and the BC1F1 plants were grown in 1998. From the 3000 BC1F2 plants, approximately 60 plants were selected based on agronomic appearance similar to Williams 82. From the 60 BC1F3 lines, 87 plants out of 17 BC1F3 lines with the best agronomic appearance similar to Williams 82 were selected in 2000. In the BC1F4 generation, nine lines that showed agronomic appearance similar to Williams 82 were selected and bulk harvested. These lines were grown in the field, and phenotypes were observed in 2001 and 2002. In order to identify non-pleiotropic loci that control either flowering or maturity independently unlike the known major maturity loci that control both flowering and maturity in a highly pleiotropic manner, our selection scheme in this study targeted a type of non-pleiotropy affecting flowering but not maturity. We selected the lines LG01-7909 and LG01-7919 that flowered 10 to 12 days later and matured 7 to 13 days earlier than Williams 82 in 2001, and flowered 9 to 11 days later and matured 11 to 12 days earlier than Williams 82 in 2002. In 2003, these two BC1F5 lines were backcrossed again to Williams 82, and the BC2F1 plants were grown in the following winter in Puerto Rico. These populations were advanced through single-seed descent from the F2 to the F4 generation. In the BC2F4 generation, 109 plants were harvested from the population derived from the LG01-7909 parent, and 79 plants were harvested from the population derived from the LG01-7919 parent, and a single plant was harvested from each row in 2007. From the 166 BC2F5 rows planted in 2008, a total of 115 inbred lines in the maturity date range of 12 days (18–30 September) were selected for the mapping population, consisting of 68 recombinant inbred lines (RILs) from the LG01-7909 pedigree and 47 RILs from the LG01-7919 pedigree.

2.2. Field Evaluation

The BC2F6 RILs, the parent line Williams 82, and maturity checks (IA2023 and LD00-3309) were evaluated at Urbana and Stonington, Illinois in 2009 and at Urbana, Villa Grove, Bellflower, and Stonington, Illinois in 2010. All field plots were four rows wide with 0.76 m spacing and 3.1 m long and were planted at a rate of 30 seeds per meter. At all locations and in both years, the lines were planted in a randomized complete block design with two replications. The phenotype data collected include flowering date (R1), which was recorded when approximately 50% of the plants had at least one flower [25], plant maturity date (R8), which was recorded when approximately 95% of the pods had reached mature pod color [25], plant lodging scored at maturity based on a 1 to 10 scale (1 = all plants are erect, 10 = all plants are prostrate), plant height (cm) measured from the soil surface to the top node of the main stem and seed yield (kg ha−1) recorded at 13% moisture, and a stem vininess score between 1 (typical indeterminate cultivar) and 5 (viney stem termination). The 115 BC2F6 RIL population was divided by maturity based on the data collected in 2008. Lines that matured between 18 and 24 September were blocked together (Maturity set 1) and those that matured between 25 and 30 September were blocked together (Maturity set 2) for further analysis.

2.3. Statistical Analysis of Phenotypic Data

Statistical analysis of phenotypic distribution and multiple factor analysis (MFA) were carried out using R scripts. Box plots were created using the Psych package [26] and multiple factor analysis (MFA) was conducted using the FactominR package [27]. Correlation analysis was conducted in R.

2.4. Genotyping

A total of 1536 single nucleotide polymorphisms (SNPs) from the 1536 Universal Soy Linkage Panel (USLP 1.0) [28] was used for genotyping assay. A single leaf from a single plant was collected for each line between 30 and 40 days after sowing. DNA samples from 115 BC2F6 RILs and Williams 82 were obtained using the DNeasy Plant Mini kit (QIAGEN), and genotyping was carried out using the Illumina GoldenGate® Assay [29] by Perry Cregan at USDA-ARS, Maryland.
The E1 alleles were genotyped as described previously [30], and the SNP marker BARC-056323-14257 was genotyped via the direct sequencing of fragments amplified by polymerase chain reaction using the primers 5′-ACCATCATTGTTGTGAACCCTAC-3′ and 5′-AACGTCATCCACTTGAAACTTGG-3′.

2.5. SNP Selection

SNPs of interest were selected using Illumina’s Genome Studio® 1.0. SNPs with low call numbers (below 5%) or no segregation in our mapping population were excluded. In addition, SNPs for which both parents shared the same allele type were removed. Of the 1536 SNPs genotyped, 545 were selected for quantitative trait loci (QTL) mapping (Table S1).

2.6. QTL Mapping

Marker distances and linkages were calculated using the Kosambi function in JoinMap® 4.0 with a minimum logarithm of the odds (LOD) threshold of 3.0. QTL analysis was conducted using composite interval mapping (CIM) in the software Windows QTL Cartographer 2.5 [31]. Stepwise selection was used to identify background co-factors in the model. For CIM, a 1000-iteration permutation test was performed for all traits to generate a genome-wide critical alpha of 0.05. To control the background marker effect, a window size of 1cM was employed.

2.7. Candidate Gene Identification

The physical locations of significant flowering and maturity SNPs were compared with a list of flowering-related genes and previously identified flowering and maturity QTL (http://soybase.org/). Candidate genes were called if they were located within 500 kb of QTL-associated SNPs.

2.8. Plant Growth Condition

The flowering time and maturation time measurement of the BC3F2 population was conducted in the greenhouse during November through February under a moderate short-day photoperiod (12 h light) with supplementary white fluorescence light. Highest temperatures during the day ranged between 24.0 and 26.5 °C, and lowest temperatures in the evening ranged between 20.0 and 22.5 °C.

3. Results

3.1. Selection for Non-Pleiotropy

The G. max reference variety Williams 82 and the G. soja accession PI 549046 were used as the parents to create the mapping population evaluated in this study (Figure 1). PI 549046 was one of the lines selected from four Chinese provinces that were genetically the most distinct from cultivated soybean [32]. Mimicking the domestication and diversification processes of soybean, two backcrosses to Williams 82 were performed after the initial cross between Williams 82 and PI 549046, and plants that showed agronomic appearance similar to Williams 82 in traits such as lodging, height, and stem vininess were selected through multiple generations. As an attempt to identify non-pleiotropic loci, we implemented a selection scheme for a type of non-pleiotropy that affects flowering but not maturity; in the BC1F5 generation, we selected the lines LG01-7909 and LG01-7919 that flowered significantly later but matured moderately earlier than Williams 82 in both 2001 and 2002. These lines were backcrossed again to Williams 82 (BC2) and advanced to the F5 generation. Then, we further selected lines that showed a maturity time similar to Williams 82, resulting in a total of 115 BC2F5 RILs with a narrow maturity range of 12 days. Strong positive correlation was observed in all comparisons between different locations for each trait, Maturity set, and year (Figure S1), except for height in Urbana and Stonington in Maturity set 2 in 2009, which appeared marginal (p = 0.088).

3.2. Phenotypic Distribution

The 115 BC2F6 RIL population was used for phenotyping at multiple field locations: Urbana and Stonington, Illinois in 2009 and Urbana, Villa Grove, Bellflower, and Stonington, Illinois in 2010. All traits displayed a strong yearly and/or location effect in the distribution (Figure 2a,b). The values of flowering time (R1) were distributed in a wider range than that of maturity (R8). Flowering ranged from 39.8 to 68.5 days with a mean of 55.6 days in 2009, and from 18.0 to 41.3 days with a mean of 31.8 days in 2010. Maturity ranged from 118.8 to 133.5 days with the mean of 126.0 days in 2009, and from 102.5 to 120.0 days with the mean of 111.9 days in 2010. The interquartile ranges of R1 and stem vining were above the mean value of Williams 82 in each year, whereas the interquartile ranges of R8 and yield were below Williams 82.
Aiming at identifying loci that affect flowering in a non-pleiotropic manner, the 115 RILs were divided into two sets for further analysis based on their maturity: early maturity (Maturity set 1; n = 64) and late maturity (Maturity set 2; n = 51). The phenotypic distribution differed significantly between maturity sets 1 and 2 in flowering, maturity, and height (Figure 2c); a difference of 4.6 days in flowering (p = 2.12 × 10⁻⁷), 4.8 days in maturity (p = 8.19 × 10⁻²⁷), and 9.2 cm in height (p = 1.48 × 10⁻³). In contrast, lodging, stem vining, or yield did not differ between maturity sets 1 and 2. No significant difference in phenotypic distribution was observed between the LG01-7909 progenies (Subpopulation 1; n = 68) and the LG01-7919 progenies (Subpopulation 2; n = 47) in any traits.

3.3. Multiple Factor Analysis (MFA)

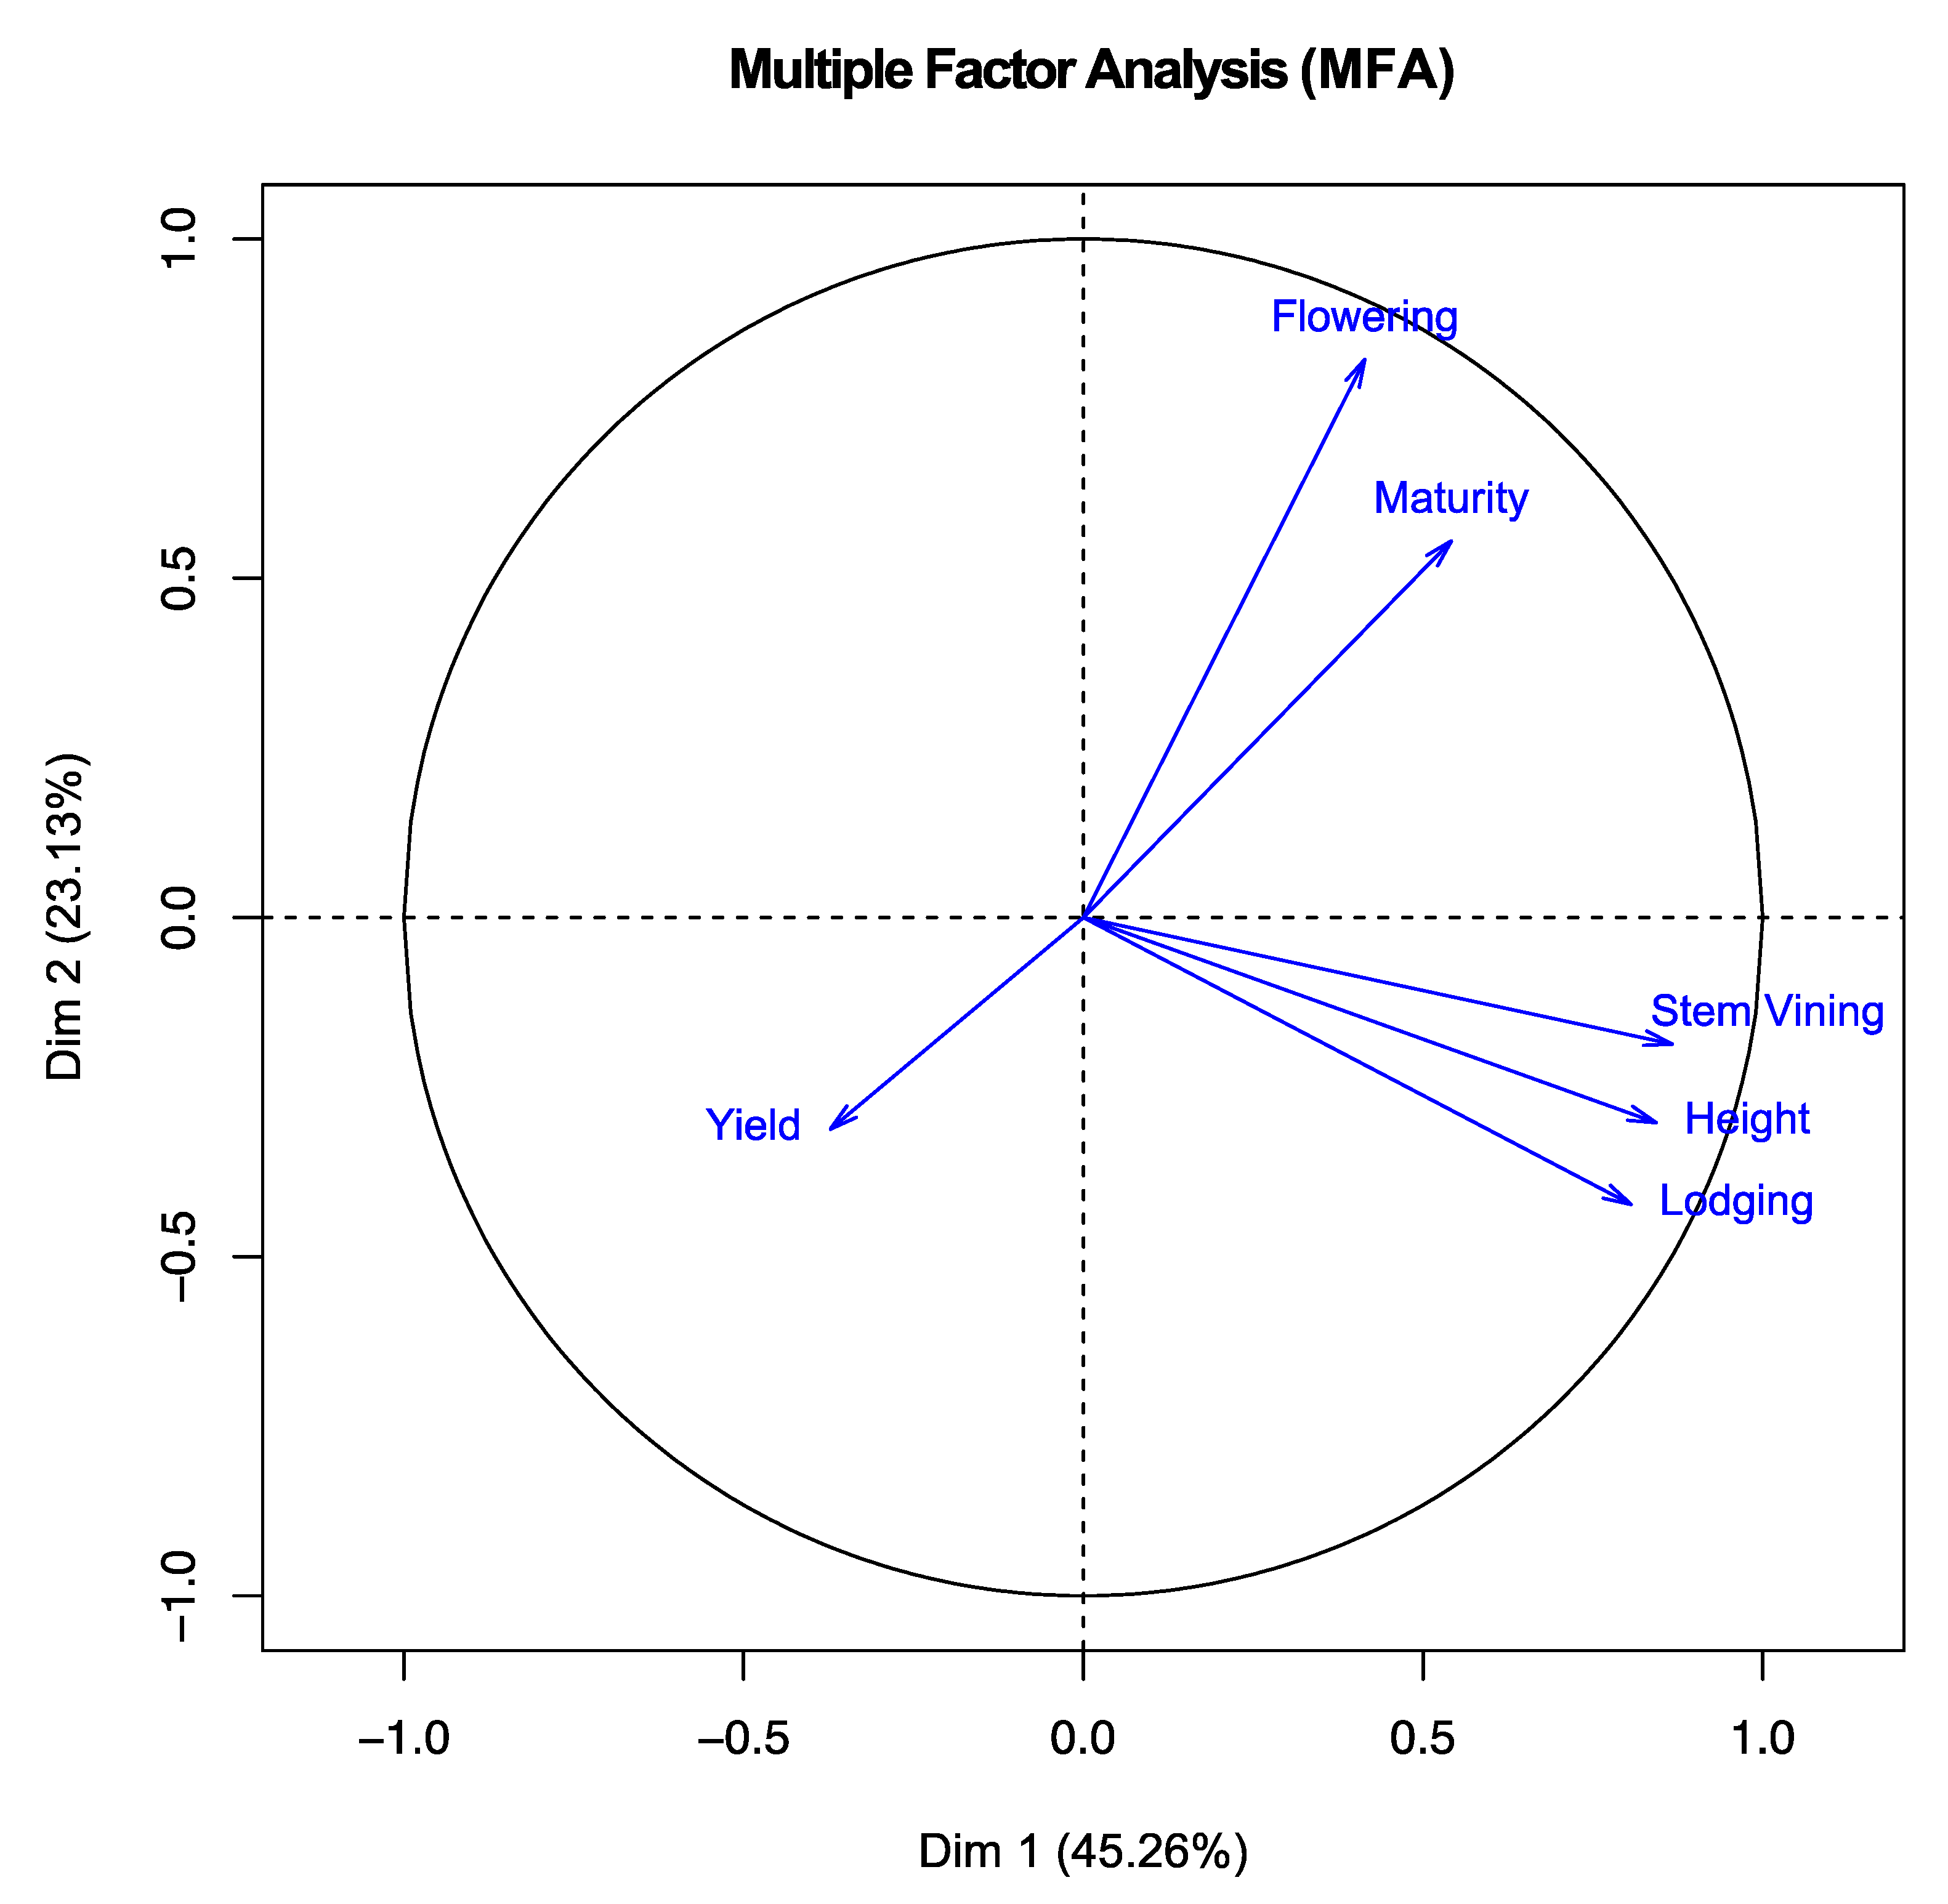
Multiple factor analysis (MFA) further demonstrated the different relationship among the traits (Figure 3). Dimensions 1 and 2 explain 45.3% and 23.1% of the total variation, respectively, and Dimension 3 makes up 16.7%. The traits are observed to cluster into three groups. Height, stem vining, and lodging cluster together and make up major components in Dimension 1 (0.84, 0.80, and 0.86, respectively) (Figure 3; Table 1), while flowering and maturity times are represented together in Dimension 2 (0.82 and 0.56, respectively), consistently with the previous implication regarding the highly correlated behavior of maturity loci in flowering and maturity [23,24,33,34]. Finally, yield is the primary component in Dimension 3 (0.83).

3.4. Construction of Linkage Map

Genetic linkage maps were constructed for this mapping population, resulting in 30 linkage groups with 335 SNP markers spanning 846 cM (Figure S2). Marker locations were generally consistent with the Universal Soy Linkage Panel 1.0 [29]; however, we found that chromosomes 1, 5, 6, 7, 12, 13, 14, and 16 were divided into two or three linkage groups in our maps. This is likely caused by the two backcrosses to Williams 82 and intense selection, limiting the number of SNP markers segregating in the population. On average, each linkage group contained 12 markers with a mean distance of 3.6 cM between the nearest markers. Extensive segregation distortion was observed, resulting in G. soja alleles being substantially underrepresented for many markers in our population. Each RIL possessed approximately 3–20% of SNP markers homozygous for G. soja alleles (Table S1). Linkage group 7a contained the highest percentage of markers homozygous for G. soja alleles at 64%, and linkage group 12a contained the least at 1.3%.

3.5. QTL Mapping

Composite interval mapping (CIM) analysis was carried out on both the data in its entirety and separately for each year (2009 and 2010), location (Urbana 2009, Stonington 2009, Urbana 2010, Bellflower 2010 and Villa Grove 2010), subpopulation, (Subpopulation 1 and Subpopulation 2) and maturity set (Maturity set 1 and Maturity set 2). In total, our analysis has uncovered 19 QTL distributed throughout 6 traits (Figure 4; Table 2). One QTL was found for flowering, two were found for maturity, two were found for height, two were found for yield, seven were found for lodging, and five were found for stem vining. Most of these QTL were found in specific locations or subpopulations.
The QTL R1-1 on chromosome 9 was significantly associated with flowering (R1). This QTL explains 26% of the flowering variation observed and is centered on the SNP marker BARC-056323-14257 with an LOD score of 4.10 and an additive effect of 6.41. Despite the late flowering parent lines BC1F5 LG01-7909 and LG01-7919 that were selected for the second backcrossing, this result indicates that the G. soja allele confers earlier flowering than the G. max allele, which is potentially due to epistatic interactions with other loci in the genome.
Two QTL, R8-1 and R8-2, were associated with maturity (R8) and located near the markers BARC-041649-08056 and BARC-015067-02556 on chromosomes 13 and 18, respectively. R8-1 explains 32% of the variation observed with an LOD score of 5.88. R8-2 explains 17% of the variation observed with an LOD score of 3.14. The additive effects of R8-1 and R8-2 are −1.31 and −1.18, respectively, with the G. soja allele conferring faintly later maturation than the G. max allele.
Two QTL, HT-1 and HT-2, were associated with height and located near the markers BARC-056323-14257 and BARC-040851-07854 on chromosomes 9 and 11, respectively. HT-1 explains 10% of the variation observed with an LOD score of 3.15. HT-2 explains between 15% and 26% of the variation observed with a LOD score between 4.92 and 5.48. The additive effects of HT-1 and HT-2 are above 8.29 with both G. soja alleles conferring a large reduction in height.
Two QTL, YD-1 and YD-2, were associated with yield and located near BARC-014395-01348 and BARC-060195-16470, respectively, both on chromosome 18. YD-1 explains 15% of the variation observed with an LOD score of 4.71. YD-2 explains 13% of the variation observed with an LOD score of 3.77. The additive effects for YD-1 and YD-2 are 3.83 and 3.60, respectively, with the G. soja allele conferring a reduction in yield.
Seven QTL were associated with lodging, locating on chromosomes 9, 11, 13, 14, and 16. R2 values ranged from 13% to 20%, with LD-7 explaining the highest percentage of the variation at 20%. LOD scores spanned between 3.18 and 5.36, with LD-3 showing the strongest peak. The additive effects of QTL associated with lodging range between −0.52 and 1.39, with the majority of G. soja allele conferring a decline in lodging. LD-4 and LD-6 are the exceptions to this trend.
Five QTL were associated with stem vining, locating on chromosomes 2, 6, 9, 11, and 14. R2 values ranged from 9% to 24% variation explained, with SV-1 showing the highest value. LOD scores were spread between 2.90 and 4.96, with SV-5 showing the strongest peak. The additive effects of QTL affecting stem vining ranged from −0.42 to 1.36. With the exception of SV-5, all G. soja alleles confer a reduction in stem vining.

3.6. Pleiotropic QTL and Verification

Unlike the pleiotropic E loci, the flowering QTL R1-1 identified in this study did not overlap with the maturity QTL R8-1 and R8-2, nor with previously reported maturity QTL (Figure 4; Table 2). However, the R1-1 locus overlapped with the QTL controlling other agronomic traits: HT-1 and LD-2, co-localizing on chromosome 9. We found another cluster of QTL controlling multiple traits: HT-2, LD-3, and SV-4 on chromosome 11.
To verify the QTL identified in this study, previously reported QTL listed in SoyBase (http://soybase.org/) were compared with the locations of our QTL. QTL for flowering (R1-1), height (HT-1 and HT-2), and yield (YD-1 and YD-2) identified in this study, as well as one of maturity QTL (R8-2) and 3 of lodging QTL (LD-1, LD-3 and LD-6), overlapped with previously reported QTL (Figure 4; Table 3). The stem vining QTL SV-1 overlaps with the QTL TH-C for twinning habit [35], but none of the other stem vining QTL has been previously reported. To verify our QTL controlling flowering or maturity, we compared their locations with those of known flowering gene homologs [8]. Two genes homologous to Phytochrome E (PHYE) and TFL1/FT that are known to play a role in flowering control in Arabidopsis are located within the close range of the flowering QTL R1-1 (Figure 4; Table 4). In addition, one of the maturity QTL, R8-1, appears to be in the vicinity of homologs of the flowering-related genes SRF6 and SPA3.
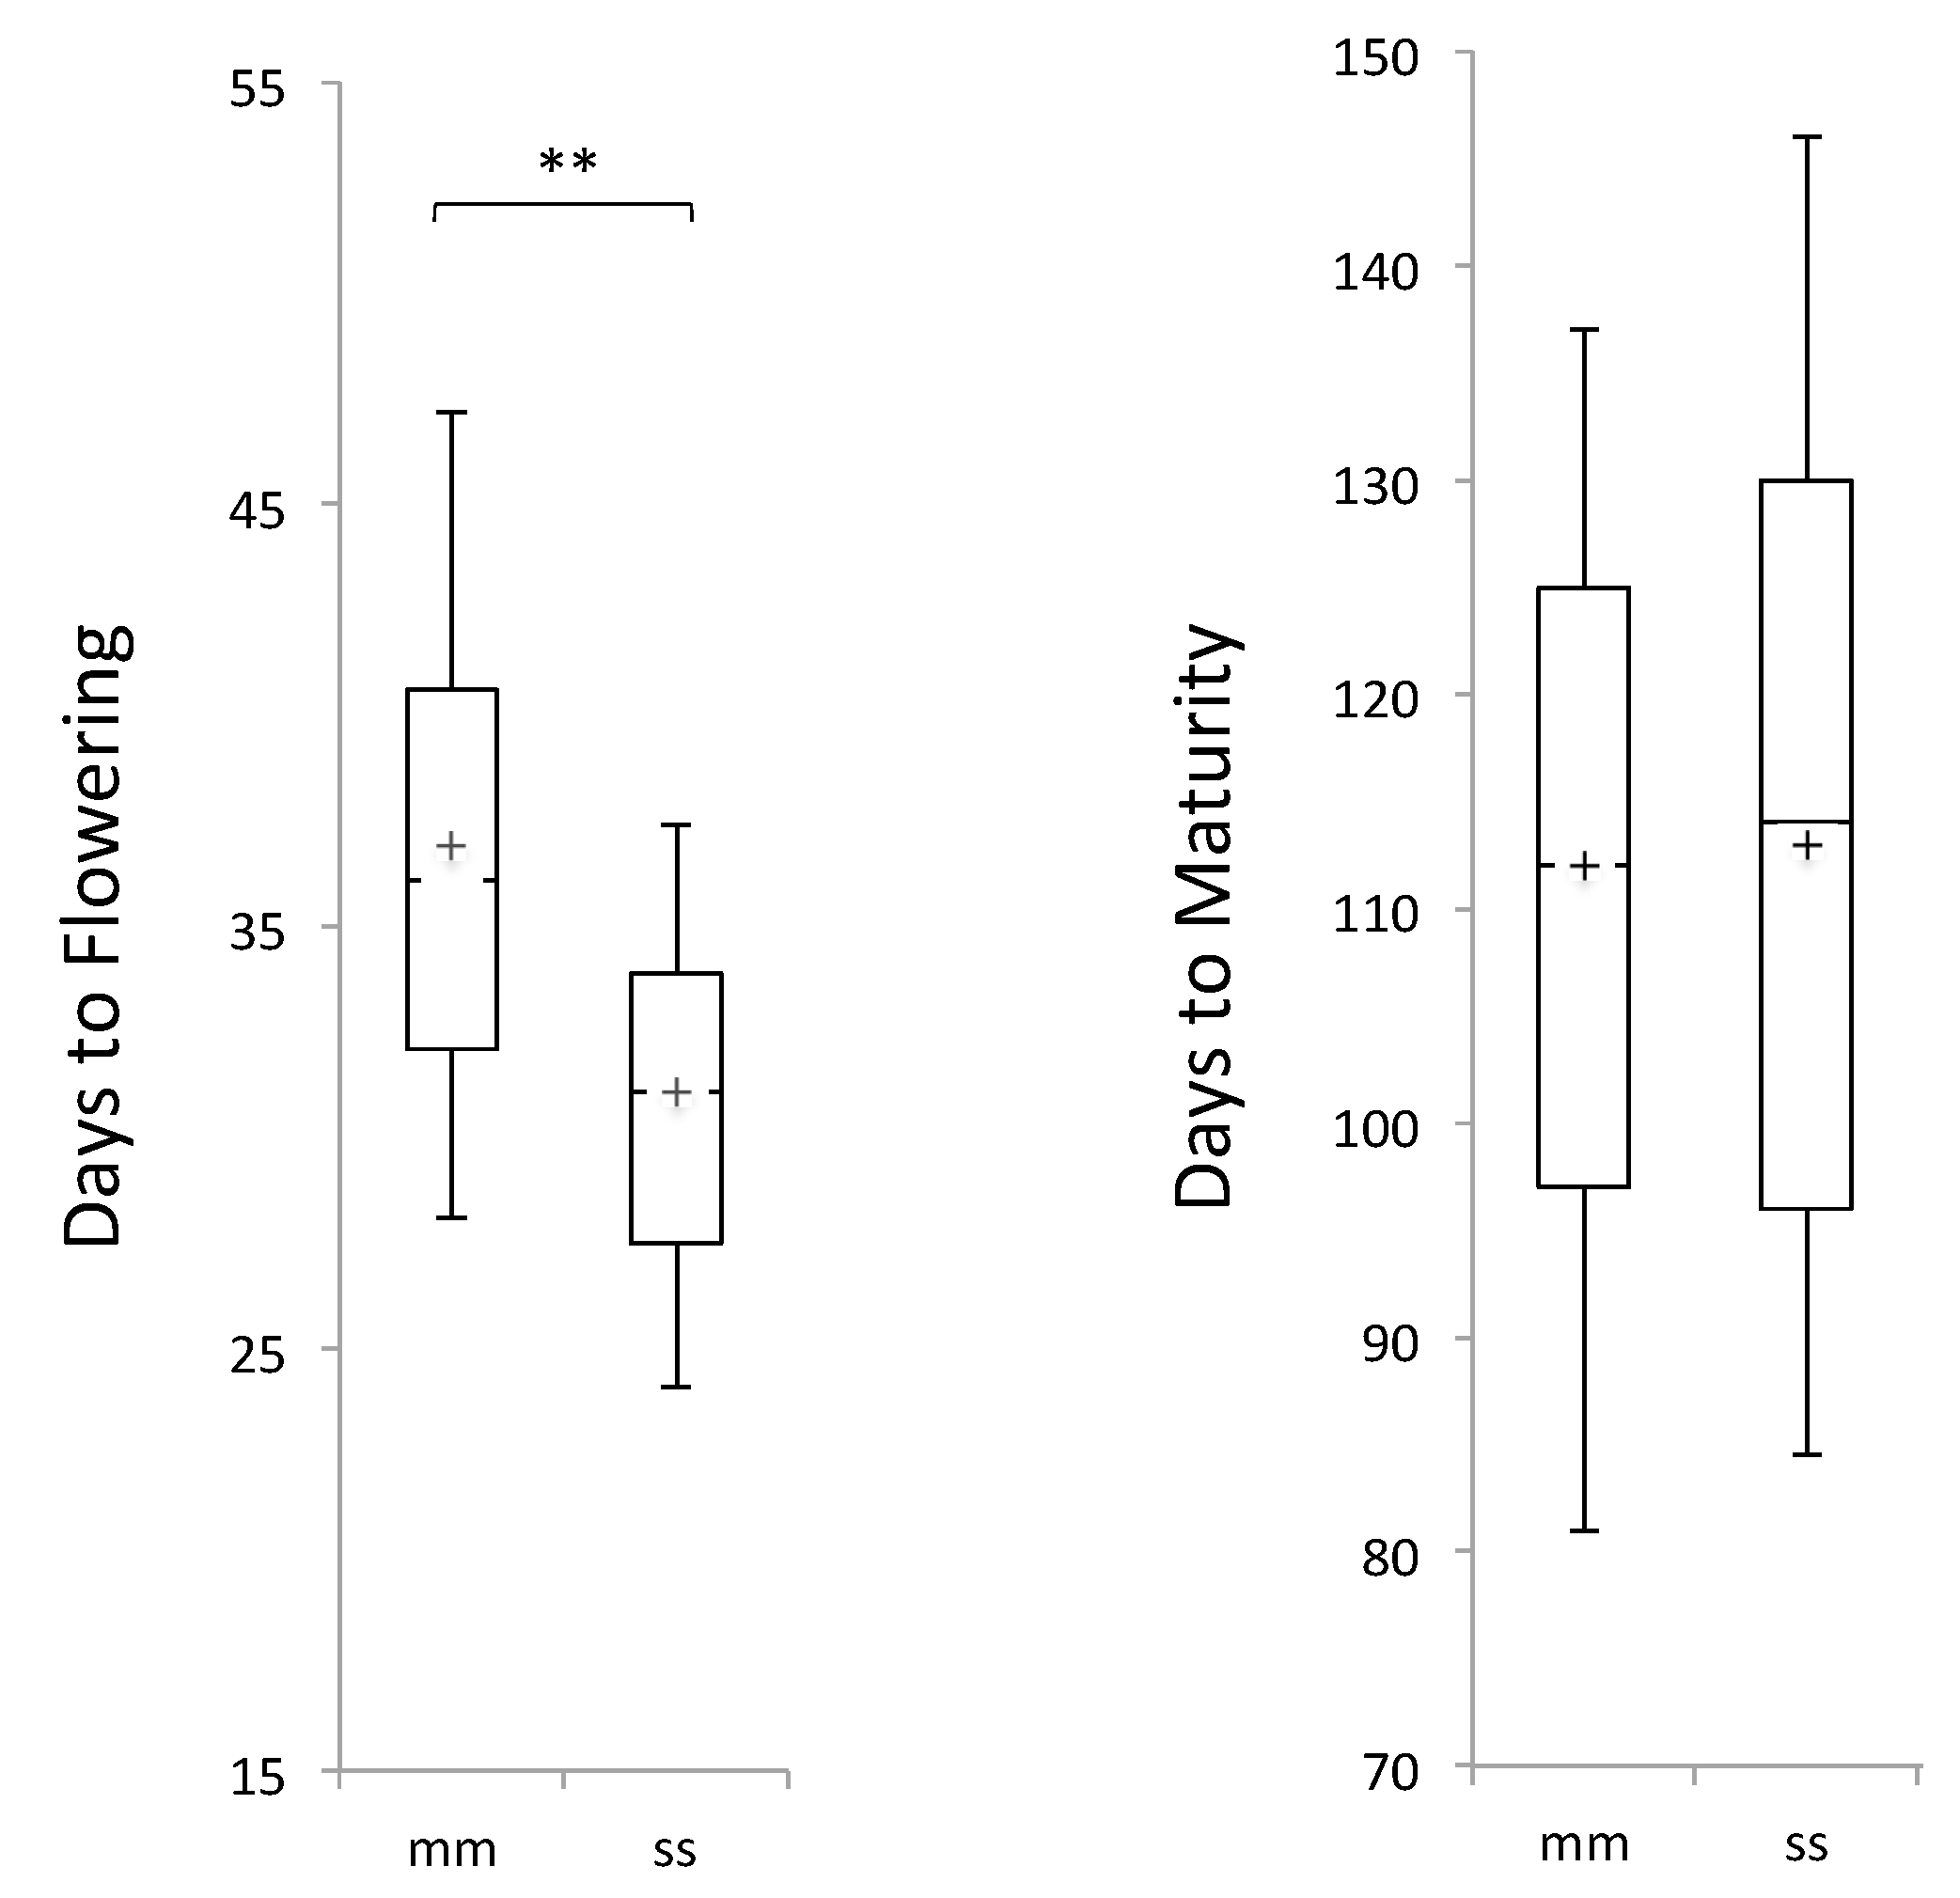
To provide further verification for the flowering QTL R1-1, the RIL LG08-7379 carrying the G. soja allele of the peak marker BARC-056323-14257 was backcrossed with Williams 82. In the F2 population, the plants carrying the homozygous G. soja allele at the marker flowered earlier than the plants carrying the homozygous G. max allele by 5.8 days (p < 0.01), while the maturation time of these plants was statistically indifferent (Figure 5).

4. Discussion

Pleiotropy is considered to have significant implications for multi-trait evolution. In this study, we focused on the key domestication-related traits flowering and maturity that were known to behave in a highly correlated manner in domesticated soybean. Our selection experiment for non-pleiotropy resulted in a different evolutionary trajectory from that of soybean domestication. Our QTL mapping analysis using the experimental populations did not identify the E loci that were selected during soybean domestication and improvement, but it did identify novel loci affecting either flowering or maturity in a non-pleiotropic manner. This result suggests that artificial selection during the soybean domestication and diversification processes favored pleiotropic loci over non-pleiotropic loci in the evolution of flowering and maturity control, despite the fact that genetic variations in the wild progenitor that allow diverse patterns of life history are available.
In addition to flowering and maturity, pleiotropy likely played an important role in the evolution of multiple agronomic traits. A previous study reported a QTL on chromosome 11 in a mapping population derived from G. max parents that affected flowering, maturity, height, and lodging, and as well as another QTL on chromosome 6 that affected flowering, height, and lodging [36]. The latter locus maps near the known major maturity locus E1. The E1 locus has also been identified in multiple mapping populations derived from a cross between G. max and G. soja parents, and it affects several agronomic traits [35,37]. Our QTL mapping did not identify this locus, which was likely due to the selection for non-pleiotropy between flowering and maturity. Indeed, we found zero lines in Subpopulation 2 and only 2 homozygous and 1 heterozygous lines in Subpopulation 1 carrying the G. soja E1 allele (Table S2), suggesting that our selection scheme effectively purged pleiotropic loci such as E1 from the population. In addition, segregation distortion may have played a role in removing certain G. soja alleles, including E1, from the population. Multiple studies have reported segregation distortion in mapping populations derived from a cross between G. max and G. soja that results in disproportionally low percentages of G. soja alleles at heterologous segregating loci [35]. The causes of segregation distortion are yet to be clarified, but in our selection scheme, it is possible that selection for agronomic appearance while advancing generations through single seed descent, as well as selection for a narrow maturity range at the BC2F5 stage, may have skewed the proportion of G. soja alleles. Despite the strict selection scheme for agronomic appearance and segregation distortion, our QTL mapping found two genomic locations controlling multiple agronomic traits (Figure 4), suggesting the prevalence of pleiotropy among loci controlling agronomic traits. It has been reported that artificial selection during domestication causes rapid evolutionary changes [38]. Selection for prevalent pleiotropic loci may have accelerated the evolution of cultivated soybean during the domestication and diversification processes.
While our selection experiment successfully identified non-pleiotropic novel loci, it allowed only a small fraction of genetic variation subjected to the QTL mapping analysis due to our selection scheme and the biparental nature of our mapping population. In addition, the relatively small size of our mapping population may have limited the power of QTL mapping. Future experiments to follow-up this work include parallel evolutionary experiments under different selection regimes using expanded mapping populations created from diverse parental varieties in G. max and G. soja. The use of a larger mapping population, as well as a gentler selection scheme for agronomic appearance would also help maintain the level of G. soja alleles in a mapping population.
Another limitation of our experiment is that it does not assess the magnitude of factors other than pleiotropy that account for phenotypic evolution, nor their interaction with pleiotropy. For example, artificial selection toward pleiotropic loci may be in part a result of widespread epistatic interactions in the genome, which are shown to have a prominent effect on narrowing the evolutionary path [39]. Moreover, the possibility in which pleiotropy was favored as an indirect result of selection for gene-by-environment effects that eliminates alleles sensitive to environmental variants cannot be ruled out, as genetic loci that exhibit phenotypic robustness to diverse environments are shown to have a tendency to affect multiple traits [38]. Indeed, several QTL identified in this study appeared under specific years or locations.

5. Conclusions

This study represents one of the first attempts to experimentally dissect the roles of pleiotropy in the multi-trait evolution of crops. Our work demonstrates that pleiotropy in flowering and maturity can be genetically separated. Non-pleiotropic loci identified in this work provide novel genetic resources for soybean breeding programs and ultimately allow the diversification of soybean’s growth habit and life history optimized for regional environments and different cultivation strategies.

Supplementary Materials

The following are available online at https://www.mdpi.com/2073-4395/10/8/1204/s1. Figure S1: Phenotype correlation between different field sites; Figure S2: Complete linkage map; Table S1: SNP alleles in the mapping population; Table S2: E1 alleles in the mapping population.

Author Contributions

Y.H. designed research. E.J.S., A.A., A.V., S.A. and A.K. carried out experiments and analyzed the data. E.J.S. and Y.H. wrote the manuscript. All authors have read and agreed to the published version of the manuscript.

Funding

This work was supported by the Plant Genome Research Program from the National Science Foundation (NSF-IOS-PGRP-1823145) to Y.H.

Acknowledgments

We thank Randall L. Nelson (USDA-ARS, Urbana) for providing with the mapping population.

Conflicts of Interest

The authors declare no conflict of interest. The funders had no role in the design of the study; in the collection, analyses, or interpretation of data; in the writing of the manuscript, or in the decision to publish the results.

References

  1. Kimura, M.; Ohta, T. On some principles governing molecular evolution. Proc. Natl. Acad. Sci. USA 1974, 71, 2848–2852. [Google Scholar] [CrossRef] [Green Version]
  2. Ohta, T.; Gillespie, J.H. Development of neutral and nearly neutral theories. Theor. Popul. Biol. 1996, 49, 128–142. [Google Scholar] [CrossRef] [Green Version]
  3. Wagner, G.P.; Kenney-Hunt, J.P.; Pavlicev, M.; Peck, J.R.; Waxman, D.; Cheverud, J.M. Pleiotropic scaling of gene effects and the ‘cost of complexity. Nature 2008, 27, 470–472. [Google Scholar] [CrossRef]
  4. Wang, Z.; Liao, B.-Y.; Zhang, J. Genomic patterns of pleiotropy and the evolution of complexity. Proc. Natl. Acad. Sci. USA 2010, 107, 18034–18039. [Google Scholar] [CrossRef] [PubMed] [Green Version]
  5. Hammer, K. Das domestikationssyndrom. Die Kult. 1984, 32, 11–34. (In German) [Google Scholar] [CrossRef]
  6. Carter, T., Jr.; Hymowitz, T.; Nelson, R. Biogeography, local adaptation, Vavilov, and genetic diversity in soybean. In Biological Resources and Migration; Springer: Berlin/Heidelberg, Germany, 2004; pp. 47–59. [Google Scholar]
  7. Kim, M.Y.; Van, K.; Kang, Y.J.; Kim, K.H.; Lee, S.-H. Tracing soybean domestication history: From nucleotide to genome. Breed. Sci. 2012, 61, 445–452. [Google Scholar] [CrossRef] [PubMed] [Green Version]
  8. Sedivy, E.J.; Wu, F.; Hanzawa, Y. Soybean domestication, the origin, genetic architecture and molecular bases. New Phytol. 2017, 214, 539–553. [Google Scholar] [CrossRef] [PubMed] [Green Version]
  9. Dong, Y.; Yang, X.; Liu, J.; Wang, B.-H.; Liu, B.-L.; Wang, Y.-Z. Pod shattering resistance associated with domestication is mediated by a NAC gene in soybean. Nat. Commun. 2014, 5, 1–11. [Google Scholar] [CrossRef] [PubMed] [Green Version]
  10. Funatsuki, H.; Suzuki, M.; Hirose, A.; Inaba, H.; Yamada, T.; Hajika, M.; Komatsu, K.; Katayama, T.; Sayama, T.; Ishimoto, M.; et al. Molecular basis of a shattering resistance boosting global dissemination of soybean. Proc. Natl. Acad. Sci. USA 2014, 111, 17797–17802. [Google Scholar] [CrossRef] [PubMed] [Green Version]
  11. Sun, L.; Miao, Z.; Cai, C.; Zhang, D.; Zhao, M.; Wu, Y.; Zhang, X.; Swarm, S.A.; Zhou, L.; Zhang, Z.J.; et al. GmHs1-1, encoding a calcineurin-like protein, controls hard-seededness in soybean. Nat. Genet. 2015, 47, 939–943. [Google Scholar] [CrossRef] [PubMed]
  12. Wu, F.; Sedivy, E.J.; Price, W.B.; Haider, W.; Hanzawa, Y. Evolutionary trajectories of duplicated FT homologues and their roles in soybean domestication. Plant J. 2017, 90, 941–953. [Google Scholar] [CrossRef] [PubMed] [Green Version]
  13. Cober, E.R.; Morrison, M.J. Regulation of seed yield and agronomic characters by photoperiod sensitivity and growth habit genes in soybean. Theor. Appl. Genet. 2010, 120, 1005–1012. [Google Scholar] [CrossRef] [PubMed]
  14. Kim, M.Y.; Shin, J.H.; Kang, Y.J.; Shim, S.R.; Lee, S.-H. Divergence of flowering genes in soybean. J. Biosci. 2012, 37, 857–870. [Google Scholar] [CrossRef] [PubMed]
  15. Cao, D.; Takeshima, R.; Zhao, C.; Liu, B.; Jun, A.; Kong, F. Molecular mechanisms of flowering under long days and stem growth habit in soybean. J. Exp. Bot. 2017, 68, 1873–1884. [Google Scholar] [CrossRef] [PubMed] [Green Version]
  16. Samanfar, B.; Molnar, S.J.; Charette, M.; Schoenrock, A.; Dehne, F.; Golshani, A. Mapping and identification of a potential candidate gene for a novel maturity locus, E10, in soybean. Theor. Appl. Genet. 2017, 130, 377–390. [Google Scholar] [CrossRef] [PubMed]
  17. Xia, Z.; Watanabe, S.; Yamada, T.; Tsubokura, Y.; Nakashima, H.; Zhai, H.; Anai, T.; Sato, S.; Yamazaki, T.; Lu, S.; et al. Positional cloning and characterization reveal the molecular basis for soybean maturity locus E1 that regulates photoperiodic flowering. Proc. Natl. Acad. Sci. USA 2012, 109, E2155–E2164. [Google Scholar] [CrossRef] [Green Version]
  18. Watanabe, S.; Xia, Z.; Hideshima, R.; Tsubokura, Y.; Sato, S.; Yamanaka, N.; Takahashi, R.; Anai, T.; Tabata, S.; Kitamura, K. A map-based cloning strategy employing a residual heterozygous line reveals that the GIGANTEA gene is involved in soybean maturity and flowering. Genetics 2011, 188, 395–407. [Google Scholar] [CrossRef] [Green Version]
  19. Liu, B.; Kanazawa, A.; Matsumura, H.; Takahashi, R.; Harada, K.; Abe, J. Genetic redundancy in soybean photoresponses associated with duplication of the phytochrome A gene. Genetics 2008, 180, 995–1007. [Google Scholar] [CrossRef] [Green Version]
  20. Watanabe, S.; Hideshima, R.; Xia, Z.; Tsubokura, Y.; Sato, S.; Nakamoto, Y.; Yamanaka, N.; Takahashi, R.; Ishimoto, M.; Anai, T. Map-based cloning of the gene associated with the soybean maturity locus E3. Genetics 2009, 182, 1251–1262. [Google Scholar] [CrossRef] [Green Version]
  21. Zhao, C.; Takeshima, R.; Zhu, J.; Xu, M.; Sato, M.; Watanabe, S.; Kanazawa, A.; Liu, B.; Kong, F.; Yamada, T.; et al. A recessive allele for delayed flowering at the soybean maturity locus E9 is a leaky allele of FT2a, a FLOWERING LOCUS T ortholog. BMC Plant Biol. 2016, 16, 20. [Google Scholar] [CrossRef] [Green Version]
  22. Lu, S.; Zhao, X.; Hu, Y.; Liu, S.; Nan, H.; Li, X.; Fang, C.; Cao, D.; Shi, X.; Kong, L.; et al. Natural variation at the soybean J locus improves adaptation to the tropics and enhances yield. Nat. Genet. 2017, 49, 773–779. [Google Scholar] [CrossRef] [PubMed]
  23. Nelson, R.L. Response to Selection for Time of Flowering in Soybean. Crop Sci. 1988, 623–626. [Google Scholar] [CrossRef]
  24. Smith, J.R.; Nelson, R.L. Selection for Seed-Filling Period in Soybean. Crop Sci. 1986, 26, 466–469. [Google Scholar] [CrossRef]
  25. Fehr, W.R.; Caviness, C.E.; Burmood, D.T.; Pennington, J.S. Stage of development descriptions for soybeans, Glycine max (L.) Merrill. Crop Sci. 1971, 11, 929–931. [Google Scholar] [CrossRef]
  26. Revelle, W. An Overview of the Psych Package. Department of Psychology, Northwestern University. 2017. Available online: http://personality-project.org/r/overview.pdf (accessed on 1 July 2017).
  27. Pagès, J. Multiple Factor Analysis, Main Features and Application to Sensory Data. Agrocampus Ouest, Rennes, France. Available online: http://factominer.free.fr/more/PagesAFM.pdf (accessed on 1 April 2016).
  28. Hyten, D.L.; Cannon, S.B.; Song, Q.; Weeks, N.; Fickus, E.W.; Shoemaker, R.C.; Specht, J.E.; Farmer, A.D.; May, G.D.; Cregan, P.B. High-throughput SNP discovery through deep resequencing of a reduced representation library to anchor and orient scaffolds in the soybean whole genome sequence. BMC Genom. 2010, 11, 38. [Google Scholar] [CrossRef]
  29. Hyten, D.L.; Song, Q.; Choi, I.Y.; Yoon, M.S.; Specht, J.E.; Matukumalli, L.K.; Nelson, R.L.; Shoemaker, R.C.; Young, N.D.; Cregan, P.B. High-throughput genotyping with the GoldenGate assay in the complex genome of soybean. Theor. Appl. Genet. 2008, 116, 945–952. [Google Scholar] [CrossRef] [Green Version]
  30. Wu, F.; Kang, X.; Wang, M.; Haider, W.; Price, W.B.; Hajek, B.; Hanzawa, Y. Transcriptome-enabled network inference revealed the GmCOL1 feed-forward look and its roles in photoperiodic flowering of soybean. Front. Plant Sci. 2019. [Google Scholar] [CrossRef]
  31. Wang, S.C.; Basten, C.J.; Zeng, Z.-B. Windows QTL Cartographer 2.5. Department of Statistics, North Carolina State University, Raleigh, NC. 2012. Available online: http://statgen.ncsu.edu/qtlcart/WQTLCart.htm (accessed on 1 April 2016).
  32. Li, Z.; Nelson, R.L. RAPD Marker Diversity among Cultivated and Wild Soybean Accessions from Four Chinese Provinces. Crop Sci. 2002, 42, 1737–1744. [Google Scholar] [CrossRef]
  33. McBlain, B.A.; Bernard, R.L. A new gene affecting the time of flowering and maturity in soybeans. J. Hered. 1987, 78, 160–162. [Google Scholar] [CrossRef]
  34. Buzzell, R.V.H. Inheritance of insensitivity to long day length. Soybean Genet. Newsl. 1980, 7, 26–29. [Google Scholar]
  35. Liu, B.; Fujita, T.; Yan, Z.H.; Sakamoto, S.; Xu, D.; Abe, J. QTL mapping of domestication-related traits in soybean (Glycine max). Ann. Bot. 2007, 100, 1027–1038. [Google Scholar] [CrossRef] [PubMed] [Green Version]
  36. Zhang, W.K.; Wang, Y.J.; Luo, G.Z.; Zhang, J.S.; He, C.Y.; Wu, X.L.; Gai, J.Y.; Chen, S.Y. QTL mapping of ten agronomic traits on the soybean (Glycine max, L. Merr.) genetic map and their association with EST markers. Theor. Appl. Genet. 2004, 108, 1131–1139. [Google Scholar] [CrossRef] [PubMed]
  37. Guzman, P.S.; Diers, B.W.; Neece, D.J.; St Martin, S.K.; LeRoy, A.R.; Grau, C.R.; Hughes, T.J.; Nelson, R.L. QTL associated with yield in three backcross-derived populations of soybean. Crop Sci. 2007, 12, 111–122. [Google Scholar] [CrossRef]
  38. Doust, A.N.; Lukens, L.; Olsen, K.M.; Mauro-Herrera, M.; Meyer, A.; Rogers, K. Beyond the single gene, How epistasis and gene-by-environment effects influence crop domestication. Proc. Natl. Acad. Sci. USA 2014, 111, 6178–6183. [Google Scholar] [CrossRef] [PubMed] [Green Version]
  39. Kryazhimskiy, S.; Rice, D.P.; Jerison, E.R.; Desai, M.M. Global epistasis makes adaptation predictable despite sequence-level stochasticity. Science 2014, 344, 1519–1522. [Google Scholar] [CrossRef] [Green Version]
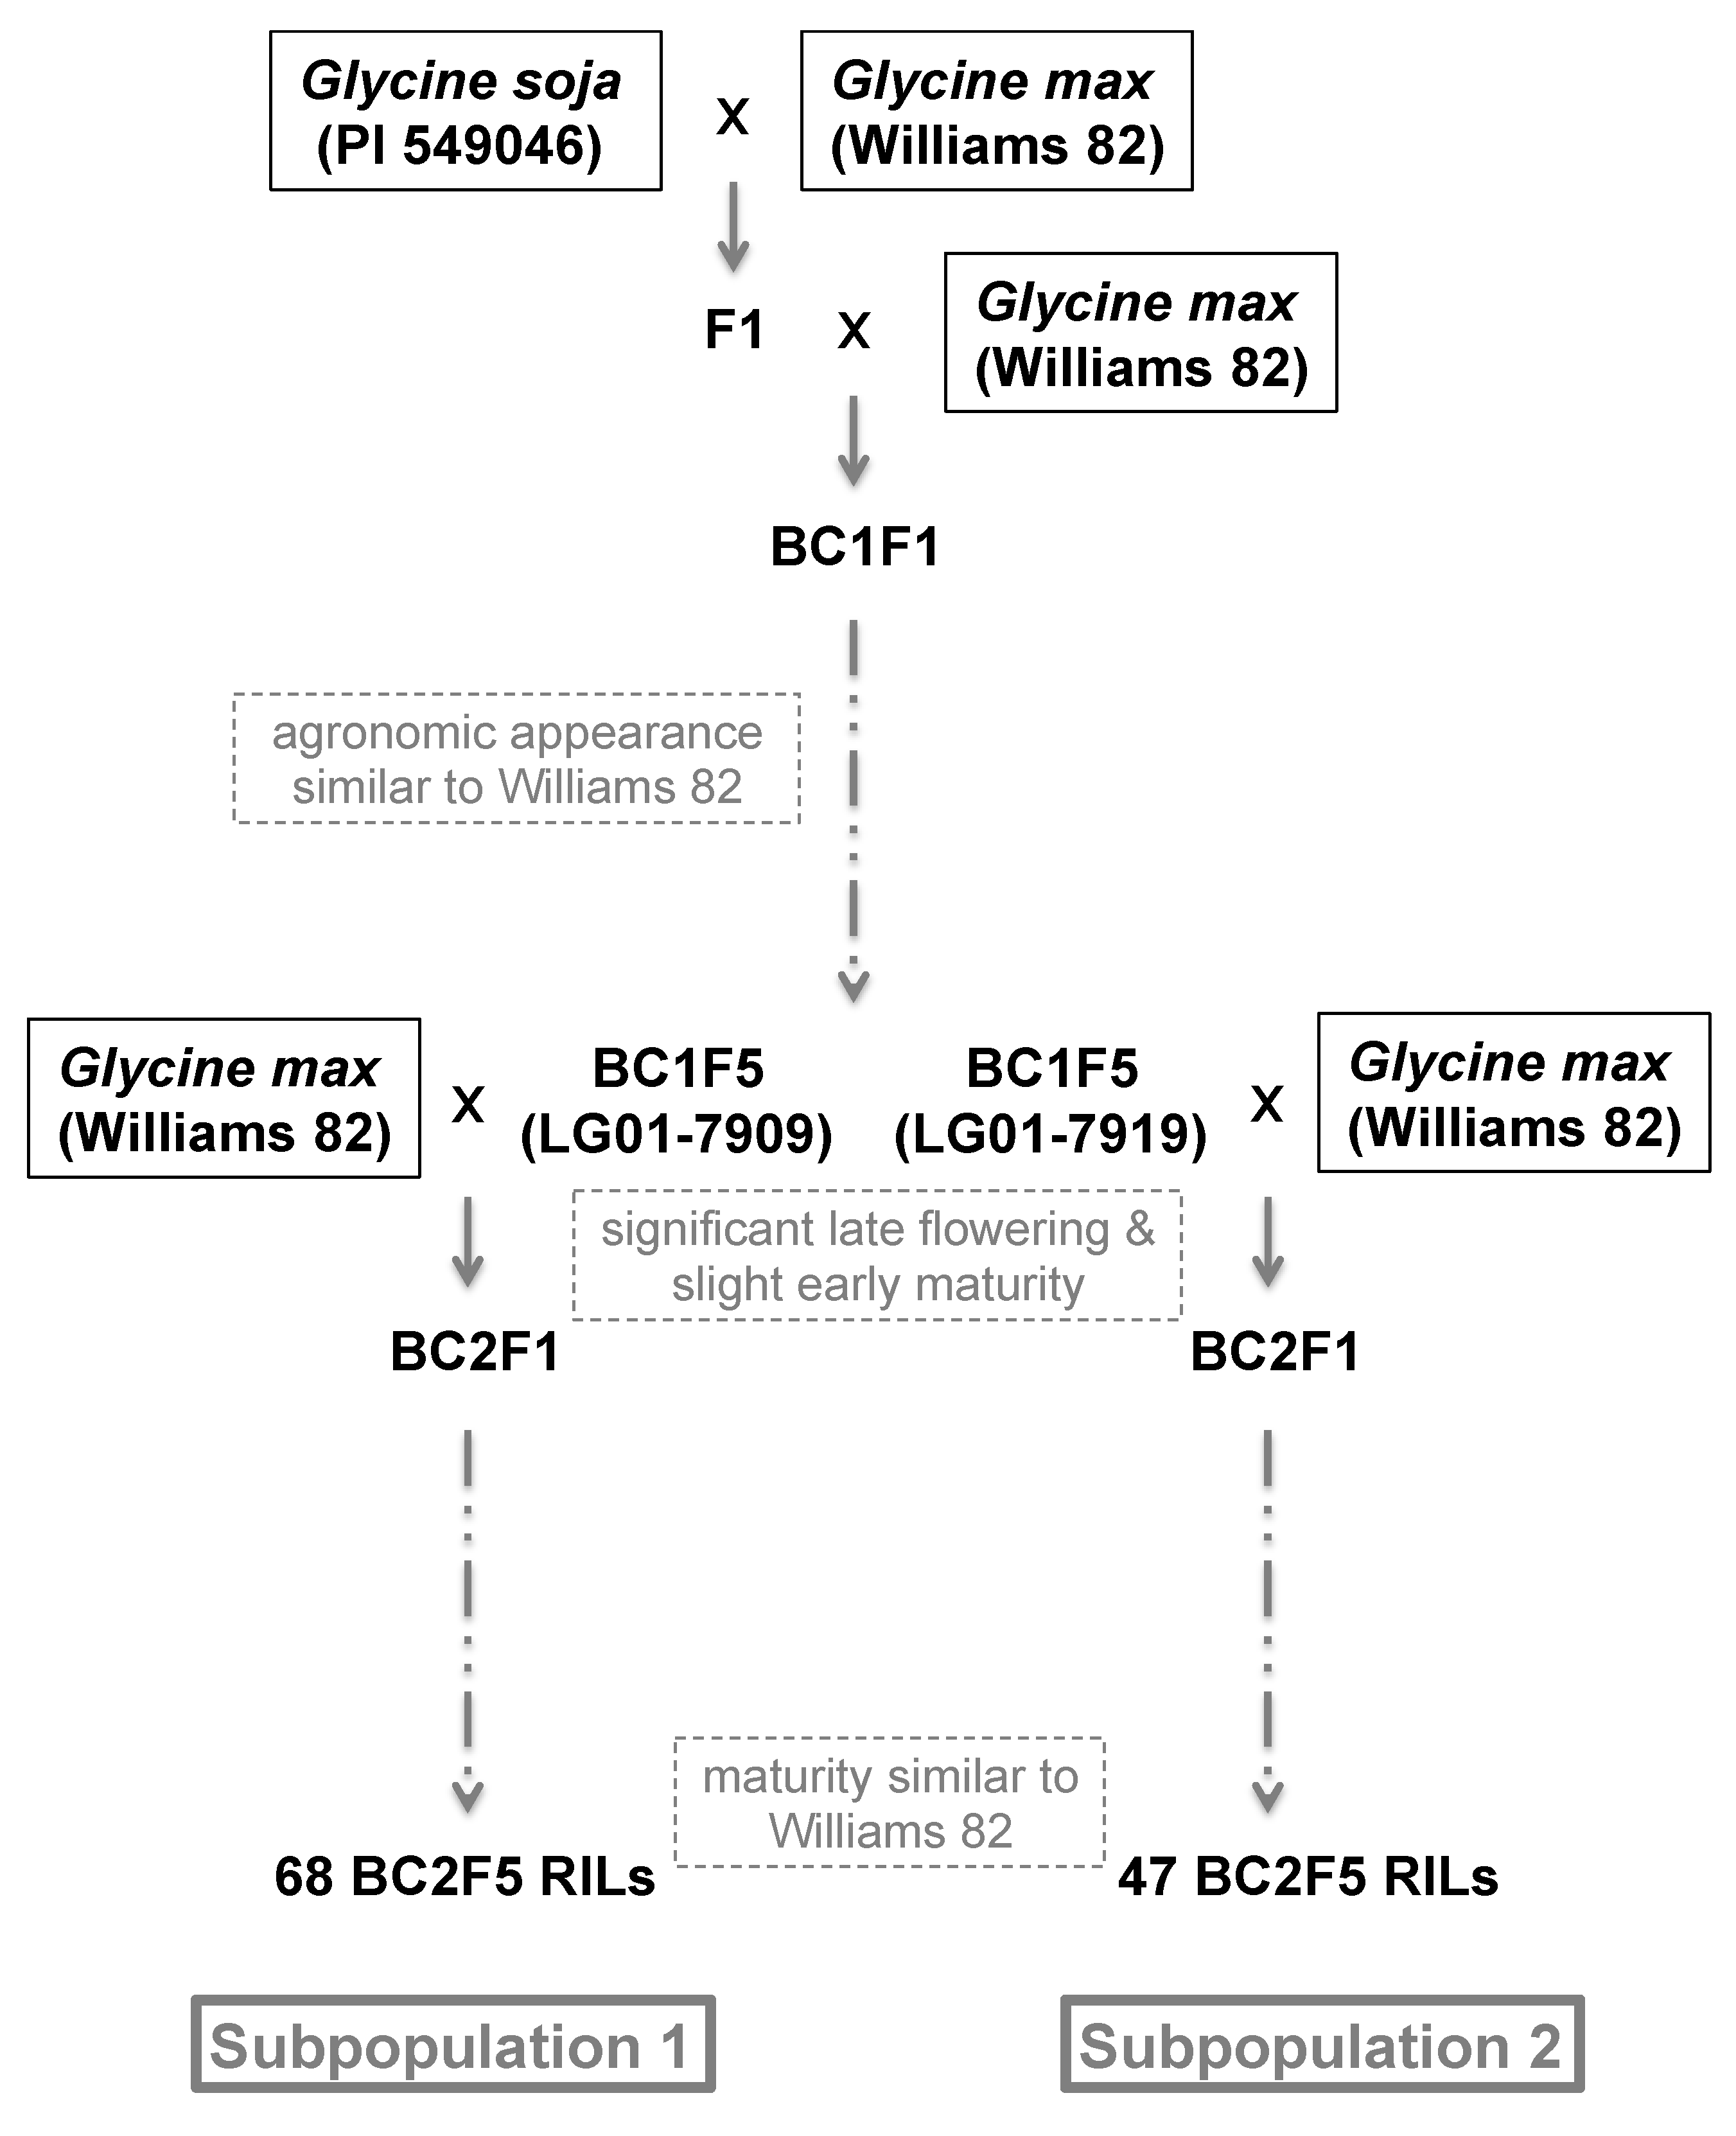
Figure 1. The scheme for mapping population development and selection experiment.
Agronomy 10 01204 g001
Figure 2. Phenotypic distribution in the 115 BC2F6 RIL population by year and by maturity set. (A) Phenotypic distribution in 2009 and 2010 (n = 115). Yield was measured only in 2009. (B) Phenotypic distribution at Bellflower, Stone, Urbana, and Villa Grove field locations. (C) Phenotypic distribution in the early maturity group (Matset1; n = 64) and the late maturity group (Matset2; n = 51). The box indicates the interquartile range, and black circles represent outliers. The black horizontal line indicates the distribution median and the cross indicates the distribution mean. The red horizontal line represents the mean of Williams 82. P-values were obtained using a Student’s T-test. Flowering shows the time when 50% of the plants have at least one flower on any node (R1), and maturity shows when 95% of the seed pods reach full mature color (R8). Lodging is shown in 1–10 scales where 1 represents Williams 82 and 10 reflects lodging in the G. soja parent. Vining is shown in 1–5 scales where 1 is no vining as in Williams 82 and 5 is vining represented by the G. soja parent.
Agronomy 10 01204 g002
Figure 3. Multiple factor analysis (MFA) of phenotypic variation and correlation. The two-dimensional correlation structure among the 115 BC2F6 RILs is demonstrated by MFA. Dimension 1 is represented by the horizontal axis and Dimension 2 is represented by the vertical axis. The blue arrows represent the strength of trait association within a dimension. Dimension 1 accounts for 45.26% of the total variation, and Dimension 2 accounts for 23.13% of the total variation.
Agronomy 10 01204 g003
Figure 4. Quantitative trait loci (QTL) identified in this study. Nine linkage groups harbor QTL for flowering (R1), maturity (R8), height (HT), yield (YD), lodging (LD), and stem vining (SV). QTL for R1 are shown in red, while R8 are in gray, HT are in purple, YD are in light blue, LD are in yellow, and SV are in green. Previously reported QTL that overlap with the QTL identified in this study are represented by white boxes with diagonal lines, and the locations of candidate flowering genes are displayed as horizontal hashed lines. The QTL box represents a one-LOD support interval.
Agronomy 10 01204 g004
Figure 5. Flowering (R1) and maturation (R8) of the QTL R1-1 in the BC3F2 population. The BC2F6 RIL LG08-7379 carrying the G. soja allele of the QTL R1-1 peak marker BARC-056323-14257 was backcrossed with Williams 82. Twenty-eight F2 plants carrying homozygous G. max alleles (mm) and 30 F2 plants carrying homozygous G. soja alleles (ss) were grown in a greenhouse under 12 h light at the average highest day-time temperature 25 °C. The box indicates the interquartile range, the black horizontal line indicates the distribution median, and the cross indicates the distribution mean. ** p < 0.01.
Agronomy 10 01204 g005
Table 1. Eigen vectors of the first three dimensions of variance for each trait identified in multiple factor analysis (MFA) of phenotypic variation and correlation (Figure 3).
TraitDimension 1 (45.3%)Dimension 2
(23.1%)
Dimension 3
(16.7%)
Flowering0.4140.8220.019
Maturity0.5410.5550.500
Height0.842−0.3020.167
Lodging0.806−0.4230.018
Yield−0.372−0.3120.838
Stem Vining0.866−0.186−0.141
Table 2. Peak markers that exhibit the highest association for each quantitative trait locus (QTL) identified in this study. Year/location indicate the datasets in which the QTL is identified. The direction of additive effects indicates the effects of G. max alleles. Units used for phenotype measurement are flowering and maturity in days, height in cm, seed yield in kg ha−1, lodging on a scale of 1 (all plants are erect) to 10 (all plants are prostrate), and a stem vininess on a scale of 1 (typical indeterminate cultivar) to 5 (viney stem termination).
TraitQTLChromosomeYear/LocationPeak MarkerPosition (cM)Position (Mbp)LODR2Additive Effect
Flowering
R1-19matset 2BARC-056323-1425732.2420.994.100.266.41
Maturity
R8-113pop2(7919)BARC-041649-0805621.7633.285.880.32−1.31
R8-218matset2BARC-015067-0255625.042.153.140.17−1.18
Height
HT-19All yearsBARC-056323-1425732.2420.993.150.108.29
92009BARC-056323-1425732.2420.993.150.108.29
HT-211pop1(7909)BARC-040851-078547.007.615.480.2613.87
11Urbana09BARC-040851-078547.007.614.920.1515.13
Yield
YD-118Stone09BARC-014395-0134813.023.444.710.153.83
YD-218Stone09BARC-060195-1647016.320.473.770.133.60
Lodging
LD-19pop1(7909)BARC-028249-0580438.157.473.180.161.08
9Urbana09BARC-028249-0580438.157.473.600.131.39
LD-29Urbana10BARC-056323-1425732.2420.993.590.110.66
LD-3112010BARC-040851-078546.987.615.360.170.94
LD-413matset2BARC-062009-176160.0019.333.640.16−0.52
LD-513matset2BARC-065851-1978925.322.443.720.180.51
LD-614matset2BARC-017933-0245724.7146.133.390.14−0.43
LD-716pop2(7919)BARC-054099-123406.743.563.180.200.43
Stem vining
SV-12Matset2BARC-021647-0416425.8546.044.540.231.36
SV-26VG10BARC-025179-0645510.6250.324.370.160.97
SV-39All yearsBARC-028249-0580438.157.472.900.091.02
92009BARC-028249-0580438.157.472.900.091.02
SV-411pop1(7909)BARC-040851-078546.987.614.960.241.09
11Urbana09BARC-040851-078546.987.614.380.140.99
11Urbana10BARC-040851-078546.987.614.210.130.92
112010BARC-040851-078546.987.613.340.100.85
SV-514Matset2BARC-052759-116114.4010.013.050.14−0.42
Table 3. Previously reported QTL (http://soybase.org/) that overlap with the QTL identified in this study.
TraitQTLChromosomePeak MarkerPreviously
Identified QTL
R1R1-19BARC-056323-14257Fflr 3-4
R8R8-218BARC-015067-02556Pod mat 22-6
HeightHT-19BARC-056323-14257Pl ht 15-1
HT-211BARC-040851-07854Pl ht 24-6
YieldYD-118BARC-014395-01348Sd yld 21-4
YD-218BARC-060195-16470Sd yld 21-4
LodgingLD-19BARC-028249-05804Ldge 11-1
LD-311BARC-040851-07854Ldge 10-1
LD-614BARC-017933-02457Ldge 21-2
Stem viningSV-12BARC-021647-04164TH-C
Table 4. Flowering-related genes in the vicinity of the QTL identified in this study.
QTLChromosomeYear/LocationPeak MarkerGeneID NumberStart Position
R8-113pop2(7919)BARC-041649-08056SPA3Glyma.13g27670037212524
SRF6Glyma.13g24110034503402
R1-19matset 2BARC-056323-14257PHYEGlyma.09g08850011657930
TFL1Glyma.09g14350036559409