Article

Genetic Diversity and Population Structure of Brachiaria (syn. Urochloa) Ecotypes from Uganda

1
National Livestock Resources Research Institute, Nakyesasa, P.O. Box 5704, Kampala, Uganda
2
Biosciences Eastern and Central Africa—International Livestock Research Institute (BecA-ILRI) Hub, P.O. Box 30709, Nairobi 00100, Kenya
3
Rwebitaba Zonal Agricultural Research and Development Institute, P.O. Box 96, Fort-Portal, Uganda
*
Author to whom correspondence should be addressed.
Current address: Centre for Tropical Livestock Genetics and Health (CTLGH), Royal (Dick) School of Veterinary Studies, The University of Edinburgh, Easter Bush, EH25 9RG, UK.
Agronomy 2020, 10(8), 1193; https://doi.org/10.3390/agronomy10081193
Submission received: 15 June 2020 / Revised: 23 July 2020 / Accepted: 1 August 2020 / Published: 14 August 2020

Abstract

:
Brachiaria (syn. Urochloa) grass is an important tropical forage of African origin that supports millions of livestock and wildlife in the tropics. Overgrazing, conversion of grasslands for crop production and non-agricultural uses, and the introduction of improved forages have threatened the natural diversity of Brachiaria grass in Uganda. This study established a national collection of Brachiaria ecotypes in Uganda and analyzed them for genetic diversity and population structure using 24 simple sequence repeats (SSR) markers. These markers had a high discriminating ability with an average polymorphism information content (PIC) of 0.89 and detected 584 alleles in 99 ecotypes. Analysis of molecular variance revealed a high within populations variance (98%) indicating a high gene exchange or low genetic differentiation (PhiPT = 00.016) among the ecotype populations. The Bayesian model based clustering algorithm showed three allelic pools in Ugandan ecotypes. The principal component analysis (PCA) of ecotypes, and Neighbor-joining (NJ) tree of ecotypes and six commercial cultivars showed three main groups with variable membership coefficients. About 95% of ecotype pairs had Rogers’ genetic distance above 0.75, suggesting most of them were distantly related. This study confirms the high value of these ecotypes in Brachiaria grass conservation and improvement programs in Uganda and elsewhere.

1. Introduction

The genus Brachiaria (Trin.) Griseb. (syn. Urochloa) belongs to the tribe Paniceae in the subfamily Panicoideae of the family Poaceae [1]. It consists of about 100 species distributed throughout the tropics especially in Africa [2]. Seven perennial species of African origins—Brachiaria arrecta (Hack. ex. Th. Dur and Schinz) Stent, Brachiaria brizantha (A. Rich.) Stapf., Brachiaria decumbens Stapf, Brachiaria dictyoneura (Fig. and De Not.) Stapf, Brachiaria humidicola (Rendle) Schweick, Brachiaria mutica (Forssk.) Stapf and Brachiaria ruziziensis Germain and Evrard—have been used as fodder plants [3]. All Brachiaria species with known forage values occur naturally in eastern Africa which represents the center of diversity of the genus [3]. These agriculturally important Brachiaria species were introduced to other parts of the world in multiple occasions—e.g., B. decumbens to Australia from Ugandan Department of Agriculture in 1930 [4,5], B. mutica to the Americas during the early colonial period [6] whereas, B. decumbens, B. brizantha, B. ruziziensis, and B. humidicola to the Americas between the 1950s and 1970s [7].
Brachiaria is probably the most widely distributed sown pasture in the tropics [8] with acreage of about 99 million hectares in Brazil alone [9]. Brachiaria is adaptable to a wide range of habitats from swamps and light forest shades to semi-deserts. However, most species are typically found in savannas [2]. Brachiaria grass is appreciated for adaptation to drought and low fertility soils, soil stabilization, carbon sequestration, high efficiency in nitrogen use, and lessening greenhouse gas emission [10,11,12,13,14]. Brachiaria is an ideal forage for improving livestock productivity both for cut-and-carry and grazing systems and yields between 5–36 t/ha [15]. The role of Brachiaria grass in the transformation of livestock agriculture has been well appreciated across the tropics, creating a high demand for improved cultivars adapted to different agroecological zones. Therefore, there is a need to develop Brachiaria cultivars that have superior agronomic traits such as adaptation to different agro-climatic zones, high biomass production, high nutritive values, and resistance to pests and diseases [16,17].
Evaluation of Brachiaria species (B. brizantha, B. decumbens, B. ruziziensis, and B. mutica) for pasture production in Africa started in the 1950s focusing on dry matter yield, nutritive value, agronomic qualities, response to inputs, compatibility with legumes and other crops, and livestock productivity [18]. Despite a broad adaptation, high nutritive value, and positive gains in livestock productivity, the use of Brachiaria grass for pasture production was limited because Brachiaria was less suitable to the main livestock production systems of Africa [18]. The recognition of the forage potential of B. decumbens in Australia in the 1960s stimulated the interest on Brachiaria grass across the tropics, specifically in South America [19,20,21]. The research at International Centre for Tropical Agriculture (CIAT) and the Brazilian Agricultural Research Corporation (Embrapa) on naturally occurring germplasms from Africa have developed several improved Brachiaria cultivars and a few interspecific hybrid cultivars for South America. Over the past few years, some of these cultivars have been evaluated for pasture production in Africa focusing on biomass production, nutritive values, livestock productivity, and adaptation to biotic and abiotic stresses [12,14,22]. Results of evaluations have shown the great potential of some Brachiaria cultivars in Africa to alleviate livestock feed shortage, increase the availability of quality feeds and improve livestock productivity and income of livestock farmers in Africa [12,22,23]. The underlying high agro-ecological diversity in Africa needs Brachiaria cultivars that are suitable for different production environments.
Uganda is an East African country that spans the Northern Hemisphere and the Southern Hemisphere. It accounts for 0.18% of the global terrestrial and freshwater surface and harbors 1.1% of the globally recognized plant species [24] substantiating a high plant species diversity in Uganda. Similarly, Uganda has diverse environmental conditions divided into eleven agroecological zones [25]. In Uganda, Brachiaria grows naturally on communal grazing areas, ranches, government farms, along the roadside and forests. Due to the high palatability of Brachiaria grass compared to most other tropical forages, the native populations are often overgrazed and are in continuous threat of extinction. Due to rapid growth in population, the natural pastures are being converted rapidly to croplands and other non-agricultural uses which present a serious risk of extinction of plant genetic resources including Brachiaria grass. Except CPI 1694, the accession from which the first Brachiaria cultivar Basilisk was derived, no Brachiaria germplasm from Uganda is available in the gene bank at the Consultative Group for International Agricultural Research (CGIAR) and other institutions [3]. Therefore, this study was carried out to establish a nationwide collection of Brachiaria grass ecotypes in Uganda, document natural genetic diversity and population structure, and determine the utility of these ecotypes for Brachiaria conservation and improvement programs. For this study, we used Single Sequence Repeats (SSR) markers for genetic diversity study as they are reported to be highly informative due to their multi-allelic nature, co-dominant inheritance, and wider genomic distribution [26].
These markers are proven to be the most suitable for the genetic diversity studies in Brachiaria grass and other forages [1,18,27,28,29,30,31]. This study has set up a national collection of Brachiaria ecotypes in Uganda, documented natural genetic diversity and population structure of ecotypes, and recognized the merits of these ecotypes in Brachiaria grass conservation and improvement programs.

2. Materials and Methods

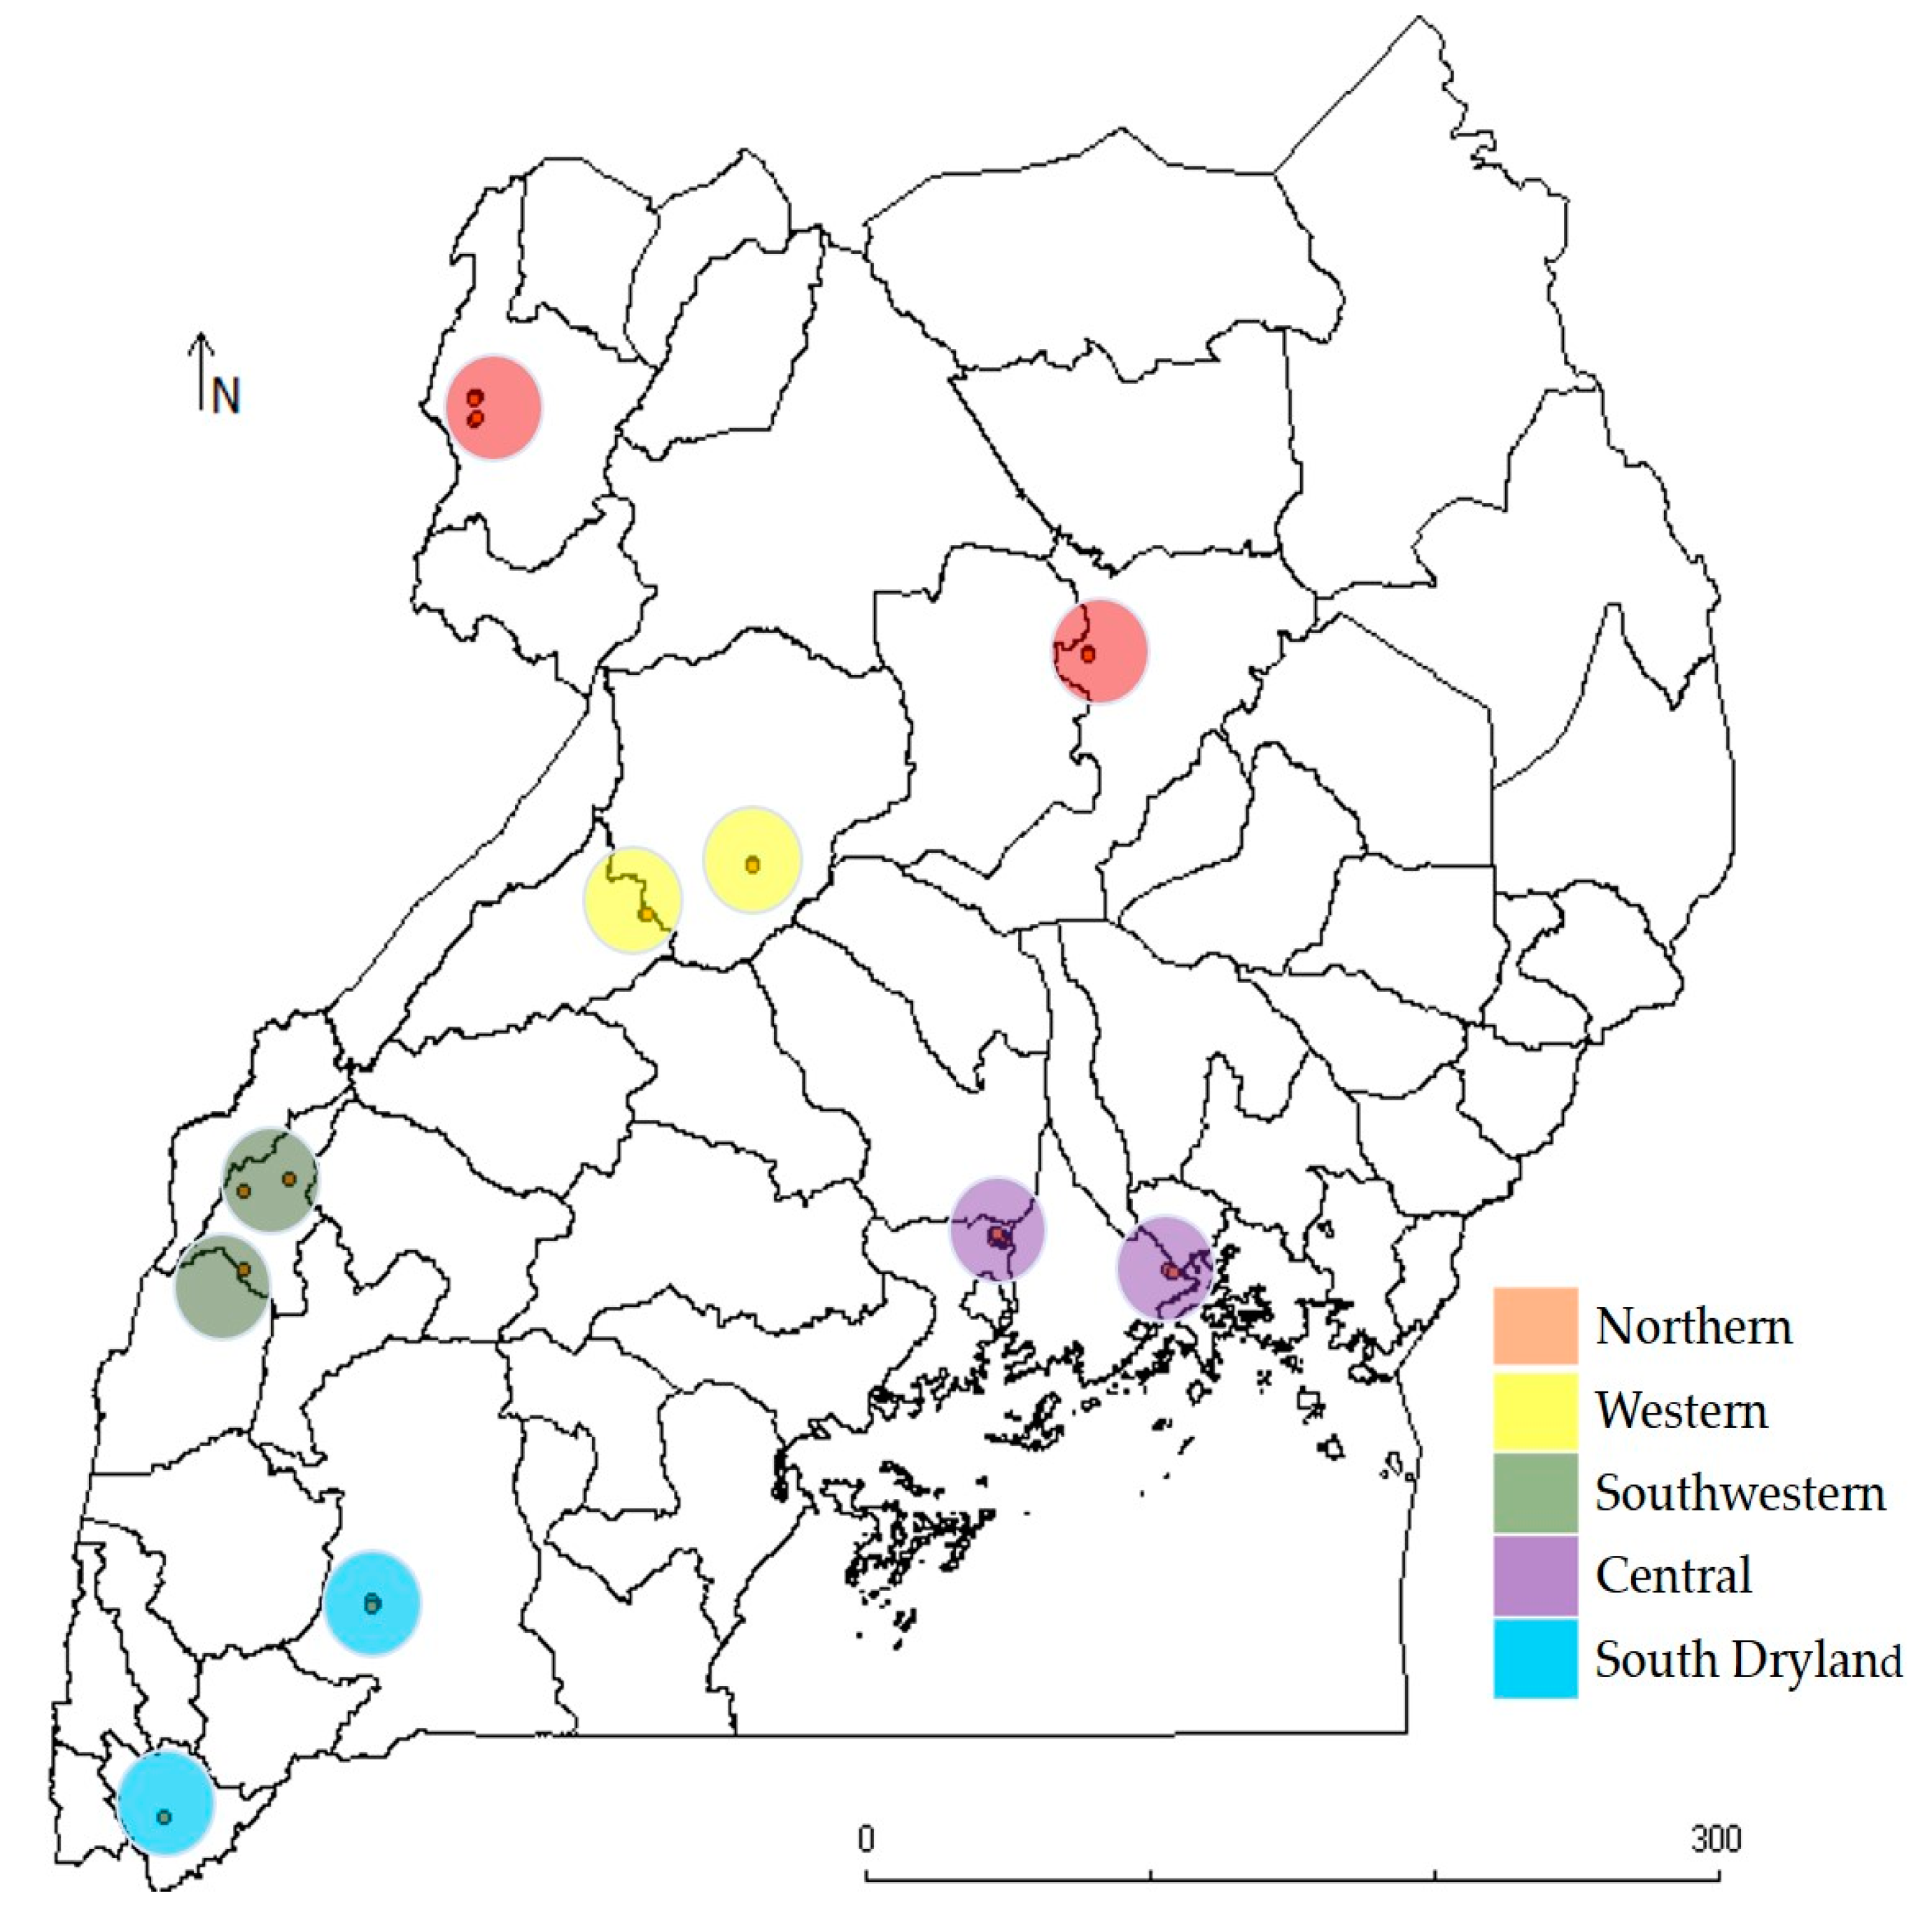
2.1. Source of Plant Materials

A total of 99 Brachiaria grass ecotypes were collected from nine districts (Arua, Fort Portal, Hoima, Kabale, Lira, Masindi, Mbarara, Njeru, and Wakiso) representing five regions (northern, western, southwestern, central and south dryland) (Figure 1) and eight different agroecological zones in Uganda. For each ecotype, 5–10 rooted tillers were collected from a single plant, transported to National Livestock Resources Research Institute (NaLIRRI), Tororo, Uganda, and maintained as a single plant in vegetative field gene bank under the guardianship of NaLIRRI.
The origins and details of ecotype collection sites are presented in Table S1. Two-week old leaves from 2-month old regrowth were collected separately for each ecotype for total genomic DNA extraction. Leaves were put into Ziploc bags and transported in ice chests to the Biosciences eastern and central Africa—International Livestock Research Institute (BecA-IRLI) Hub laboratory in Nairobi, Kenya. Young leaf samples of six commercial cultivars: B. brizantha cv. MG4, B. brizantha cv. Piatã, B. decumbens cv. Basilisk, B. humidicola cv. Humidicola, B. humidicola cv. Llanero, and Brachiaria hybrid Mulato-II were also included in the study. All leaf samples were freeze-dried and stored at −80 °C prior to DNA extraction.

2.2. DNA Extraction

Total genomic DNA was extracted from freeze-dried and ground leaf samples of 99 ecotypes and six commercial cultivars using the Quick-DNA Plant/Seed Miniprep Kit (Zymo Research, Irvine, CA, USA) following the manufacturer’s instructions. DNA concentration and purity were determined using a NanoDrop2000 spectrophotometer (Thermo Fisher Scientific, Waltham, MA, USA). Samples were normalized to a concentration of 20 ng/µL, then run on a 1% agarose-0.5xTBE gel stained with 0.25× GelRed at 100 volts for 45 min and visualized under UV light (UVP Bio-Imaging Systems, Upland, CA, USA) to assess the integrity of DNA.

2.3. PCR Amplification and Capillary Electrophoresis

A total of 24 fluorescent-labeled SSR markers were used for genotyping (Table 1). These markers were initially developed for B. ruziziensis, had high polymorphism information content (PIC) values, and confirmed for transferability to other Brachiaria species [21]. The forward primers were labeled with the fluorescent dyes- 6-FAM, PET, NED, and VIC. Markers used in this study consisted of dinucleotide and trinucleotide repeat motifs. Gradient PCR was carried out for each primer sets and the annealing temperature that gave clear bands was identified for each primer set. Multiplex panels were designed based on annealing temperature and dye label. Each of the eight selected panels consisted of 1–4 sets of primers.
PCR reaction was performed on a total volume of 10 µL using AccuPower® PCR PreMix, negative dye (Bioneer, Daejeon, Korea), 40 ng template DNA, 0.09 µM each of forward and reverse primer, additional 0.5 µM MgCl2, and 7.2 µL triple distilled water. The PCR reaction was performed in a GeneAmp PCR system 9700 thermocycler (Applied Biosystem, Foster City, CA, USA) using the following program: initial denaturation at 95 °C for 3 min, followed by 30 cycles of 30 s at 94 °C, 1 min at optimized annealing temperature for each primer pair, and 2 min at 72 °C for extension. This was followed by 20 min final extension at 72 °C and hold at 15 °C. The PCR products were run on a 2% agarose gel in 0.5x TBE buffer stained with 0.25x GelRed at 6.7 V/cm for 45 min and visualized under UV light. The size of the band was estimated using 1 kb plus ladder.
A cocktail (LH) of 15 µL GeneScan™ -500 LIZ® Size Standard (Applied Biosystems, Foster City, CA, USA) and 1000 µL Hi-Di™ Formamide was prepared for capillary electrophoresis. Multiplexed PCR product (1.5 µL) was mixed with 9 µL of LH, denatured at 95 °C for 3 min, and snapped-chilled for 5 min. The products were submitted to BecA-ILRI Hub’s Sequencing, Genotyping, and Oligonucleotide (SEGOLIP) unit for capillary electrophoresis.

2.4. Allelic Scoring

Allele calling and sizing were performed manually using GeneMapper Software v4.1 (Applied Biosystems, Foster City, CA, USA). The SSR fragments were analyzed following a dominant scoring scheme as the information on ploidy levels for Ugandan ecotypes was not available [29,30,31]. Well defined clear peaks were binned according to expected product size and data was exported to Microsoft Excel for analysis. The allele calls were converted to binary data (0 = absence and 1 = presence of alleles) using ALS-Binary Software [32] for subsequent analyses. Both allelic and binary data were used in the genetic diversity analysis. The SSR genotyping data for the commercial cultivars was used in the construction of neighbor-joining tree only.

2.5. Population Genetic Analyses

The model-based clustering approach implemented in the software package STRUCTURE version 2.3.4 was used to analyze the population structure [33]. To estimate the posterior probabilities (qK), a 100,000 burn-in period was used, followed by 100,000 iterations using a model allowing for admixture and correlated allele frequencies with no prior location or population information. At least 10 independent runs of STRUCTURE were performed by setting K from 1–10 with 15 replicates for each K. The Delta K was calculated for each value of K using the web-based Structure Harvester [34,35]. A line was assigned to a given cluster when the proportion of its genome in the cluster (qK) was higher than a threshold value of 50%.
Matrices of Roger’s genetic distance [36], gene diversity, PIC value, and allele frequency for each locus were calculated between each pair of lines using PowerMarker v3.2.5 [37]. The Pearson correlation coefficient matrix was computed to examine what type of linear relationships of rainfall, altitude, sample size, and the allele frequencies of regional ecotype populations had using XLSTAT software [38]. The genetic distance matrices for ecotypes and six commercial Brachiaria cultivars were used for constructing Neighbor-joining trees using PowerMarker and the resulting trees were visualized using MEGA version 5.0 [39]. Analysis of Molecular Variance (AMOVA) [40,41] was used to partition the variation among and within group (population) components in GenAlEx version 6.5 [42] which enabled the estimation of standardized PhiPT and the allelic patterns across different populations [43]. Significance levels for variance component estimates were computed using 9999 permutations. Principal component analysis (PCA) was performed to visualize similarities and variations among Brachiaria ecotypes from Uganda in DARwin software version 6.0.15 [44].

3. Results

3.1. Microsatellite Diversity and Analysis of Molecular Variance

Twenty-four SSR markers were used for genotyping 99 Ugandan Brachiaria grass ecotypes (Table 1) and six commercial cultivars. These markers detected 584 alleles of different sizes ranging from 111 bp (Br0028) to 358 bp (Br0214) in 99 Ugandan ecotypes (Table 1). The PIC values for these markers ranged between 0.60 (Br0118) and 0.96 (Br0028) with 0.89 average. The analysis of molecular variance (AMOVA) revealed a high contribution of within the population differences (98%) to the total genetic variations, whereas the rest (2%) was contributed by populations’ differences. The genetic differentiation among the ecotype populations (PhiPT) was low (0.016) (Table 2).

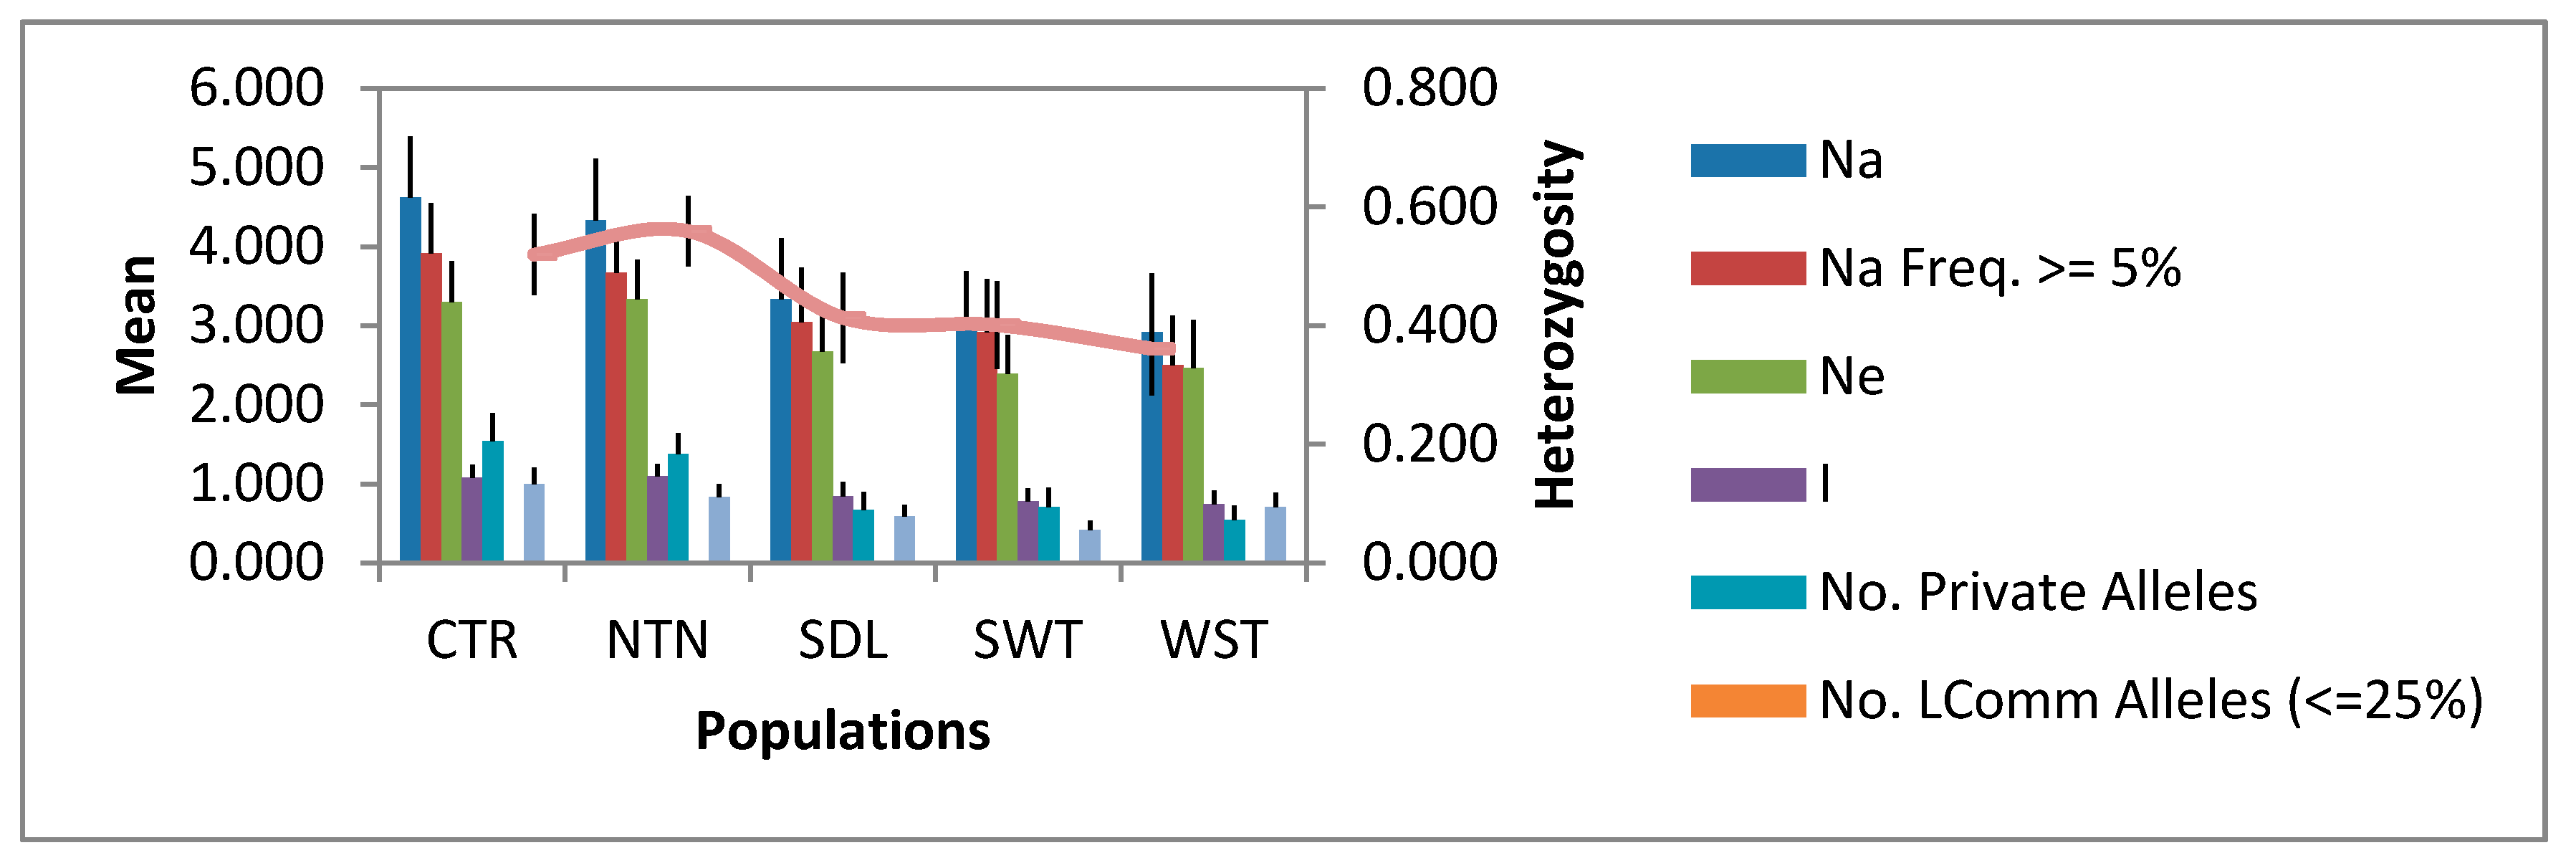
3.2. Allelic Diversity in the Regional Populations

The allelic diversity in five regional populations of Brachiaria ecotypes is presented in Figure 2. The populations varied for mean numbers of different alleles (Na) that ranged from 2.92 (western (WST)) to 4.63 (central (CTR)). Similarly, differences were observed among the populations for the mean number of private alleles (Np) ranging from 0.674 (south dryland (SDL)) to 1.542 (CTR), as well as for the mean number of effective alleles (Ne) which ranged from 2.39 (southwestern (SWT)) to 3.33 (northern (NTN)). We detected the highest mean genetic diversity in NTN population whereas the WST population had the least mean genetic diversity (0.74). The expected heterozygosity (He) of the populations ranged between 0.36 (WST) and 0.56 (NTN).
The Pearson correlation coefficient analysis showed a strongly positive linear relationship between the number of ecotypes in the regional populations and the number of different alleles (r = 0.972; p = 0.006). Similar holds between the sample size and the number of private alleles (r = 0.920; p = 0.027). However, the linear relationships of altitude and rainfall with both Na and Np were negative and non-significant.

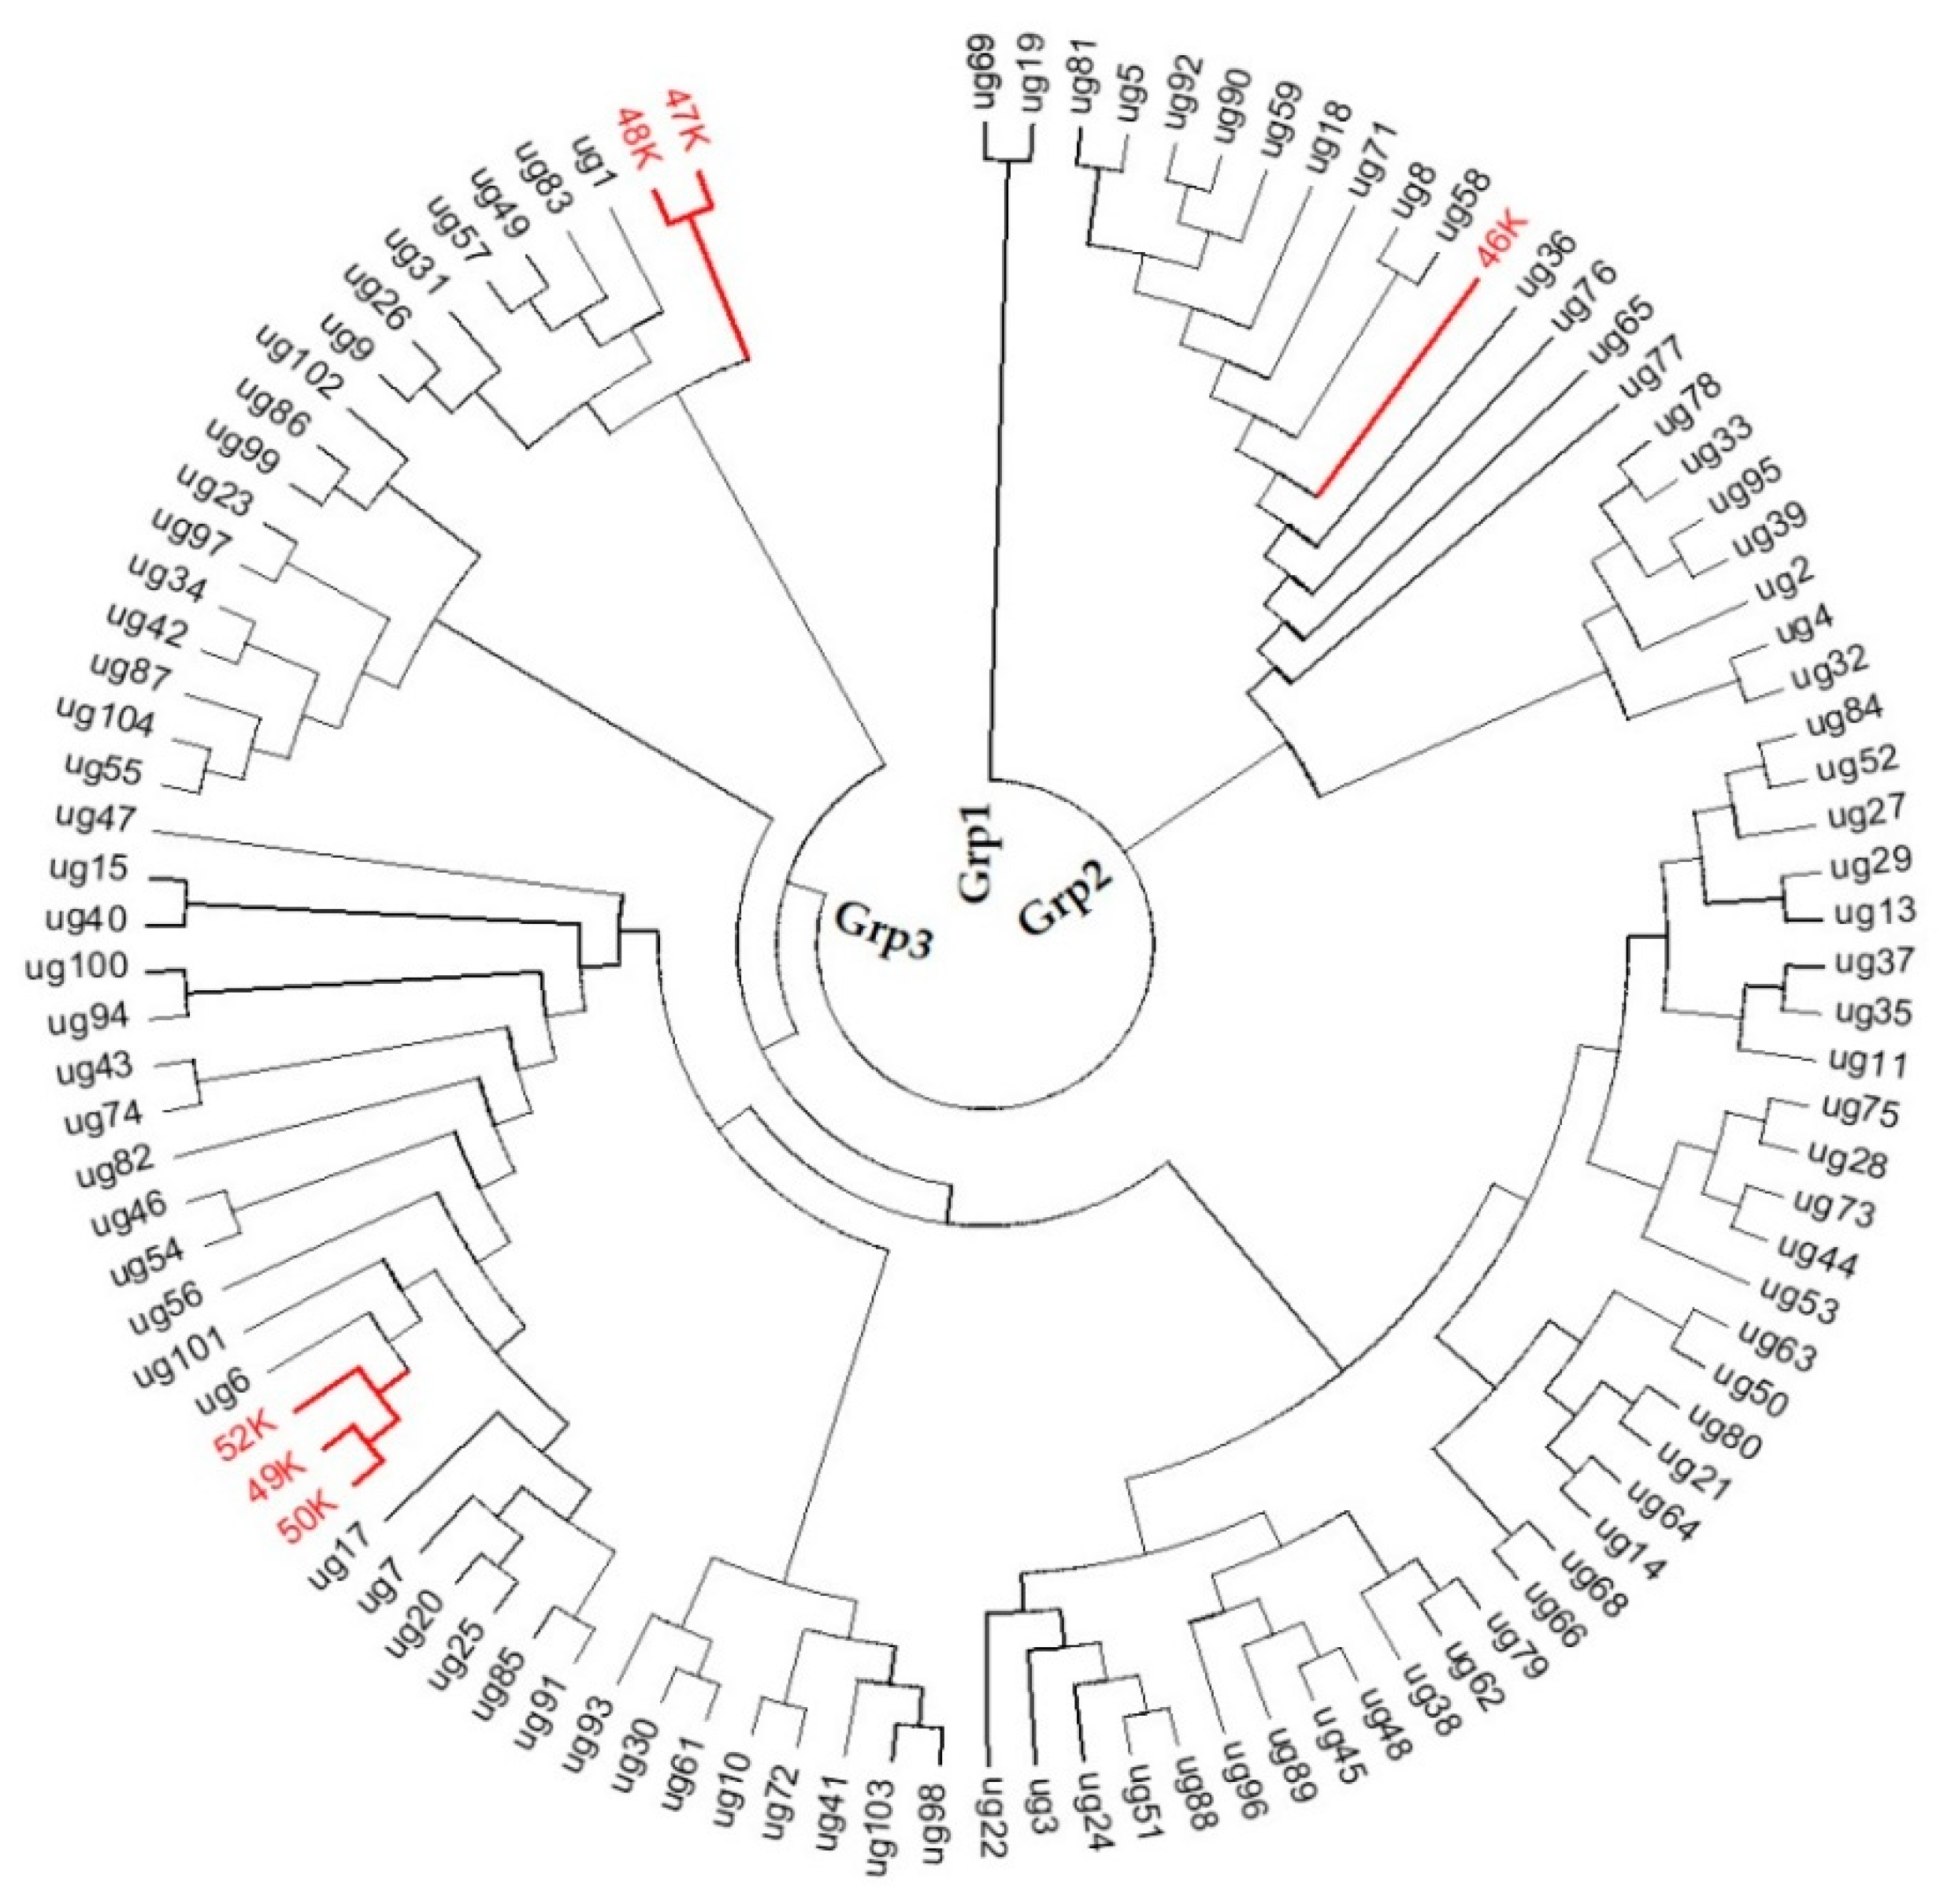
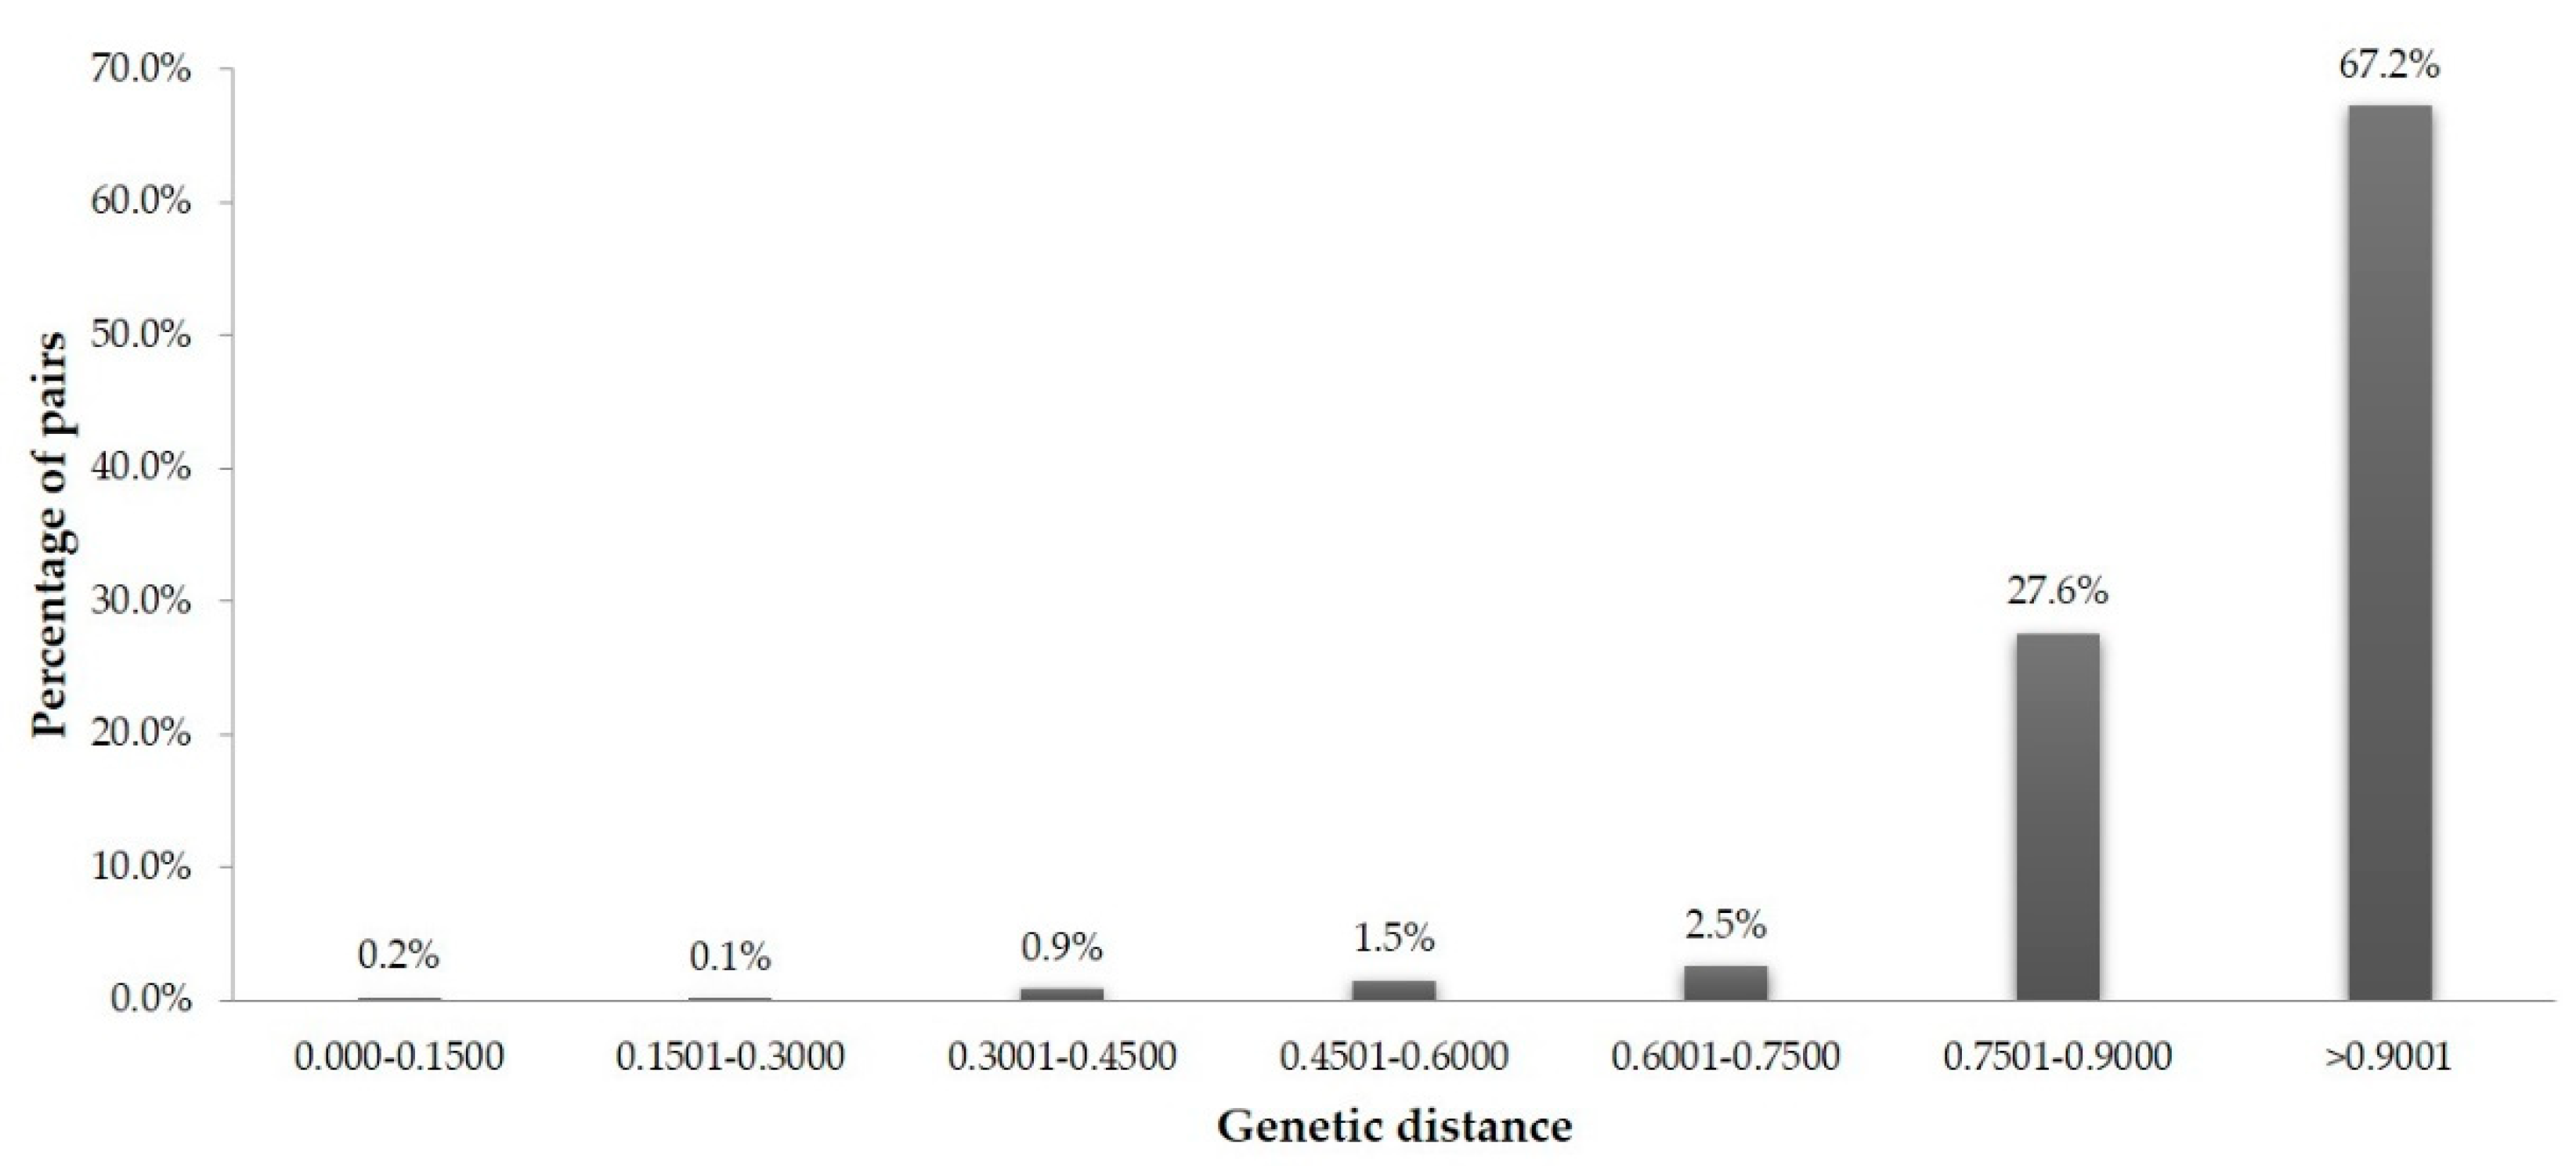
3.3. Similarity-Based Analysis

Neighbor-joining (NJ) dendrogram illustrates the genetic relationship among ecotypes as well as between ecotypes and commercial Brachiaria cultivars (Figure 3). The NJ tree constructed based on the genetic distances showed 99 ecotypes and six commercial cultivars in three major groups. Group 1 had two ecotypes, Group 2 had 20 ecotypes and a commercial cultivar B. humidicola cv. Humidicola (46 K), and Group 3 had 77 ecotypes and five commercial cultivars (B. brizantha cv. Piata (47 K), B. brizantha cv. MG4 (48 K), Brachiaria hybrid Mulato II (49 K), B. humidicola cv. Llanero (50 K), and B. decumbens cv. Basilisk (52 K)). Group 3 was further divided into five subgroups with the commercial cultivars present in two subgroups only.
The pairwise Rogers genetic distance for 99 Brachiaria ecotypes showed a wide range of genetic differences (≤0.1500 to over ≥0.9001) among the ecotype pairs (Figure 4). About 67.2% of the ecotype pairs had a genetic distance of over 0.9001, 27.6% pairs had a genetic distance between 0.7501 and 0.9000, while 5.2% pairs had a genetic distance of ≤0.7500.

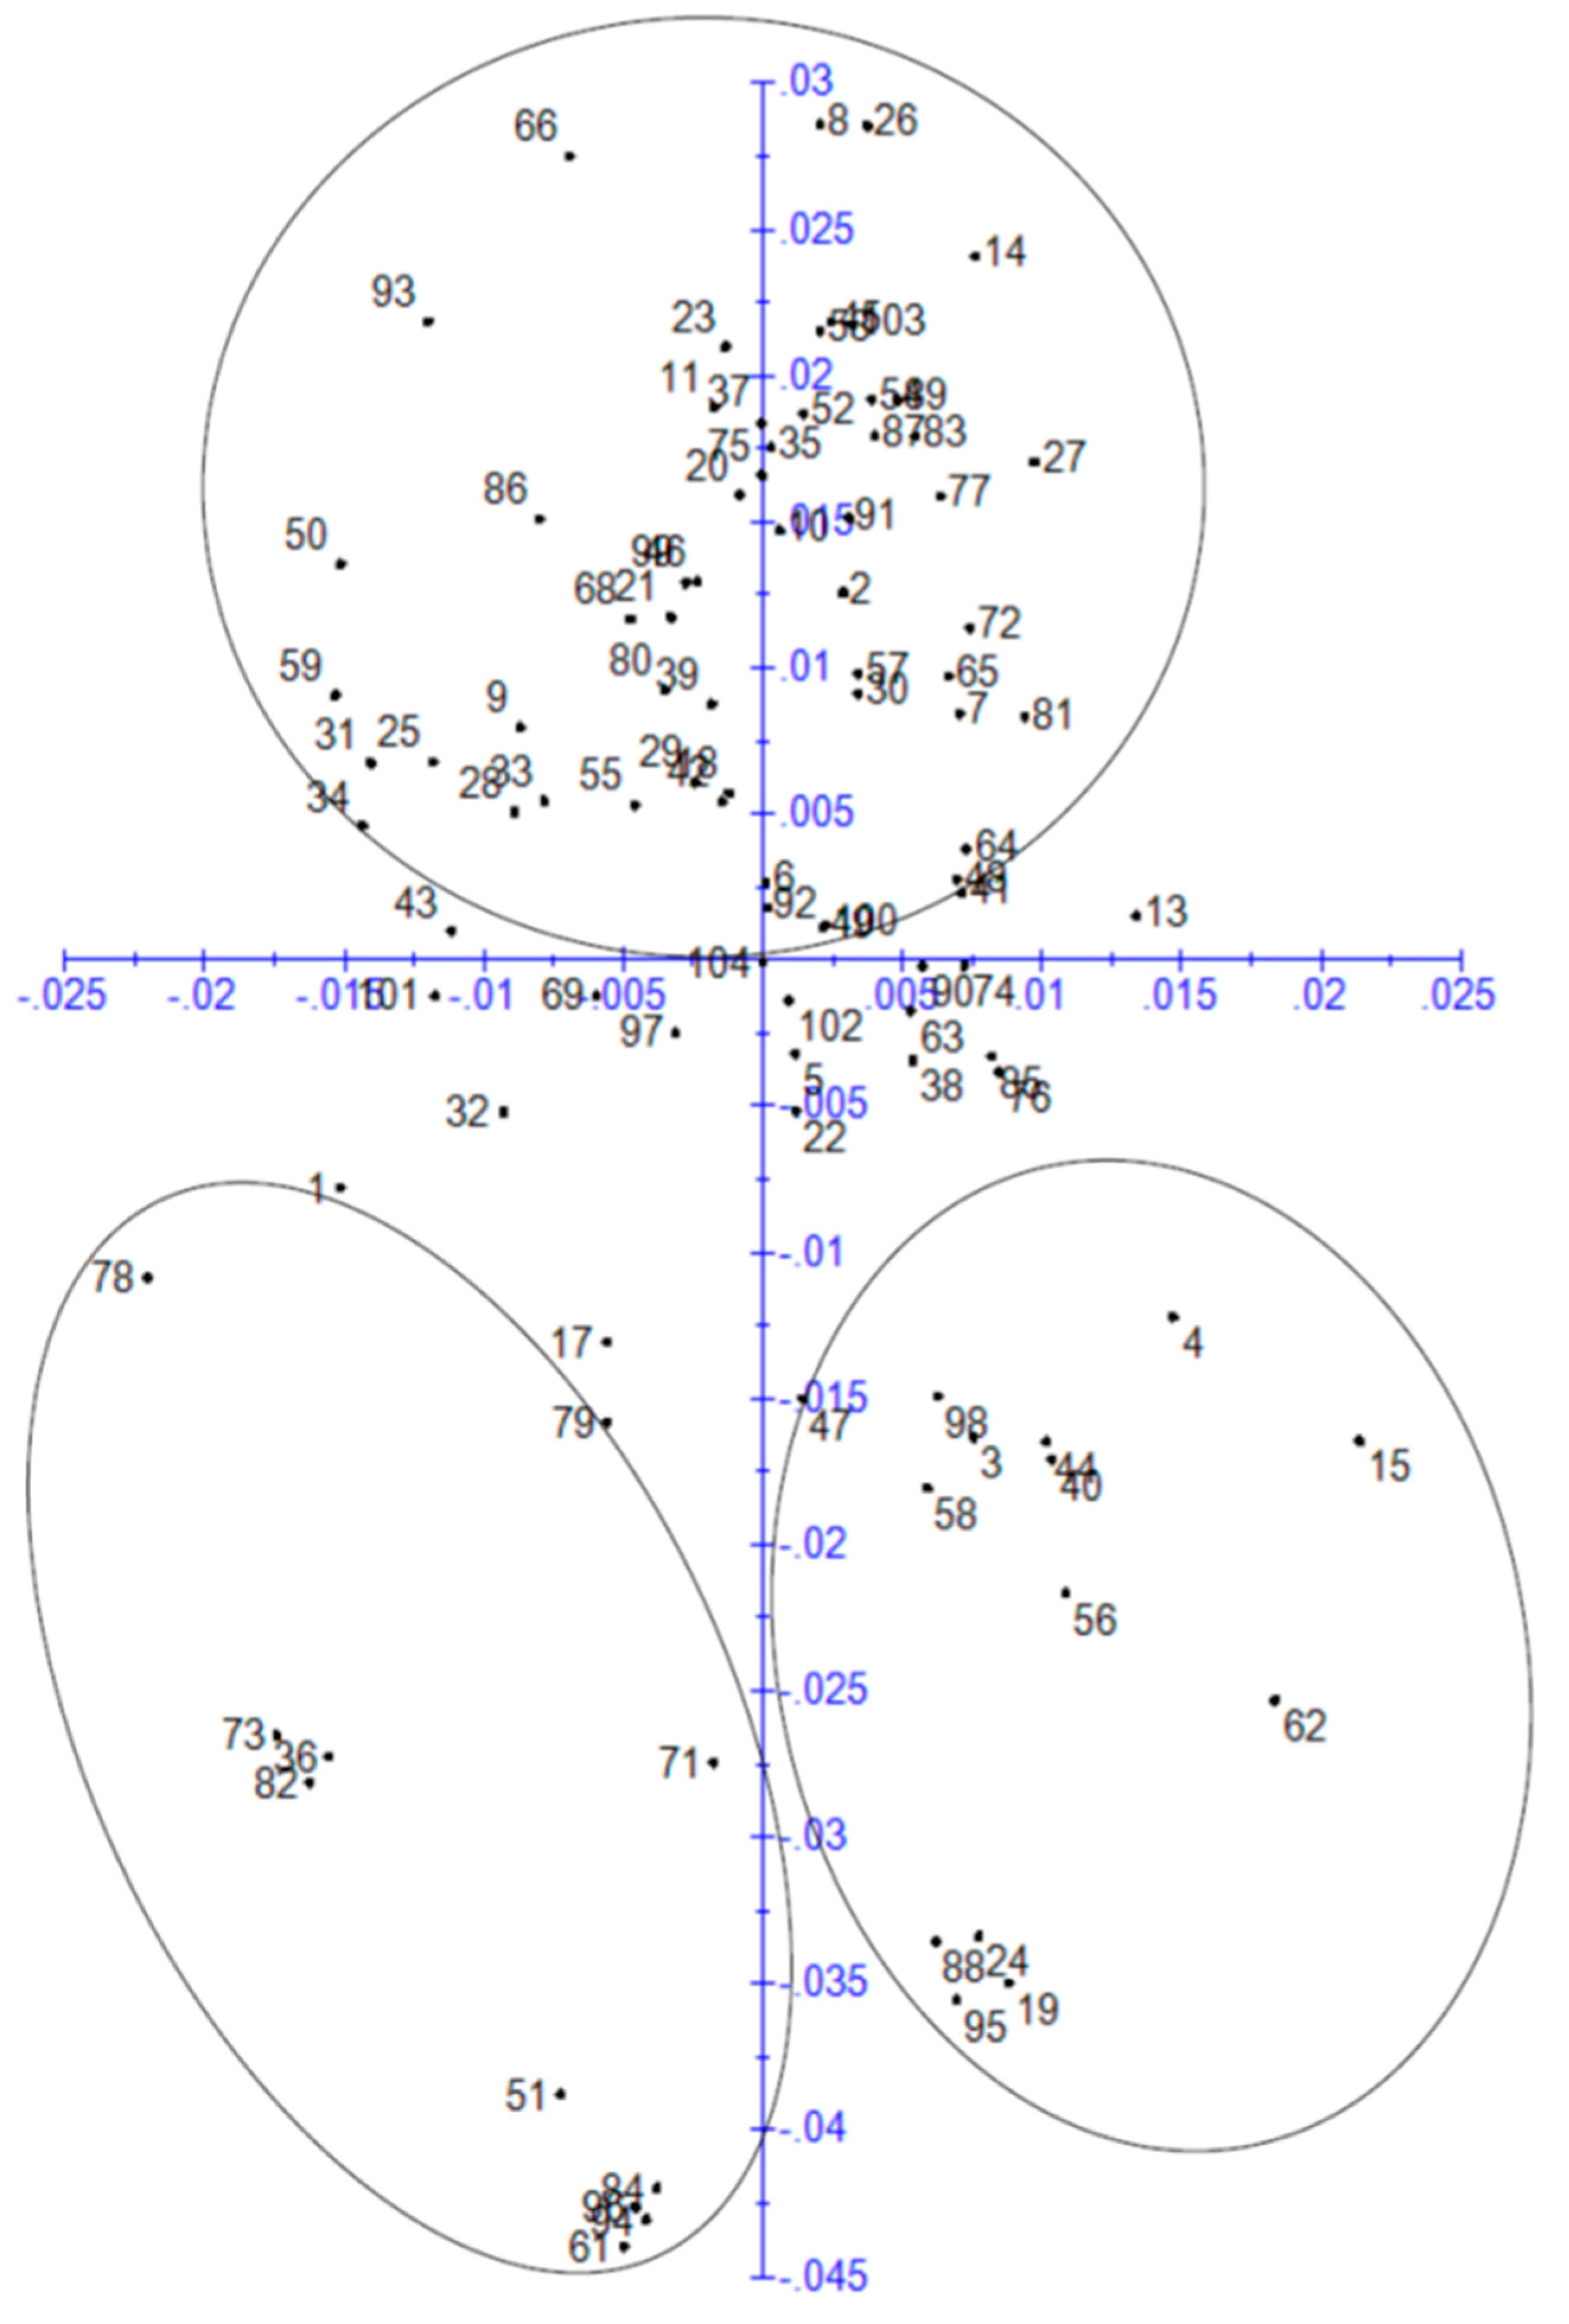
3.4. Principal Component Analysis

The genetic relationships among ecotypes were visualized through principal component analysis. Principal component analysis based on allele frequencies generated from 24 SSR markers detected three-major groupings of 99 ecotypes (Figure 5). The percentage variation explained by PC1 and PC2 were 40.6% and 18.2%, respectively.

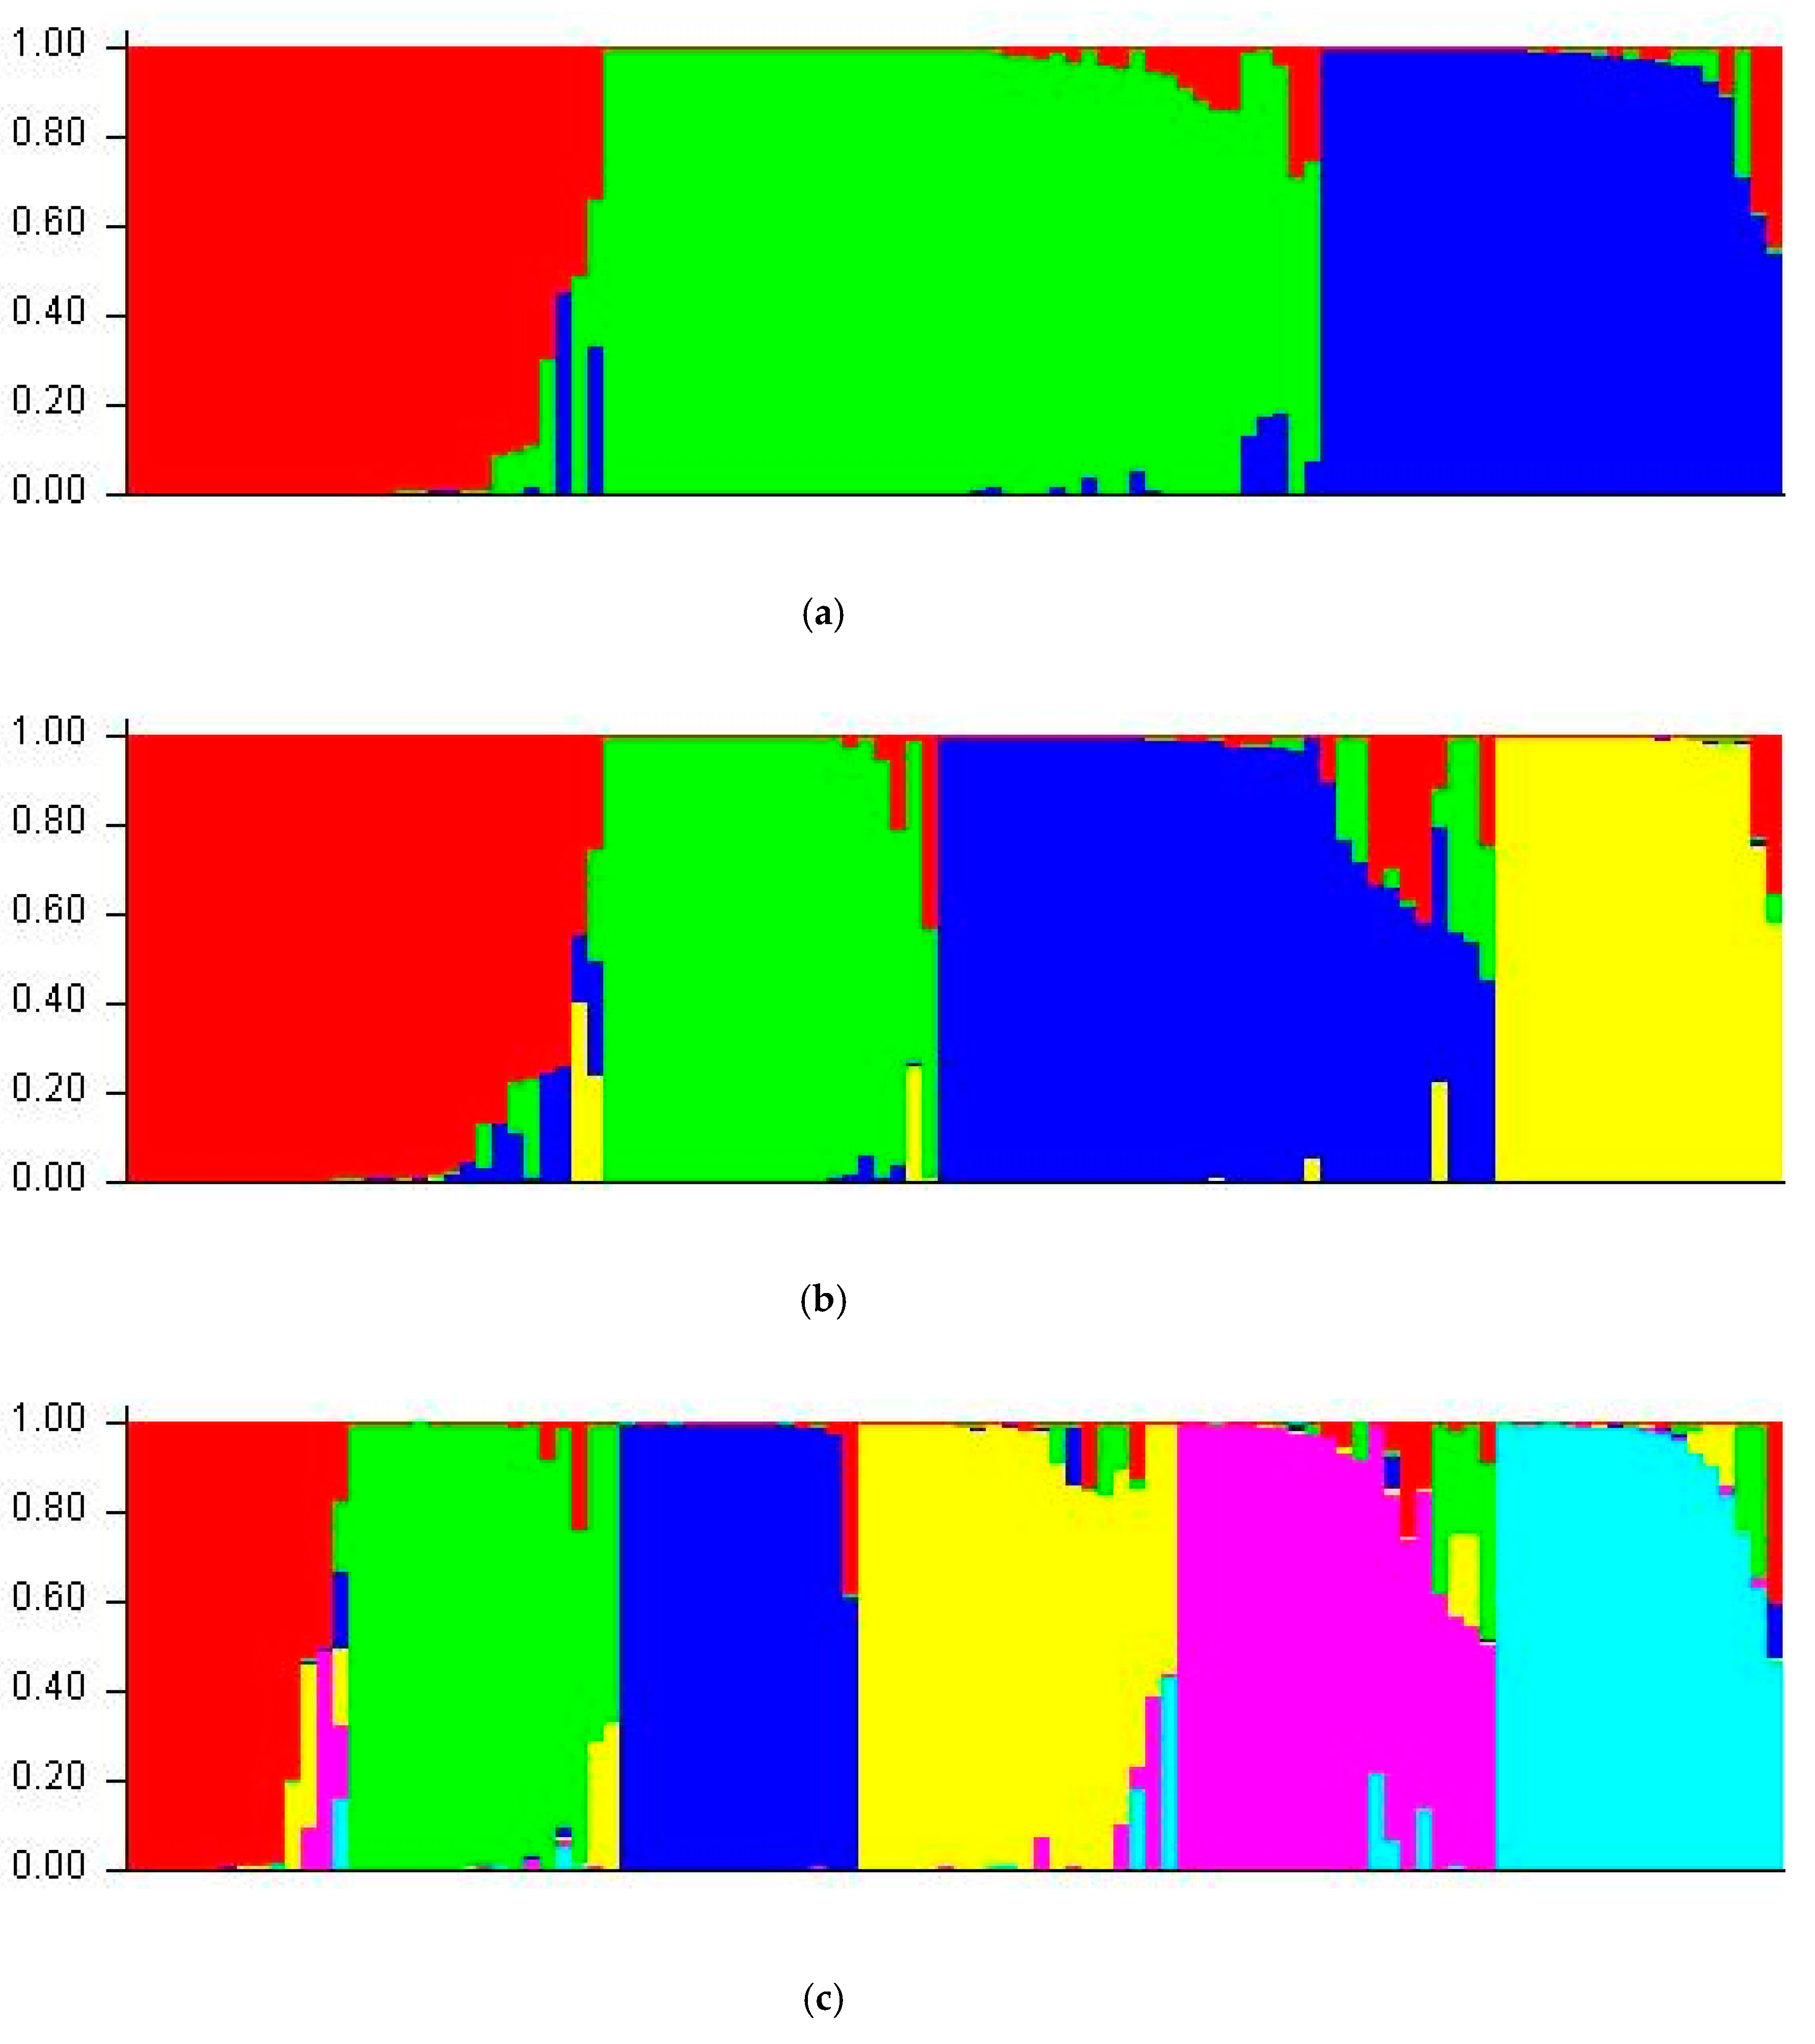
3.5. Structure Analysis

The Bayesian model based clustering algorithm implemented in STRUCTURE software confirmed three distinct clusters (ΔK = 3) among 99 ecotypes (Figure S1). These are indicated in different colors—Cluster I (red), Cluster II (green), and Cluster III (blue). These clusters consisted of pure lines and some admixture individuals with two or three gene pools (Figure 6a). For ΔK = 4, four allelic pools were identified with four different colors as red, green, blue, and yellow; while ΔK = 6, six allelic pools were identified with six colors as red, green, blue, yellow, purple, and pink. These clusters had pure lines as well as some admixture individuals (Figure 6b,c). As reported in previous study the clustering of ecotypes was independent of their geographical origin [29]. For ΔK = 3, most of the ecotypes from the North, showed the greater probability of ancestral membership (80.5%) for cluster I and II (Table 3).

4. Discussion

The genus Brachiaria exhibits a great diversity between and within species for genetic composition, morphology, growth habits, adaptation, and agricultural utility. The understanding of the diversity in natural populations is important for genetic conservation as well as for the improvement of a plant species for desirable traits including in Brachiaria grass. Of the 100 documented Brachiaria species, 33 are represented in the various gene banks, and only seven perennial species of African origin have been explored for forage production [3]. For the past few years, the popularity of improved Brachiaria grass cultivars for pasture production has been increased among livestock farmers in Africa. However, all improved Brachiaria cultivars that are grown in Africa were developed for alien environments in Australia and South America, suggesting a lack of improved Brachiaria cultivars for African environments. This study reports the establishment of the first national collection of Brachiaria ecotypes in Uganda, their genetic diversity profiles, and population structure based on SSR markers to facilitate the Brachiaria improvement programs in Uganda. The SSR markers have multiple uses including cultivar identification, genetic diversity studies, and genome mapping [45]. For example, SSR markers have been used to assess genetic diversity in various plant species such as pearl millet, rice, sweet cassava, and Brachiaria grass [26,29,30,31,45,46].
The average polymorphism information content of SSR markers used in this study was 0.89 conferring them as highly informative and capable to differentiate well among the Ugandan Brachiaria ecotypes (Table 1). The mean PIC values (0.89) deduced for markers in this study were comparable to studies of Silva et al. for the top 30 most informative markers [21], Kuwi et al. [30], and Pessoa-Filho et al. [47] although it was higher than those reported in other studies [31,48,49]. Interestingly, the number of SSR alleles detected in this study (n = 584) was higher than those reported by Vigna et al. [49], Jungmann et al. [1], and Pessoa-Filho et al. [47], but was lower than in the study of Trivino et al. [50]. Differences in PIC values and SSR alleles among these studies could be attributed to several factors such as differences in number, genetic background, and genetic complexity of Brachiaria genotypes; variation in numbers and types of markers used in the analysis, and the difference among studies in allele scoring system and combinations thereof. A relatively higher number of alleles detected in this study may have been associated with geographical position of Uganda in the region where Africa’s seven distinct biogeographic regions or phytochoria converge [51] and the region also represents the center of diversity of the genus Brachiaria [3]. Besides the robustness of markers in detecting a high number of alleles, there were some challenges in alleles scoring, especially in differentiating stutter and true peaks as reported by other authors [52,53].
The Brachiaria ecotypes analyzed in this study were collected from central, northern, south dryland, southwestern, and western regions that represent eight of eleven agroecological zones in Uganda [25]. The majority of these ecotypes (n = 95) were collected from sites with an altitude range of 1080–1521 m above sea level and an annual rainfall of between 1000 and 1500 mm. Despite differences among the collection sites for altitude and amount of precipitation, differences in the allelic patterns (e.g., number of effective alleles and private alleles) in the regional population were mainly influenced by sample size (data not shown) as reported in previous studies [30,54]. The detection of private alleles in all five regional populations suggests them as a valuable sources of genetic variation for breeding programs [55] targeting adaptation and other traits.
Analysis of molecular variance showed a high contribution of within-population difference to the total variation inferring high genetic diversity among the ecotypes. This result is substantiated by a low level of genetic variations among the populations, a high pair-wise Roger’s genetic distance of most ecotype pairs, and a fair representation of ecotype from all regions in structure analysis clusters particularly in ΔK = 3. Such differences among the ecotypes is anticipated due to the apomictic mode of reproduction in favor of maternal genotype regardless of the level of heterozygosity [56] and the polyploidy nature of Brachiaria species that’s often associated with meiotic anomalies leading to reduced pollen fertility [57]. Many Brachiaria species are known to have variable ploidy levels, for example, presence of tetra-, penta- and hexaploidy in B. brizantha population [58]. Polyploidy benefits plants from heterosis, gene redundancy, and loss of self-incompatibility and gain of asexual reproduction [59]. Our results were similar to studies of Pessoa-Filho et al. [47] and Vigna et al. [49] on Brachiaira ruziziensis and Brachiaria brizantha, respectively. The partitioning of molecular variations for the Ugandan ecotype population was similar to those reported in other studies [30,31,60].
The STRUCTURE analysis showed the presence of three distinct gene pools in Ugandan Brachiaria ecotypes. The three gene pools detected in this study agrees to previous studies in Tanzania, Ethiopia, and Brazil [30,31,49]. In agreement with STRUCTURE analysis, the NJ tree showed Ugandan ecotypes and six commercial cultivars in three distinct groups, but the membership coefficient to each group differed between two analyses. We observed a high degree of relatedness between ecotypes and the commercial cultivars. Ecotypes in groups 1, and subgroups of groups 2 and 3 that clustered exclusive of improved cultivars may require further analysis to know where they belong, they could possess unique traits of agricultural importance. Such grouping and sub-grouping of ecotypes and improved cultivars in NJ trees signifies a high level of genetic diversity in Ugandan ecotypes compared to six improved Brachiaria cultivars that belong to three species (B. brizantha, B. decumbens, and B. humidicola) and a hybrid of B. brizantha × B. decumbens × B. ruziziensis. These observations were anticipated as since many Brachiaria species occur naturally in eastern Africa and the region represents a center of diversity of the genus [3]. We also guess that this collection of 99 ecotypes may have representation of several Brachiaria species.
Most improved Brachiaria cultivars that are in use for pasture production were derived from the direct selection of naturally occurring genotypes from the East Africa [9]. Therefore, the evaluations of these Ugandan Brachiaria ecotypes for major agricultural traits, e.g., biomass yield, animal nutrition, livestock productivity, pests and disease resistance, and adaptation to drought at different agroclimatic zones is necessary to develop locally adapted and improved cultivars for commercial cultivation. The SSR markers revealed a high genetic diversity in Ugandan Brachiaria ecotypes and their high value in Brachiaria improvement programs. Crosses of distantly related ecotypes could be a good strategy to broaden the genetic base. High density genotyping and association mapping would help to shorten the time necessary for completing a breeding cycle and developing new varieties. The complexity of the Brachiaria genome, limited understanding of reproductive biology, and morphological agility within and between the species have limited the pace of Brachiaria breeding. Therefore, there is a need to enrich the current understanding of Brachiaria biology and promote integrated use of conventional and molecular breeding methods for better exploitation of genetic resources from this collection as well as those available elsewhere.

5. Conclusions

Through this study, we successfully established the first nation-wide collection of Brachiaria ecotypes in Uganda covering five regions representing eight different agroecological zones in the country. Ecotypes are maintained in the vegetative field gene bank at Tororo, Uganda in the guardianship of NaLIRRI, and these materials can be accessed by other researchers following the Ugandan government’s guidelines for accessing genetic resources and benefit sharing. This study documented genetic diversity and population structure of these ecotypes using SSR markers. Ecotypes were rich in allelic diversity, genetically diverse and they had three distinct gene pools. High contribution of within ecotypes genetic difference to total diversity observed in these ecotypes was consistent with the reproductive mode, dispersal mechanism, and genetic attributes of the Brachiaria species. The genetic materials (ecotypes) and genetic information produced in this study will form a basis for Brachiaria grass conservation and improvement programs targeting agricultural and environmental applications in Uganda and beyond.

Supplementary Materials

The following are available online at https://www.mdpi.com/2073-4395/10/8/1193/s1, Figure S1: Plot of changes in ΔK value with the number of subpopulations, Table S1: Ugandan Brachiaria ecotypes and their collection details.

Author Contributions

S.G., A.D., S.M., and C.N. designed the study; C.N., M.K., and C.M. performed the research; J.P.S., C.N., M.K., and S.G. analyzed data; C.N., and S.G. wrote the manuscript and all co-authors reviewed and contributed to the manuscript; C.M. and R.M. collected ecotypes; and S.G., and S.M. supervised the research project. All authors have read and agreed to the published version of the manuscript.

Funding

This project was supported by the BecA-ILRI Hub through the Africa Biosciences Challenge Fund (ABCF) program. The ABCF Program is funded by the Australian Department for Foreign Affairs and Trade (DFAT) through the BecA-CSIRO partnership; the Syngenta Foundation for Sustainable Agriculture (SFSA); the Bill & Melinda Gates Foundation (BMGF); the UK Department for International Development (DFID) and; the Swedish International Development Cooperation Agency (Sida).

Acknowledgments

Authors are thankful to Wellington Ekaya, Valerian Aloo, and Marvin Wasonga for administrative support; and Leah Kago, Asheber Tegegn, and Salum Kuwi for technical assistance. We are thankful to Tsion Issayas at ILRI for language editing.

Conflicts of Interest

The authors declare no conflict of interest.

References

  1. Jungmann, L.; Vigna, B.B.Z.; Paiva, J.; Sousa, A.C.B.; do Valle, C.B.; Laborda, P.R.; Zucchi, M.I.; de Souza, A.P. Development of microsatellite markers for Brachiaria humidicola (Rendle) Schweik. Conserv. Genet. Res. 2009, 1, 475. [Google Scholar] [CrossRef]
  2. Renvoize, S.A.; Clay, W.D.; Kabuye, C.H.S. Morphology, taxonomy and natural distribution of Brachiaria (Trin.) Griesb. In Brachiaria: Biology, Agronomy and Improvement; Miles, J.W., Maass, B.L., do Valle, C.B., Eds.; International Center for Tropical Agriculture: Cali, Colombia, 1996; Volume 1, pp. 1–15. [Google Scholar]
  3. Keller-Grein, G.; Maass, B.L.; Hanson, J. Natural variation in Brachiaria and existing germplasm collections. In Brachiaria: Biology, Agronomy and Improvement; Miles, J.W., Maass, B.L., do Valle, C.B., Eds.; International Center for Tropical Agriculture: Cali, Colombia, 1996; Volume 1, pp. 16–42. [Google Scholar]
  4. Barnard, C. Herbage Plant Species, Australia Herbage Plant Registration Authority; CSIRO: Canberra, Australia, 1969; Volume 154. [Google Scholar]
  5. Oram, R.N. Register of Australian herbage plant cultivars. In Australian Herbage Plant Registration Authority, Division of Plant Industry; CSIRO: East Melbourne, Australia, 1990; Volume 304. [Google Scholar]
  6. Parsons, J.J. Spread of African pasture grasses to the American tropics. J. Range Manag. 1972, 25, 12–17. [Google Scholar] [CrossRef]
  7. Argel, P.J.; Keller-Grein, G. Regional experience with Brachiaria: Tropical America—Humid lowlands. In Brachiaria: Biology, Agronomy and Improvement; Miles, J.W., Maass, B.L., do Valle, C.B., Eds.; International Center for Tropical Agriculture: Cali, Colombia, 1996; Volume 1, pp. 205–224. [Google Scholar]
  8. Fisher, M.J.; Kerridge, P.C. The agronomy and physiology of Brachiaria species. In Brachiaria: Biology, Agronomy and Improvement; Miles, J.W., Maass, B.L., do Valle, C.B., Eds.; International Center for Tropical Agriculture: Cali, Colombia, 1996; Volume 1, pp. 43–52. [Google Scholar]
  9. Jank, L.; Barrios, S.C.; do Valle, C.B.; Simeão, R.M.; Alves, G.F. The value of improved pastures to Brazilian beef production. Crop Pasture Sci. 2014, 65, 1132–1137. [Google Scholar] [CrossRef]
  10. Arango, J.; Moreta, D.; Nunez, J.; Hartmann, K.; Dominguez, M.; Ishitani, M.; Miles, J.; Subbarao, G.; Peters, M.; Rao, I. Developing methods to evaluate phenotypic variability in biological nitrification inhibition (BNI) capacity of Brachiaria grasses. Trop. Grassl. 2014, 2, 6–8. [Google Scholar] [CrossRef] [Green Version]
  11. Moreta, D.; Arango, J.; Soleto, M.; Vergara, D.; Rincón, A.; Ishitani, M.; Castro, A.; Miles, J.; Peters, M.; Tohme, J.; et al. Biological nitrification inhibition (BNI) in Brachiaria pastures: A novel strategy to improve eco-efficiency of crop- livestock systems and to mitigate climate change. Trop. Grassl. 2014, 2, 88–91. [Google Scholar] [CrossRef]
  12. Ghimire, S.; Njarui, D.; Mutimura, M.; Cardoso, J.; Johnson, L.; Gichangi, E.; Teasdale, S.; Odokonyero, K.; Caradus, J.; Rao, I.; et al. Climate-smart Brachiaria for improving livestock production in East Africa: Emerging opportunities. In Sustainable Use of Grassland Resources for Forage Production, Biodiversity and Environmental Protection, Proceedings of 23rd International Grassland Congress, New Delhi, India, 20–24 November 2015; Vijay, D., Srivastava, M., Gupta, C., Malaviya, D., Roy, M., Mahanta, S., Singh, J., Maity, A., Ghos, P., Eds.; Range Management of Society of India: Jhansi, India, 2015; pp. 361–370. [Google Scholar]
  13. Subbarao, G.V.; Nakahara, K.; Hurtado, M.P.; Ono, H.; Moreta, D.E.; Salcedo, A.F.; Yoshihashi, A.T.; Ishikawa, T.; Ishitani, M.; Ohnishi-Kameyama, M.; et al. Evidence for Biological nitrification inhibition in Brachiaria pastures. Proc. Nat. Acad. Sci. USA 2009, 106, 17302–17307. [Google Scholar] [CrossRef] [Green Version]
  14. Djikeng, A.; Rao, I.; Njarui, D.; Mutimura, M.; Caradus, J.; Ghimire, S.R.; Linda, J.; Ahonsi, M.; Kelemu, S. Climate-Smart Brachiaria grasses for improving livestock production in East Africa. Trop. Grassl. 2014, 2, 38–39. [Google Scholar] [CrossRef] [Green Version]
  15. Bogdan, A.V. Tropical Pastures and Fodder Plants; Longman: London, UK, 1977; Volume 475. [Google Scholar]
  16. Sotomayor-Ríos, A.; Vélez-Fortuño, J.; Woodbury, R.; Schertz, K.F.; Sierra-Bracero, A. Description and cytology of a form of Signal grass (Brachiaria brizantha Stapf.) and its agronomic behavior compared to Guinea grass (Panicum maximum Jack.). J. Agric. Univ. P R. 1960, 44, 208–220. Available online: https://revistas.upr.edu/index.php/jaupr/article/view/13809 (accessed on 29 September 2019).
  17. Vendramini, J.; Seller, B.; Sullenberger, L.E.; Silveira, M. Mulato II (Brachiaria sp.). Available online: https://edis.ifas.ufl.edu/ag310 (accessed on 29 September 2019).
  18. Ndikumana, J.; de Leeuw, P.N. Regional experience with Brachiaria: Sub-Saharan Africa. In Brachiaria: Biology, Agronomy and Improvement; Miles, J.W., Maass, B.L., do Valle, C.B., Eds.; International Center for Tropical Agriculture: Cali, Colombia, 1996; Volume 1, pp. 247–257. [Google Scholar]
  19. Miles, J.W.; Maass, B.L.; do Valle, C.B. Brachiaria: Biology, Agronomy and Improvement; International Center for Tropical Agriculture: Cali, Colombia, 1996; Volume 288. [Google Scholar]
  20. Jungmann, L.; Sousa, A.C.B.; Paiva, J.; Francisco, P.M.; Vigna, B.B.Z.; do Valle, C.B.; Zucchi, M.; de Souza, A.P. Isolation and characterization of microsatellite markers for Brachiaria brizantha (Hochst. ex A. Rich.) Stap. Conserv. Genet. 2009, 10, 1873–1876. [Google Scholar] [CrossRef]
  21. Silva, P.; Martins, A.; Gouvea, E.; Marco, P.; Ferreira, M. Development and validation of microsatellite markers for Brachiaria ruziziensis obtained by partial genome assembly of Illumina single end reads. BMC Genomics 2013, 14, 17. [Google Scholar] [CrossRef] [Green Version]
  22. Maass, B.L.; Midega, C.A.O.; Mutimura, M.; Rahetlah, V.B.; Salgado, P.; Kabirizi, J.M.; Khan, Z.R.; Ghimire, S.R.; Rao, I. Home coming of Brachiaria: Improved hybrids prove useful for African Animal Agricultural. East Afr. Agric. For. J. 2015, 81, 71–78. [Google Scholar] [CrossRef] [Green Version]
  23. Njarui, D.M.G.; Gichangi, E.M.; Ghimire, S.R.; Muinga, R.W. Climate smart Brachiaria grasses for improving livestock production in East Africa—Kenya experience. In Proceedings of the End of the Project Workshop, Naivasha, Kenya, 14–15 September 2016; Kenya Agricultural and Livestock Research Organization: Nairobi, Kenya, 2016; Volume 271. [Google Scholar]
  24. USAID. Uganda Biodiversity and Tropical Forest Assessment. Final Report; 2006. Available online: https://www.vub.be/klimostoolkit/sites/default/files/documents/uganda_biodiversity_assessment_usaid.pdf (accessed on 22 July 2020).
  25. FAO. Crop Calendar—An Information Tool for Seed Security. 2010. Available online: http://www.fao.org/agriculture/seed/cropcalendar/welcome.do (accessed on 22 July 2020).
  26. da Costa, T.R.; Filho, P.S.V.; Gonçalves-Vidigal, M.C.; Galvan, M.Z.; Lacanallo, G.F.; da Silva, L.I.; Kvitschal, M.V. Genetic diversity and population structure of sweet cassava using simple sequence repeat (SSR) molecular markers. Afr. J. Biotechnol. 2013, 12, 1040–1048. [Google Scholar]
  27. Garcia, M.; Vigna, B.B.Z.; Sousa, A.C.B.; Jungmann, L.; Cidade, F.W.; Toledo-Silva, G.; Francisco., P.M.; Chiari, L.; Carvalho, M.A.; Karia, C.T.; et al. Molecular genetics variability, population structure and mating system in tropical forages. Trop. Grassl. Forrajes 2013, 1, 25–30. [Google Scholar] [CrossRef]
  28. Kawube, G.; Kabirizi, J.; Namazzi, C. Genetic characterization of Alupe Napier grass accessions based on simple sequence repeat (SSR). Am. J. Exp. Agric. 2015, 7, 205–213. [Google Scholar]
  29. Ondabu, N.; Maina, S.; Kimani, W.; Njarui, D.; Djikeng, A.; Ghimire, S. Molecular characterization of Kenyan Brachiaria grass ecotypes with microsatellites (SSR) markers. Agronomy 2017, 7, 8. [Google Scholar] [CrossRef]
  30. Kuwi, S.O.; Kyalo, M.; Mutai, C.; Mwilawa, A.; Hanson, J.; Djikeng, A.; Ghimire, S.R. Genetic diversity and population structure of Urochloa grass accessions from Tanzania using simple sequence repeat (SSR) markers. Braz. J. Bot. 2018, 41, 699–709. [Google Scholar] [CrossRef] [Green Version]
  31. Tegegn, A.; Kyalo, M.; Mutai, C.; Hanson, J.; Asefa, G.; Djikeng, A.; Ghimire, S.R. Genetic diversity and population structure of Brachiaria brizantha (A. Rich) Stapf accessions from Ethiopia. Afr. J. Range For. Sci. 2019, 36, 129–133. [Google Scholar] [CrossRef] [Green Version]
  32. Prasantha, V.P.; Chandra, S. ALS-Binary: A Program for Converting Allele Size in Microsatellite Markers to 0–1 (Binary Data). Biometrics; ICRISAT: Hyderabad, India, 1997; Available online: http://www.icrisat.org/bt-software-d-als.htm (accessed on 12 May 2015).
  33. Pritchard, J.K.; Stephens, M.; Donnelly, P. Inference of population structure from multi-locus genotype data. Genetics 2000, 155, 945–959. [Google Scholar]
  34. Earl, D.A.; Von Holdt, B.M. Structure harvester: A website and program for visualizing structure output and implementing Evanno method. Conserv. Genet. Res. 2012, 4, 359–361. [Google Scholar] [CrossRef]
  35. Evanno, G.S.; Goudet, R. Detecting the number of clusters of individuals using the software STRUCTURE: A simulation study. Mol. Ecol. 2005, 14, 2611–2620. [Google Scholar] [CrossRef] [Green Version]
  36. Roger, J.S. Measures of genetic similarity and genetic distance. In Studies in Genetic VII; University of Texas: Austin, TX, USA, 1972; Publication 7213; pp. 145–153. [Google Scholar]
  37. Liu, K.; Muse, S.V. PowerMarker: An integrated analysis environment for genetic marker analysis. Bioinformatics 2005, 21, 2128–2129. [Google Scholar] [CrossRef] [PubMed] [Green Version]
  38. Addinsoft. XLSTAT Statistical and Data Analysis Solution; Addinsoft: New York, NY, USA, 2020; Available online: https://www.xlstat.com (accessed on 3 June 2020).
  39. Tamura, K.; Peterson, D.; Peterson, N.; Stecher, G.; Kumar, S. MEGA5: Molecular evolutionary genetics analysis using maximum likelihood, evolutionary distance, and maximum parsimony methods. Mol. Biol. Evol. 2011, 2731–2739. [Google Scholar] [CrossRef] [PubMed] [Green Version]
  40. Excoffier, L.; Laval, G.; Schneider, S. Arlequin (version 3.0): An integrated software package for population genetics data analysis. Evol. Bioinform. 2005, 1, 47–50. [Google Scholar] [CrossRef] [Green Version]
  41. Excoffier, L.; Lischer, H.E.L. Arlequin suite ver 3.5: A new series of programs to perform population genetics analyses under Linux and Windows. Mol. Ecol. Resour. 2010, 10, 564–567. [Google Scholar] [CrossRef] [PubMed]
  42. Peakall, R.; Smouse, P.E. GenAlEx 6.5: Genetic analysis in Excel. Population genetic software for teaching and research—An update. Bioinformatics 2012, 28, 2537–2539. Available online: https://bioinformatics.oxfordjournals.org/content/28/19/2537 (accessed on 28 May 2018). [CrossRef] [Green Version]
  43. Meirmans, P.G. Using the AMOVA framework to estimate a standardized genetics differentiation measure. Evolution 2007, 60, 2399–2402. [Google Scholar] [CrossRef]
  44. Perrier, X.; Jacquemoud-Collet, J.P. DARwin Software: Dissimilarity Analysis and Representation for Windows (Version 6.0.15). 2006. Available online: http://darwin.cirad.fr/darwin (accessed on 17 April 2020).
  45. Kapila, R.K.; Yadav, R.S.; Plaha, P.; Rai, K.N.; Yadav, O.P.; Hash, C.T.; Howarth, C.J. Genetic diversity among pearl millet maintainers using microsatellite markers. Plant Breed. 2008, 127, 33–37. [Google Scholar] [CrossRef] [Green Version]
  46. Singh, R.K.; Sharma, R.K.; Singh, A.K.; Singh, V.P.; Tiwari, S.P.; Mohapatra, T. Sustainability of mapped sequence tagged microsatellite site markers for establishing distinctness, uniformity and stability in aromatic rice. Euphytica 2004, 135, 135–143. [Google Scholar] [CrossRef]
  47. Pessoa-Filho, M.; Azevedo, A.L.S.; Sobrinho, F.S.; Gouvea, E.G.; Martins, A.M.; Ferreira, M.E. Genetic diversity and structure of Ruzigrass germplasm collected in Africa and Brazil. Crop Sci. 2015, 55, 2736–2745. [Google Scholar] [CrossRef] [Green Version]
  48. Sousa, A.C.B.; Carvalho, M.A.; Campos, T.; Sforca, D.A.; Zucchi, M.I.; Jank, L.; Souza, A.P. Molecular diversity, genetic structure and mating system of Calopogonium mucunoides Desv. Genet. Res. Crop. Evol. 2012, 59, 1449–1464. [Google Scholar] [CrossRef]
  49. Vigna, B.B.Z.; Jungmann, L.; Francisco, P.M.; Zucchi, M.I.; do Valle, C.B.; de Souza, A.P. Genetic diversity and population structure of Brachiaria brizantha germplasm. Trop. Plant Biol. 2011, 4, 157–169. [Google Scholar] [CrossRef]
  50. Trivino, N.J.; Perez, J.G.; Recio, M.E.; Ebina, M.; Yamanaka, N.; Tsuruta, S.; Ishitani, M.; Worthington, M. Genetic diversity and population structure of Brachiaria species and breeding populations. Crop Sci. 2017, 57, 2633–2644. [Google Scholar] [CrossRef] [Green Version]
  51. White, F. The vegetation of Africa. In A Descriptive Memoir to Accompany the UNESCO/AETFAT/UNSO Vegetation Map of Africa; UNESCO: Paris, France, 1983. [Google Scholar]
  52. DeWoody, J.; Nason, J.D.; Hipkins, V.D. Mitigating scoring errors in microsatellite data from wild population. Mol. Ecol. Notes 2006, 6, 951–957. [Google Scholar] [CrossRef] [Green Version]
  53. Palop-Esteban, M.; Segarra-Moragues, J.; Gonzalez-Candelas, F. Polyploid origin, genetic diversity and population structure in the tetraploid sea lavender Limomnium narbonense Miller (Plumbaginaceae) from eastern Spain. Genetica 2011, 139, 1309–1322. [Google Scholar] [CrossRef] [PubMed]
  54. Szpiech, Z.A.; Jakobsson, M.; Rosenberg, N.A. ADZE: A rarefaction approach for counting alleles private to combinations of populations. Bioinformatics 2008, 24, 2498–2504. [Google Scholar] [CrossRef] [Green Version]
  55. Salema, K.F.M.; Sallam, A. Analysis of population structure and genetic diversity of Egyptian and exotic rice (Oryza sativa L.) genotypes. C. R. Biol. 2016, 339, 1–9. [Google Scholar] [CrossRef]
  56. Ozias-Akins, P.; van Dijk, P.J. Mendelian genetics of apomixes in plants. Annu. Rev. Genet. 2007, 41, 509–537. [Google Scholar] [CrossRef]
  57. Santo, F.C.; Guyot, R.; do Valle, C.B.; Chiari, L.; Techio, V.H.; Heslop-Harrison, P.; Vanzela, A.L. Chromosome distribution and evolution of abundant retrotransposons in plants: Gypsy elements in diploid and polyploidy Brachiaria forage grasses. Chromosome Res. 2015, 23, 571–582. [Google Scholar] [CrossRef] [Green Version]
  58. Pagliarini, M.S.; do Valle, C.B.; Santos, E.M.; Mendes, D.V.; Bernardo, Z.H.; Mendes-Bonato, A.B.; Silva, N.; Calisto, V. Microsporogenesis in Brachiaria brizantha (Poaceae) as a selection tool for breeding. Genet. Mol. Res. 2012, 11, 1309–1318. [Google Scholar] [CrossRef]
  59. Comai, L. The advantages and disadvantages of being polyploid. Nat. Rev. Genet. 2005, 6, 836–846. [Google Scholar] [CrossRef]
  60. Teixiera, H.; Rodriguez-Echeverria, S.; Nabais, C. Genetic diversity and differentiation of Juniperus thurifera in Spain and Morocco as determined by SSR. PLoS ONE 2014, 9, e88996. [Google Scholar] [CrossRef] [PubMed] [Green Version]
Figure 1. Map of Uganda showing Brachiaria ecotype collection sites in five regions (regions are coded in different colors). The map was generated using DIVA-GIS software.
Agronomy 10 01193 g001
Figure 2. Allelic patterns across the study populations of Brachiaria grass ecotypes in Uganda. CTR = central, NTN = northern, SDL = southern dryland, SWT = southwestern, and WST = western. Na = number of different alleles, Ne = number of effective alleles, and I = Shannon information index.
Agronomy 10 01193 g002
Figure 3. Neighbor-joining tree of 99 Brachiaria ecotypes from Uganda and six commercial cultivars based on Rogers’s genetic distance calculated from 24 simple sequence repeats markers. Ecotypes are denoted by initial letters ug and commercial cultivars are written in red color as 46 K (Brachiaria humidicola cv. Humidicola), 47 K (Brachiaria brizantha cv. MG4), 48 K (Brachiaria brizantha cv. Piata), 49 K (Brachiaria hybrid Mulato II), 50 K (Brachiaria humidicola cv. Llanero), and 52 K (Brachiaria decumbens cv. Basilisk).
Agronomy 10 01193 g003
Figure 4. Distribution of pair-wise Roger’s genetic distance for 99 Brachiaria ecotypes based on 24 simple sequence repeats markers.
Agronomy 10 01193 g004
Figure 5. Principal coordinate analysis (PCA) based on genetic distance matrix calculated for 99 Brachiaria ecotypes from Uganda based on 24 microsatellite markers. Percentages of variation explained by PC1 and PC2 were 40.6% and 18.2%, respectively.
Agronomy 10 01193 g005
Figure 6. Population structure among individuals with (a) ΔK = 3, (b) ΔK = 4, and (c) ΔK = 6.
Agronomy 10 01193 g006
Table 1. Characteristic of 24 Single Sequence Repeats (SSR) markers and marker summary statistics.
MarkerForward Primer Sequence
(5′ to 3′)
Reverse Primer Sequence
(5′ to 3′)
Annealing
Temp. (°C)
Expected
Product Size
Repeat
Motif
Summary Statistics
No. of AllelePIC
Br0012ACTCAAACAATCTCCAACACGCCCACAAATGGTGAATGTAAC59144–196(CA)6140.91
Br0028CATGGACAAGGAGAAGATTGATGGGAGTTAAACATTAGTGTTTT58111–197(TA)8380.96
Br0029TTTGTGCCAAAGTCCAAATAGTATTCCAGCTTCTTCTGCCTA59132–178(CT)14140.84
Br0031CCCCCATTTAACACCATAGTTGCTCAAAATGCAATGTACGTG59139–179(AC)7210.93
Br0067TTAGATTCCTCAGGACATTGGTCCTATATGCCGTCGTACTCA59130–171(AT)11250.91
Br0076CCTAGAATGCGGAAGTAGTGATTACGTGTTCCTCGACTCAAC59120–262(CA)7140.88
Br0087TTCCCCCACTACTCATCTCAAACAGCACACCGTAGCAACT59229–261(AT)8360.88
Br0092TTGATCAGTGGGAGGTAGGATGAAACTTGTCCCTTTTTCG58200–295(AT)6140.76
Br0100CCATCTGCAATTATTCAGGAAAGTTCTTGGTGCTTGACCATT58229–286(AT)11230.95
Br0115AATTCATGATCGGAGCACATTGAACAATGGCTTTGAATGA59231–315(GA)8280.93
Br0117AGCTAAGGGGCTACTGTTGGCGCGATCTCCAAAATGTAAT58233–345(TA)5270.83
Br0118AGGAGGTCCAAATCACCAATCGTCAGCAAATTCGTACCAC59237–321(TC)11210.60
Br0122CATTGCTCCTCTCGCACTATCTGCAGTTAGCAGGTTGGTT58223–279(CT)11180.88
Br0130TCCTTTCATGAACCCCTGTACATCGCACGCTTATATGACA58199–299(AG)14260.95
Br0149GCCAAGACCGCTGTTAGAGAACTAACATGGACACCGCTCTT58231–299(AT)9260.91
Br0152ATGCTGCACTTACTGGTTCAGGCTATCAATTCGAAGACCA58233–301(AT)7280.93
Br0156GCCATGATGTTTCATTGGTTTTTTGCACCTTTCATTGCTT58231–286(AT)6280.95
Br0203CGCTTGAGAAGCTAGCAAGTTAGCCTTTTGCATGGGTTAG58208–310(GA)9230.88
Br0212ACTCATTTTCACACGCACAACGAAGAATTGCAGCAGAAGT59248–330(AAT)10210.89
Br0213TGAAGCCCTTTCTAAATGATGGAACTAGGAAGCCATGGACA58212–337(AT)9250.83
Br0214TCTGGTGTCTCTTTGCTCCTTCCATGGTACCTGAATGACA59241–358(CA)5240.96
Br0235CACACTCACACACGGAGAGACATCCAGAGCCTGATGAAGT59239–330(TC)9330.87
Br3002GCTGGAATCAGAATCGATGAGAACTGCAGTGGCTGATCTT59143–187(AAT)7170.92
Br3009AGACTCTGTGCGGGAAATTAACTTCGCTTGTCCTACTTGG58116–199(AT)8400.94
Mean 24.30.89
Table 2. Analysis of molecular variance (AMOVA) of Ugandan Brachiaria ecotypes.
SourceDFSSMSEst. var.(%)
Among populations4942826.981235706.7452905.3532%
Within populations9416796439.605178685.528178685.52898%
Total9817739266.586
Genetic differentiation among ecotype populations (PhiPT) = 0.016; p = 0.142
Notes: DF = degree of freedom, SS = sum of squares, MS = squares, Est. var. = estimate of variance, and (%) = percentage of total variation. p-value is based on 9999 permutations.
Table 3. Proportion of membership of each predefined population from structure analysis (ΔK = 3).
PopulationNumber of IndividualEstimated Membership Coefficient
CICIICIII
Central (CTR)250.384 (10)0.294 (7)0.321 (8)
Northern (NTN)230.354 (8)0.451 (10)0.194 (4)
South dryland (SDL)190.227 (4)0.413 (8)0.361 (7)
Southwestern (SWT)150.284 (4)0.437 (7)0.280 (4)
Western (WST)170.186 (3)0.483 (8)0.331 (6)

