Next Article in Journal
The Development of Winter Wheat Yield and Quality under Different Fertilizer Regimes and Soil-Climatic Conditions in the Czech Republic
Previous Article in Journal
Effect of Tillage, Previous Crop, and N Fertilization on Agronomic and Economic Performances of Durum Wheat (Triticum durum Desf.) under Rainfed Semi-Arid Environment
 
 
Erratum published on 11 January 2021, see Agronomy 2021, 11(1), 126.
Article

Sheep Dung Composition and Phosphorus and Potassium Release Affected by Grazing Intensity and Pasture Development Stage in an Integrated Crop-Livestock System

by
Fernando Arnuti
1,
Luiz Gustavo de O. Denardin
1,*,
Pedro Arthur de A. Nunes
2,
Lucas A. Alves
1,
Diego Cecagno
1,
Júlia de Assis
1,
Walker da S. Schaidhauer
1,
Ibanor Anghinoni
1,
Abad Chabbi
3 and
Paulo César de F. Carvalho
2
1
Departament of Soil Science, Federal University of Rio Grande do Sul, 7712 Bento Gonçalves Avenue, Porto Alegre 91540-000, RS, Brazil
2
Department of Forage Plants and Agrometeorology, Federal University of Rio Grande do Sul, 7712 Bento Gonçalves Avenue, Porto Alegre 91540-000, RS, Brazil
3
French National Research Institute for Agriculture, Food and Environment (INRAE), Poitou-Charentes, 86600 URP3F Lusignan, France
*
Author to whom correspondence should be addressed.
Agronomy 2020, 10(8), 1162; https://doi.org/10.3390/agronomy10081162
Submission received: 15 July 2020 / Revised: 23 July 2020 / Accepted: 28 July 2020 / Published: 7 August 2020
(This article belongs to the Section Farming Sustainability)

Abstract

:
Animal grazing in integrated crop-livestock systems (ICLS) results in continuous nutrient release to forage plants and crops in succession. This study aimed to assess sheep dung composition and decomposition rates under distinct grazing intensities and at different development stages of Italian ryegrass pasture (Lolium multiflorum Lam.), and to evaluate dung phosphorus (P) and potassium (K) release dynamics during two annual ICLS cycles (2015 and 2016) in southern Brazil. Treatments consisted of two grazing intensities (moderate and light) and two pasture development stages (vegetative and post-flowering), arranged in a randomized complete block design with split-split-plots and four replicates. Dry matter (DM) decomposition and P and K release rates were determined using litter bags with sheep dung. Grazing intensity did not affect sheep dung composition. Forage consumed at different development stages altered sheep dung composition, decomposition, and P and K release rates. Dung sampled at pasture vegetative stage showed P and K contents 16% and 7% higher, respectively, than dung from the post-flowering stage. Dung collected at pasture post-flowering stage had 26% more cellulose and 34% more hemicellulose compared to dung from the vegetative stage in 2016. P and K release was greater for dung from pasture vegetative stage, reaching 3.7 and 12.9 kg ha−1 of P and K, respectively. Further evaluations are still needed considering the quantification and release of nutrients in each of the different compartments (pasture, urine, and dung residues) that compose the system.

1. Introduction

The rotation of cash crops and livestock production in the same land area is typical of commercial integrated crop-livestock systems (ICLS) worldwide [1,2]. These systems are recognized for providing ecological interactions between system components [3]. For instance, deposition and decomposition of animal manure during the grazing period of ICLS result in continuous nutrient release to forage plants. It is estimated that between 70 and 95% of grazing animals’ nutrient intake returns to pasture via excreta [4] and can be reused by forages or grain crops in succession [5].
By transforming forage plants into dung, grazing animals become important diversifying agents to cropping systems, since different forms of residue (i.e., plant litter and animal wastes) also have different nutrient concentrations and release rates to the soil [6]. Residue diversity also benefits soil microbial diversity, which is greater under moderate grazing intensities [7]. As a consequence, increased biodiversity has been recently acknowledged as the responsible for higher grain yields and nutrient use efficiencies under ICLS, ultimately reducing fertilizer requirements and increasing systems’ self-sufficiency [8].
In this context, grazing intensity is pivotal to define the productivity and the sustainability of ICLS enterprises [9]. It directly influences plant leaf area and light interception by pasture canopy, affecting plant growth and structural characteristics, such as leaf/stem ratio, botanical composition, and tillering dynamics of pasture species [10]. Sward structure, in turn, defines if animal intake will be either maximized or constrained, directly affecting livestock performance (i.e., live weight gains per individual and per area), the amount of dung returned to the system and its contribution as potential source or buffer to greenhouse gas emissions [11]. Different grazing intensities may also affect nutrient allocation patterns of plants, forage digestibility [12] and the chemical composition and decomposition rate of livestock dung, finally affecting nutrient release to the system [13].
Another factor influencing pasture structural and chemical composition is plant development stage. Nutrient content tends to be higher in young plant tissues (i.e., vegetative stage) compared to older tissues of the post-flowering stage [6]. Similarly, as participation of structural components in forages (hemicellulose, cellulose, lignin, and silica) increase throughout pasture production cycle, soluble component levels (amino acids, proteins, lipids, and starch) decline [14]. As plant cell wall content increases, indigestible lignin accumulates in older tissues of the post-flowering stage [15], affecting dry matter (DM) intake and digestibility [16]. Thus, depending on the length of the stocking period (especially under continuous stocking method, when animal grazing is season-long) [9], animals may find different forage compositions over time, possibly resulting in different dung composition, degradation and nutrient release rates over the same stocking period.
In addition to factors that affect animal intake (e.g., grazing intensity and pasture development stage), each nutrient presents its own peculiarities with regards to release rates from dung. Potassium (K) normally shows high release rates to the soil since it is not associated with any organic structure [17]. Phosphorus (P), in turn, presents soluble (inorganic) and insoluble (organic) forms, each showing distinct release patterns to the soil [18] and frequently requiring microbial action for mineralization [19].
We hypothesized that composition and decomposition rates and nutrient release from sheep dung over an annual ICLS cycle depend on two main factors: (i) the grazing intensity employed in the pasture phase; and (ii) the development stage of plants subjected to grazing. To test this hypothesis, we assessed sheep dung composition and decomposition rates under two distinct grazing intensities (moderate and light) and at two different pasture development stages (vegetative and post-flowering phenological stages), and evaluated dung P and K release dynamics during the entire cycle of an integrated soybean-sheep production system in southern Brazil.

2. Materials and Methods

2.1. History of the Experimental Area

The study was carried out in a long-term integrated crop-livestock system (ICLS) experiment established in 2003 at the Agronomic Experimental Station of the Federal University of Rio Grande do Sul (UFRGS), in the municipality of Eldorado do Sul (30°05′22″ S, 51°39′08″ W, 46 m a.s.l.), Rio Grande do Sul State, Brazil. The region has a humid subtropical climate (Cfa) according to the Köppen classification [20], with average annual temperature of 18.8 °C. Monthly average precipitation and temperature in the experimental area in 2015 and 2016 can be found in Figure S1. The soil is classified as a sandy clay loam Acrisol [21], with 19% clay content. The relief is slightly undulating with deep, well-drained soil.
Originally, the 4.8 hectares experimental site was a natural grassland. In the winter of 2003, the area was divided into 16 plots with areas varying from 0.23 to 0.41 ha and the long-term integrated sheep-soybean experiment was implemented. Prior to its implementation, the soil was plowed and 1.0 Mg ha−1 of lime was applied to the entire area to raise the pH of the 0–10 cm soil layer up to 6.0. Soil natural fertility was improved with the application of 10 kg N ha−1, 40 kg P2O5 ha−1 and 40 kg K2O ha−1 to meet an expected soybean grain yield of 3.0 Mg ha−1, as required by soil analyses [22]. Italian ryegrass (Lolium multiflorum Lam.) was then sown broadcast at 32 kg ha−1 sowing density.

2.2. Experimental Design and Conduction

The experimental design was a randomized complete block with split-split-plots (2 × 2 × 2) and four replicates. Plots consisted of two grazing intensities by sheep in the winter season (moderate and light), split-plots consisted of two experimental years (2015 and 2016), and split-split-plots consisted of two dung sampling periods (i.e., dung sampled during the vegetative and the post-flowering phenological stages of Italian ryegrass pasture).
Grazing intensities were defined by means of forage allowance, expressed in kg of DM per 100 kg of live weight (LW) per day, as follows: (i) moderate grazing intensity—forage allowance equivalent to 2.5 times the sheep intake potential; and (ii) light grazing intensity—forage allowance equivalent to 5 times the sheep intake potential. According to the National Research Council [23], sheep forage intake potential is 4% (DM basis). Therefore, moderate and light grazing intensities equal 10 and 20% of sheep LW, respectively. Sward height was monitored every two weeks with a sward stick [24] at 50 random locations per plot. Average sward heights were 15 ± 3 and 25 ± 2 cm in 2015, and 12 ± 3 and 18 ± 3 cm in 2016 for moderate and light grazing intensities, respectively. Average herbage mass over the stocking period was 1442 ± 130 and 2203 ± 98 kg DM ha−1 in 2015, and 2217 ± 319 and 3262 ± 862 kg DM ha−1 in 2016 for moderate and light grazing intensities, respectively.
The experimental animals were castrated male crossbred Corriedale and Texel lambs with average initial live weight of 25 kg and nine to twelve months of age. Each experimental unit (plot) received three tester animals in July (for detailed information about experimental dates, see Figure S2), which remained over the whole winter period under continuous stocking, and a variable number of ‘put-and-take’ animals to adjust the grazing intensity to treatment targets [25]. Average stocking rates were 855 ± 93 and 910 ± 106 kg LW ha−1 in 2015, and 677 ± 104 and 633 ± 156 kg LW ha−1 in 2016 for moderate and light grazing intensities, respectively.
The Italian ryegrass pasture was yearly established by self-seeding. In both experimental years, however, the whole experimental area received a supplementary broadcast sowing of 25 kg of seed ha−1 to ensure the same initial conditions for all experimental units. Pasture fertilization prior to the experimental years consisted of 20, 60, and 60 kg ha−1 of N, P2O5, and K2O, respectively, right after the supplementary sowing operation, and 150 kg ha−1 of N in the form of urea (45% N) equally partitioned in two applications: at plants tillering and pre-flowering stages. At the end of each stocking period (26 October 2015 and 27 October 2016), sheep were removed from the experimental area and plots were desiccated with glyphosate to allow soybean direct-sowing. Soybean crop was sown without fertilization, using 45 cm row spacing and a target plant population of 280,000 plants ha−1.

2.3. Dung Sampling and Composition Analysis

Dung sampling dates (Figure S2) were established based on pasture development stage (vegetative and post-flowering plant stages). In both stages, all the dung from the tester animals was collected over 24 h using individual collection bags. Dung samples were dried in a forced air circulation oven at 55 °C until constant weight and then proceeded to nutrient composition and decomposition analyses. For the calculation of total dung production (kg DM ha−1) and total nutrient return to the experimental area (kg of specific nutrient ha−1), we used the average individual dung production (g DM sheep−1 day−1) found by Savian (2017, unpublished data) in the same experimental area, during the same years evaluated in our study. The reason for using data from this author was the need for more accurate values for individual daily dung production, which was possible through sampling over five consecutive days at each pasture development stage.
Samples containing ten grams of dung were placed in nylon litter bags [26] with 2 mm opening and 10 × 10 cm size. The litter bags were distributed on the soil surface at two different moments over the ICLS annual cycle (Figure S2): (i) during the winter stocking period (also referred as pasture decomposition phase, containing dung from the first sampling period, i.e., from pasture vegetative stage); and (ii) immediately after soybean sowing (also referred as crop decomposition phase, containing dung from the second sampling period, i.e., from pasture post-flowering stage). During the pasture phase, litter bags were allocated under a 15-cm-high metallic grid in order to allow grazing without potential damage from sheep trampling. During the crop phase, litter bags were distributed between soybean crop rows. Litter bag collections were carried out over time at 7, 14, 21, 36, 51, 66, 96, 126, 156, and 216 days after their distribution in the field. In the laboratory, litter bags were dried and weighed for determining the residual dung DM mass. Following the DM determination, dung was ground in a Wiley mill (≤40 mesh) and P and K contents were analyzed after chemical digestion (H2O2 + H2SO4) according to Tedesco et al. [27]. The P content was determined by photocolorimetry and K content by flame photometry. Neutral detergent fiber (NDF), acid detergent fiber (ADF) and lignin were determined according to Van Soest and Robertson [28]. Hemicellulose and cellulose contents were calculated as the difference of NDF-ADF and ADF-lignin, respectively. Residual DM and P and K contents were then extrapolated based on total dung DM production and P and K contents at the beginning and end of each field incubation period.

2.4. Dung Decomposition and Nutrient Release over Time

Nutrient release from plant litter after operations such as desiccation and harvest are initially concentrated, declining over time [29]. In the stocking period of an ICLS, however, as in any other grazing system, animal dung is continually deposited on the soil surface. As a result, dung at different stages of decomposition and nutrients being released and cycled at different rates can be found over time. For this reason, differently from the approach used by Assmann et al. [29], we created a matrix in descending order of dung decomposition days. Fitting the models using the matrix method favors obtaining more accurate trends, but disregards possible differences related to dung chemical composition and texture [17].
Dry matter decomposition and P and K release rates were estimated by fitting nonlinear regression models to observed values from the litter bags, following the approach of Wieder and Lang [26] and using the SigmaPlot® software (SPSS Inc., Chicago, IL, USA). The residual dry matter (RDM) was given by the following equation:
RDM ( % ) = A × exp ( k 1 ×   t ) + ( 100 A ) × exp ( k 2 ×   t )
Daily K and P release rates (kg ha−1 day−1) were calculated by the following equations, adapted from Wieder and Lang [26]:
K = { 100 [ A × exp ( k 1 ×   t ) + ( 100 A ) ] × Qi } 100
P   = { 100 [ A × exp ( k 1 ×   t ) + ( 100 A ) × exp ( k 2 ×   t ) ] × Qi } 100
where Qi is the initial amount of K and P (kg ha−1) in sheep dung at each decomposition phase and year, k1 is the decomposition constant rate of the most easily decomposable compartment (A); k2 is the decomposition constant rate of the most recalcitrant compartment (100-A); and t is the number of decomposition days.
Compartments A and 100-A and constants k1 and k2 of the equations were calculated using SigmaPlot® software. The constants were substituted in a matrix in descending order in Excel spreadsheet. The decomposition constants from compartments A and 100-A were used to calculate half-life times (t1/2) according to the equation:
t 1 / 2 = 0.693 k 1   ( or   k 2 )
where t1/2 is the time required for 50% of DM or nutrients from that compartment to decompose or to be released; k1 is the constant decomposition/release rate of nutrients from compartment A; and k2 the constant decomposition/release rate from compartment 100-A [30].
The daily variation in nutrient release (K and P, kg ha−1 day−1) was calculated as the difference between nutrient release obtained in Equations (1) and (2) for a given day (Xn) and nutrient release of the previous day (Xn-1). These amounts were then summed within the matrix up to a pre-established maximum of 200 days for the quantification of accumulated P and K that returned to the soil.
To more reliably represent the dynamics of dung deposition/decomposition and nutrient release trends from day one of the stocking period, we relocated the P and K release models over the timeline according to the following logic: (i) dung collected in the first sampling date represented P and K release dynamics of the whole pasture vegetative period. For this purpose, we moved the nutrient model to the first grazing day (day one of dung deposition) and considered that dung deposition in this model ended at the first sampling date, totaling 65 and 55 days of deposition for the years 2015 and 2016, respectively (Figure S2); and (ii) dung collected in the second sampling date represented P and K release dynamics of the whole pasture reproductive period, so we moved the nutrient model to start on the first sampling date, extending until the last grazing day (last day of dung deposition), totaling 43 and 41 days of deposition for the years of 2015 and 2016, respectively (Figure S2).

2.5. Statistical Analysis

To compare the effect of dung decomposition and nutrient release rates, we used the average of the 10 litter bag sampling dates. Data were submitted to analysis of variance (ANOVA) at 95% confidence level using SAS software version 9.0, according to the model:
Yijkl = µ + Bi + Ij + Error A (ij) + Yk + IjYk + Error B (ijk) + Pl + IjPl + YkPl + IjYkPl + Error C (ijkl)
where: µ = overall experimental mean; B = blocks (i = 1, 2, 3, 4); I = grazing intensity (j = 1, 2); Y = year (k = 1, 2); P = sampling period (l = 1, 2) and Error = experimental error. When significant differences were detected, means were compared using Tukey’s test (p < 0.05).

3. Results

3.1. Dung Composition and Daily Nutrient Return to the System

Grazing intensity did not affect P and K contents of sheep dung (p > 0.05). However, greater P and K contents were found in dung samples from the pasture vegetative stage (16 and 7% higher P and K contents, respectively, compared to dung from the post-flowering development stage on average of the experimental years; p < 0.05, Table 1). The higher number of grazing animals during 2015 stocking period resulted in greater dung deposition compared to 2016 (8.1 and 5.5 kg ha−1 day−1, respectively; p < 0.05, Table 1). As a result, total nutrient return via dung to the area was also greater in 2015 for both pasture development stages, and it was the highest in 2015 vegetative stage (95.0 g ha−1 day−1 of P and 201.4 g ha−1 day−1 of K; p < 0.05, Table 1). Dung collected in 2016 post-flowering stage showed a higher proportion of cellulose and hemicellulose when compared to dung from the vegetative stage (26 and 34% higher, respectively; p < 0.05, Table 2). Lignin content showed no differences among years or pasture development stages (p > 0.05).

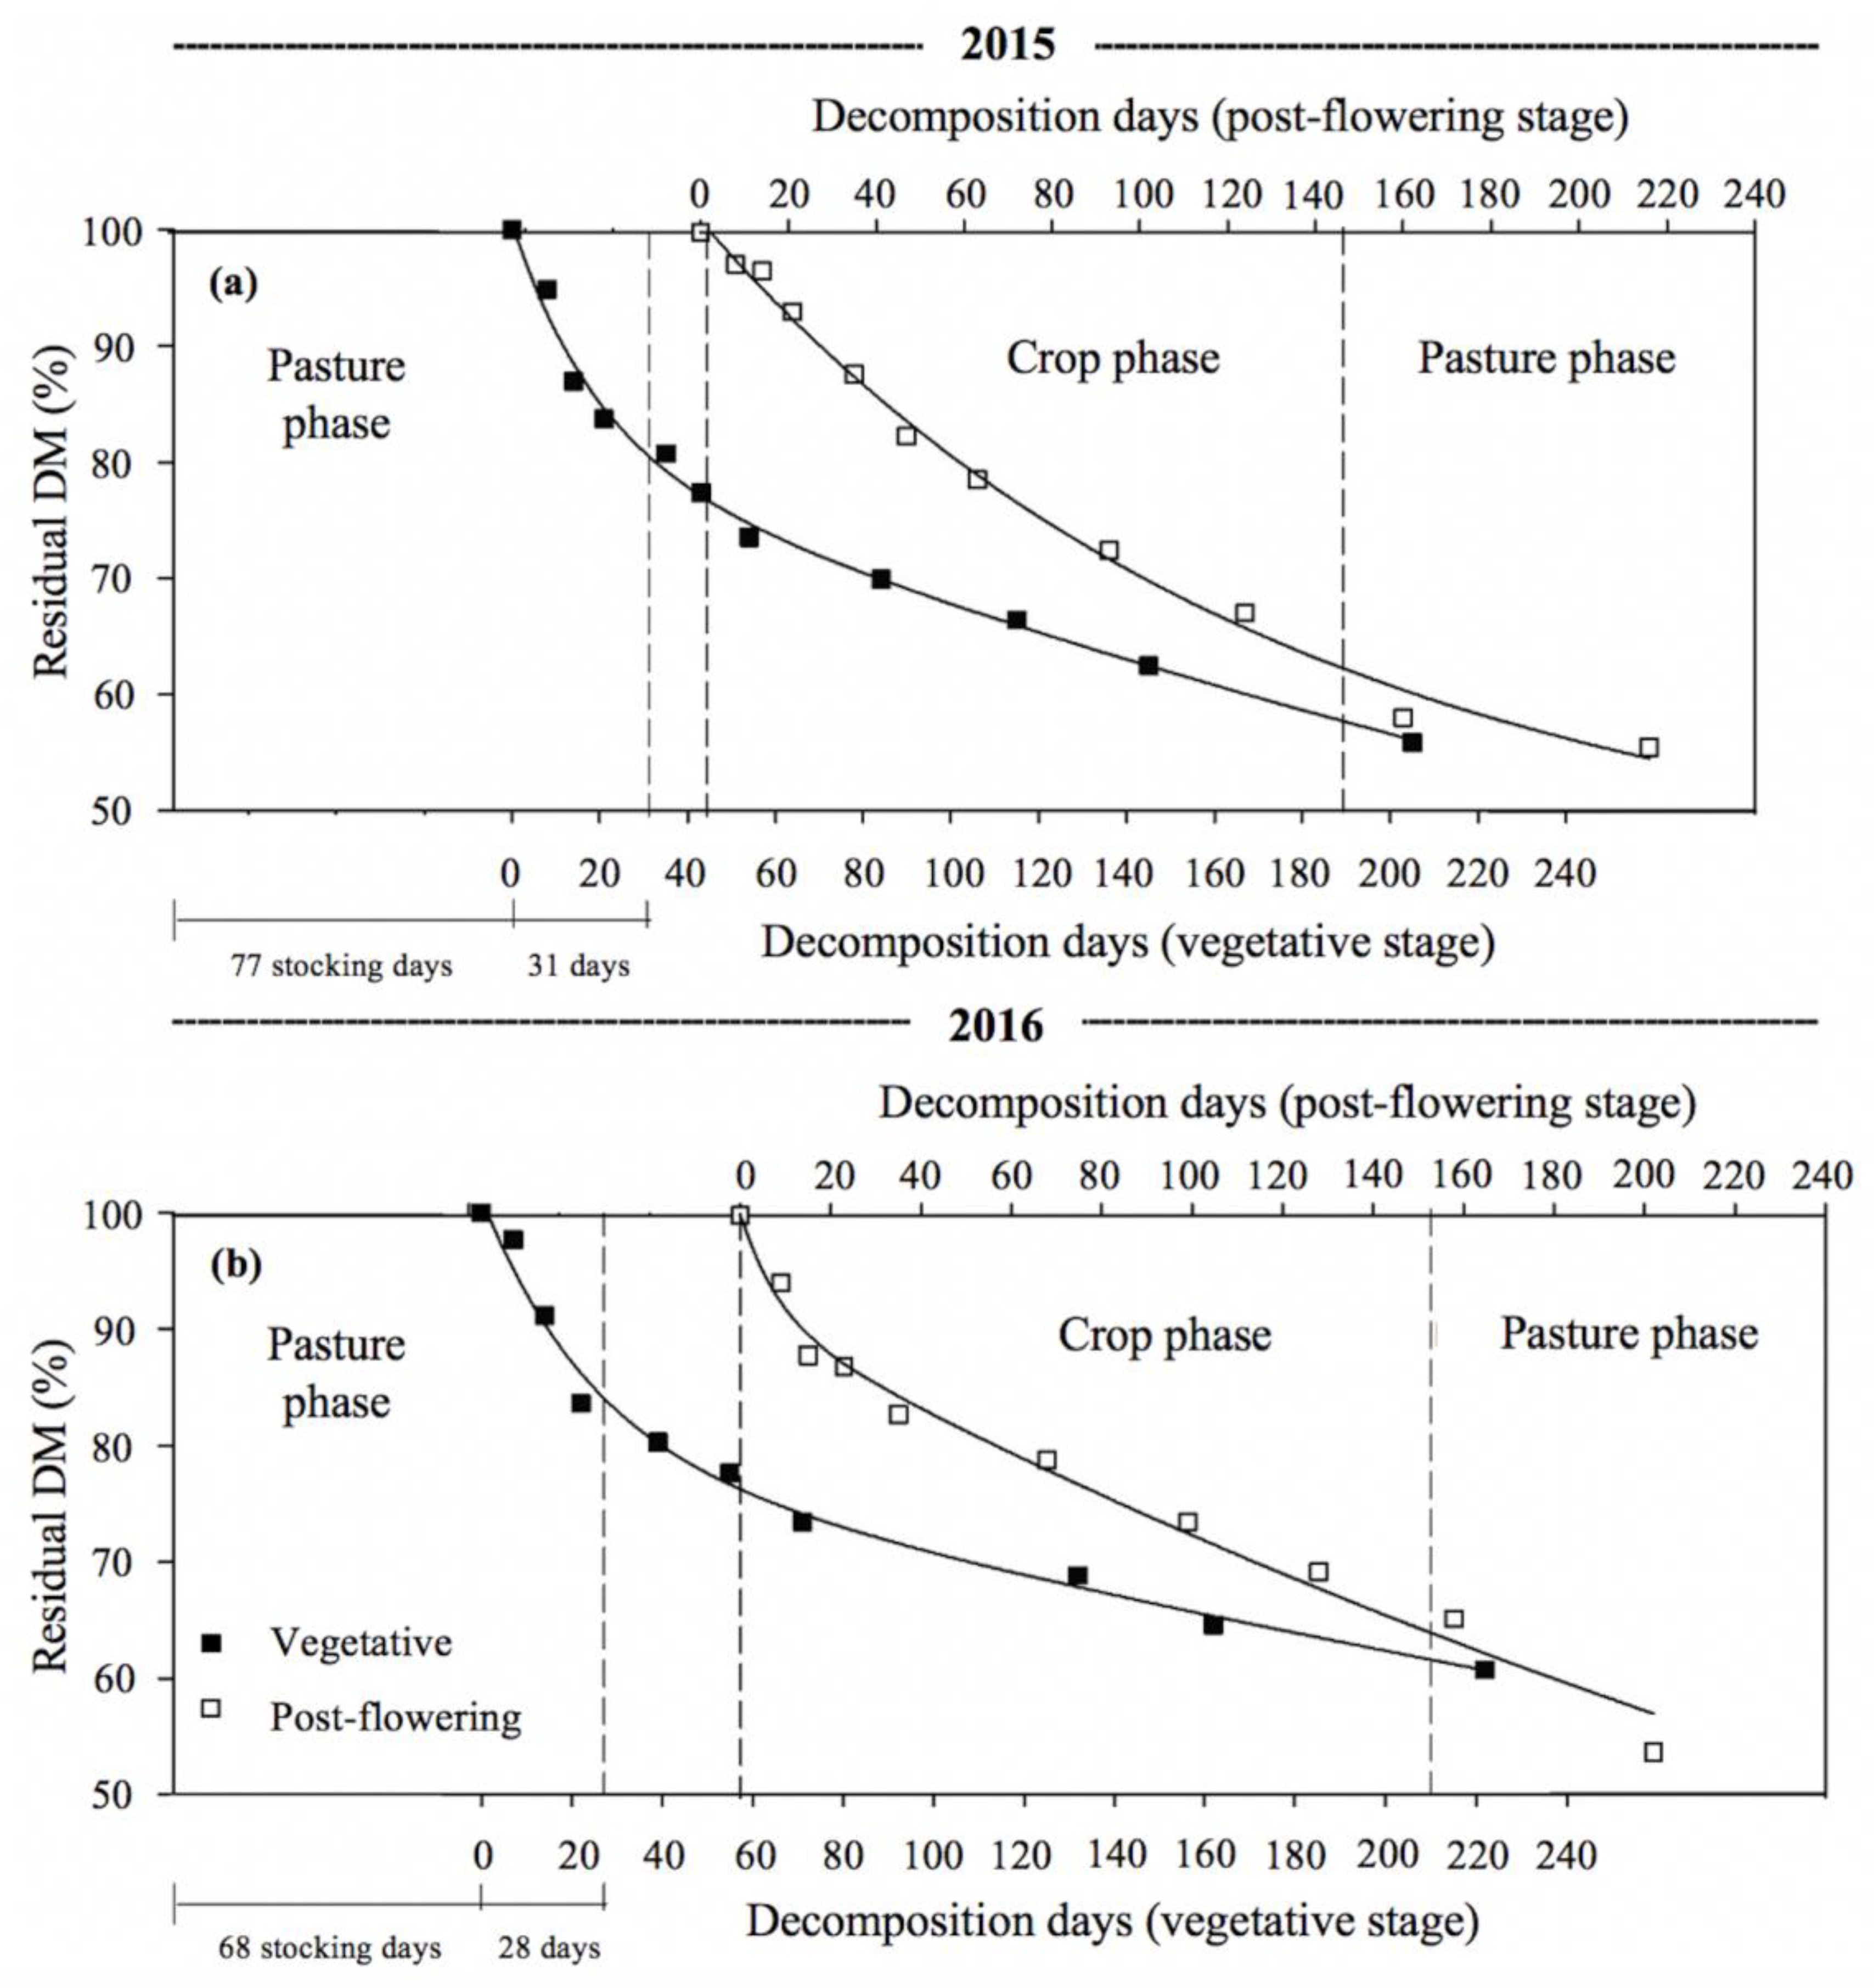
3.2. Dung Decomposition

Dung samples initially presented a rapid decline in dry matter (DM) in both decomposition phases (Figure 1). Up to 30 days after litter bags distribution in the field, dung collected at the vegetative stage presented greater decomposition for both years when compared to that collected at pasture post-flowering stage (18% and 13%, respectively; Figure 1). After 200 days of litter bags deposition in the field, 60% and 57% of dung residual DM (RDM) were still on the soil surface during pasture and crop decomposition phases, respectively (Figure 1).
The double exponential model provided the best fit for dung RDM (Table 3). The proportion of the labile fraction in sheep dung was not affected by any of the variables (grazing intensities, decomposition phases or years; p > 0.05). The majority of the dung was in the recalcitrant compartment (64 to 87%), with a lower percentage in the labile decomposable fraction (Table 3).
In 2015, the proportion of the labile compartment was not influenced by the decomposition phase (p > 0.05, Table 3). In that year, the decomposition rate of the labile fraction was higher for dung collected at pasture vegetative stage compared to the post-flowering stage (0.0442 day−1 and 0.0128 day−1, respectively). This resulted in a different half-life time of 16 and 54 days, respectively.
In 2016, the participation of the labile fraction was influenced by the decomposition phase (p < 0.05, Table 3). Dung collected at pasture post-flowering stage and deposited in the crop phase presented a labile content 38% lower than dung from pasture vegetative stage (Table 3). However, the decomposition rates of the compartments did not differ between decomposition phases or years (p > 0.05). On the other hand, the decomposition rate from the recalcitrant fraction exhibited higher half-life time for dung collected at pasture vegetative stage (594 days) compared to the dung collected at the pasture post-flowering stage (385 days).

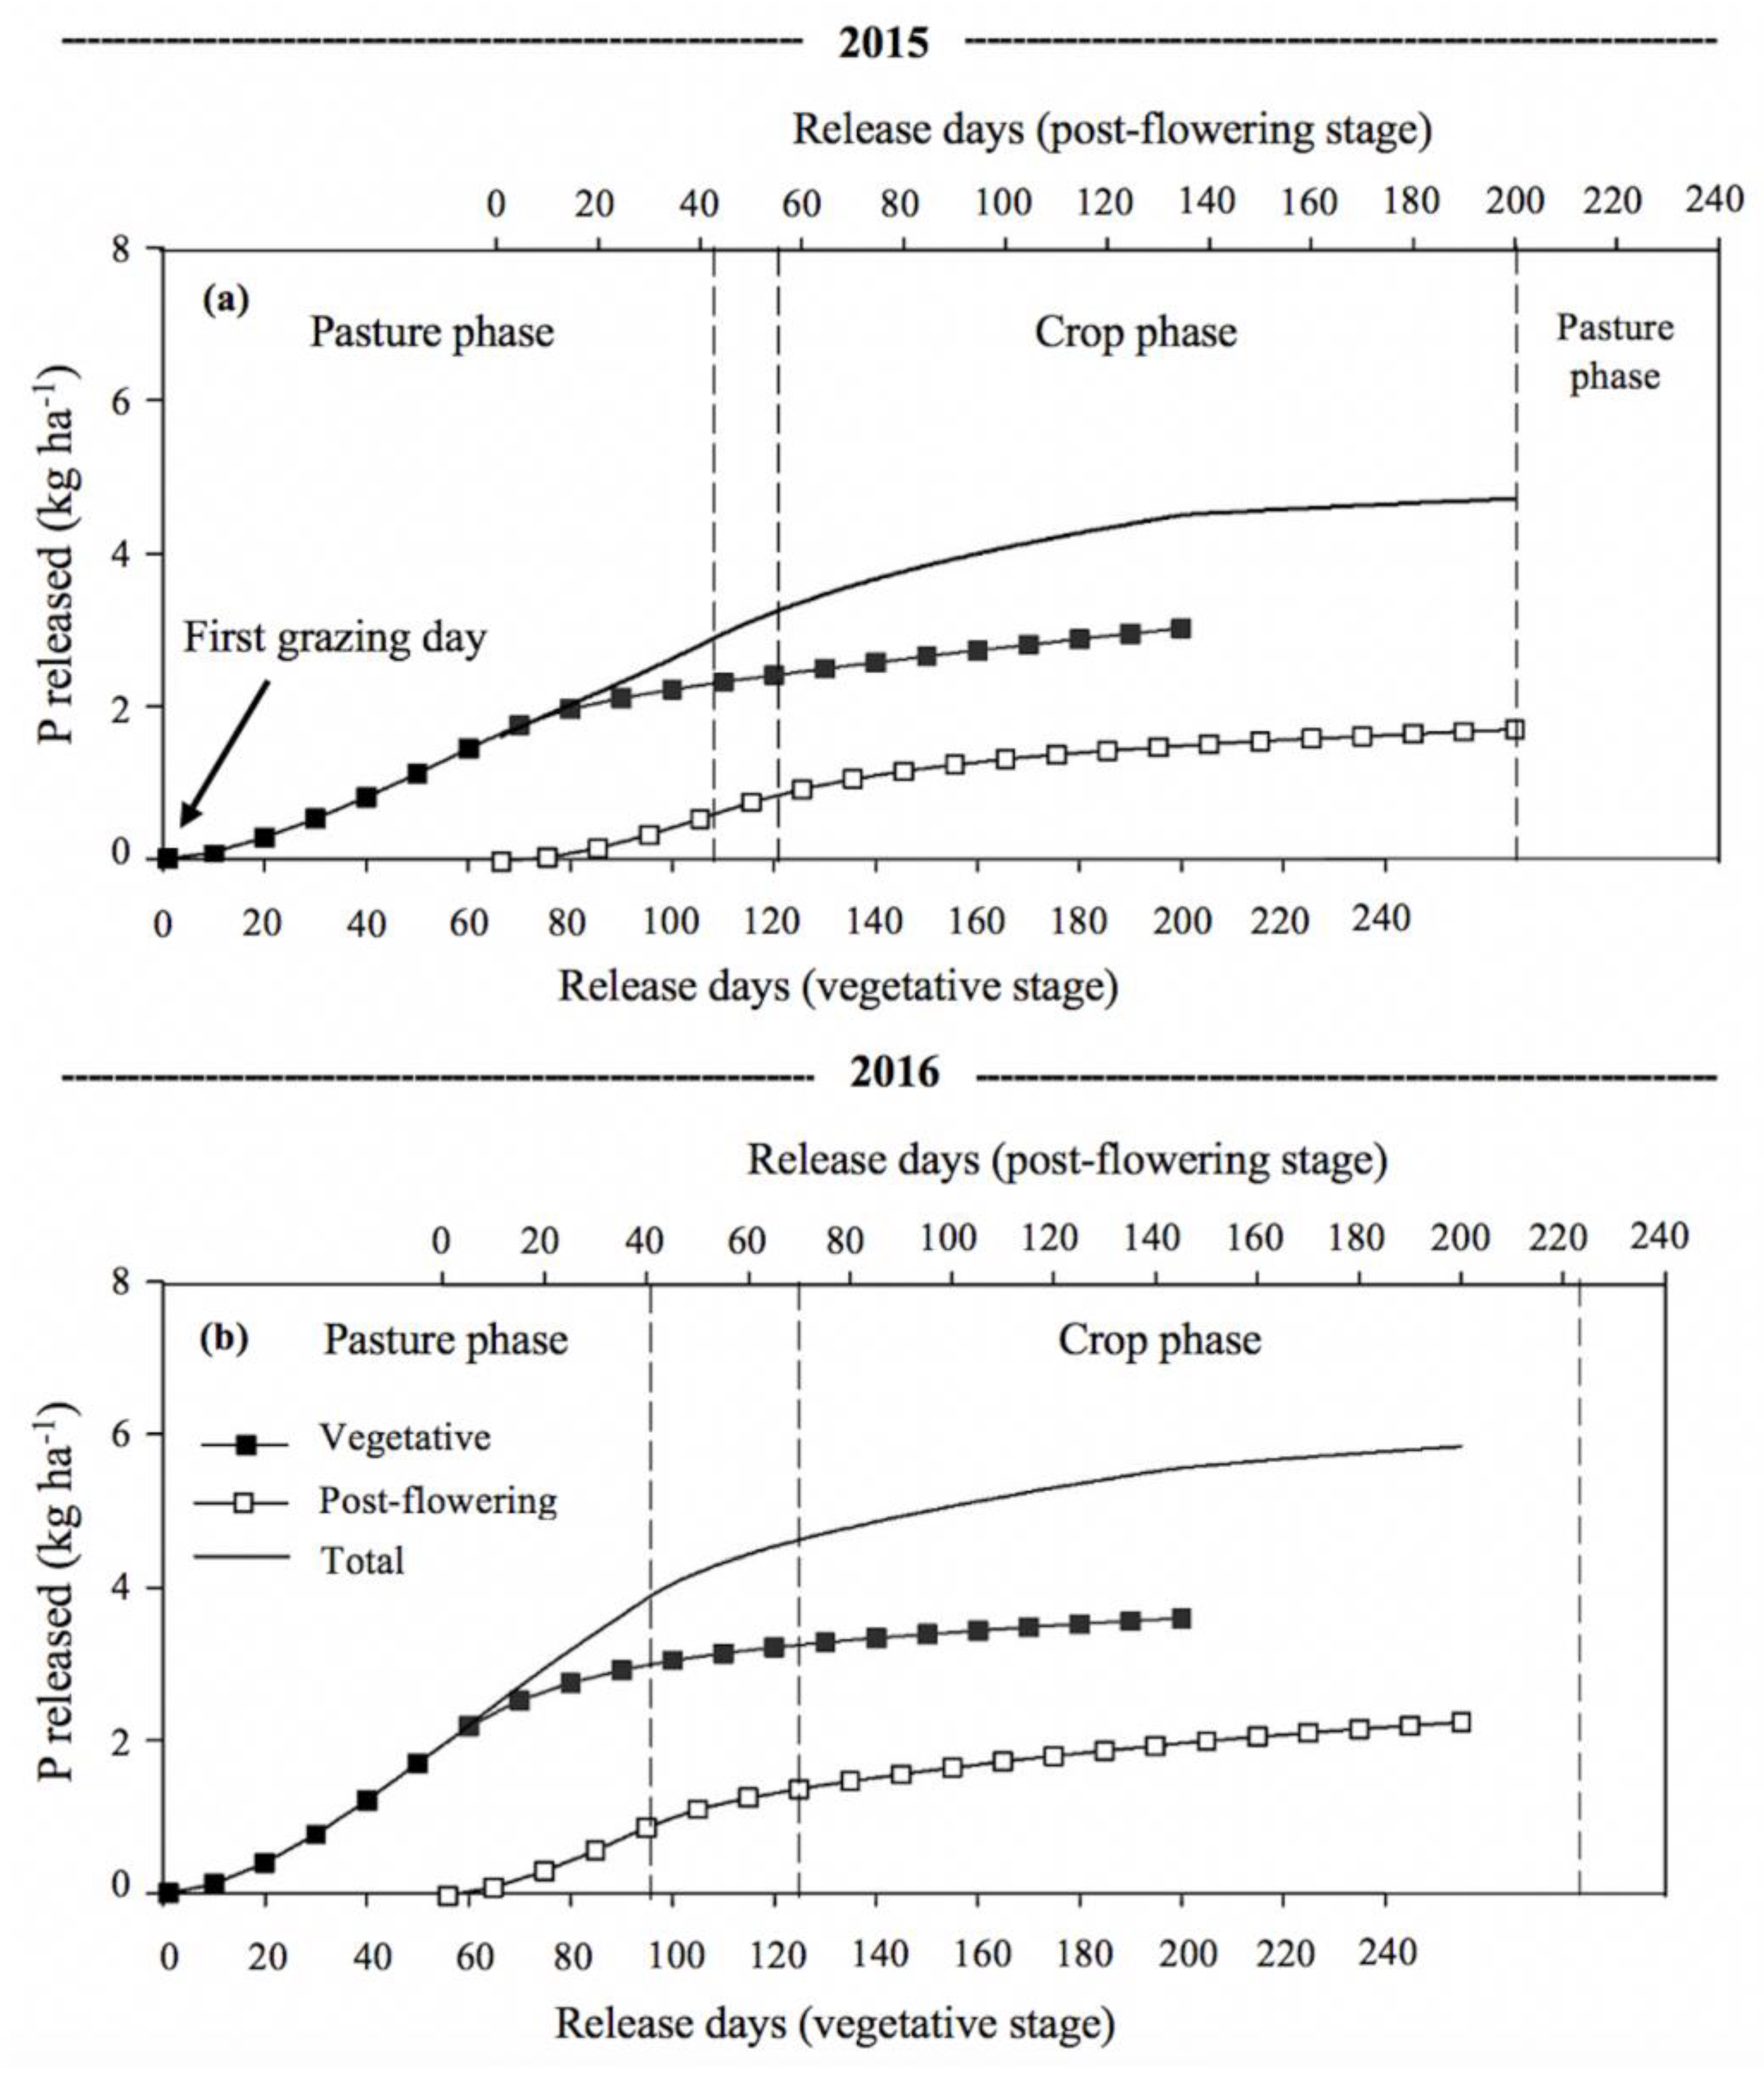
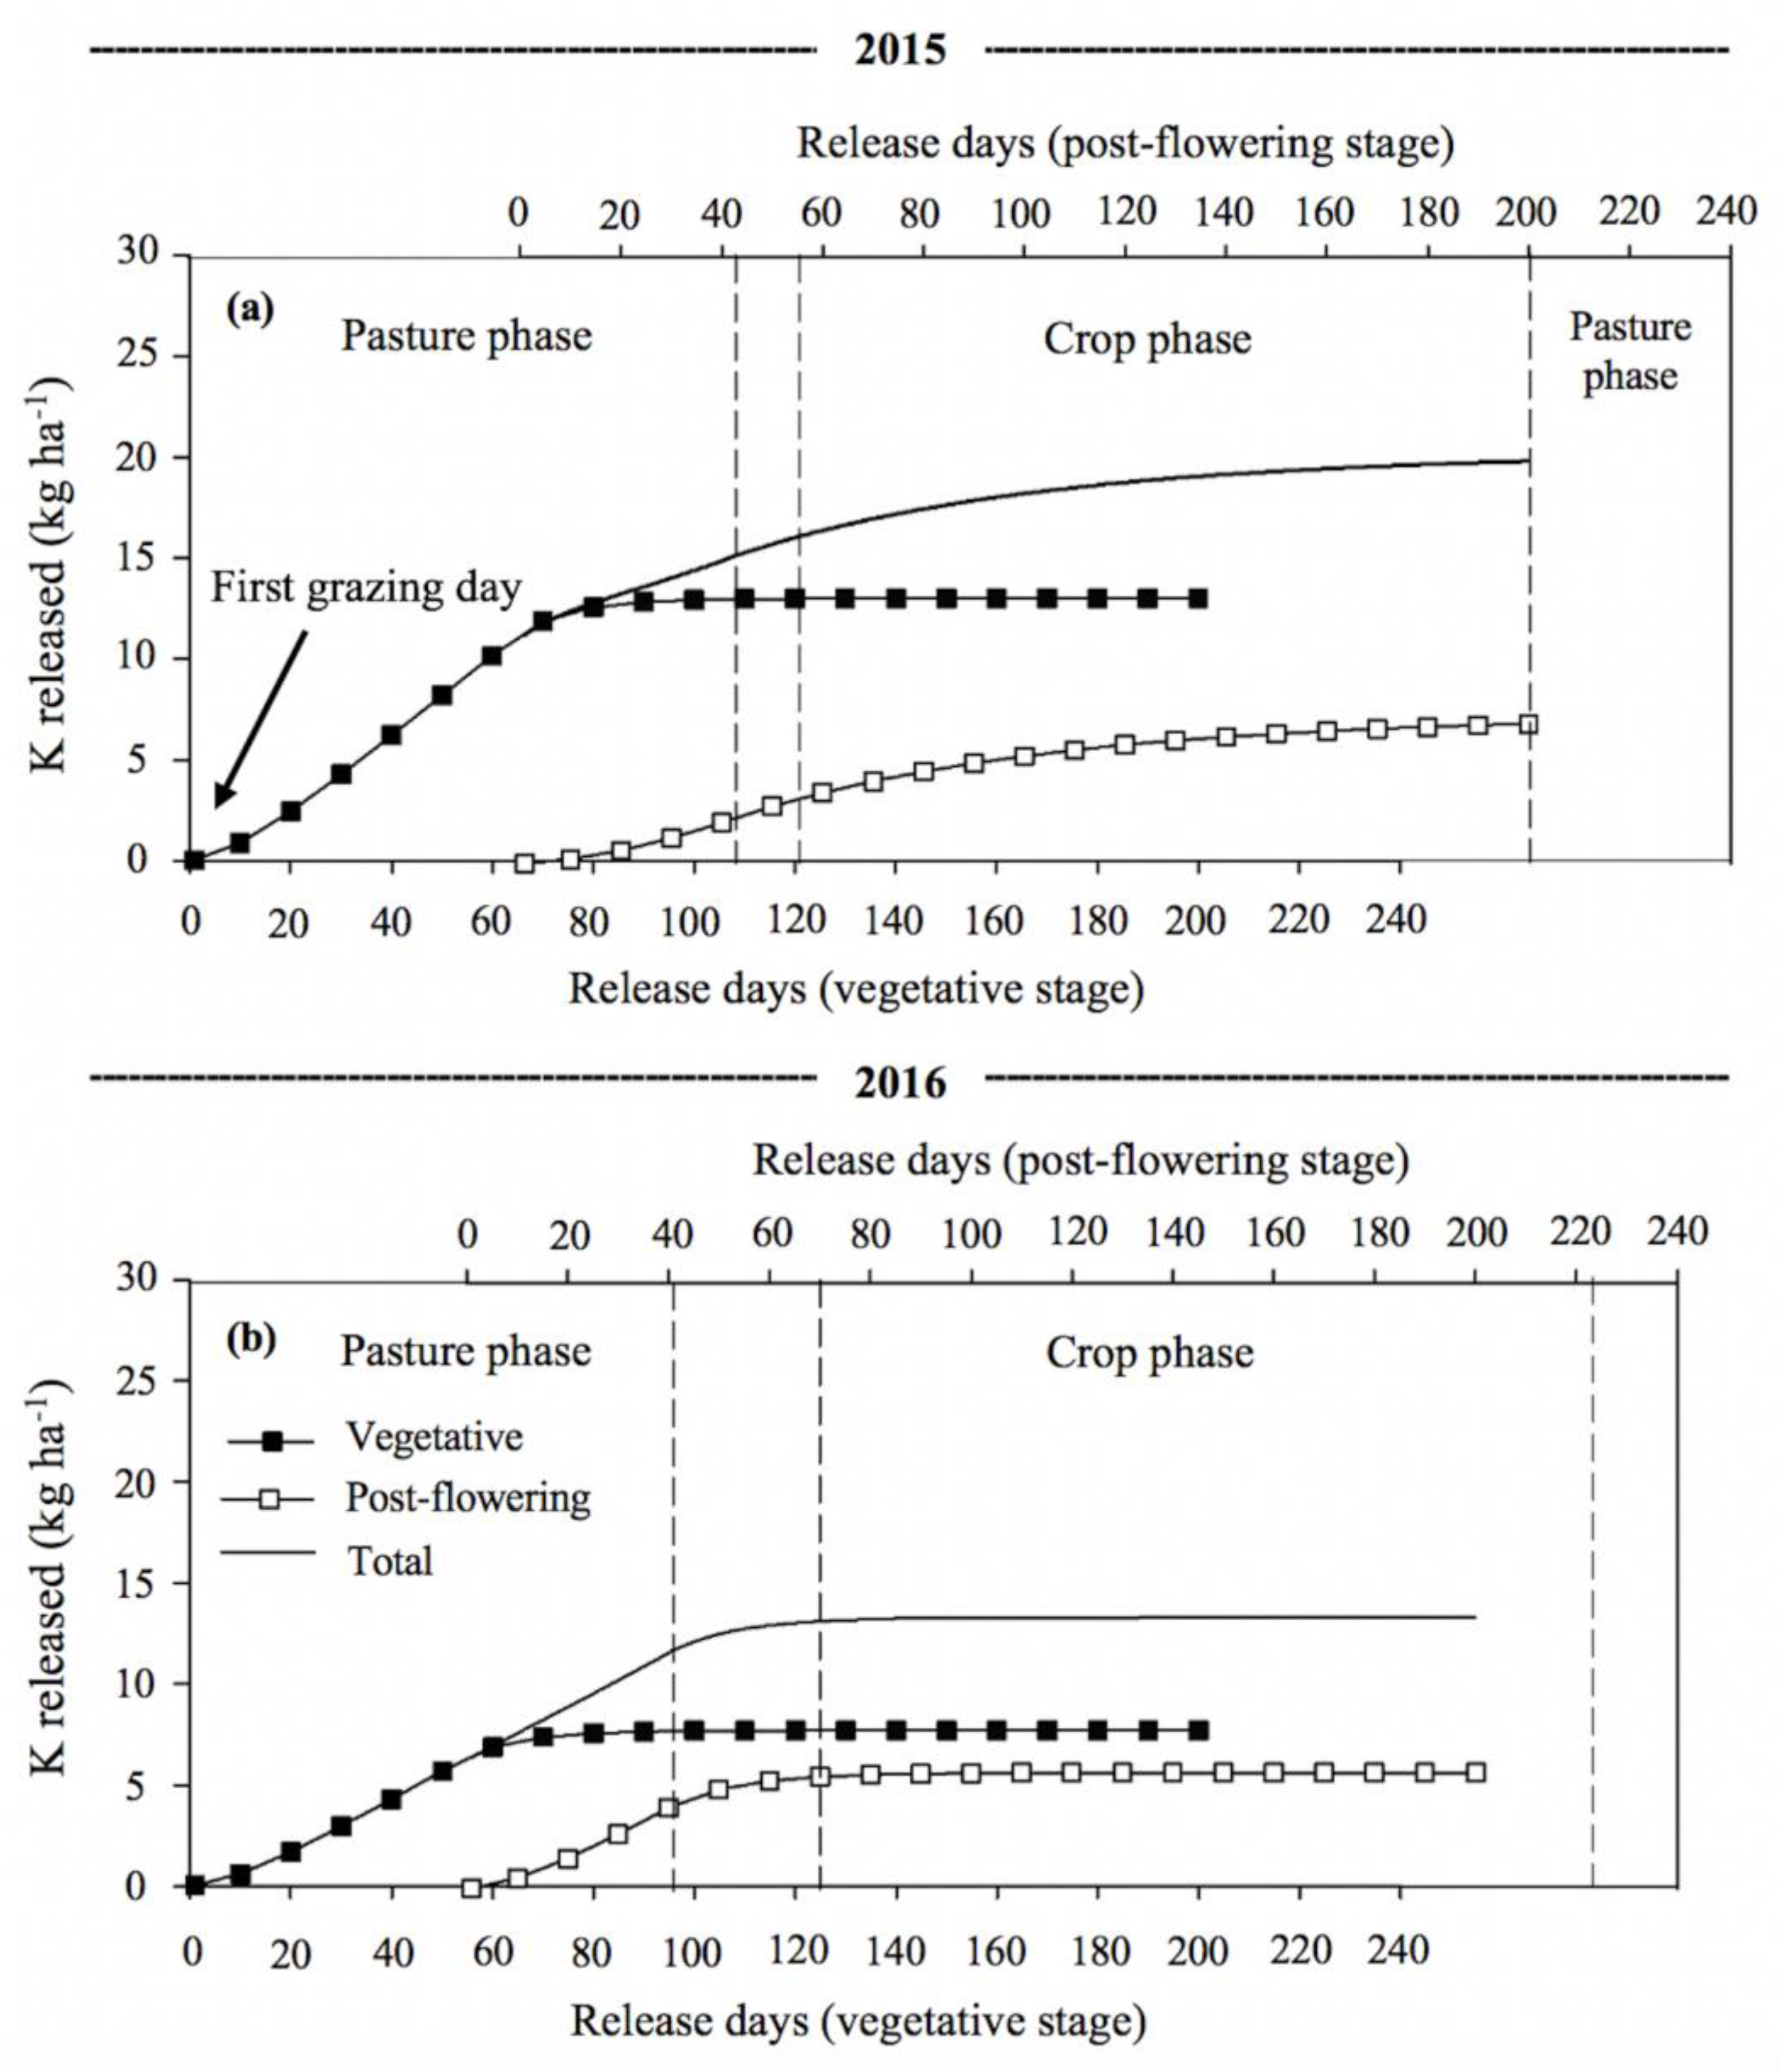
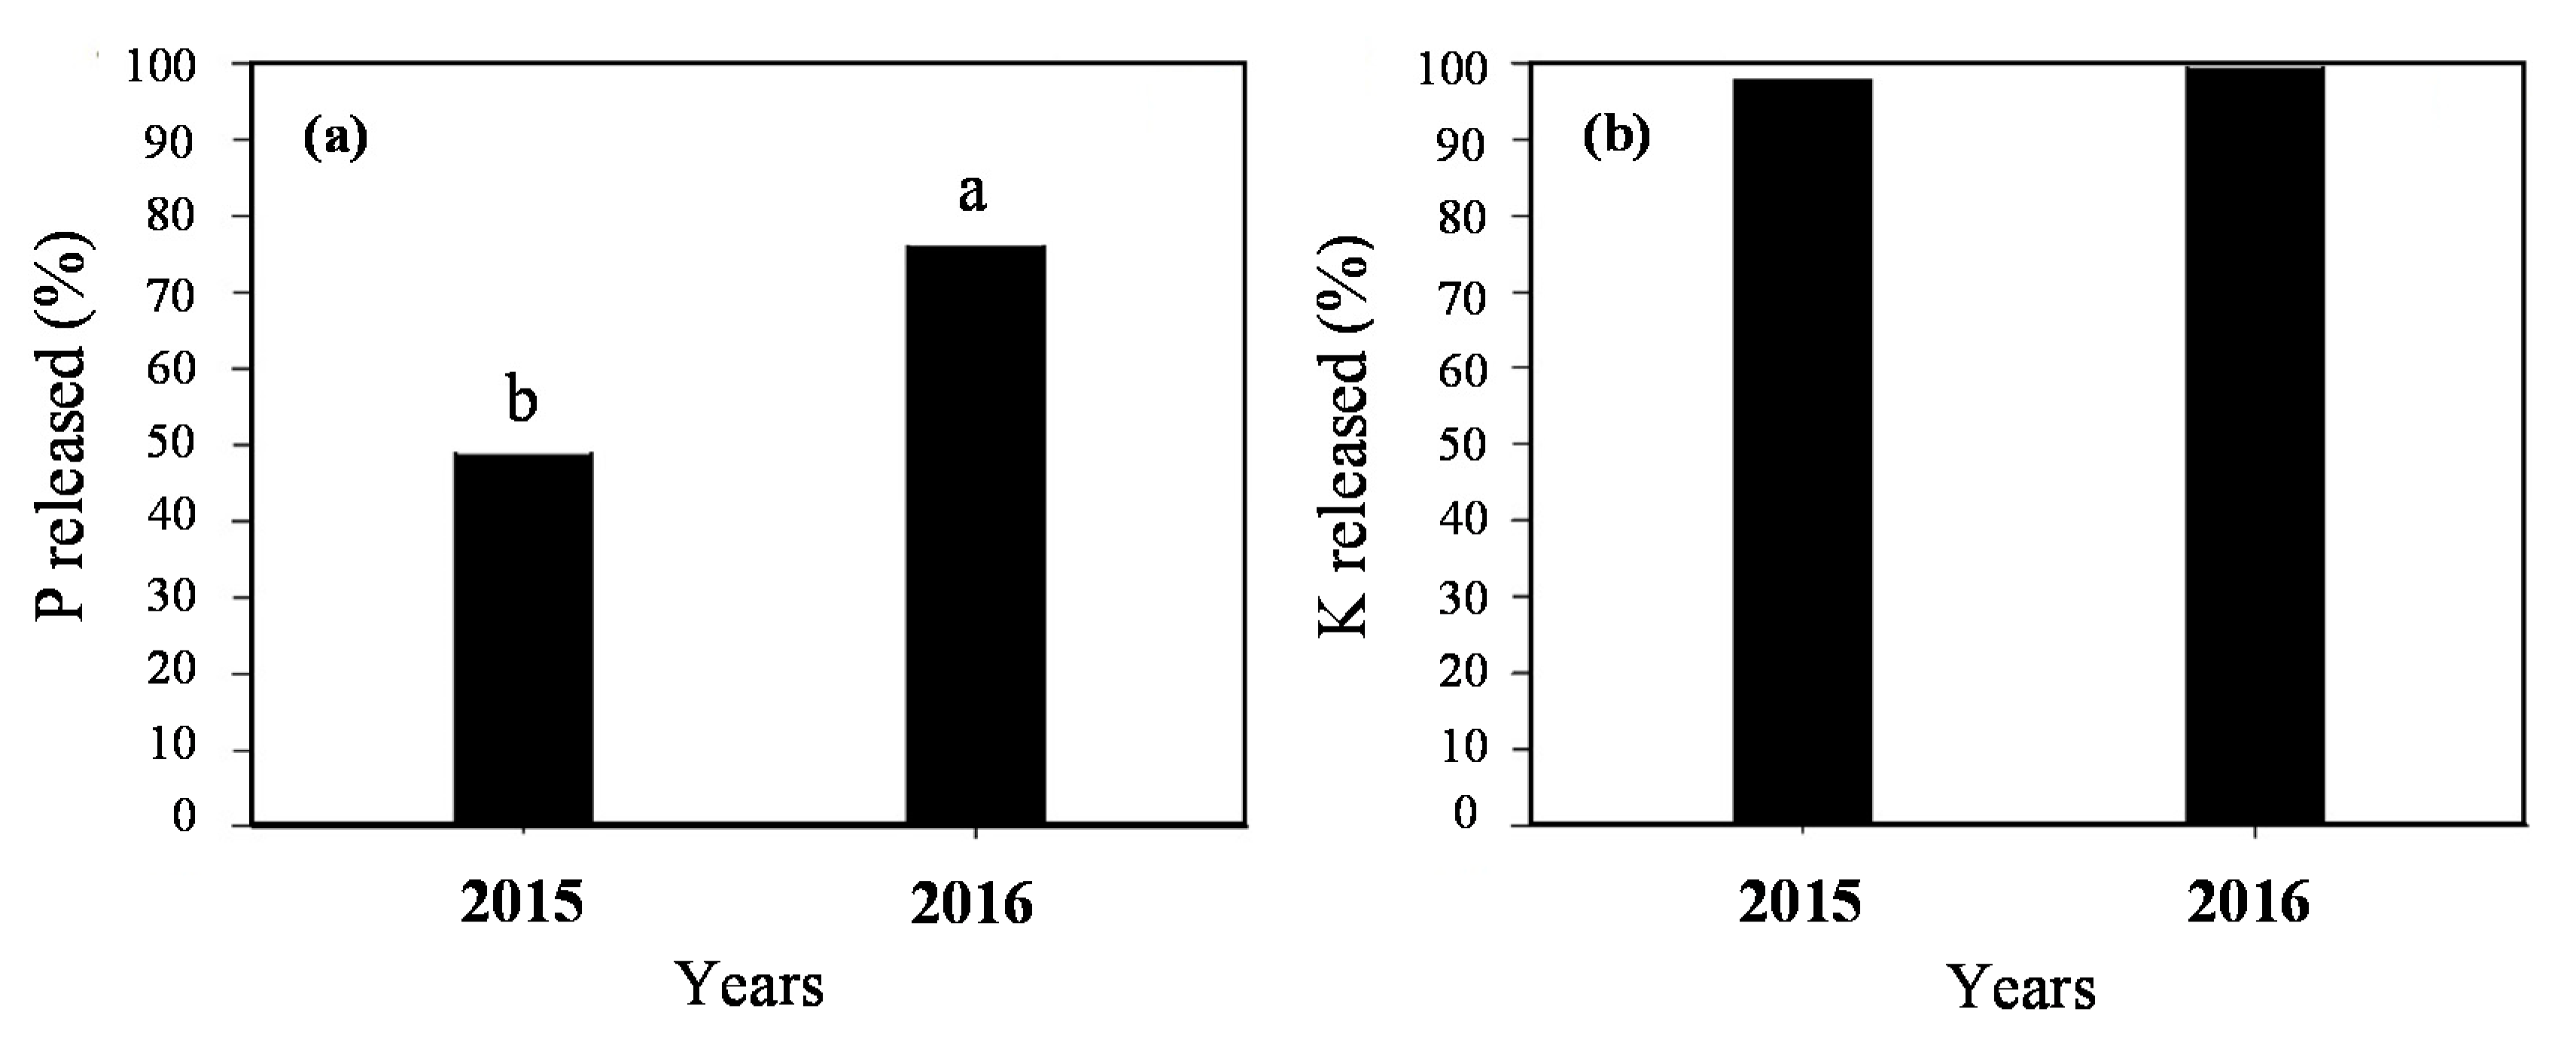
3.3. Phosphorus and Potassium Release

Phosphorus release was greater for dung from pasture vegetative stage (during pasture decomposition phase) reaching 3.0 and 3.7 kg ha−1 of P in 2015 and 2016, respectively, with a stabilizing trend towards the crop phase (Figure 2). Release of P from dung collected at pasture post-flowering stage reached 1.7 and 2.3 kg ha−1 of P in 2015 and 2016, respectively. The total accumulated P release was also higher in 2016 (5.9 kg ha−1 of P) compared to 2015 (4.8 kg ha−1 of P). The best-fit model for remaining P in dung was the double exponential (Table 4). In 2015, P was mainly in the recalcitrant fraction (70%), and there was no effect of dung decomposition phase on the compartments (p > 0.05). In 2016, however, the labile fraction was greater in dung collected at pasture vegetative stage compared to dung collected at the pasture post-flowering stage (57% and 28%, respectively). In the same year, dung collected at the pasture post-flowering stage showed a P release rate from recalcitrant fraction 144% higher than dung collected at pasture vegetative stage (Table 4).
The dynamics of K released from sheep dung demonstrated a similar pattern over the study years (Figure 3). Potassium release was greater for dung from pasture vegetative stage reaching 12.9 and 7.6 kg ha−1 of K in 2015 and 2016, respectively. Release of K from dung collected at pasture post-flowering stage reached 6.6 and 5.5 kg ha−1 of K in 2015 and 2016, respectively. The highest total accumulated K release was observed in 2015 (19.5 kg ha−1 of K) compared to 2016 (12.9 kg ha−1 of K) (Figure 3).
The best-fit model for K was the simple exponential. Almost all the K (99%) was located in the labile compartment of sheep dung (Table 5), resulting in a faster K release and stronger stabilization up to 60–80 days (for the years 2015 and 2016, respectively) after litter bags deposition in the field, compared to the P release model. However, in 2015 the dung collected at pasture post-flowering stage showed a rate of K release from the labile fraction that was 83% lower than that collected at pasture vegetative stage, as well as a higher half-life time (43 days, Table 5).
After 200 days of litter bags distribution in the field, a higher percentage of P remained in the dung in 2015 compared to 2016 (Figure 4). On the other hand, almost the totality of K was released in both study years (Figure 4).

4. Discussion

Contrary to expectations, different grazing intensities on Italian ryegrass did not affect sheep dung composition, decomposition, and P and K release rates over time, possibly because the grazing intensities adopted in our study were not sufficiently contrasting to produce different responses. Previous authors in the same experimental protocol observed differences in morphological composition of swards, with greater participation of structural components (stems + sheaths) under light compared to moderate grazing, and greater participation of leaf blades under moderate compared to light grazing intensity [31]. Pasture chemical composition, however, was similar between grazing intensities, and the authors found no differences in individual live weight gains of lambs in that study (150 g LW animal−1 day−1 on average) [31], supporting our interpretation that grazing intensity treatments were not contrasting enough to produce different dung compositions. Moreover, grazing ruminants, especially sheep and goats, exhibit high forage selectivity, enabling them to select green leaves with greater nutritional value in heterogeneous sward structures [32]. In this sense, even our heaviest grazing intensity (moderate) was probably lenient enough to allow sheep selectivity and consequently the ingestion of diets with similar composition.
Assmann et al. [29] found different nutrient compositions in mixed Italian ryegrass and black oat (Avena strigosa Schreb) pastures managed at a broader range of grazing intensities (10, 20, 30, and 40 cm sward heights), but differences were not detected for cattle dung composition and decomposition rates even under such a contrasting gradient. These authors found, however, higher rates of P release from recalcitrant and labile fractions of dung and lower pasture residue lignin contents under moderate grazing intensities. Greater P release from grass residues (Lolium multiflorum and Paspalum dilatatum) was also observed in grazed conditions compared to ungrazed areas [12]. This result was attributed to differences in quality (structure), lignin content, and lignin/nitrogen ratio of pasture residues caused by grazing, besides alterations in the soil microbial community and changes in soil N status resulting from dung deposition.
Although effects of grazing intensity were not detected, the development stage of pasture affected dung characteristics. In general, dung collected at pasture vegetative stage presented greater P and K (Table 1) and lower cellulose and hemicellulose contents (Table 2), and higher proportion of dung and P in the labile fraction (Table 3 and Table 4), accelerating its initial decomposition and consequently release of P and K (Table 4 and Table 5). These results may be a consequence of higher quality forage and greater amounts of P and K in vegetative Italian ryegrass, with higher proportion of leaves in relation to structural tissues and greater P and K contents typical of younger plants [6].
On the other hand, a smaller proportion of young tissues and higher proportion of stems and inflorescences at the second sampling date (pasture post-flowering stage) may explain the lower nutrient levels in dung decomposed during the crop phase of the ICLS. The chemical composition of plant tissues changes with advancing maturity, especially for structural components like stems, affecting forage digestibility [33]. Digestibility, in turn, affects forage intake by ruminants [16], so that increased fiber content and lower digestibility of pasture in advanced development stage might have constrained the nutrient intake by sheep due to effects such as rumen filling and greater searching and handling times. In addition, animals are induced to increase chewing efficiency to reduce particle size, improving nutrient absorption from the lower quality forage in the gastrointestinal tract [34]. All these factors might have contributed to the lower nutrient content in dung from pasture post-flowering stage.
More than half of the initial dung DM remained in the litter bags at the end of decomposition assessments (Figure 1). This result was probably due to the shape of sheep dung (pellets) and to the formation of a hydrophobic surface when pellets dry, which might have decreased soil-moisture-dung interactions and, consequently, dung decomposition [13,35]. Despite the reduced dung decomposition during the experimental period, it mainly occurred in the first 30 days after litter bags distribution in the field during the pasture phase. This rapid initial decomposition rate corroborates previous studies [27,36], which associated this behavior with the leaching of soluble components (carbohydrates and amino acids) and rapid degradation of the most labile parts of the dung.
The release of 2.3 kg of P ha−1 from sheep dung into the subsequent crop phase in 2016 represents 9% of the amount recommended by the Soil Fertility and Chemistry Commission for the soybean crop (i.e., 26 kg of P ha−1 for an expected soybean yield of 4.0 Mg ha−1 in soils with available P in the sufficiency range, or above the critical level) [37]. This amount, however, represents only the available P from sheep dung. Assmann et al. [29] found a P return of 8.7 kg ha−1 when pasture litter was summed to dung returns in an ICLS with beef cattle.
The release of K from sheep dung revealed a different behavior from that observed for residual DM and P, because the dynamics of decomposition and release of K depends solely on the labile fraction. This rapid K release results from most of the K being maintained in a water-soluble form [38], since it is not part of the structural component of the organic residues [17]. However, in an average of two years, the K released from dung collected at pasture vegetative stage was 41% higher than dung collected at pasture post-flowering stage. This demonstrates the greater importance of K in nutrient recycling, which is more affected than P by the influence of the quality of pasture consumed. These observations suggest that K dynamics is critically important in cropping areas where livestock is integrated.
In summary, our results show that forage consumed at different pasture development stages alters sheep dung composition and consequently its decomposition and P and K release rates. In addition, we have shown that not only nutrient cycling from one phase to another (pasture to crop) in the annual ICLS cycle is important, but also nutrient recycling in the pasture phase is a relevant process, both with potential to improve systems’ nutrient-use efficiency. Recent studies [8,29] recommended that most of the P and K fertilizer should be applied prior to the grazing season in ICLS (i.e., at the beginning of the pasture phase) instead of the traditional fertilization in the crop phase. This change in the logic of fertilization management results in greater pasture yields and animal live weight gains (as a result of improved sward structures and stocking rates) with the same amount of nutrient input to the system. However, more studies are still needed to evaluate this fertilization approach and its effects on all sources of nutrients and cycling/recycling routes occurring in ICLS.

5. Conclusions

Dung composition, decomposition and phosphorus (P) and potassium (K) release dynamics are not affected by the use of moderate or light grazing intensities in the stocking period of annual integrated soybean-sheep production systems. However, sheep dung resulting from the consumption of vegetative Italian ryegrass present lower cellulose and hemicellulose and higher P and K contents compared to dung from pasture post-flowering stage. As a consequence, there is a greater and faster release of P and K during the pasture cycle when compared to the soybean phase in succession. Further evaluations are needed considering the quantification and release of nutrients in each of the different compartments (pasture, urine, and dung residues) that compose the system.

Supplementary Materials

The following are available online at https://www.mdpi.com/2073-4395/10/8/1162/s1, Figure S1: Monthly average precipitation and temperature (2015 and 2016) in a long-term experiment of integrated crop-livestock system in southern Brazil. Source: Experimental Station of the Federal University of Rio Grande do Sul, Eldorado do Sul, Rio Grande do Sul State, Brazil. Figure S2: Starting and ending dates of the stocking period, manure collection and litter bag allocation dates in 2015 and 2016 winter stocking periods of the no-till integrated soybean-sheep production system.

Author Contributions

Conceptualization, F.A., I.A., and P.C.F.C.; Methodology, F.A., D.C., I.A., and W.d.S.S.; Investigation, F.A., D.C., W.d.S.S., J.d.A., and I.A.; Writing—Original Draft, F.A., L.G.d.O.D., P.A.d.A.N., L.A.A., D.C. and I.A.; Writing—Review & Editing, L.G.d.O.D., P.A.d.A.N., L.A.A., I.A., A.C., and P.C.d.F.C.; Funding Acquisition, I.A., A.C., and P.C.d.F.C.; Visualization, L.G.d.O.D. and P.A.d.A.N.; Resources, I.A., P.C.d.F.C. and A.C.; Supervision, I.A. All authors have read and agreed to the published version of the manuscript.

Funding

This research was funded by the National Council for the Development of Science and Technology (CNPq) (403113/2016-4). We also thank the Coordination for the Improvement of Higher Education Personnel (CAPES) for financial scholarship support.

Acknowledgments

We thank the National Council for the Development of Science and Technology (CNPq) and the Coordination for the Improvement of Higher Education Personnel (CAPES) for financing this project through scholarships, and the staff of Agronomic Experimental Station of UFRGS for their support over the study years. We are also grateful to the scientific initiation, MSc and PhD students of the Interdisciplinary Research Group on Environmental Biogeochemistry (IRGEB) and the Grazing Ecology Research Group (GPEP) of the Federal University of Rio Grande do Sul for their support during field trials. AC acknowledges INRAE for additional support.

Conflicts of Interest

The authors declare that they have no conflict of interest.

References

  1. Sulc, R.M.; Franzluebbers, A.J. Exploring integrated crop-livestock systems in different ecoregions ofthe United States. Eur. J. Agron. 2004, 57, 21–30. [Google Scholar] [CrossRef]
  2. Peterson, C.A.; Pedro, A.D.A.; Martins, A.P.; Bergamaschi, H.; Anghinoni, I.; Carvalho, P.C.F.; Gaudin, A.C. Winter grazing does not affect soybean yield despite lower soil water content in a subtropical crop-livestock system. Agron. Sustain. Dev. 2019, 39, 26. [Google Scholar] [CrossRef] [Green Version]
  3. Lemaire, G.; Franzluebbers, A.J.; Carvalho, P.C.F.; Dedieu, B. Integrated crop-livestock systems: Strategies to achieve synergybetween agricultural production and environmental quality. Agric. Ecosyst. Environ. 2014, 190, 4–8. [Google Scholar] [CrossRef]
  4. Martens, J.R.T.; Entz, M.H. Integrating green manure and grazing systems: A review. Can. J. Plant. Sci. 2011, 91, 811–824. [Google Scholar] [CrossRef]
  5. Alves, L.A.; Denardin, L.G.O.; Martins, A.P.; Anghinoni, I.; Carvalho, P.C.F.; Tiecher, T. Soil acidification and P, K, Ca and Mg budget as affected by sheep grazing and crop rotation in a long-term integrated crop-livestock system in southern Brazil. Geoderma 2019, 351, 197–208. [Google Scholar] [CrossRef]
  6. Whitehead, D.C. Nutrient Elements in Grassland: Soil-Plant-Animal Relationships; CABI Publishing: Wallingford, UK, 2020. [Google Scholar]
  7. Chávez, L.F.; Escobar, L.F.; Anghinoni, I.; Carvalho, P.F.C.; Meurer, E.J. Diversidade metabólica e atividade microbiana no solo em sistema de integração lavoura-pecuária sob intensidades de pastejo. Pesq Agropec. Bras. 2011, 46, 1254–1261. [Google Scholar] [CrossRef] [Green Version]
  8. Denardin, L.G.O.; Martins, A.P.; Carmona, F.C.; Veloso, M.G.; Carmona, G.I.; Carvalho, P.C.F.; Anghinoni, I. Integrated crop-livestock systems in paddy fields: New strategies for flooded rice nutrition. Agron. J. 2020, 112, 2219–2229. [Google Scholar] [CrossRef]
  9. Kunrath, T.R.; Nunes, P.A.A.; Filho, W.S.; Cadenazzi, M.; Bremm, C.; Martins, A.P.; Carvalho, P.C.F. Sward height determines pasture production and animal performance in a long-term soybean-beef cattle integrated system. Agric. Syst. 2020, 177, 102716. [Google Scholar] [CrossRef]
  10. Matthew, C.; Assuero, S.; Black, C.K.; Sackville Hamilton, N.R. Tiller dynamics of grazed swards. In Grassland Ecophysiology and Grazing Ecology; Lemaire, G., Hodgson, J., Moraes, A., Carvalho, P.C.F., Nabinger, C., Eds.; CABI Publishing, Lusignan: Wallingford, UK, 2020; pp. 127–150. [Google Scholar] [CrossRef]
  11. Filho, W.S.; Nunes, P.A.A.; Barro, R.S.; Kunrath, T.R.; Almeida, G.M.; Genro, T.C.M.; Bayer, C.; Carvalho, P.C.F. Mitigation of enteric methane emissions through pasture management in integrated crop-livestock systems: Trade-offs between animal performance and environmental impacts. J. Clean Prod. 2019, 213, 968–975. [Google Scholar] [CrossRef]
  12. Semmartin, M.; Garibaldi, L.A.; Chaneton, E.J. Grazing history effects on above- and below-ground litter decomposition and nutrient cycling in two co-occurring grasses. Plant. Soil 2008, 303, 177–189. [Google Scholar] [CrossRef]
  13. Shand, C.A.; Coutts, G. The effects of sheep faeces on soil solution composition. Plant. Soil 2006, 285, 135–148. [Google Scholar] [CrossRef]
  14. Briske, D.D.; Derner, J.D.; Brown, J.R.; Fuhlendorf, S.D.; Teague, W.R.; Havstad, K.M.; Gillen, R.L.; Ash, A.J.; Willms, W.D. Rotational grazing on rangelands: Reconciliation of perception and experimental evidence. Rangel. Ecol. Manag. 2008, 61, 3–17. [Google Scholar] [CrossRef] [Green Version]
  15. Cherney, D.J.R.; Cherney, J.H.; Lucey, R.F. In vitro digestion kinetics and quality of perennial grasses as influenced by forage maturity. J. Dairy Sci. 1993, 76, 790–797. [Google Scholar] [CrossRef]
  16. Van Soest, P.J. Nutritional Ecology of the Ruminant, 2nd ed.; Cornell University Press: Ithaca, NY, USA, 1994. [Google Scholar]
  17. Haynes, R.J.; Williams, P.H. Nutrient cycling and soil fertility in the grazed pasture ecosystem. Adv. Agron. 1993, 49, 119–199. [Google Scholar] [CrossRef]
  18. Deiss, L.; Moraes, A.; Dieckow, J.; Franzluebbers, A.J.; Gatiboni, L.C.; Sassaki, L.G.; Carvalho, P.C.F. Soil phosphorus compounds in integrated crop-livestock systems of subtropical Brazil. Geoderma 2016, 274, 88–96. [Google Scholar] [CrossRef]
  19. Braz, S.P.; Junior, D.N.; Cantarutti, R.B.; Regazzi, A.J.; Martins, C.E.; Fonseca, D.M. Disponibilização dos nutrientes das fezes de bovinos em pastejo para a Forragem. R. Bras. Zootec. 2002, 31, 1614–1623. [Google Scholar] [CrossRef] [Green Version]
  20. Alvares, C.A.; Stape, J.L.; Sentelhas, P.C.; Gonçalves, J.L.M.; Sparovek, G. Köppen’s climate classification map for Brazil. Meteorol. Z. 2013, 22, 711–728. [Google Scholar] [CrossRef]
  21. FAO. World Reference Base for Soil Resources 2014, International Soil Classification System for Naming Soils and Creating Legends for Soil Maps. 2015. Available online: http://www.fao.org/3/i3794en/I3794en.pdf (accessed on 15 May 2020).
  22. CFS-RS/SC–Comissão de Fertilidade Do Solo-RS/SC. Recomendações de Adubação e de Calagem Para os Estados do Rio Grande do Sul e de Santa Catarina, 3rd ed.; SBCS-Núcleo Regional Sul/EMBRAPA-CNPT: Passo Fundo, Brazil, 1995; pp. 1–224. [Google Scholar]
  23. NRC−National Research Council. Nutrient Requirements of Sheep; National Academic of Science: Washington, DC, USA, 1985. [Google Scholar]
  24. Barthram, G.T. Experimental Techniques: The HFRO Sward Stick; The Hill Farming Research Organization/Biennial Report; HFRO: Penicuik, Scotland, 1985; pp. 29–30. [Google Scholar]
  25. Mott, G.O.; Lucas, H.L. The design, conduct, and interpretation of grazing trials on cultivated and improved pastures. In Proceedings of the 6th International Grassland Congress; Wagner, R.E., Myers, W.M., Gaines, S.H., Lucas, H.L., Eds.; State College Press: Philadelphia, PA, USA, 1952; pp. 1380–1385. [Google Scholar]
  26. Wieder, R.K.; Lang, G.E. A critique of the analytical methods used in examining decomposition data obtained from litter bags. Ecology 1982, 63, 1636–1642. [Google Scholar] [CrossRef] [Green Version]
  27. Tedesco, M.J.; Gianello, C.; Bissani, C.A.; Bohnen, H.; Volkweiss, S.J. Análise de Solo, Plantas e Outros Materiais; Departamento de Solos/UFRGS: Porto Alegre, UK, 1995. [Google Scholar]
  28. Van Soest, P.J.; Robertson, J.B. Analysis of Forages and Fibrous Foods—A Laboratory Manual for Animal Science; Cornell University Press: Ithaca, NY, USA, 1985. [Google Scholar]
  29. Assmann, J.M.; Martins, A.P.; Anghinoni, I.; Denardin, L.G.O.; Nichel, G.H.; Costa, S.E.V.G.A.; Silva, R.A.P.; Balerini, F.; Carvalho, P.C.F.; Franzluebbers, A.J. Phosphorus and potassium cycling in a long-term no-till integrated soybean-beef cattle production system under different grazing intensities in subtropics. Nutr. Cycl. Agroecosys 2017, 108, 21–33. [Google Scholar] [CrossRef]
  30. Plante, A.F.; Parton, W.J. The dynamics of soil organic matter and nutrient cycling. In Soil Microbiology, Ecology and Biochemistry; Paul, E.A., Ed.; Academic Press: Cambridge, MA, USA, 2017; pp. 433–467. [Google Scholar]
  31. Savian, J.V.; Neto, A.B.; de David, D.B.; Bremm, C.; Schons, R.M.T.; Genro, T.C.M.; do Amaral, G.A.; Gere, J.; McManus, C.M.; Bayer, C.; et al. Grazing intensity and stocking methods on animal production and methane emission by grazing sheep: Implications for integrated crop-livestock system. Agric. Ecosyst. Environ. 2014, 190, 112–119. [Google Scholar] [CrossRef] [Green Version]
  32. Rook, A.J.; Dumont, B.; Isselstein, J.; Osoro, K.; WallisDeVries, M.F.; Parente, G.; Mills, J. Matching type of livestock to desired biodiversity outcomes in pastures—A review. Biol. Cons. 2014, 119, 137–150. [Google Scholar] [CrossRef]
  33. Mowat, D.N.; Fulkerson, R.S.; Tossell, W.E.; Winch, J.E. The in vitro digestibility and protein content of leaf and stem proportions of forages. Can. J. Plant. Sci. 1965, 45, 321–331. [Google Scholar] [CrossRef]
  34. Doreau, M.; Diawara, A. Effect of level of intake on digestion in cows: Influence of animal genotype and nature of hay. Livest. Prod. Sci. 2003, 81, 35–45. [Google Scholar] [CrossRef]
  35. Freitas, M.; Araujo, C.A.S.; Silva, D.J. Decomposição e liberação de nutrientes de estercos em função da profundidade e do tempo de incorporação. Rev. Semiárido Visu. 2012, 2, 150–161. [Google Scholar]
  36. Bahamonde, H.A.; Gargaglione, V.; Peri, P.L. Sheep faeces decomposition and nutrient release across an environmental gradient in Southern Patagonia. Ecol. Austral. 2017, 27, 18–28. [Google Scholar]
  37. CQFS-RS/SC. Manual de Calagem e Adubação Para os Estados do Rio Grande do Sul e de Santa Catarina, 11th ed.; Sociedade Brasileira de Ciência do Solo–Núcleo Regional Sul.: Viçosa, Brazil, 2016; pp. 1–376. [Google Scholar]
  38. Weeda, W.C. Effect of cattle dung patches on soil tests and botanical and chemical composition of herbage. Nz. J. Agric. Res. 1977, 20, 471–478. [Google Scholar] [CrossRef] [Green Version]
Figure 1. Residual dry matter (DM) of sheep dung at different decomposition phases (pasture and crop phases) in 2015 (a) and 2016 (b) in a no-till integrated soybean-sheep production system (average of low and moderate grazing intensities).
Agronomy 10 01162 g001
Figure 2. Accumulated phosphorus (P) release from sheep dung sampled at different pasture development stages (vegetative and post-flowering stages) and total accumulated P release over 2015 (a) and 2016 (b) annual cycles of a no-till integrated soybean-sheep production system (average of low and moderate grazing intensities).
Agronomy 10 01162 g002
Figure 3. Accumulated potassium (K) release from sheep dung sampled at different pasture development stages (vegetative and post-flowering stages) and total accumulated P release over 2015 (a) and 2016 (b) annual cycles of a no-till integrated soybean-sheep production system (average of low and moderate grazing intensities).
Agronomy 10 01162 g003
Figure 4. Total phosphorus (P) and potassium (P) released from sheep dung 200 days after litter bag distribution in the field in the years 2015 (a) and 2016 (b) in a no-till integrated soybean-sheep production system (average of low and moderate grazing intensities). Lower case letters represent differences in P released between years according to Tukey’s test (p < 0.05).
Agronomy 10 01162 g004
Table 1. Phosphorus (P) and potassium (K) content in dung sampled at different pasture development stages in 2015 and 2016 winter stocking periods of a no-till integrated soybean-sheep production system. Results are the averages of low and moderate grazing intensities.
YearPasture Development StageNo. Animals Per haDung Excreted per Animal (1)Total Dung ReturnDung Nutrient ContentTotal Nutrient Return
PKPK
g day−1kg ha−1 day−1g kg−1g ha−1 day−1
2015Vegetative28 A290 ns8.1 A11.7 a24.8 a95.0 Aa201.4 Aa
Post-flowering28 A2908.1 A10.6 b21.6 b86.1 Ab175.4 Ab
2016Vegetative19 B2905.5 B16.4 a25.7 a90.4 Ba141.6 Ba
Post-flowering19 B2905.5 B12.9 b25.5 b71.1 Bb140.5 Bb
(1) Data from Savian et al. (2017, unpublished). Tukey’s test (p < 0.05): Upper case letters distinguish the variables between years in each pasture development stage. Lower case letters distinguish the variables between pasture development stage in each year. ns: no statistical difference according to Tukey’s test (p > 0.05).
Table 2. Composition of dung sampled at different pasture development stages in 2015 and 2016 winter stocking periods of a no-till integrated soybean-sheep production system. Results are the averages of low and moderate grazing intensities.
YearPasture Development StageCelluloseHemicelluloseLignin
g kg−1
2015Vegetative192 a139 a149 ns
Post-flowering203 a153 a141
2016Vegetative180 b134 b105
Post-flowering227 a179 a112
Tukey’s test (p < 0.05): Lower case letters distinguish, in the columns, dung composition in each year. ns: no statistical difference according to Tukey’s test (p > 0.05).
Table 3. Parameters of the double exponential model for sheep dung decomposition rates influenced by decomposition phases and experimental years in a no-till integrated soybean-sheep production system. Results are the averages of low and moderate grazing intensities.
YearDung Decomposition PhaseComp. A (1)k1 (2)k2 (3)t1/2R2
A (4)(100-A) (5)
%days−1days
2015Pasture22 a0.0442 a0.0016 a164330.99
Crop36 a0.0128 b0.0015 a544620.99
2016Pasture21 a0.0413 a0.0012 a175940.99
Crop13 b0.0623 a0.0018 a113850.99
Tukey’s test (p < 0.05): Lower case letters distinguish, in the columns, dung decomposition phase in each year. (1) Proportion of the labile fraction; (2) Decomposition rate from the labile fraction; (3) Decomposition rate from the recalcitrant fraction; (4) Labile fraction; (5) Recalcitrant fraction.
Table 4. Parameters of double exponential models fitted to phosphorus release rates from sheep dung, calculated half-life values (t1/2), and coefficient of determination (R2) at different decomposition phases during the 2015 and 2016 annual cycle of a no-till integrated soybean-sheep production system. Results are the averages of low and moderate grazing intensities.
YearDung Decomposition PhaseComp. A (1)k1 (2)k2 (3)t1/2R2
A (4)(100-A) (5)
%days−1days
2015Pasture28 a0.0738 a0.0022 a93190.94
Crop33 a0.0298 a0.0013 a235540.95
2016Pasture57 a0.0448 a0.0027 b152600.97
Crop28 b0.1027 a0.0066 a71050.95
Tukey test, p < 0.05: Lower case letters distinguish, in the columns, dung deposition phase in each year. (1) Proportion of the labile fraction; (2) Rate of nutrient release from the labile fraction; (3) Rate of nutrient release from the recalcitrant fraction; (4) Labile fraction; (5) Recalcitrant fraction.
Table 5. Parameters of simple exponential models fitted to potassium release rates from sheep dung, calculated half-life values (t1/2), and coefficient of determination (R2) at different decomposition phases during the 2015 and 2016 annual cycle of a no-till integrated soybean-sheep production system. Results are the averages of low and moderate grazing intensities.
YearDung Decomposition PhaseComp. A (1)k1 (2)t1/2R2
%days−1days
2015Pasture99.4 a0.0943 a70.95
Crop97.7 a0.0163 b430.92
2016Pasture100.0 a0.0922 a80.97
Crop99.3 a0.0740 a90.97
Tukey test, p < 0.05: Lower case letters distinguish, in the columns, dung deposition phase in each year. (1) Proportion of the labile fraction; (2) Rate of nutrient release from the labile fraction.

