Article

Comparison of the Effects of Different Crop Production Systems on Soil Physico-Chemical Properties and Microbial Activity under Winter Wheat

by
Anna Maria Gajda
1,*,
Ewa Antonina Czyż
2 and
Aleksandra Ukalska-Jaruga
3
1
Department of Agricultural Microbiology, Institute of Soil Science and Plant Cultivation State Research Institute, Czartoryskich 8, 24-100 Puławy, Poland
2
Department of Soil Science, Environmental Chemistry and Hydrology, The Faculty of Biology and Agriculture, University of Rzeszow, Zelwerowicza 8b, 35-601 Rzeszow, Poland
3
Department of Soil Science and Land Protection, Institute of Soil Science and Plant Cultivation State Research Institute, Czartoryskich 8, 24-100 Puławy, Poland
*
Author to whom correspondence should be addressed.
Agronomy 2020, 10(8), 1130; https://doi.org/10.3390/agronomy10081130
Submission received: 25 June 2020 / Revised: 27 July 2020 / Accepted: 30 July 2020 / Published: 3 August 2020
(This article belongs to the Special Issue Effects of Agricultural Management on Soil Properties and Health)

Abstract

:
In many areas, organic crop production systems have been shown to contribute to maintaining good soil condition. The organic production system has been recommended as an alternative to conventional agriculture. However, in order to recommend this practice in new regions, it is necessary to obtain information about its effects and consequences in local environmental conditions. The research was completed during 2016–2018 in Osiny (Lublin region, Poland) on a field experiment established 26 years previously in a Haplic Luvisol soil. The research was aimed at comparing the effects of long-term use of tilled soil with organic (ORG) and conventional (CON) crop production systems with those in non-tilled soil under permanent grass (PRG) as a control. This comparison was done on the basis of changes in the values of soil properties as follows: Total porosity (TP), total organic matter (OM), particulate organic matter (POM), humic substances (HS), water-extractable carbon (WEC), microbial biomass carbon pool (MBC) and dehydrogenase activity (DH). Soil samples were collected from experimental fields (each treatment 1 ha) under winter wheat and permanent grass each year from 0–5, 5–10, 15–20 and 30–35 cm depths. Over the three year study period, it was found that permanent grass and the organic crop production system contributed to increased soil OM, POM, HS, WEC and MBC contents and DH activity compared to the CON system, especially in the top soil layer, 0–5 cm. To obtain a clearer picture of soil quality change our study examined for the first time the metabolic potential index (MPI) as a ratio of dehydrogenase activity to the soluble organic carbon content. The MPI values confirmed the increase of metabolism in ORG soil as a consequence of management practices compared with CON soil. The obtained correlations showed strong mutual relationships within properties of the heterogeneous soil complex. The results show the positive effects of the ORG management system causing soil condition improvement which is based on organic fertilization, enriching the soil with a large amount of plant residues in creating positive changes in the soil quality in contrast to the CON system.

1. Introduction

Soil plays an essential role in every terrestrial ecosystem. The decline in soil fertility observed in recent decades is indicative of the effects of continued use of intensive tillage. Moreover, insufficient use of agricultural practices to sustain good soil quality can exacerbate this problem [1,2]. Continued monitoring of the effects of different management practices on soil help to better assist in the understanding of ongoing changes in soil physical, chemical and biological properties, and is important for maintenance of good soil quality and sustainable soil productivity [3,4,5,6,7,8]. In modern agriculture, tillage has to meet many conditions to protect the soil and improve its parameters [9,10]. One of the important physical parameters for soil quality reflecting the soil’s ability to function for structural support, soil aeration [11], water retention and water movement [12] is bulk density [4,5,6,13]. Bulk density is used as an indicator of soil compaction and soil porosity, and for comparisons between management practices [14,15,16]. Many researchers comparing traditional tillage systems with no-tillage and/or direct drilling showed an increase in soil density, and thus an increase in soil bulk density, compactness and soil moisture, and a decrease in total porosity and in capillary water capacity in the arable layer of soil under no-tillage systems [10,14,17,18]. The physical quality of soil as observed in the field [4,5,6] is positively correlated with the content of OM in the soil [15], and especially when the OM is complexed [13].
Soil OM is a key contributor to soil function [1,2]. There are many different partitionings of OM in the scientific literature due to its structure, physical and chemical properties and origin or stability in soil [19]. There are distinguished two main OM components as biomass, including live parts of plants and microbial biomass (bacteria and fungi), and organic residues, including particulate OM, dissolved OM, humus and inert organic matter [20]. Particulate organic matter (POM) has been defined as a transitional form between fresh plant residues and humified pools of OM and comprises all OM particles less than 2 mm and greater than 0.053 mm in size [21]. POM as a biologically and chemically active fraction is important to OM turnover. POM responds much faster to soil management than the total OM and therefore stable fractions has been proposed as a useful tool in a determination of changes direction in total OM [22,23,24].
The largest part of soil OM (60–90%) is constituted of plant origin humic substances (HS), which significantly influence the quality and productivity of agricultural soils [8]. They play an important role in soil structure modification, and hence retention of dissolved organic carbon (DOC) in soils, but the most important function of HS is their ability to hold water within soil. HS are brown-black colour polymeric acids that contribute to soil fertility, being responsible for many complex reactions in soil. The specific soil humic compounds include a complex of amorphous organic substances operationally divided as humic acids (HA), fulvic acids (FA) and humins (HN) [25]. These humic fractions differ, among others, in molecular weight, number of functional groups, degree of polymerization and other characteristics [26].
An important parameter for measuring the quality of soil HS is the HA/FA ratio, which indicates the degree of humus polymerization and humification of soils, and the greater the HA/FA ratio is, the higher the content of HA and the better the quality of the humus [25].
The fractions of labile OC have a high rate of decomposition and short lasting-time in soil, and therefore have been proposed to be one of the most sensitive indicators of carbon resources in soil, and a good tool for evaluating changes caused by management practices [27].
Soil OM is a major source of OC in soil. The quantity of the water soluble organic carbon (WSOC) fraction results from the OM microbial decomposition rate, is a good substrate for soil microorganisms and determines the nutrients release in a form available for plants [28]. Because WSOC is not homogeneous, two fractions are usually determined in soil: Cold water extractable carbon (CWEC) and hot water extractable carbon (HWEC) [27,29,30]. The solubility of OC fractions is dependent on solvent temperature. The molecular and chemical composition of HWEC and CWEC revealed distinct differences, mostly in n—C28 fatty acid and n—C38nC52 alkyl monoesters. The HWEC fraction showed higher concentration of carbohydrates, phenols and lignin monomers than the CWEC fraction. Additionally, CWEC has been defined as a thermally more stable fraction than HWEC. Microbial activity and physical processes ongoing in soil may convert available OC to a more refractory fraction through complexation reactions [31]. Moreover, tillage, as has been proved on many occasions, disrupts soil aggregates and subjects protected C pools to microbial utilization and erosion processes [32].
Soil microorganisms play an important role in agricultural ecosystems in OM decomposition into plant available nutrients. Microbial biomass (MB) is small (5–10%) but extremely important and is the only living fraction of soil OM. It is the source of nutrients and energy for soil microorganisms, and the agent responsible for OM decomposition and nutrient availability to plants [33]. Disturbance in arable soils, induced by, e.g., tillage, can cause significant changes in the soil environment and affect the microbial community structure. Thus, the labile OM fractions can be used as early indicators of the effects of soil management practices on the soil environment [1,22].
The quantity of labile fractions of OM in soil provides information about the size of labile C substrate resources available to support the activity of microbial communities. Moreover, labile OM promote soil aggregation and labile nitrogen reservoirs in soil while the soil quality is related to OM dynamics and nutrient supply [3,34].
Soil microbial functions are characterized by microbial biomass carbon (MBC) and nitrogen (MBN) as well as soil enzyme activity. Soil enzyme activity is known to be very dynamic and sensitive to agricultural practices, such as fertilization, crop rotation, tillage and crop residue management, and important in nutrient transformations and plant nutrient availability [35]. Because of simplicity of measurement, soil enzyme activity is recommended as a potential indicator of soil biological health. Activity of soil dehydrogenases (DH) is often assessed as an index of soil microbial community activity [36].
Due to the observed deepening problem of gradual deterioration of soil quality in recent decades in Poland and Europe in relation to the progressive degradation of OM resources, the need for ongoing monitoring of soil quality is extremely important, particularly in arable soils. The proposal of this paper is to test the following hypotheses: (1) There will be an improvement in OM and some of its fractions and consequently improvement in some properties of tilled soil under an organic crop production system and/or non-tilled soil under permanent grass; (2) there will be a decrease in OM and some of its fractions and consequently deterioration in some properties in tilled soil under a conventional crop production system.
The aim of this research was to compare the effects of long-term use of tilled soil with organic and conventional crop production systems with those in non-tilled soil under permanent grass as a control. This comparison was done on the basis of changes in the values of some soil properties as follows: Total porosity, total organic matter, labile fractions of organic matter and organic carbon and microbial activity in a Haplic Luvisol soil.

2. Materials and Methods

2.1. Characteristics of the Experimental Site

The three year research (2016–2018) was carried out on long-term experimental (1994 until now) fields located in the Experimental Station in Osiny belonging to the Institute of Soil Science and Plant Cultivation State Research Institute (IUNG-PIB) in Puławy, Lublin voivodeship, Poland (51°28’ N, 22°30’ E; at an altitude of 147 m above sea level). The experimental fields were located on Haplic Luvisol soil (IUSS Working Group WRB, 2006) [37] with a loamy sand texture (sand 77%, silt 21%, clay 2%) [38], OM content 1.66% and C:N ratio 10.5:1. Some characteristics of the soil are given in Table 1.
The experiment was established in 1994 on experimental fields with different crop production systems. The area with a previous history of permanent grass (pasture) was included for needs of our studies. The crop production systems differ in crop rotations and agricultural practices. More information is given in [7,39,40].
Three treatments were sampled for this experiment. The sampled areas covered:
  • Organic crop production system (ORG) based on a five field crop rotation: Potato + spring wheat + undersown—grass/clover mixture (1st year)—grass/clover mixture (2nd year)—winter wheat + catch crop mustard, and organic fertilizers only. Once during the complete crop rotation cycle, compost material made from plant residues was applied to the soil at a rate of 30 t ha−1 before potatoes were planted. No mineral fertilizers and/or chemicals for weed and pest control were used. Only P and K fertilizers were applied as a natural rock, according to soil requirements. The weed control was based mainly on mechanical treatments.
  • The conventional crop production system (CON) was based on a three field crop rotation (winter oilseed rape, winter wheat and spring wheat), high mineral fertilization and full chemical plant protection, according to the high-input recommendations generally used in Poland. Most herbicides were applied on crops, and only a few based on glyphosate were sprayed on stubble and incorporated into soil.
Soil tillage was similar for both crop production systems; in general, it was a traditional tillage with mouldboard ploughing inverting the top soil 25 cm. Before sowing of winter crop, a four-furrow reversible plough (PPÖTTINGER Landtechnik GmbH, Grieskirchen, Austria) was used at a depth of 20 cm. After potato or after cultivation of a catch crop, winter ploughing was undertaken usually in the second half of November. For other crop harvests in July/August, winter ploughing was undertaken at the end of September. Usually, before sowing, seedbed cultivator was used. The number and time of ploughing treatments in particular systems depended on the crop rotation structure.
  • Permanent grass (PRG) is an unbroken continuation of the original permanent pasture on the site., There is a mixture of grasses: Festuca pratensis (Festuca pratensis Huds.)—20%; Festuca rubra (Festuca rubra L.)—20%; White clover (Trifolium repens L.)—15%; Perennial ryegrass (Lolium perenne L.)—10%; Dactylis glomerata (Dactylis glomerata L.)—10%; Kentucky bluegrass (Poa pratensis L.)—10%; Black Medic (Medicago lupulina L.)—10%; Timothy grass (Phleum pratense L.)—5%.
The area of each field with a crop production system and permanent grass was about 1 ha each, so it was possible to conduct agricultural practices as they would be on a commercial farm. The tillage treatment has remained the same for each experimental field since the beginning of the experiment in 1994. Each year, soil samples have been taken twice in every growing season of winter wheat (in mid-June and just before harvest) at four replications from four depths: 0–5, 5–10, 15–20 and 30–35 cm at each treatment. Each sampling point we considered as a replicate because the field experiment was established without replications due to physical constraints such as land availability or plot size. Sampling points within each treatment were far enough from each other (20 m) to ensure the replicate independence. To avoid the edge effect, the sampling points were placed at least 5 m from the field margin. The locations of sampling points were chosen carefully to avoid soil heterogeneity using existing soil maps. Site topography was also taken into consideration. Undisturbed soil samples were collected in 100 cm3 cylinders for measure of bulk density and calculation of soil total porosity (more information is given in Section 2.3.2). For other properties, soil samples were thoroughly mixed and transferred to the laboratory at temperature + 6–8 °C (± 2 °C). For microbiological analysis, soil was sieved through a 2 mm sieve and plant roots were removed carefully. At the same time, samples from non-tilled soil under permanent grass (PRG) were taken in the same manner as from tilled soil under ORG and CON crop production systems.
Table 2 presents the crop production systems with different crop rotations and agricultural management, and permanent grass.

2.2. The Weather Conditions

The weather conditions during the experiment’s period (2016–2018) in comparison with long-term (1984–2014) average air temperature and the sum of precipitation are shown in Table 3 and Table 4. The average annual precipitation in this area (climate zone–moderate continental) was 568 mm, and mean annual air temperature 8.7 °C, according to observations for the 20 year period. The years of the study 2016–2018 showed higher mean air temperatures (by 1.3, 0.1 and 1.2 °C, respectively) than the 8.7 °C for a long-term average (Table 3). Moreover, the total precipitation was higher by 78, 131 and 48 mm for 2016–2018, respectively, than the long-term yearly average of 568 mm (Table 4).

2.3. Physical, Chemical and Microbiological Analysis of Soil

2.3.1. The Particle Size Distribution

The particle size distribution in the soil (sieving and sedimentation) was determined using Cassagrande aerometric method modified by Prószyński [41]. The particle size distribution and texture class of soil were identified according to the Polish Society of Soil Science (PTG-2008) [38], and the group of soil according to the WRB Classification System [37].

2.3.2. Total Porosity

Soil total porosity (%) was calculated from the values of bulk density and particle density. Bulk density was measured using the weight and volume of soil [14]. Particle density was determined by the pycnometer method [42]. Total porosity was calculated in this way:
TP = (1 − BD/PD) × 100)
where: TP = total porosity (%); BD = bulk density (g cm−3); PD = particle density (g cm−3).

2.3.3. Physical-Chemical Properties

Soil pH in KCl was measured potentiometrically in a 1:2.5 volumetric ratio suspension in 1 mol dm−3 KCl solution according to the method used in [43]. Available P and K were determined by the Egner–Rhiem method and available Mg by the Schachtschabel method [44]. Mineral nitrogen (Nmin) was determined with the colorimetric method using a flow auto-analyser (QuAAtro39 Seal AutoAnalyzer Analytical, Mequon, Wisconsin, USA) [45].

2.3.4. Total Organic Carbon (TOC) and Organic Matter (OM) in Soil

The Tiurin method with the modification of Andrzejewski was used for determination of TOC content in soil by sulfochromic oxidation of organic carbon (OC), followed by titration of the excess K2Cr2O7 with FeSO4(NH4)2SO4 × 6H2O [46]. OM content in soil was measured by wet oxidation using the Tiurin method [47].

2.3.5. Particulate Organic Matter (POM)

Approximately 30 g of air-dried soil was mixed with sodium hexametaphosphate solution (5 g L−1) and shaken for 15 h in a horizontal reciprocal shaker, Universal Shaker SM 30 control (Edmund Buhler, GmbH, Bodelshausen, Germany) according to the method used in [21] with the modification detailed in [48]. The suspension was passed through a 53 mm sieve forced by a water jet. The material retained by the sieve, consisting of particulate organic matter (POM) associated with a sand fraction was oven-dried at 55 °C for relative weight quantification. Then, dried samples were combusted in the oven at 450 °C and the POM concentration was determined according to the LOI (loss-on-ignition) procedure given by Schulte and Hopkins [49] called POM LOI. For the LOI analyses, the soil samples were sieved through a 2 mm sieve and air dried. The samples were then oven-dried at 105 °C overnight, cooled in a desiccator and then combusted at 450 ± C for 2 h in a muffle furnace (Model NaberthermL15/11, Nabertherm GmbH, Lilienthal, Germany After combustion, the samples were cooled in a desiccator, and weighted on analytical balance to receive a weight reading to 5 decimal places. Soil samples were also analyzed for calcium carbonate equivalent (CCE) [50].

2.3.6. Humic Substances (HS)

The assessments of HS composition, comprising of carbon fractions of humic acids (HA), fulvic acids (FA) and humins (HN), were analyzed with the modified ISO 12782-4 method [51] approved by the International Humic Substances Society [52]. The method description is given in [8]. Concentrations of OC in the extracted fractions were measured after each step in individual fractions containing FA1, FA2 and HA by a C-N analyzer (Multi N/C 2100/2100S Jena Analytics, Jena, Germany). The total fraction of FA is given as the sum of FA1 and FA2.
The humins content was determined in the soil after extraction of FA and HA by the C-N analyzer (Vario Macro Cube CN Elementar Analyzer, Elementar Analysensysteme GmbH, Langenselbold, Germany). Additionally, the humification index (HI = C−HA/C—FA) and degree of HS transformation (DT = (C—HA + C—FA)/C—HN) were calculated.

2.3.7. Cold Water Extractable Carbon (CWEC) and Hot Water Extractable Carbon (HWEC)

CWEC and HWEC were determined according to [53] and [29], respectively. CWEC was determined by shaking of soil with distilled water (1:10 w/v soil to solution ratio) for 24 h in 4 °C, while HWEC was determined by heating (in a water bath) of soil with distilled water (1:10 w/v soil to solution ratio) for 24 h in 80 °C. The soil extracts obtained were centrifuged (4000 rpm for 10 min), decanted, filtered (through a 0.45 μm cellulose membrane filter) and analysed for C using TOC-TN analyzer (Multi N/C 2100/2100 Jena Analytics, Jena, Germany).

2.3.8. Microbial Biomass Carbon (MBC)

Microbial biomass C content in soil was determined by the chloroform-fumigation–extraction modified method [54]. After 24 h fumigation, soil was extracted with 0.5 M K2SO4 on a rotary shaker, and C was determined on a C-N Analyzer (Multi N/C 2100 Jena Analytics, Jena, Germany). The obtained quantities of MBC were calculated from the difference in extractable carbon (EC) before and after fumigation using the following equation: MBC = EC/kEC. The extraction efficiency factor kEC representing the fraction of the killed microbial biomass extracted as C under standardized conditions was used as a conversion factor to convert obtained C values to microbial biomass. The results were expressed as µg of C per g of dry mass soil.

2.3.9. Dehydrogenase Activity (DH)

DH activity was measured spectrophotometrically according to the Polish Standard method [55], using 2,3,5-triphenyltetrazolium chloride (TTC) as a substrate. DH activity was expressed as µg of triphenyl formazan (TPF) per g of oven-dried (105 °C) soil mass per 24 h.

2.4. Statistical Analysis

Results were evaluated statistically by analyses of variance ANOVA by employing the Statistica PL 13.3 to evaluate the effects of the different crop production systems and permanent grass on the measured variables. Significant differences within the data were calculated according to Tukey’s HSD (Honest Significant Differences) test at p ≤ 0.05.
Pearson’s correlation coefficients were used as a measure of the strength of linear dependence between studied parameters at p ≤ 0.05 and p ≤ 0.01.

3. Results and Discussion

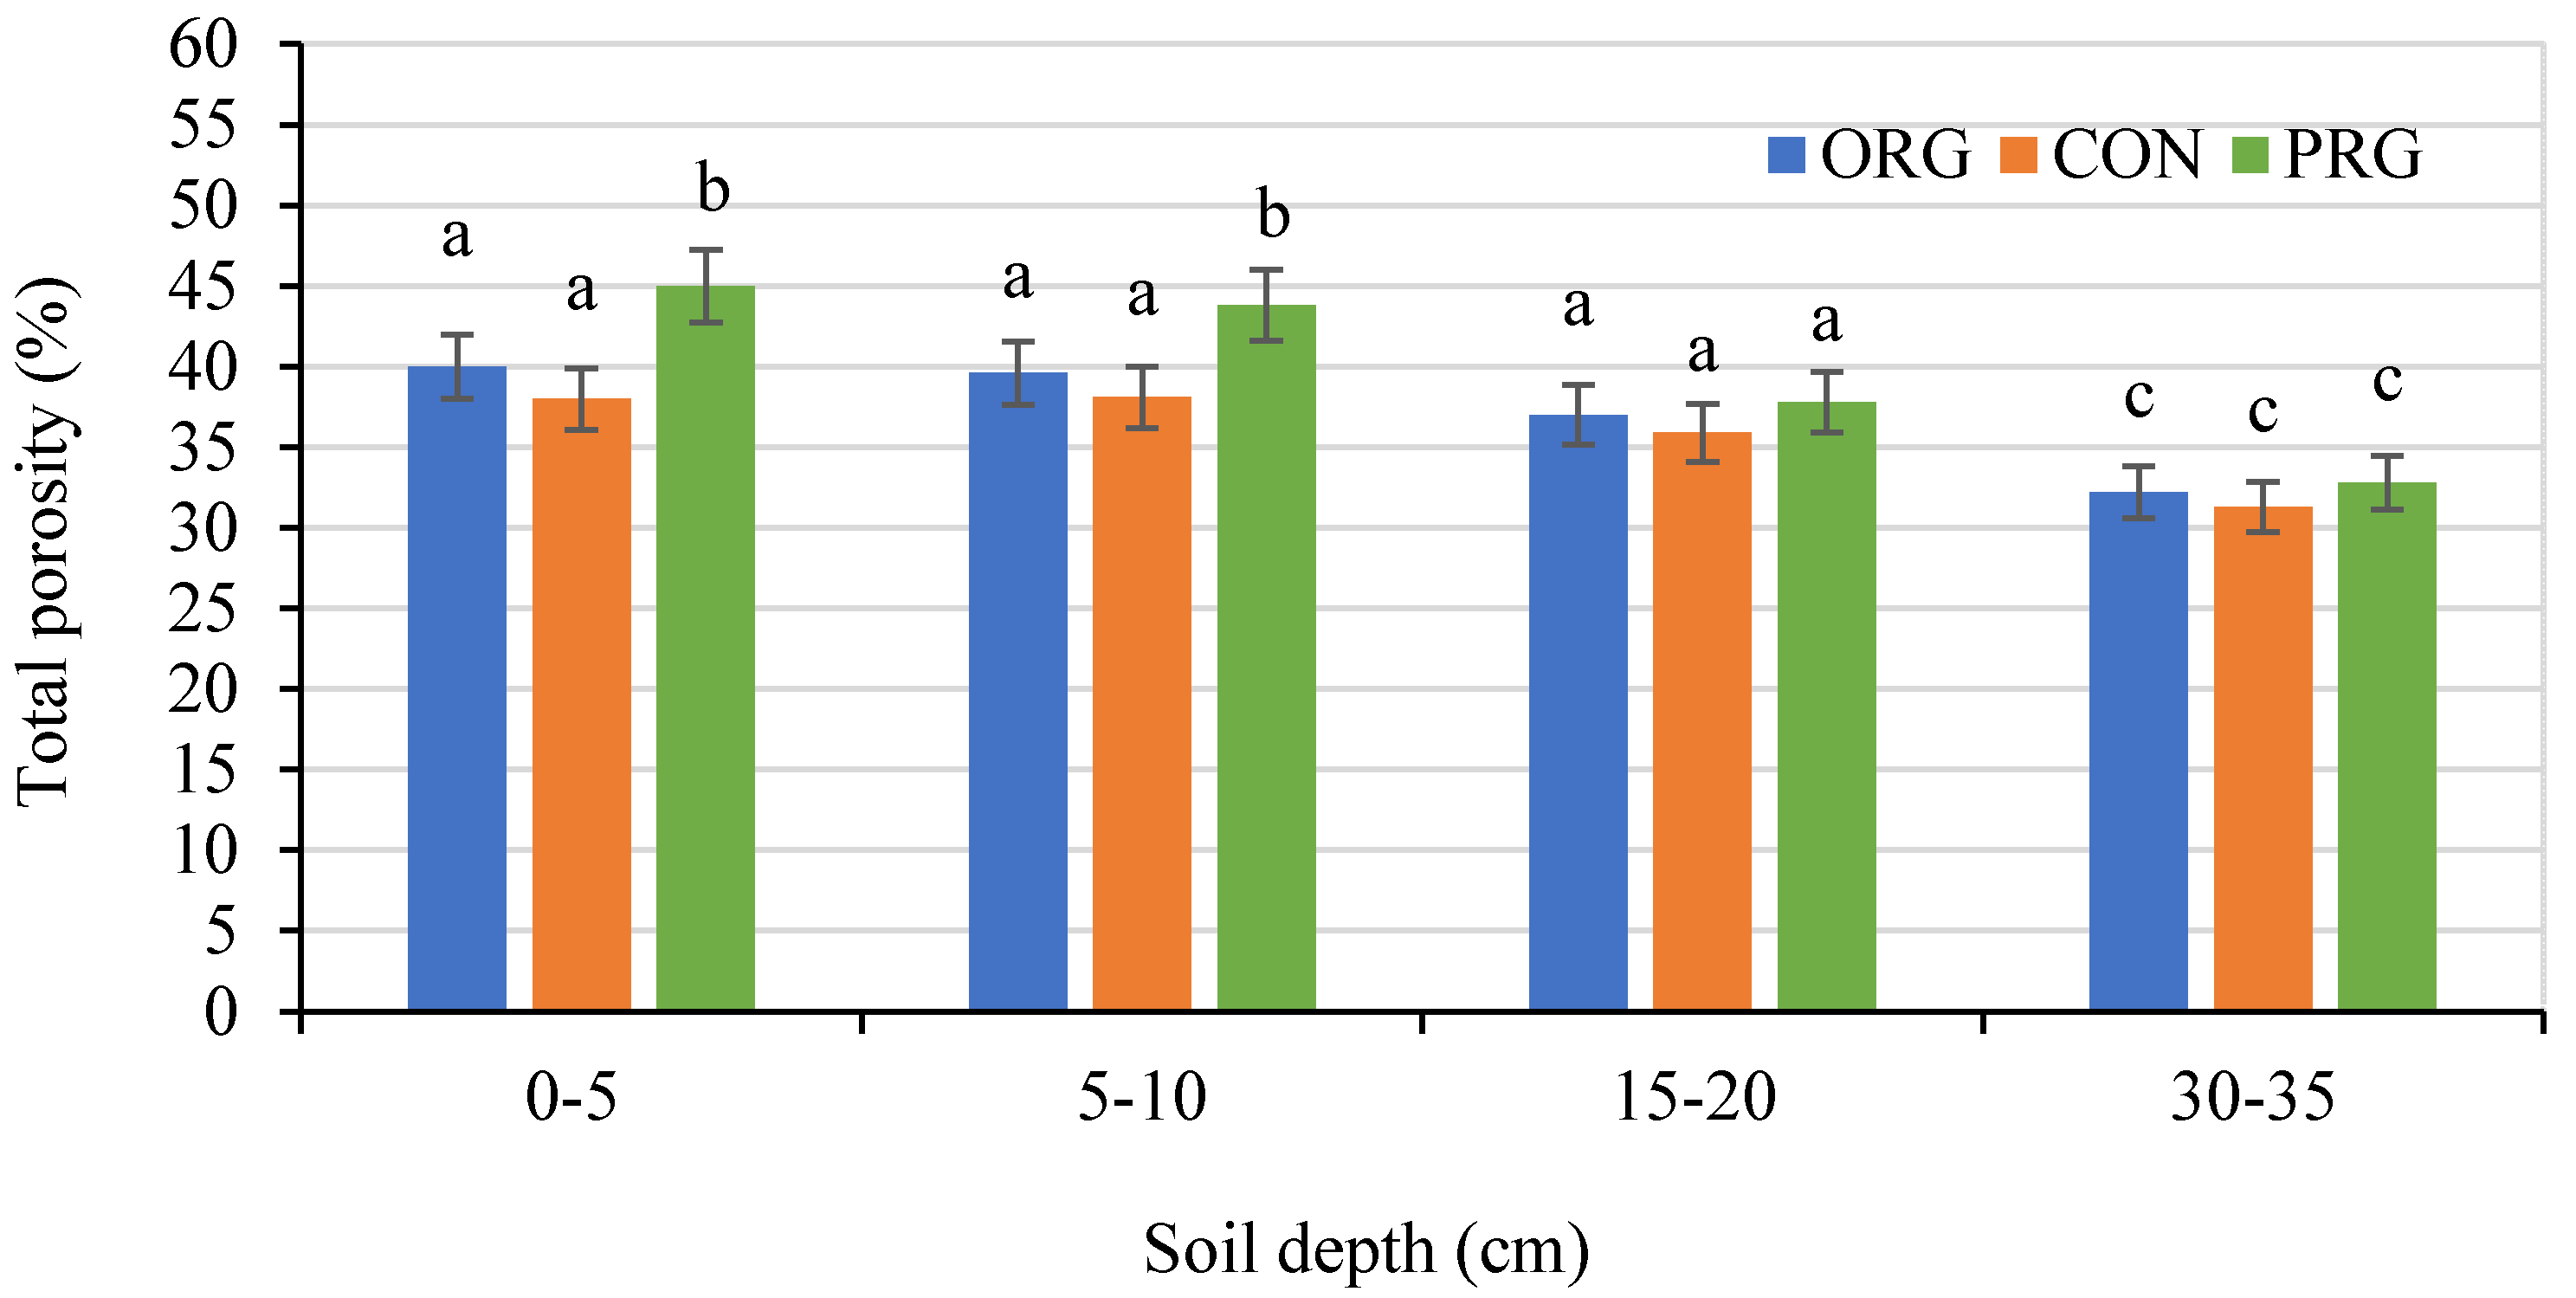
3.1. Effects on Total Porosity

Soil total porosity has been recommended as a good indicator of soil physical quality. Our results seem to confirm the above statement, since they show the dependency of total porosity on the soil treatment. Total porosity was significantly greater in non-tilled soil under PRG in the depths of 0–5 and 5–10 cm than in the tilled soil under ORG and CON crop production systems (Figure 1). At the 15–20 and 30–35 cm depths, values of total porosity were not significantly different. Soil total porosity fluctuated between 44.9% and 43.8% at the 0–5 and 5–10 cm depths, respectively.
Under ORG and CON crop production systems, total soil porosity values were lower than in PRG treatment and fluctuated between 40.4% and 39.6%; 37.7% and 38.1%, respectively. The variations of total porosity were lower at the 15–20 and 30–35 cm depths than in the surface soil layers 0–5 and 5–10 cm for both crop production systems, and linked to the obtained values of bulk density. In general, the results of total porosity for both crop production systems and permanent grass were in a range of 31.3% to 44.9% (Figure 1).
The results of our study were similar to the other results obtained for an Entic Haploxeroll of Central Chile, where after four years of conventional tillage and no tillage use the average total porosity reached 49% and 46%, respectively, at a depth of 0–15 cm in a sandy clay soil under wheat. The porosity values showed no significant differences between both treatments [56]. Moreover, other results demonstrated no differences between three tillage systems, no tillage, vertical tillage and conventional tillage of a clay loam soil under oats, and the values for porosity ranged from 45% to 55% [16]. Similar results of an earlier study over three years conducted in Poland, in a wheat crop on a silt loamy soil under conventional tillage and reduced tillage showed values of pore space from 46.6% to 51.4% at a soil depth of 0–10 cm [57].
In general, higher soil bulk density indicates less porosity. Pagliai and Vignozzi [58] reported the results obtained for a soil aggregation and pore space characteristics. They suggest that soil with 40% of pore space is considered to be extremely porous. Paluszek [59] implied that total pore volume in sandy soils is relatively low and averages about 40%, which corresponds to a soil bulk density of 1.55 g cm−3. The average total porosity of heavy structural soils is higher than that of light soils and is about 50%, which corresponds to a density of 1.35 g cm−3. Considering the above-mentioned research findings, the porosity calculated in our study was included within the normal porosity range for agricultural soils.

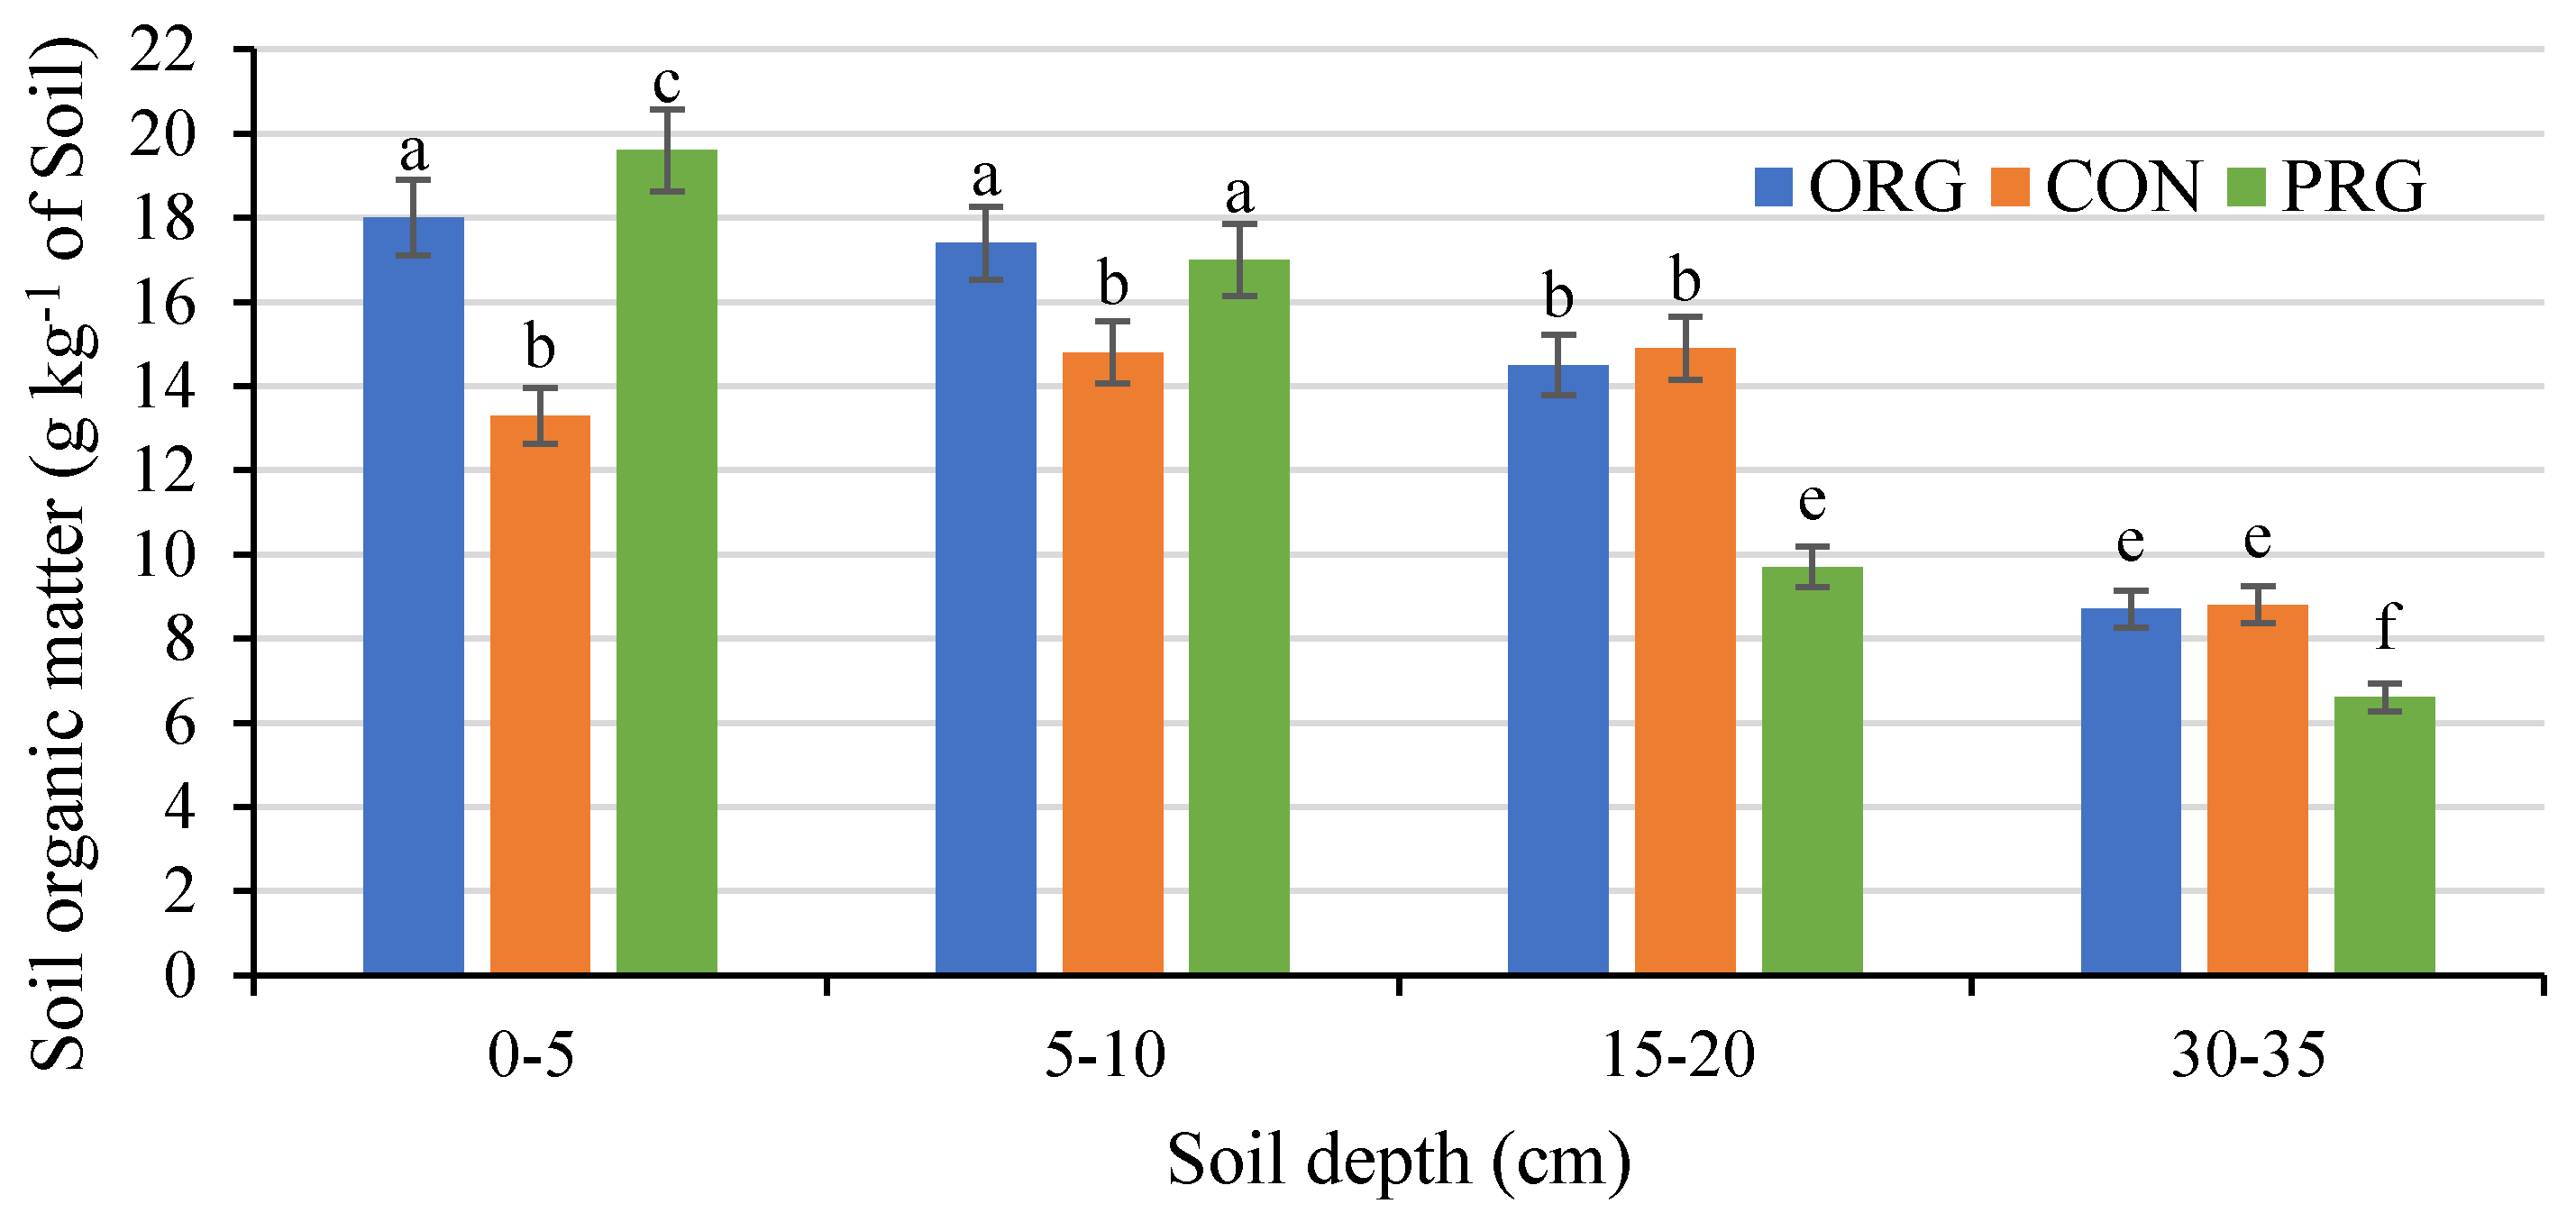
3.2. Effects on Soil Organic Matter

The results obtained on the long-term field experiments demonstrate the statistically significant effects of crop production systems and permanent grass on soil OM content at p ≤ 0.05 (Figure 2).
The tilled soil under the ORG crop production system showed similar trends in OM content as non-tilled soil under PRG. At depths of 0–5 and 5–10 cm the OM content in soil under the ORG system and PRG was significantly higher compared with the CON system; however, no significant differences were found between ORG and PRG treatments.
In the lower layer 15–20 cm, the OM content dropped significantly in soil under PRG and ORG systems in relation to 0–5 and 5–10 cm depths, but in the CON system no significant differences were noticed. At the 30–35 cm depth, significantly lower OM contents were measured in soil under all studied treatments (Figure 2).
The above findings are similar to the results published by many researchers, including [7,22,40], who found that organic management significantly increased OM concentration in surface soil compared with conventional farming system. Moreover, Sarkar et al. [60] reported that OM concentration in soil within cultivated fields was significantly lower than within uncultivated fields and the decrease of OM was mainly due to the tillage practices.

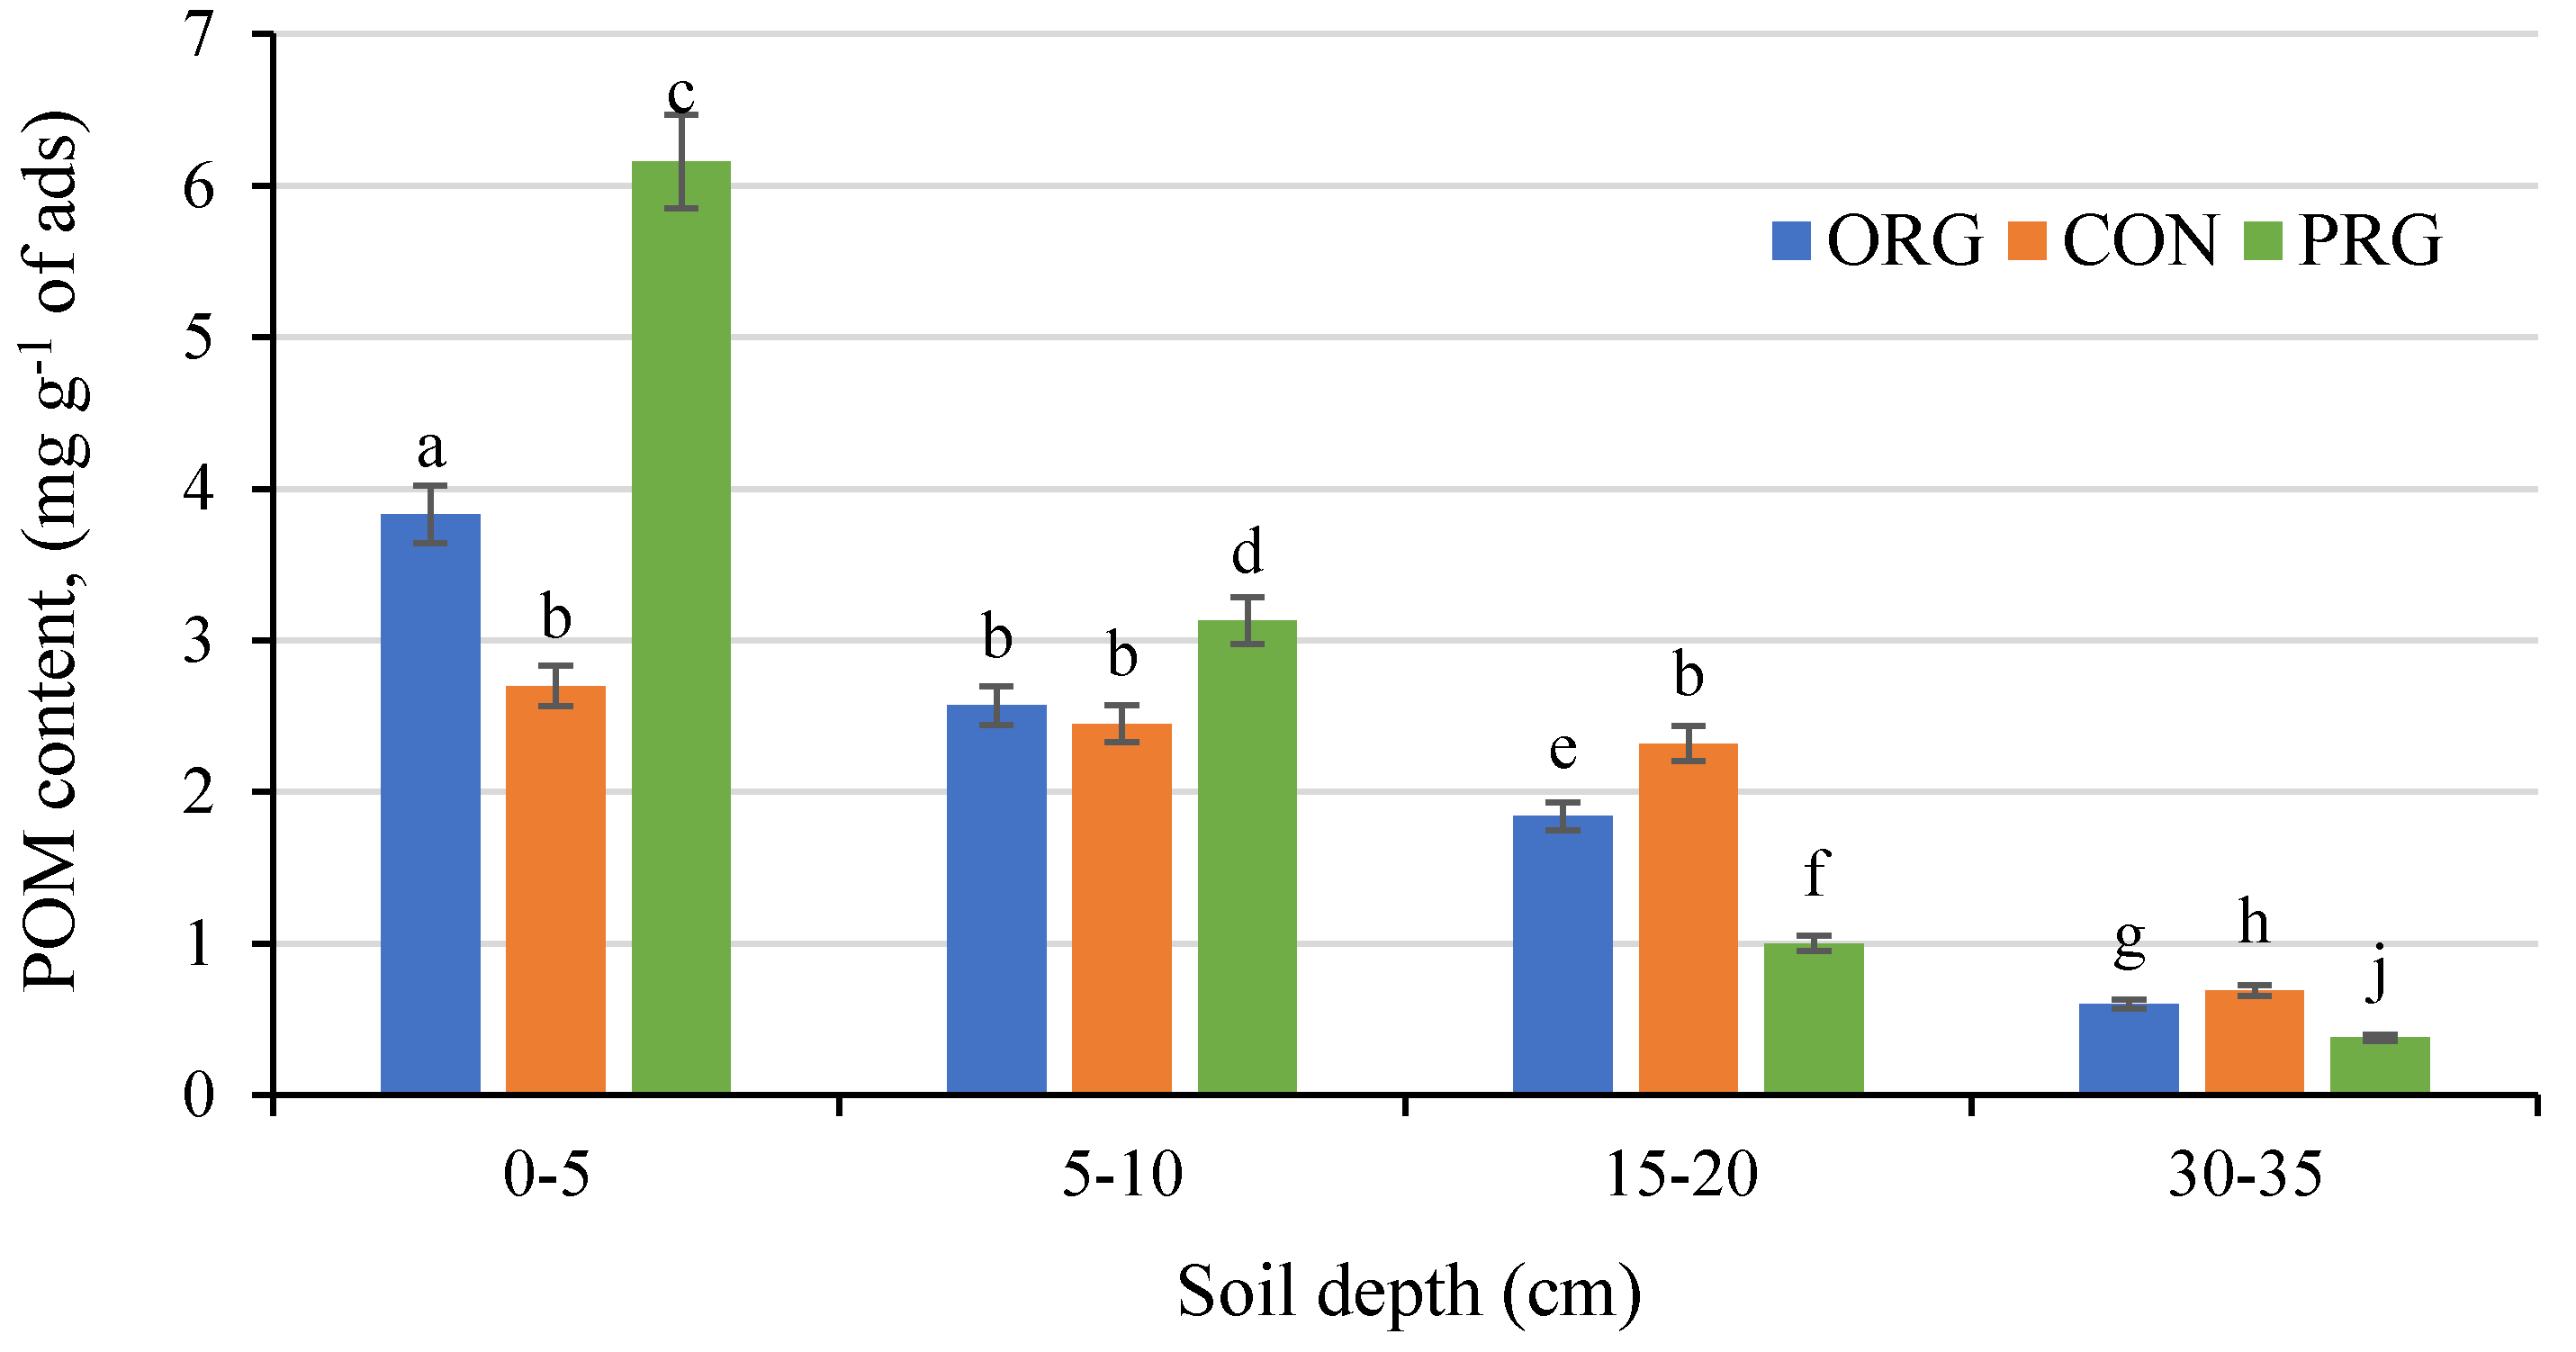
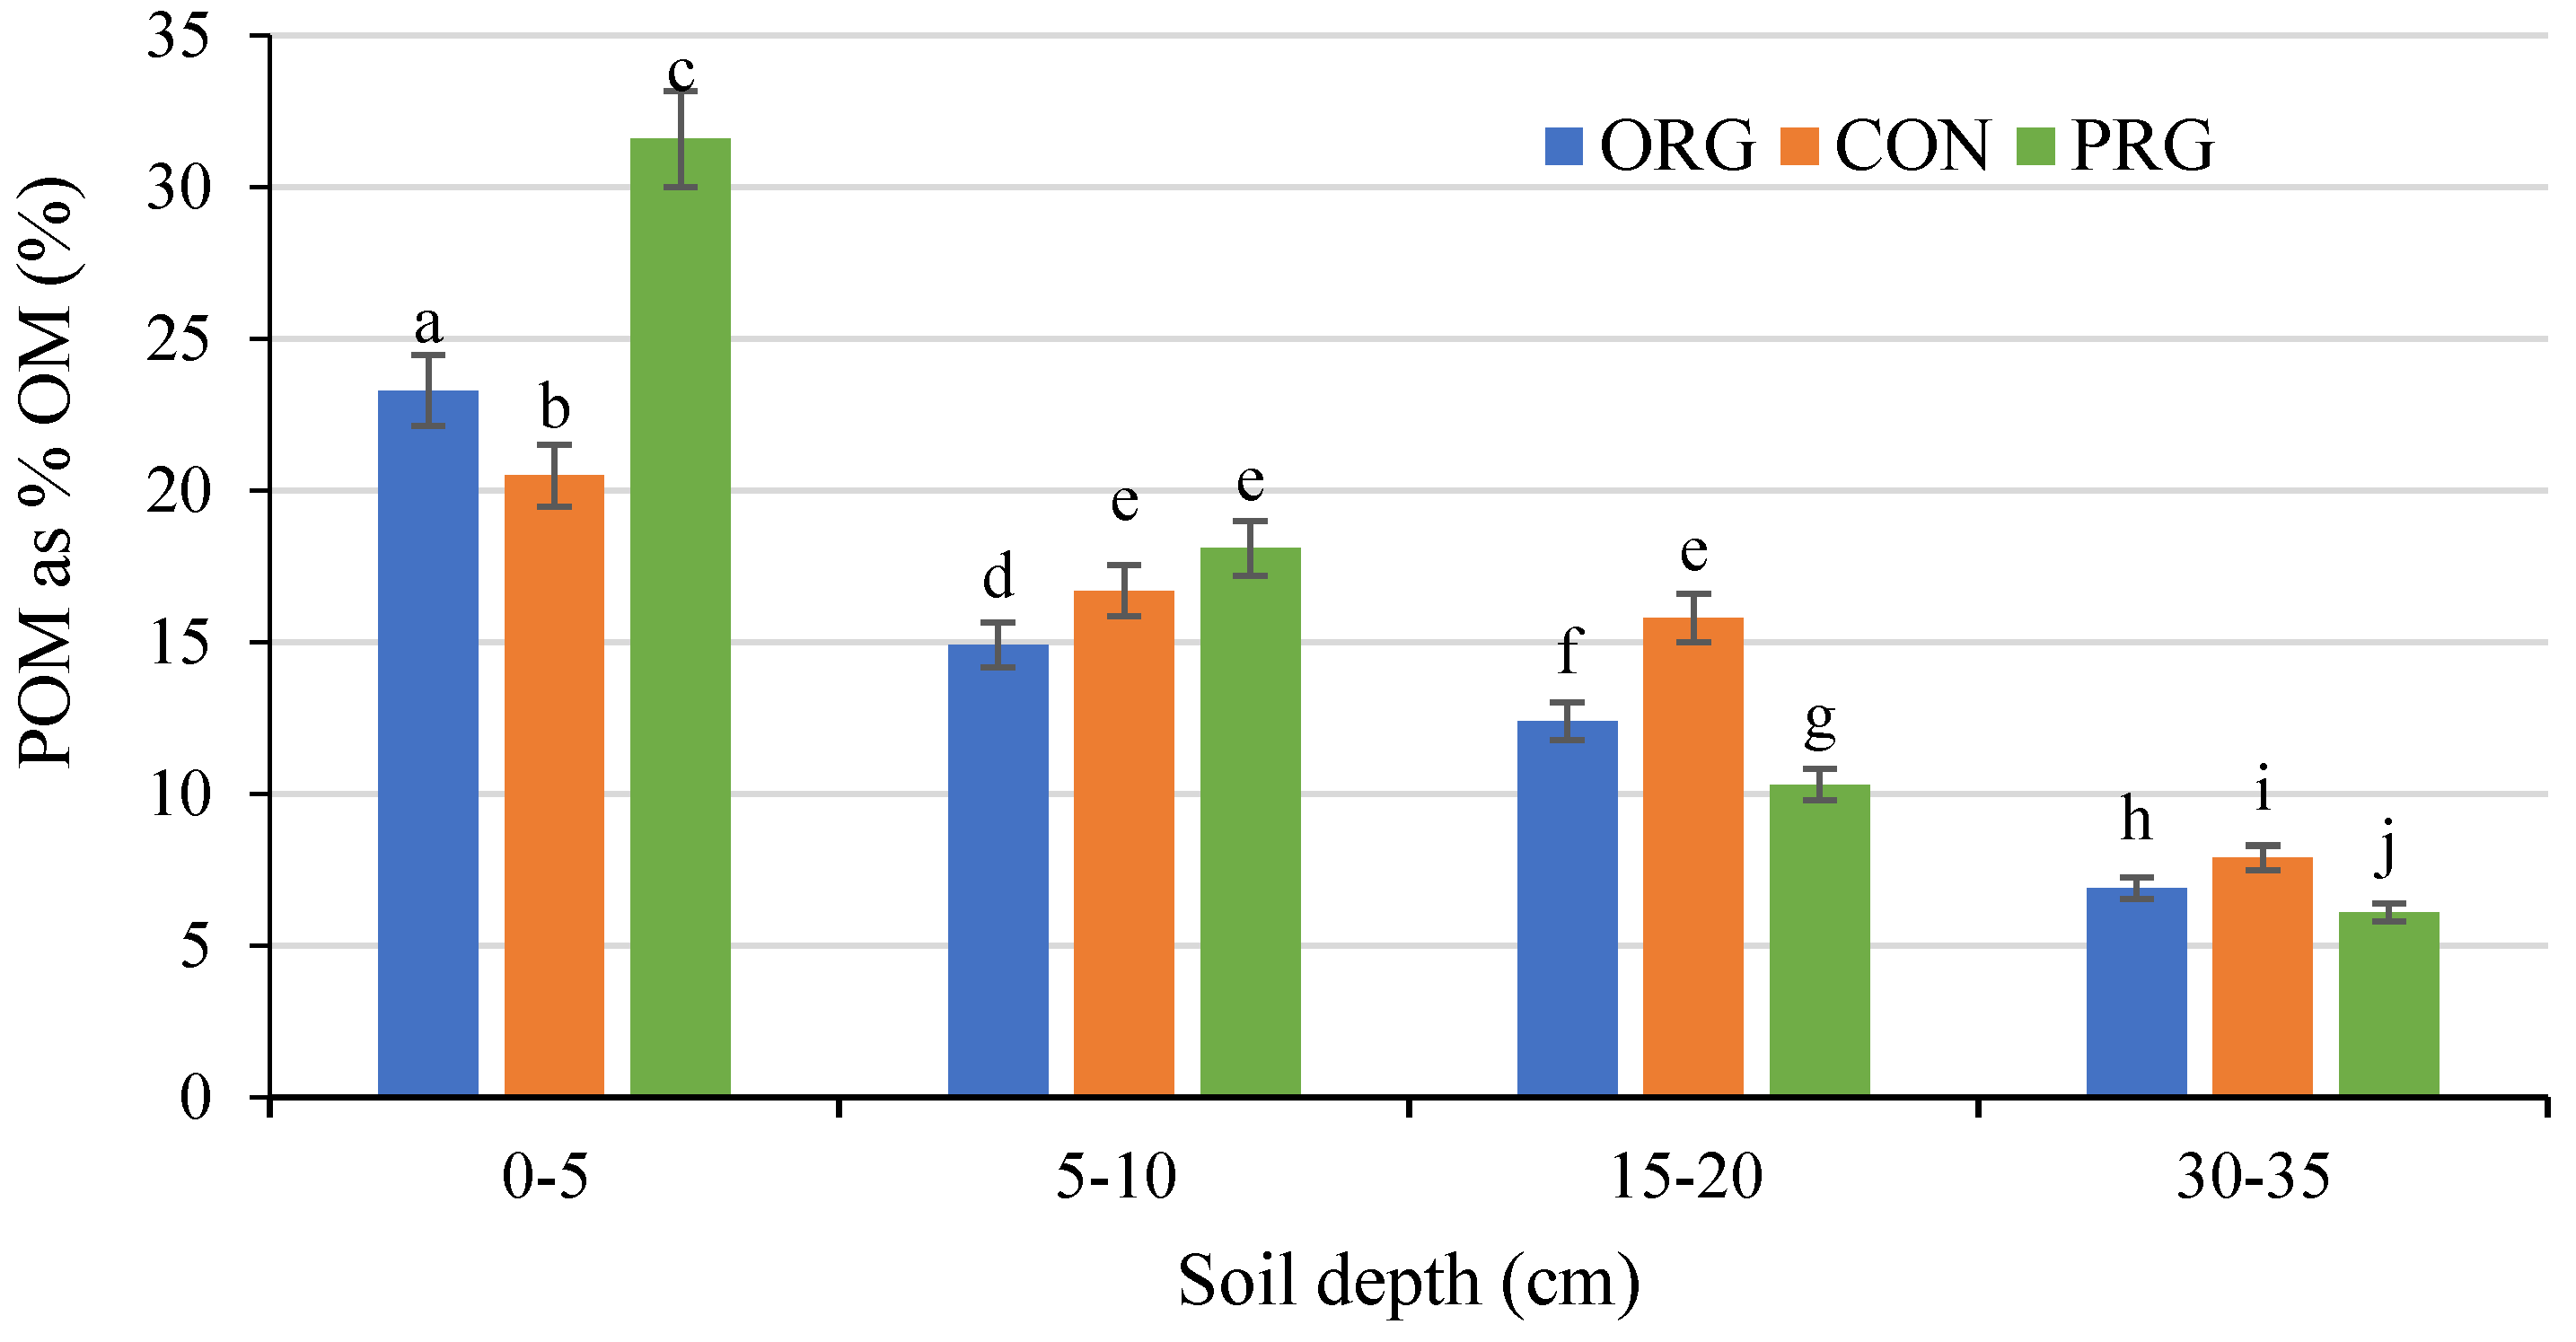
3.3. Effects on Particle Organic Matter

For better understanding of OM complexity and the dynamics of its changes in soil, the OM fractions should be analysed separately [61]. In the present study, the soil management practices significantly affected the content of the POM fraction in soil at p ≤ 0.05 (Figure 3).
The most differentiated results between treatments were obtained for the surface soil at 0–5 cm depth. The highest content of POM fraction 6.2 mg g−1 of ads was found in the 0–5 cm depth of non-tilled soil under PRG. The results showed that non-tilled soil under PRG significantly increased the POM content by 57% and 39% mostly at the depth of 0–5 cm as compared with tilled soil under CON and ORG crop production systems, respectively. The tilled soil under the ORG system showed similar trends in POM concentrations as non-tilled soil under PRG. The significantly higher POM content (3.8 mg g−1 of ads) was measured in soil under the ORG system at the 0–5 cm depth, which was 29% more compared with the CON system. In the lower soil layers (5–10, 15–20 cm) the POM content dropped significantly in soil under PRG and ORG systems in relation to the 0–5 cm depth, but in the CON system no significant differences were noticed. At the 30–35 cm soil depth, significantly lower POM contents were measured in soil under all studied treatments (Figure 3).
In non-tilled soil under PRG, the share of POM fraction in total OM was found to be the highest and reached 31.6% in the top soil layer 0–5 cm. In tilled soil under ORG and CON crop production systems, the percentage of POM in total OM was lower than in the soil under PRG and at the same soil layer amounted to 23.3% and 20.5%, respectively. At the depth of 5–10 cm the share of POM in the total OM significantly decreased, by 1.7, 1.6 and 1.2 times, for soil under PRG, ORG and CON treatments, respectively. At the lower layer 15–20 cm the decrease of POM contribution in total OM increased significantly in soil under PRG and ORG systems in relation to the 5–10 cm depth, but in the CON system no significant difference was measured. At the lowest 30–35 cm depth significantly lower percentage of POM in total OM was measured in soil under all studied treatments (Figure 4).
According to other researchers [23] the POM concentrations in cultivated soils were found to be much lower than in uncultivated soils, similar to our findings. Moreover, Alvaro-Fuentes et al. [62] found higher POM content in soil under a no-till system compared to conventional management with moldboard plowing at a 0–40 cm depth. Furthermore, previous studies have reported significantly higher concentrations of POM fraction at a 0–5 cm depth in no-till soil compared with conventionally tilled soil [7,40,62,63]. It was proved that POM is associated with a multitude of processes and functions in soil, e.g., formation of soil microbial biomass carbon, humic and non-humic fractions, water soluble carbon and exocellular mucilaginous polysaccharides, and therefore has been recognized as an important parameter of soil quality [22].

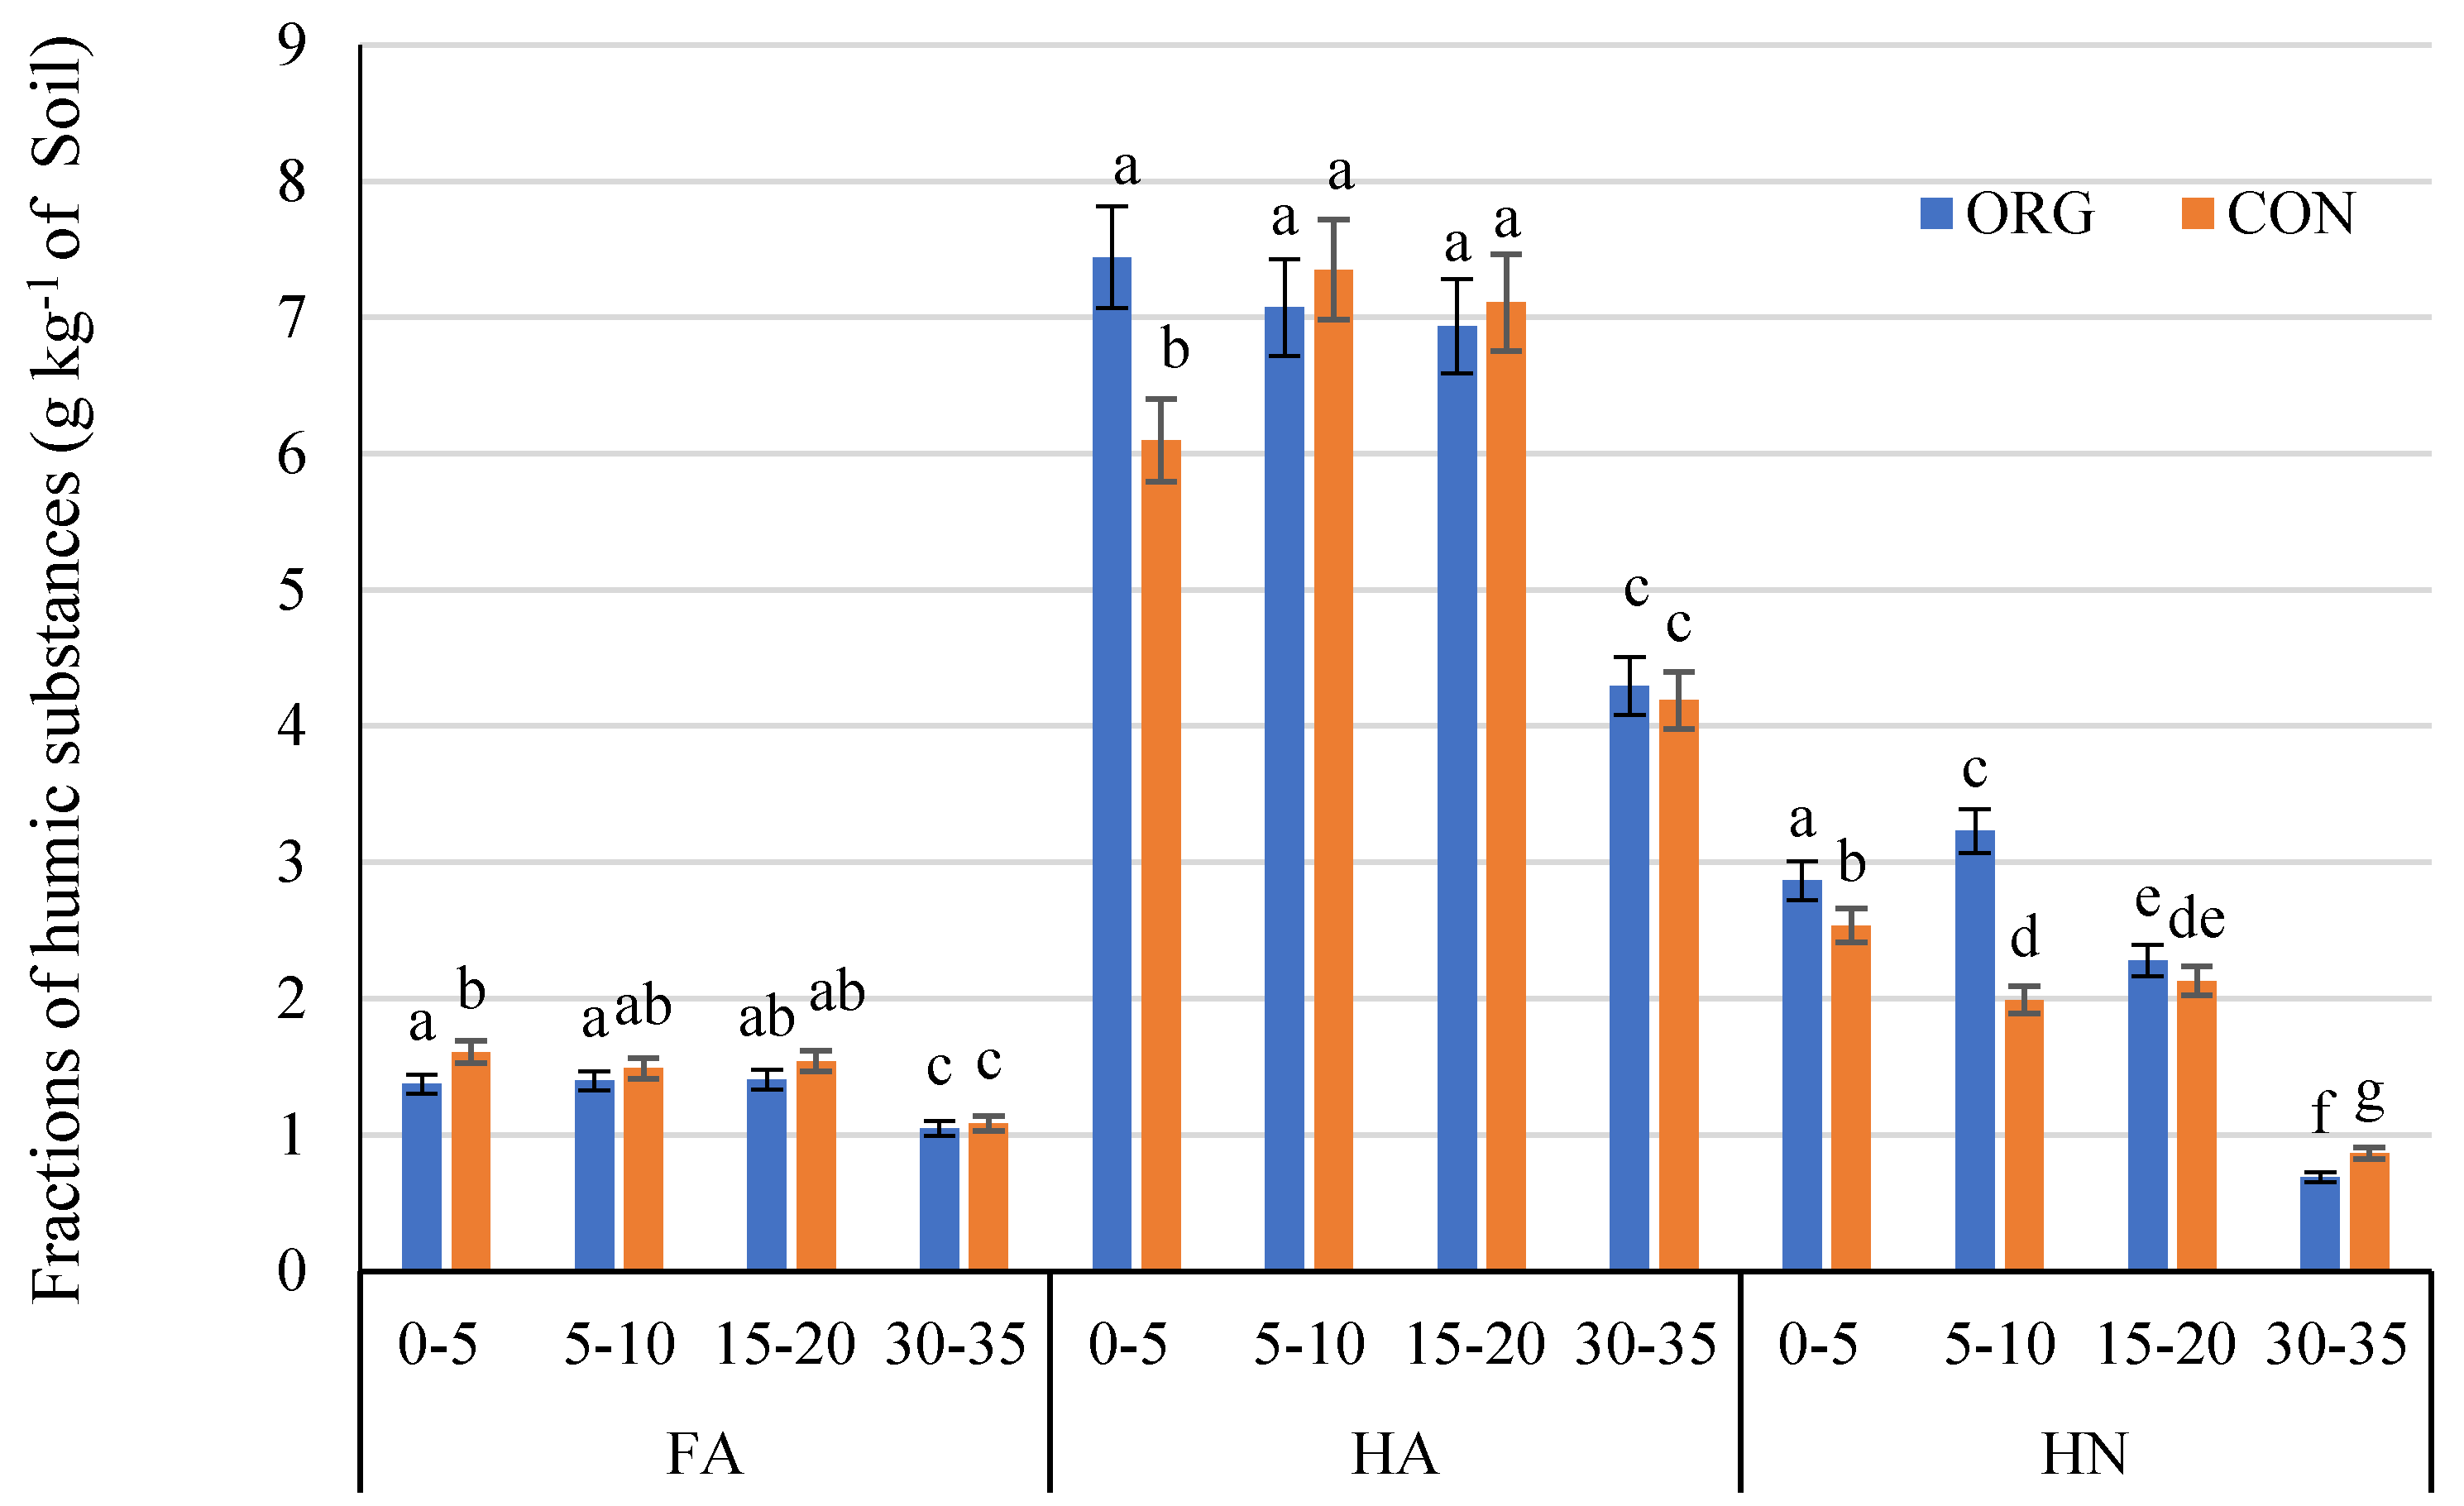
3.4. Effects on Humic Substances

The quantity of humic substances (HS) was analyzed only for ORG and CON crop production systems to assess the effect of cultivation methods on the quality of OM. The content of HS in soil under ORG and CON crop production systems differed significantly (Figure 5). Generally, soil under ORG had higher 40.03 g kg−1 (p ≤ 0.05) concentration of total HS compared to soil under the CON system 38.01 g kg−1, but the overall trend of changes for the individual fraction was comparable. The average concentrations were in the following order of humic acids (HA) > humins (HN) > fulvic acids (FA). This indicates that a predominant portion of HS constitutes the relatively stable part (HA + HN) of the total organic carbon (OC) pools.
Moreover, the crop production systems influenced the accumulation of OM in the soil profile depth. At the soil depth of 0–5 cm the highest differentiation between ORG and CON crop production systems in the content of all fraction of humic substances was observed. Significant decreases in the content of all determined fractions were noted in the depth level of 30–35 cm. A high variability was observed for HN, the content of which dropped on average 75% and 61%, and HA with a concentration slope of 43% and 32% decrease compared to their content in top soil layers, respectively, for soil under ORG and CON systems. Slightly smaller differences were noted for FA (25% and 30% for ORG and CON systems, respectively).
The changes in the HS content in the soil profile may by caused by agricultural practice (plowing of the soil at a depth of 0–25 cm) as well as the small mobility of humic compounds located mainly in the surface layer of the analyzed soil. The obtained data indicated that the CON crop production system affects the greater reduction with the depth of soil and the content of labile fractions, while in the ORG system the content of stable fractions decreases.
Generally, agricultural practices diminish the amount of HS, in particular the relatively stable fraction as HN or HA. Sun et al. [64] and Seddaiu et al. [65], pointed out that cultivation destabilizes humus formation and intensifies mineralization processes by increasing of soluble forms of FA with a significant contribution of active microorganisms.
The relationships between individual fractions expressed by the humification index (HI) and the degree of HS transformation (DT) indicate the soil OM quality in diversified crop production systems and the direction of its transformation processes [8,66,67].
In this study, the HA/FA ratio varied from 4.1 to 5.4 and from 3.8 to 4.9 for soil under ORG and CON systems, respectively, indicating differences in the intensity of OC humification and mobility in the soil (Table 5). The ORG system was characterized by a significantly higher value of humification coefficient (especially for 0–5 cm depth), which indicates greater changes in OM quality towards stable forms which was probably caused by the fertilization method. While the differences in HI value at the other depths (5–10, 15–20, 30–35 cm) were not statistically significant, their slightly higher values for ORG caused finally both crop production systems to differ significantly (4.9 for ORG and 4.3 for CON) in all analyzed profile depths. This means that in this case the crop production system significantly affects the transformation of OM mainly at top individual depth levels (humus).
The observed HI diversity in the soil profile could be also related to high heterogeneity of organic residues remaining at different sites in soils [68]. Our results are in accordance with others [8,66,68], implying that most of the degradable OM was converted to humus. Furthermore, HI values > 1 (for most of the soils) signaled that the HA fraction persisted longer in the soil, indicating the processes of accumulation and transformation during humification [69,70].
The humification degree (DT) proportions for soil under ORG and CON systems ranged from 2.6 to 7.7 and from 3.0 to 6.1, respectively (Table 5). An exceptionally high DT in soil under the ORG system at 30–35 cm depth may result from the easy movement of more labile humic fractions derived from organic fertilization (HA and FA) into the deeper part of soil profile (e.g., with atmospheric precipitation). Liu [66] suggested that the lower values of DT in soil under the ORG system implied that the humus converted from the organic soil amendments may be repolymerized to more stable macromolecule organic compounds, which usually function as regulators of macro- and micro-nutrient flow from soil to plant and aggregate formation agents. Additionally, the lower DT ratios indicate that humic substances occurs mainly in high-polymerized organic forms resistant to illuviation processes [69,70]. According to Liu [66], the high DT parameters (above 1) determine the relatively fertile soil with good water infiltration capacity, aggregate stability, microbial activity and nutrient supply. This confirms that the organic cultivation system enhances soil fertility and biological activity. This statement is also supported by the labile or particulate organic matter analysis and microbiological activity study (see Section 3.3 and Section 3.6).

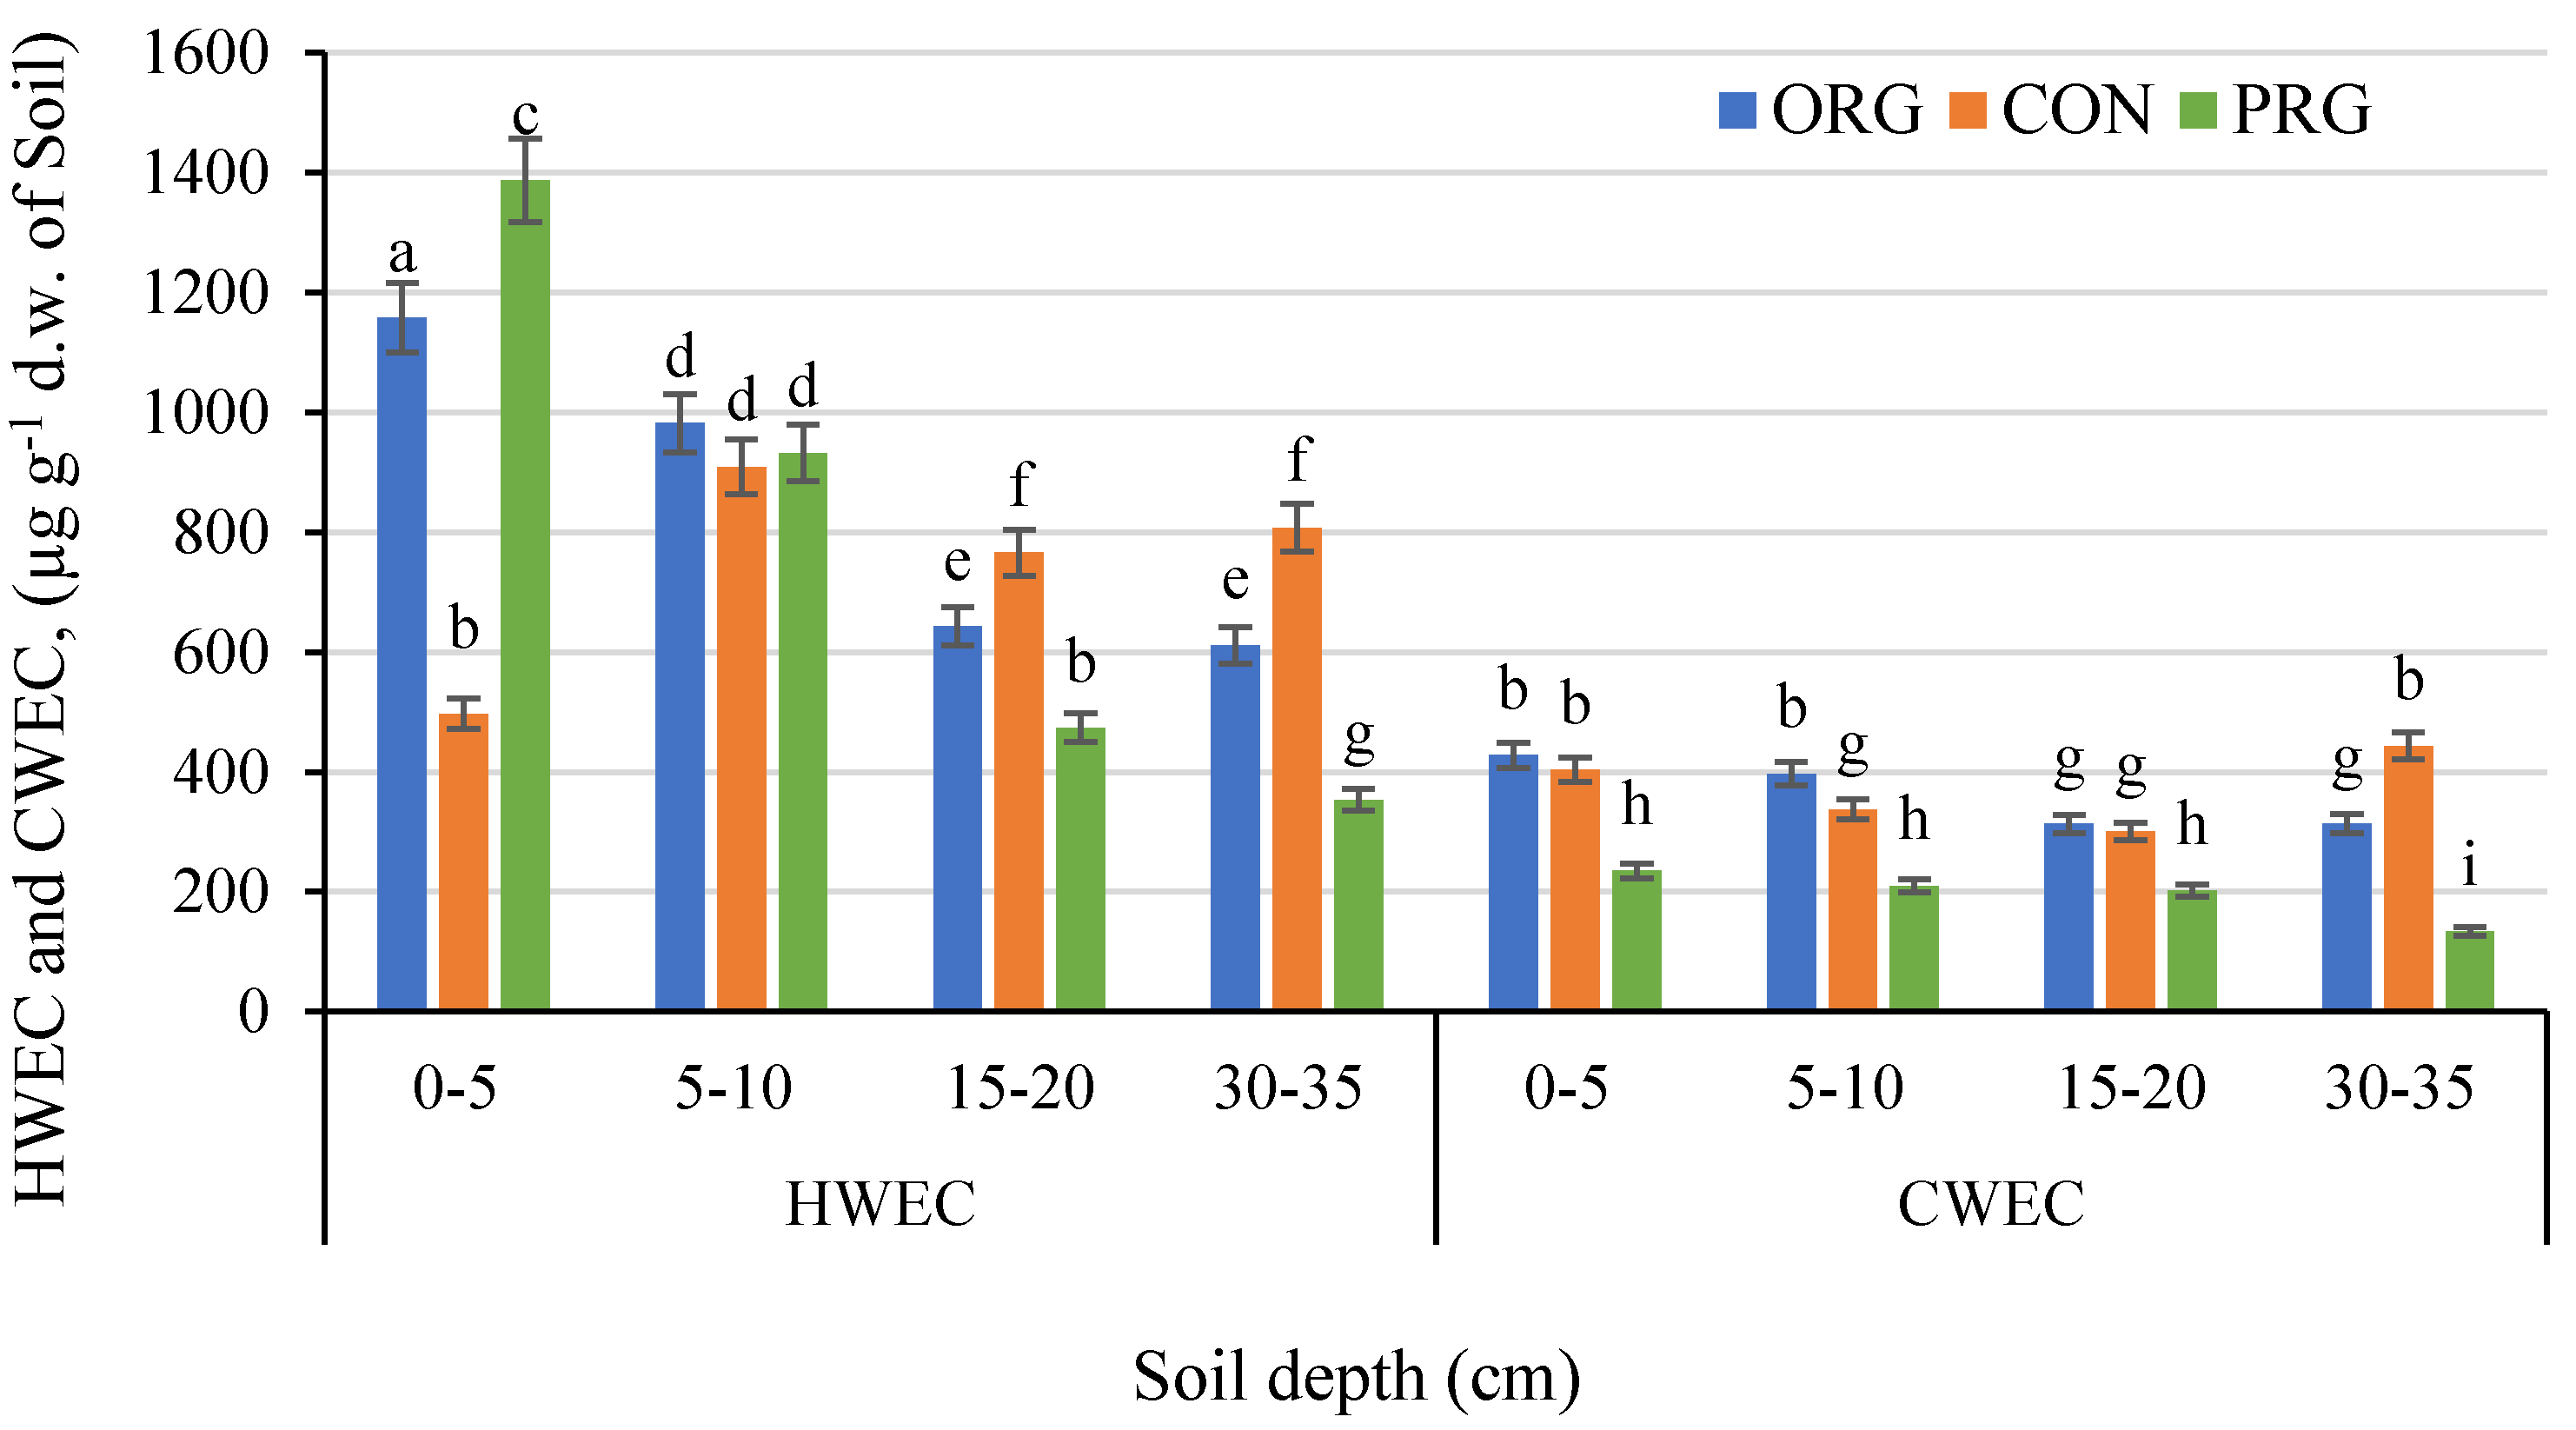
3.5. Effects on Water Extractable Carbon Fraction

Water dissolved labile fractions of organic carbon were significantly affected (p ≤ 0.05) by long-term applied treatments (Figure 6).
The highest quantity of HWEC fraction was assessed in the surface soil depth 0–5 cm under permanent grass 1387.2 µg g−1 d.w. of soil, on average, which was almost three times the quantity obtained in soil under the CON system. Soil under the CON crop production system at the surface layer showed the smallest average quantity of HWEC fraction (497.2 µg g−1 d.w. of soil) in relation to other studied soil layers as well as treatments. A similar relationship as for no-tillage soil under PRG was also observed in the tilled soil under the ORG crop production system. Our three year results indicate that, relative to the treatment involving no-tillage as PRG soil, the CON and ORG crop production systems involving plough operations resulted in a loss of about 50% HWEC fraction content, even in the surface soil.
The assessed quantities of CWEC fraction in soil under studied treatments were 2–3 times lower compared with assessed quantities of HWEC. There was no differences in CWEC quantities between studied layers of non-tilled under PRG and the content of that fraction was the lowest in that soil. In tilled soil under both crop production systems the assessed quantities of CWEC in all studied layers represented similar level and were two times higher as compared with non-tilled (Figure 7). Our results are in accordance with the ones published earlier by Hamkalo and Bedernichek [30]. They also indicated that quantities of HWEC and CWEC were significantly lower in arable than in uncultivated soils. Higher average contents of HWEC compared with CWEC, assessed in uncultivated soil, suggest that a much more informative indicator of organic matter quality is HWEC fraction. Similarly, several studies reported an increase in the concentration of labile organic carbon fractions in soils under reduced tillage compared with intensive tillage with plough operation [71,72].

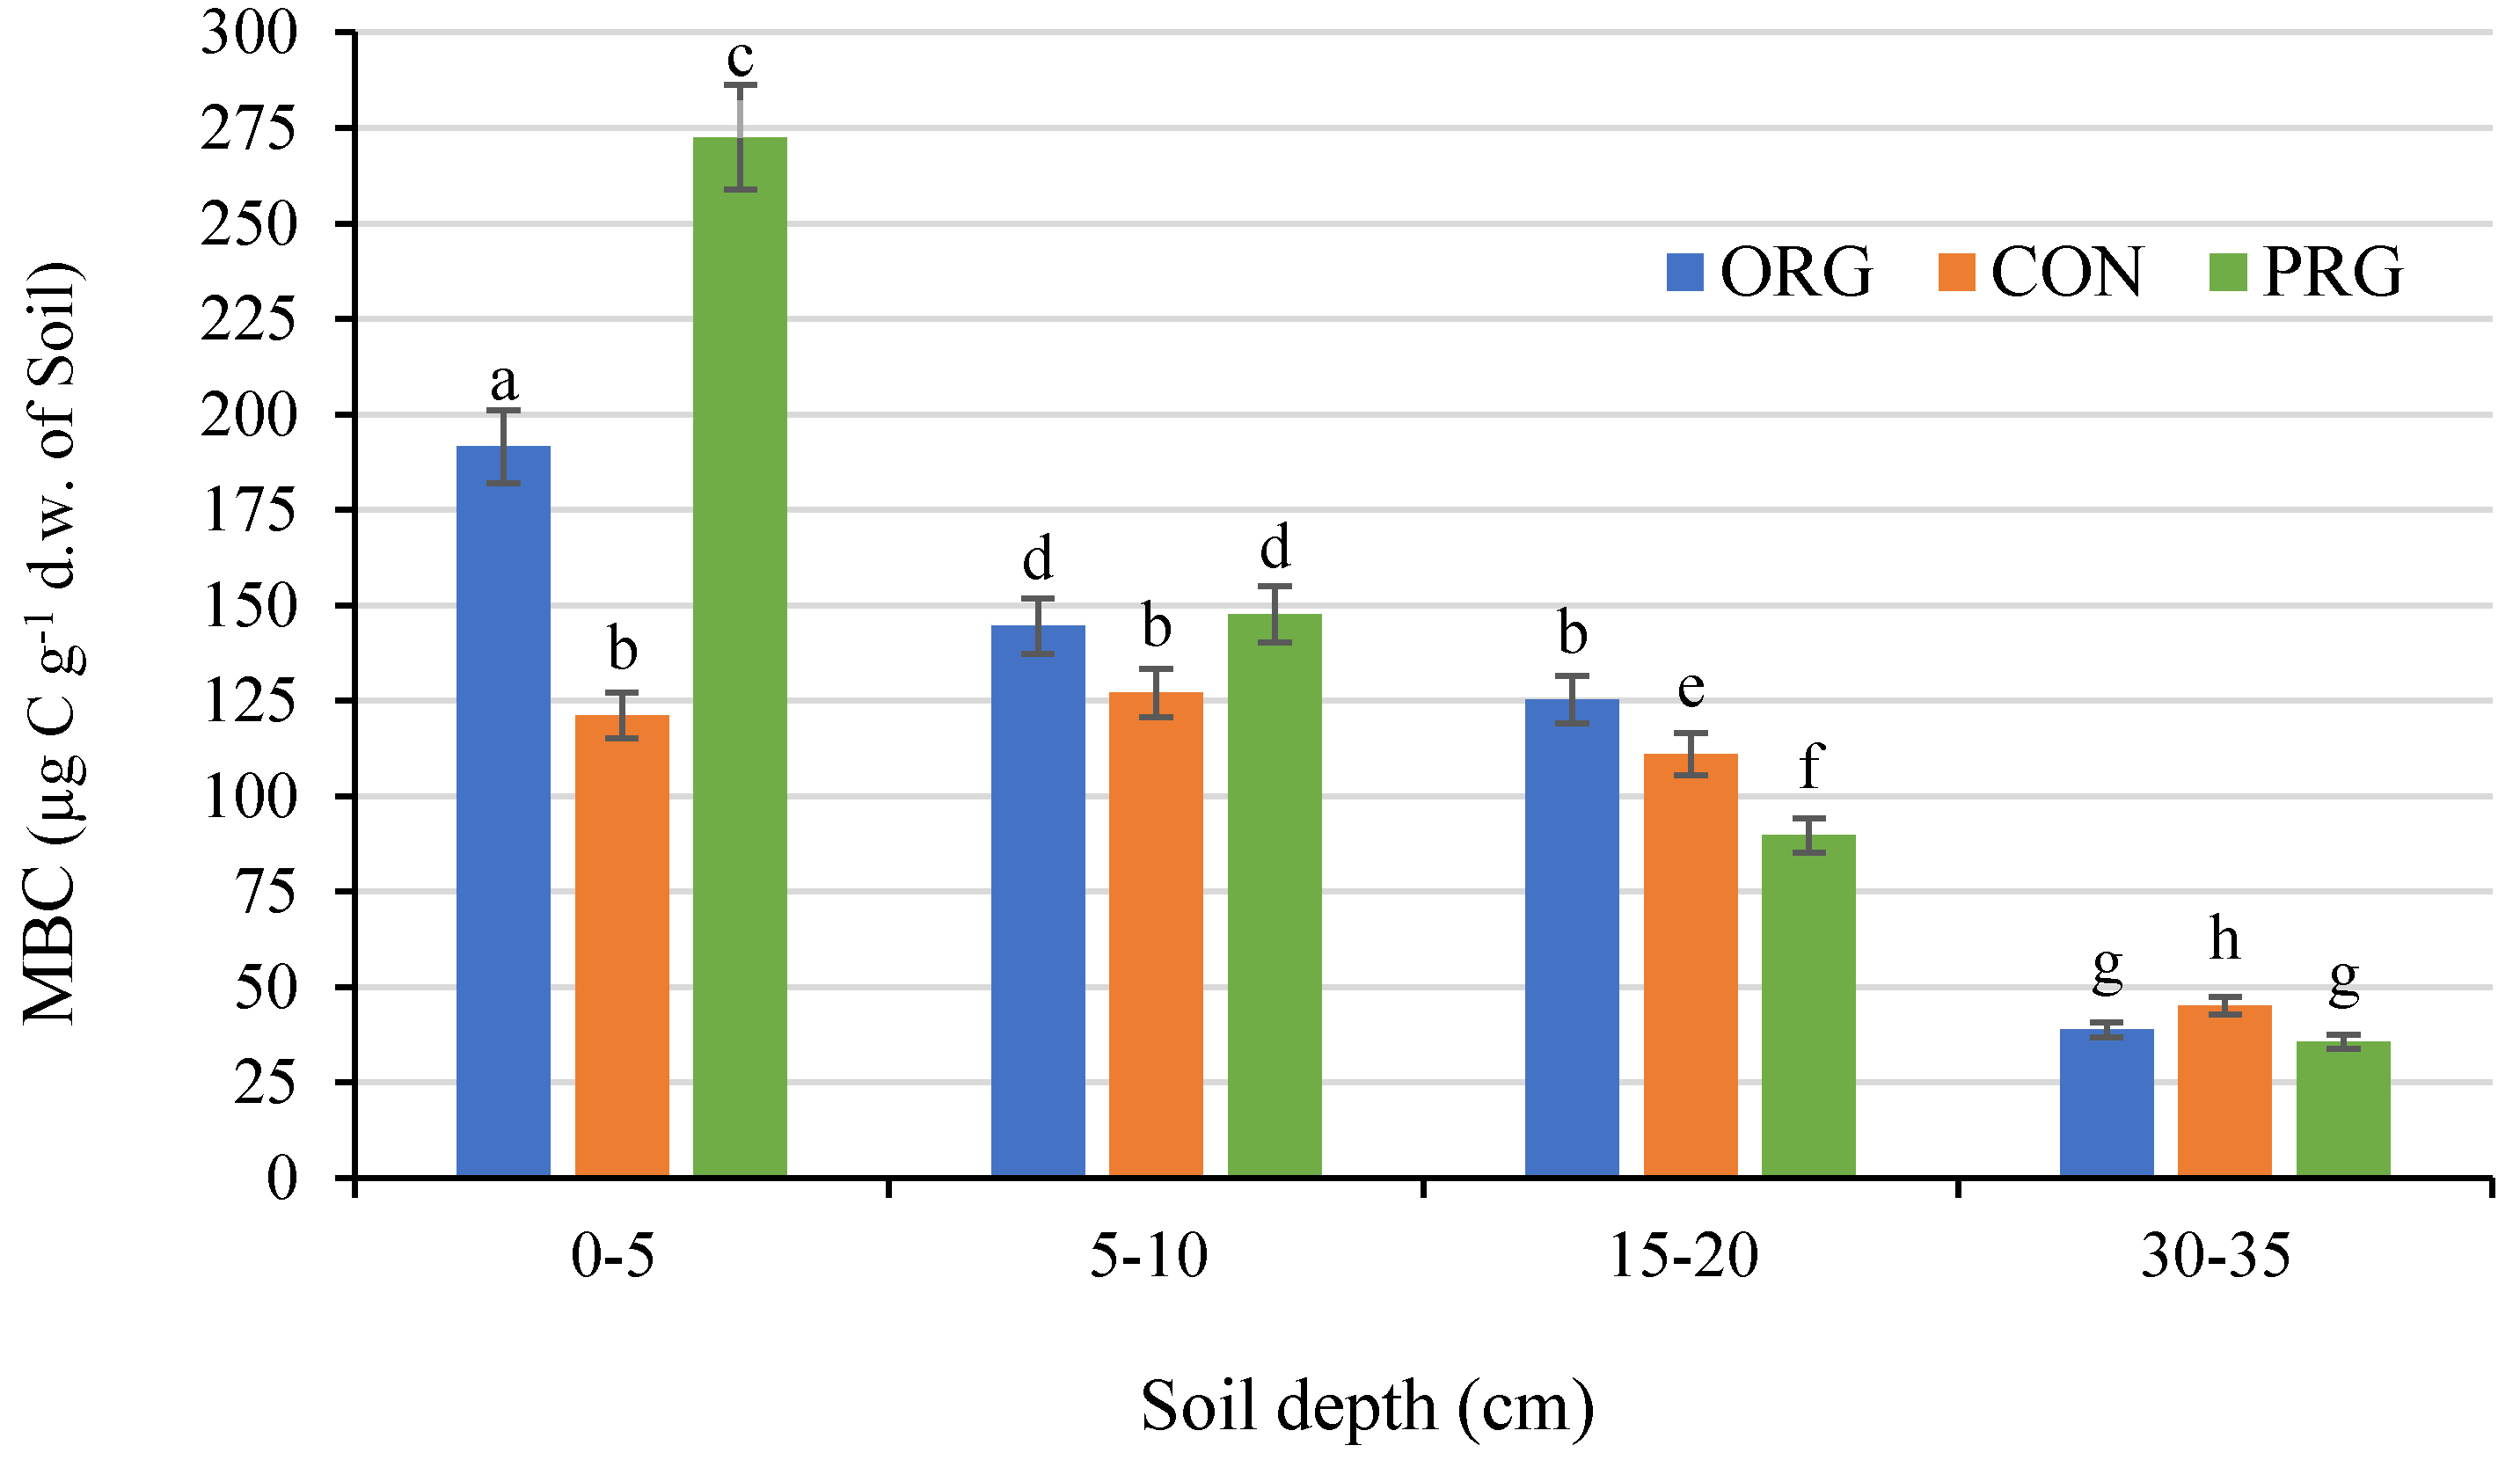
3.6. Effects on Microbial Biomass Carbon

Microbial biomass carbon (MBC) and microbial biomass nitrogen (MBN) reflect the size of the microbial community in soil and indicate the status of soil fertility and management effects on soil biological activity [73]. Microbial biomass links of soil nutrients to energy dynamics therefore respond rapidly to even short-term changes in soil environment [74]. There was a significant effect (p ≤ 0.05) of studied crop production systems on soil MBC assessed during the three growing seasons of winter wheat (Figure 7). In this study, the biggest differences between studied treatments in MBC contents were observed at the surface soil 0–5 cm depth. The highest accumulation of MBC at the surface depth was observed in non-tilled PRG soil. In relation to ORG and CON systems, the MBC content in the same depth of PRG soil was 30% and 55% higher, respectively. The surface depth under the ORG crop production system was enriched in MBC by 37% in comparison with the corresponding depth under the CON system. At lower soil depths the differences between all treatments were much smaller, although still statistically significant (Figure 7). Our findings clearly confirm an accumulation of labile soil organic matter fraction in the surface depth, especially in non-tilled PRG soil, as compared to the CON system. Similar to our findings, Yang et al. [75] also reported the sensitivity of soil MBC content to soil management, and measured higher levels of MB in uncultivated soil, and fallow treatments compared with cropping. A few years later, Zhang et al. [73] confirmed these earlier results, which again support our findings. Our results revealed that microbial biomass was more sensitive for detecting effects of different crop production systems on soil environment and responded more quickly than, e.g., total soil organic matter. These findings are in agreement with previous work [76], which showed that MBC contents measured in soil under native vegetation were higher and strongly affected by pasture species composition compared to cultivated soil, which is also a confirmation of our results.

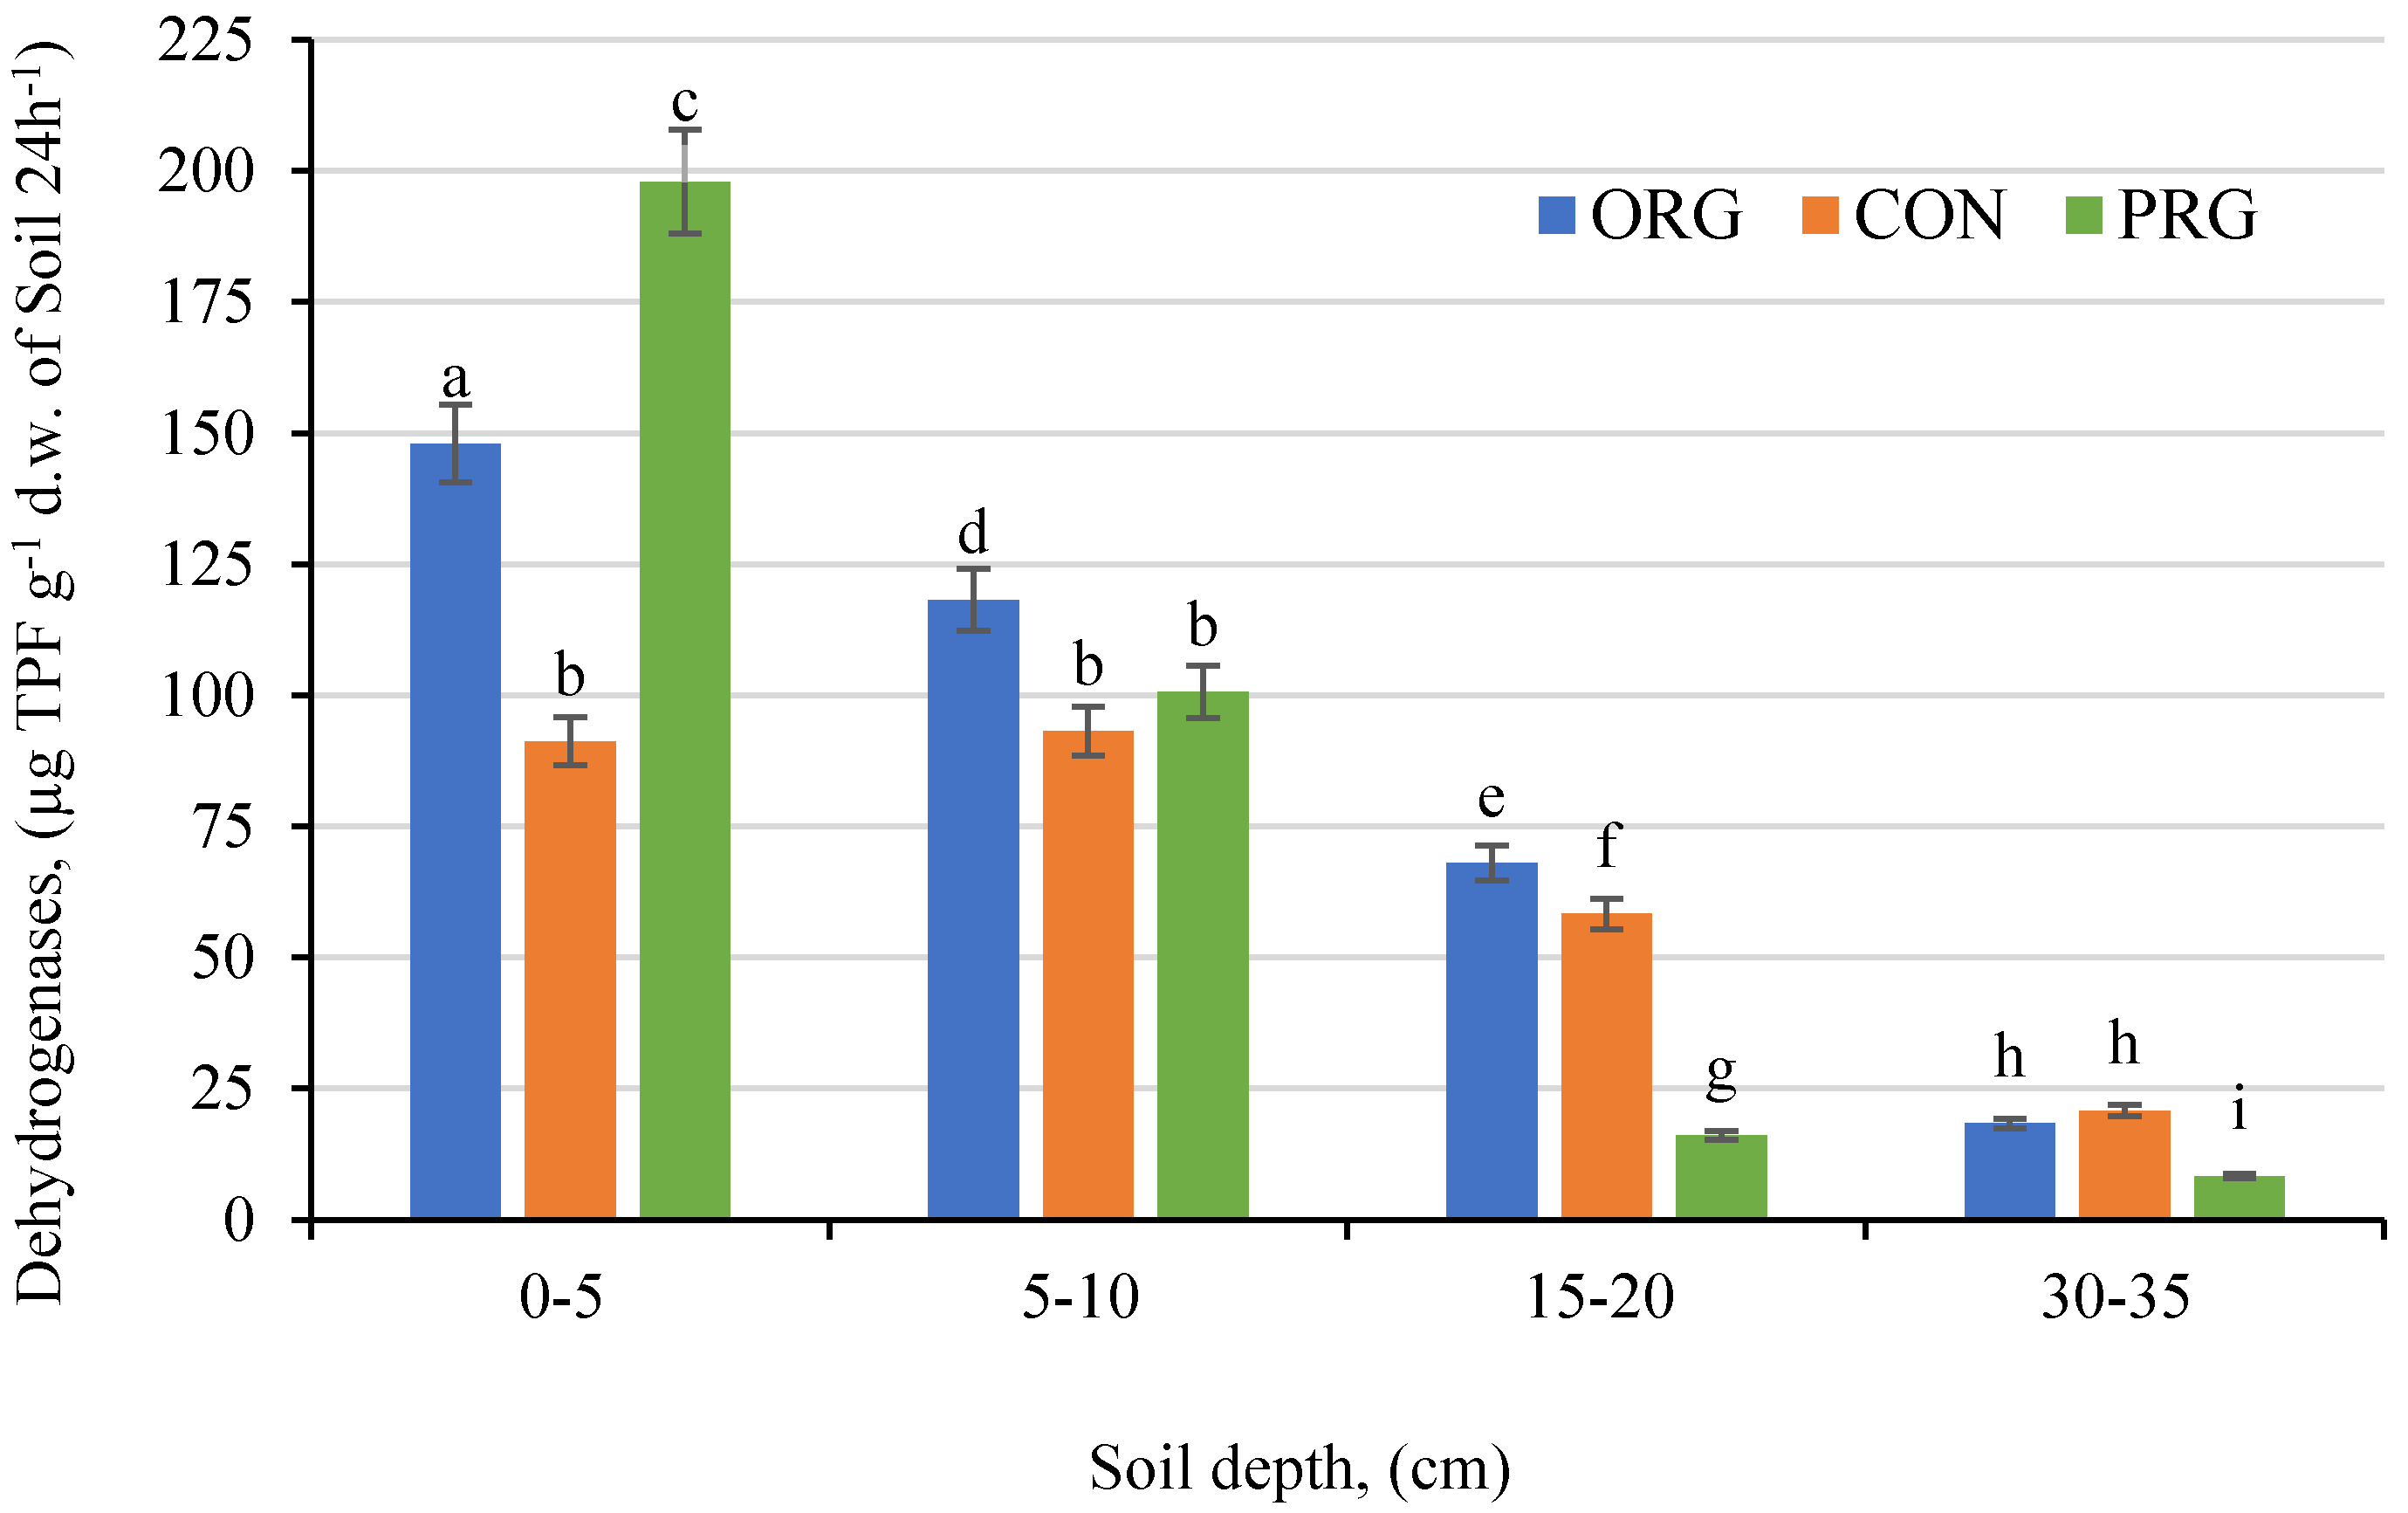
3.7. Effects on Soil Dehydrogenases Activity

Soil dehydrogenase activity (DH) is usually closely related to all microbial communities and reflects their oxidative activity, also defining the metabolic potential of soil microorganisms, as well as soil quality and fertility [77,78]. In our study, the DH activity, differentiated significantly, considered soil treatment at p ≤ 0.05 (Figure 8). The obtained values of dehydrogenase activity ranged between 197.9 and 8.4 µg TPF g−1 d.w. of soil 24 h−1. Mostly, the highest dehydrogenase activities for all studied treatments were measured in the surface soil 0–5 cm. However, in non-tilled PRG soil, DH activity showed to be 1.3 and 2.2 times higher at surface soil as compared to ORG and CON crop production systems, respectively. In soil under the CON system no significant differences were observed between 0–5 and 5–10 cm layers in DH activity, while in 15–20 and 30–35 cm depths activity of this enzyme dropped significantly.
Similar trends to DH activity were observed for other studied soil parameters such as OM, POM and MBC under all treatments. Most likely, this was an effect of plow operation and the different amount of plant residues input to the tilled soil under ORG and CON crop production systems as well as no till of soil under PRG as a control. These relations can be characterized by the changes in accumulation of organic matter in soil as a result of the different studied treatments. High dehydrogenase activity in non-tilled PRG soil was associated with quite high contents of organic matter and its good decomposition rate was confirmed by the relatively low C/N ratio observed (9.2:1). High enzyme activity in soil under PRG was influenced also by the effects of tillage abandonment and permanent grass coverage of soil. Similar results were reported earlier by Dick et al. [77] and Bergstrom et al. [79].
The index of metabolic potential (MPI) was calculated as the ratio between the size and activity of the viable microbial community and the size of energy sources for microorganisms was measured as dehydrogenase activity and water extractable carbon concentration, respectively [80]. In our study, the obtained values of the MPI were about 3 and 1.6 times higher in non-tilled soil under permanent grass PRG than in the tilled under ORG and CON crop production systems, especially in the layers at the 0–5 and 5–10 cm depths, respectively (Figure 9). In the non-tilled PRG soil, a significant decrease of the index values with increasing depth of the tested layers was noticed. A similar pattern of MPI values calculated for soil under the ORG crop production system was observed, but the values were significantly lower (1.5–3.0 times) compared with non-tilled soil under PRG. As was suggested by Caravaca et al. [81], this could be related to usually lower microbial activity showed by cultivated soils, mainly due to the decline in the content of easily decomposable organic compounds through tillage and soil disturbance. This proves that the metabolic index (MPI) can be utilized in assessing soil quality, as was found in studies of soil regeneration by Masciandaro et al. [80]. So far, no parameter has been defined that could be regarded as a universal biological indicator of soil quality [1]. Therefore, assessment of soil based on the analysis of the values of many parameters is more appropriate. The basic problem associated with soil biomonitoring is the high variability of most of the analysed parameters. A solution in this case can be offered by some proposed indicators.
To get a clearer picture of the soil environment changes, our study examined the metabolic potential index (MPI) for the first time. Due to a lack of information in the literature, we wanted to check its usefulness in assessing the quality of our soils. The MPI appeared to be very helpful in evaluating the effects of different crop production systems on soil quality. In soil under intensive agronomic use, as in the conventional crop production system, the MPI reached lower values compared to non-tilled soil and/or soil under the organic crop production system, indicating a significantly different microbial metabolic capacity involved in organic carbon degradation processes between the three different treatments studied. The non–tilled soil under permanent grass was used as a control to better see the scale of changes in soil induced by agronomic practice. Further work should extend this approach to a wider scale dataset in the soil information system.
High positive correlations between studied soil parameters and SOC (p ≤ 0.01) were obtained mostly for non–tilled soil under PRG and soil under ORG crop production systems. The concentration of SOC influenced strongly physical properties measured with TP; chemical properties assessed as a content of POM, HS and its particular fractions and HWEC, and biological activity expressed as MBC and DH activity (Table 6). The obtained correlations confirmed the strong mutual relationships within properties of the heterogeneous physical, chemical and biological soil properties, as was reported earlier [7,40].

4. Conclusions

Comparison between organic and conventional crop production systems showed that management based on organic fertilization only, enriching the soil with a large amount of plant residue inputs, balanced well the organic matter losses caused by tillage and supported the positive changes occurring in soil.
The organic crop production system contributed to significant increases in the values of organic matter content and soil total porosity, compared to the conventional crop production system. Moreover, the organic crop production system promoted more distinctly a general increase in labile fractions of organic matter and dehydrogenase activity in relation to the conventional system with high-input intensive cereal production.
In the conditions of our field experiment, non-tilled soil under permanent grass used as a control to tilled soil showed significantly higher values for most of the studied soil quality parameters, especially in the top soil layers 0–5 and 5–10 cm. That finding may be explained by the lack of soil inversion and therefore relative ecological stability of the soil environment. Moreover, the soil surface covered by grass vegetation throughout the year favors organic matter accumulation in the top soil layers.
The metabolic potential index was very helpful in evaluating changes in soil quality caused by different crop production systems. In soil under intensive agronomic use as in the conventional crop production system, the MPI showed lower values compared to non-tilled soil under permanent grass and/or soil under an organic crop production system, indicating that the soil microbial metabolic capacities involved in organic carbon degradation were significantly different between the three different treatments studied.
The obtained correlations demonstrated the high sensitivity of the studied parameters to changes in soil management, and confirmed the strong mutual relationships within heterogeneous physical, chemical and microbiological soil properties.
The results contribute to a better understanding of the relationships in the soil–plant system, and how the type of crop production system influences the quality and quantity of soil organic matter, and thus the activity of soil microbial communities.
A proper understanding of the basic principles of the stability of the soil environment would help to form a good basis for the design of innovative, appropriate soil management systems to save the soil function concerning environment and fertility, and simultaneously to sustain a high agricultural crop production level.
The results confirm the need to further control the effects of continuous use of different crop production systems on soil and environment. In the conditions of Poland (Central Europe), the PRG and ORG crop production systems provide good options to improve the physical, chemical and microbiological conditions of the soil.

Author Contributions

Conceptualization, A.M.G., E.A.C., A.U.-J.; formal analysis, A.M.G., E.A.C., A.U.-J.; investigation and methodology, A.M.G., E.A.C., A.U.-J.; resources, A.M.G., E.A.C., A.U.-J.; writing original draft, A.M.G., E.A.C., A.U.-J. All authors have read and agreed to the published version of the manuscript.

Funding

This research was supported the Ministry of Science and Higher Education of Poland conducted within the statutory activities of IUNG-PIB (2.26; 2.38) and the Ministry of Agriculture and Rural Development of Poland in the frames of Task 1.3; 1.4 Multi-Annual Program IUNG-PIB (2016-2020), and as a part of the statutory activities of the Department of Soil Science, Environmental Chemistry and Hydrology (DS/5/15/2016-2020), University of Rzeszow in Rzeszow.

Acknowledgments

Research was founded by the Ministry of Agriculture and Rural Development, and the Ministry of Science and Higher Education of Poland. Authors are very grateful to Dominik Lipski and Jerzy Baranski for helping in soil sampling and laboratory analysis.

Conflicts of Interest

The authors declare no conflict of interest.

References

  1. Doran, J.W.; Sarrantonio, M.; Liebig, M. Soil health and sustainability. Adv. in Agron. 1996, 56, 1–54. [Google Scholar]
  2. Lal, R.; Delgado, J.A.; Groffman, P.M.; Millar, N.; Dell, C.; Rotz, A. Management to mitigate and adapt to climate change. J. Soil and Water Conserv. 2011, 66, 276–285. [Google Scholar] [CrossRef] [Green Version]
  3. Doran, J.W.; Liebig, M.A.; Santana, D.P. Soil health and global sustainability. In Proceedings of the 16th World Congress of Soil Science, Montpellier, France, 20–26 August 1998. [Google Scholar]
  4. Dexter, A.R. Soil physical quality. Part I: Theory, effects of soil texture, density and organic matter, and effects on root growth. Geoderma 2004, 120, 201–214. [Google Scholar] [CrossRef]
  5. Dexter, A.R. Soil physical quality. Part II: Friability, tillage, tilth and hard-setting. Geoderma 2004, 120, 215–226. [Google Scholar] [CrossRef]
  6. Dexter, A.R. Soil physical quality, Part III: Unsaturated hydraulic conductivity and general conclusions about S-theory. Geoderma 2004, 120, 227–239. [Google Scholar] [CrossRef]
  7. Gajda, A.M.; Czyż, E.A.; Furtak, K.M.; Jończyk, K. Effects of crop production practices on soil characteristics and metabolic diversity of microbial communities under winter wheat. Soil Res. 2019, 1–8. [Google Scholar] [CrossRef]
  8. Ukalska-Jaruga, A.; Klimkowicz-Pawlas, A.; Smreczak, B. Characterization of organic matter fractions in the top layer of soils under different land uses in Central-Eastern Europe. Soil Use and Manag. 2019, 35, 595–606. [Google Scholar] [CrossRef]
  9. Gajda, A.M.; Ewa, A.; Czyż, E.A.; Dexter, A.R.; Furtak, K.M.; Grządziel, J.; Stanek-Tarkowska, J. Effects of different soil management practices on soil properties and microbial diversity. Int. Agrophys. 2018, 32, 81–91. [Google Scholar] [CrossRef] [Green Version]
  10. Stanek-Tarkowska, J.; Czyż, E.A.; Dexter, A.; Sławiński, C. Effect of reduced and traditional tillage on soil properties and diversity of diatoms under winter wheat. Int. Agrophys. 2018, 32, 403–409. [Google Scholar] [CrossRef]
  11. Czyż, E.A. Effects of traffic on soil aeration, bulk density and growth of spring barley. Soil Tillage Res. 2004, 79, 153–166. [Google Scholar] [CrossRef]
  12. Keller, T.; Arvidsson, J.; Dexter, A.R. Soil structures produced by tillage as affected by water content and the physical quality of soil. Soil Tillage Res. 2007, 92, 45–52. [Google Scholar] [CrossRef]
  13. Dexter, A.R.; Richard, G.; Arrouays, D.; Czyż, E.A.; Jolivet, C.; Duval, O. Complexed organic matter controls soil physical properties. Geoderma 2008, 144, 620–627. [Google Scholar] [CrossRef]
  14. Czyż, E.A.; Dexter, A.R. Soil physical properties as affected by traditional, reduced and no-tillage for winter wheat. Int. Agrophys. 2009, 23, 319–326. [Google Scholar]
  15. Dexter, A.R.; Czyż, E.A. Applications of S-theory in the study of soil physical degradation and its consequences. Land Degrad. Dev. 2007, 18, 369–381. [Google Scholar] [CrossRef]
  16. Ordoñez-Morales, K.D.; Cadena-Zapata, M.; Zermeño-González, A.; Campos-Magaña, S. Effect of tillage systems on physical properties of a clay loam soil under Oats. Agriculture 2019, 9, 62. [Google Scholar] [CrossRef] [Green Version]
  17. Boydaş, M.G.; Turgut, N. Effect of tillage implements and operating speeds on soil physical properties and wheat emergence. Turk. J. Agric. For. 2007, 31, 399–412. [Google Scholar]
  18. Małecka, I.; Blecharczyk, A.; Sawińska, Z.; Swędrzyńska, D.; Piechota, T. Winter wheat yield and soil properties response to long-term non-inversion tillage. J. Agr. Sci. Tech. 2015, 17, 1571–1584. [Google Scholar]
  19. Ukalska-Jaruga, A.; Debaene, G.; Smreczak, B. Particle and structure characterization of fulvic acids -from agricultural soils. J. Soil. Sediment. 2018, 18, 2833–2843. [Google Scholar] [CrossRef]
  20. Baldock, J.; Nelson, P. Soil organic matter. In Handbook of Soil Science; Sumner, E., Ed.; Taylor and Francis Group, CRC Press: Boca Raton, FL, USA, 2000; pp. 25–72. [Google Scholar]
  21. Cambardella, C.A.; Elliott, E.T. Particulate soil organic-matter changes across a grassland cultivation sequence. Soil Sci. Soc. Am. J. 1992, 56, 777–783. [Google Scholar] [CrossRef]
  22. Marriott, E.E.; Wander, M. Qualitative and quantitative differences in particulate organic matter fractions in organic and conventional farming systems. Soil Biol. Biochem. 2006, 38, 1527–1536. [Google Scholar] [CrossRef]
  23. Semenov, V.M.; Lebedeva, T.N.; Pautova, N.B. Particulate organic matter in noncultivated and arable soils. Eurasian Soil Sc. 2019, 52, 396–404. [Google Scholar] [CrossRef]
  24. Cambardella, C.A.; Elliott, E.T. Methods for physical separation and characterization of soil organic matter fractions. Geoderma 1993, 56, 449–457. [Google Scholar] [CrossRef]
  25. Stevenson, F.J. Humus Chemistry: Genesis, Ccomposition, Reactions; Wiley: Hoboken, NJ, USA, 1994. [Google Scholar]
  26. Mandeep, S.; Binoy, S.; Sabir, H.; Yong, S.O.; Bolan, N.S.; Gordon, J.C. Influence of physico-chemical properties of soil clay fractions on the retention of dissolved organic carbon. Environ. Geochem. Health 2017, 39, 1335–1350. [Google Scholar]
  27. Haynes, R.J. Labile organic matter fractions as central components of the quality of agricultural soils: An overview. Adv. Agron. 2005, 85, 221–268. [Google Scholar]
  28. Louis, B.P.; Maron, P.; Viaud, V.; Leterme, P.; Menasseri-Aubry, S. Soil C and N models that integrate microbial diversity. Environ. Chem. Lett. 2016, 14, 331–344. [Google Scholar] [CrossRef]
  29. Ghani, A.; Dexter, M.; Perrott, K.W. Hot-water extractable carbon in soils: A sensitive measurement for determining impacts of fertilisation, grazing and cultivation. Soil Biol. Biochem. 2003, 35, 1231–1243. [Google Scholar] [CrossRef]
  30. Hamkalo, Z.; Bedernichek, T. Total, cold and hot water extractable organic carbon in soil profile: Impact of land-use change. Zemdirbyste-Agriculture 2014, 101, 125–132. [Google Scholar] [CrossRef] [Green Version]
  31. Landgraf, D.; Leinweber, P.; Makeschin, F. Cold and hot water extractable organic matter as indicators of litter decomposition in forest soils. J. Plant Nutr. Soil Sc. 2006, 169, 76–82. [Google Scholar] [CrossRef]
  32. Chen, H.; Hou, R.; Gong, Y.; Li, H.; Fan, M.; Kuzyakov, Y. Effects of 11 years of conservation tillage on soil organic matter fractions in wheat monoculture in Loess Plateau of China. Soil Tillage Res. 2009, 106, 85–94. [Google Scholar] [CrossRef]
  33. Balota, E.L.; Colozzi-Filho, A.; Andrade, D.S.; Dick, R.P. Microbial biomass in soils under different tillage and crop rotation systems. Biol. Fert. Soils 2003, 38, 15–20. [Google Scholar] [CrossRef]
  34. Bender, S.F.; Wagg, C.; van der Heijden, M.G.A. An under-ground revolution: Biodiversity and soil ecological engineering for agricultural sustainability. Trends Ecol. Evol. 2016, 31, 440–452. [Google Scholar] [CrossRef] [PubMed]
  35. Ghosh, P.K.; Hazra, K.K.; Venkatesh, M.S.; Nath, C.P.; Singh, J.; Nadarajan, N. Increasing soil organic carbon through crop diversification in cereal–cereal rotations of Indo-Gangetic Plain. Proc. Nat. Acad. Sci. India Sec. B Biol. Sci. 2019, 89, 429–440. [Google Scholar] [CrossRef]
  36. García-Orenes, F.; Roldán, A.; Morugán-Coronado, A.; Linares, C.; Cerdà, A.; Caravaca, F. Organic fertilization in traditional Mediterranean grapevine orchards mediates changes in soil microbial community structure and enhances soil fertility. Land Degrad. Dev. 2016, 27, 1622–1628. [Google Scholar] [CrossRef]
  37. IUSS Working Group WRB. World Reference Base for Soil Resources 2006, First Update 2007; World Soil Resources Reports No.103; FAO: Rome, Italy, 2007. [Google Scholar]
  38. Polish Society of Soil Science. Particle Size Distribution and Textural Classes of Soils and Mineral Materials—Classification of Polish Society of Soil Science; (PTG in Polish); Soil Science Annual, PTG: Warsaw, Poland, 2009; Volume 60, pp. 5–16. [Google Scholar]
  39. Kuś, J.; Jończyk, K. Influence of organic and conventional crop production system on some parameters of soil fertility. J. Res Appl Agric Eng. 2008, 53, 161–165. [Google Scholar]
  40. Gajda, A.M.; Czyż, E.A.; Dexter, A.R. Effect of long-term use of different farming systems on some physical, chemical and microbiological properties of soil quality. Int. Agrophys. 2016, 30, 165–172. [Google Scholar] [CrossRef]
  41. PN-ISO 11277: Soil Quality—Determination of Particle Size Distribution in Mineral Soil Material—Method by Sieving and Sedimentation; Polish Committee for Standardization: Warsaw, Poland, 2020.
  42. ISO 17892-3: Geotechnical Investigation and Testing—Laboratory Testing of Soil—Part 3: Determination of Particle Density; ISO Central Secretariat: Geneva, Switzerland, 2015.
  43. ISO 10390: International Standardization Organization (ISO), 2005. Soil Quality—Determination of pH; ISO: Geneva, Switzerland, 2020.
  44. Page, A.L.; Miller, R.H.; Keeney, D.R. Methods of Soil Analysis. Part 2. Chemical and Microbiological Properties, 2nd ed.; American Society of Agronomy and Soil Science Society of America: Madison, WI, USA, 1982. [Google Scholar]
  45. PN-R-04028:1997. Chemical-agricultural Analysis of Soil—Sampling Method and Determination of Nitrate and Ammonium Ions in Mineral Soils; Polish Committee for Standardization: Warsaw, Poland, 1997. (In Polish)
  46. PN-ISO 14235: 2003. Soil Quality—Determination of Organic Carbon by Sulfochromic Oxidation; Polish Committee for Standardization: Warsaw, Poland, 2003.
  47. Ostrowska, A.; Gawliński, S.; Szczubiałka, Z. Methods of Analysis and Estimation of Soil and Plant Properties; Institute of Environmental Protection: Warsaw, Poland, 1991; pp. 59–61. (In Polish) [Google Scholar]
  48. Gajda, A.M.; Doran, J.W.; Kettler, T.A.; Wienhold, B.J.; Pikul, J.L., Jr.; Cambardella, C.A. Soil quality evaluations of alternative conventional management systems in the great plains. In Assessment Methods for Soil Carbon; Lal, R., Kimble, J.M., Follett, R.F., Stewart, B.A., Eds.; CRC Press LLC: Boca Raton, FL, USA, 2001; pp. 381–400. [Google Scholar]
  49. Schulte, E.E.; Hopkins, B.G. Estimation of soil organic matter by weight loss-on-ignition. In Soil Organic Matter: Analysis and Interpretation; Magdoff, F.R., Tabatabai, M.A., Hanlon, E.A., Jr., Eds.; Soil Science Society of America: Madison, WI, USA, 1996; pp. 21–31. [Google Scholar]
  50. Loeppert, R.H.; Suarez, D.L. Carbonate and gypsum. In Methods of Soil Analysis. Part 3. Chemical Methods; Sparks, D.L., Page, A.L., Helmke, P.A., Loeppert, R.H., Soltanpour, P.N., Tabatabai, M.A., Johnston, C.T., Sumner, M.E., Eds.; ASA and SSSA: Madison, WI, USA, 1996; pp. 437–474. [Google Scholar]
  51. ISO 12782-4: Soil Quality—Parameters for Geochemical Modelling of Leaching and Speciation of Constituents in Soils and Materials—Part 4: Extraction of Humic Substances from Solid Samples; ISO Central Secretariat: Geneva, Switzerland, 2012.
  52. Swift, R.S. Organic matter characterization. In Methods of Soil Analysis, Part 3. Chemical Methods; Sparks, D.L., Page, A.L., Helmke, P.A., Loeppert, R.H., Soltanpour, P.N., Tabatabai, M.A., Johnston, C.T., Sumner, M.E., Eds.; ASA and SSSA: Madison, WI, USA, 1996; pp. 1011–1069. [Google Scholar]
  53. Haynes, R.J.; Francis, G.S. Changes in microbial biomass C, soil carbohydrate composition and aggregate stability induced by growth of selected crop and forage species under field conditions. J. Soil Sc. 1993, 44, 665–675. [Google Scholar] [CrossRef]
  54. Jenkinson, D.S.; Ladd, J.N. Microbial biomass in soil: Measurement and turnover. In Soil Biochemistry; Paul, E.A., Ladd, J.N., Eds.; Marcel Dekker Inc.: New York, NY, USA, 1981; pp. 415–471. [Google Scholar]
  55. PN-EN ISO 23753-1: Determination of Dehydrogenase Activity in Soil—Part 1: Method Using 2,3,5-triphenyltetrazolium Chloride (TTC); ISO: Geneva, Switzerland, 2011.
  56. Martinez, E.; Fuentes, J.P.; Silva, P.; Valle, S.; Acevedo, E. Soil physical properties and wheat root growth as affected by no-tillage and conventional tillage systems in a Mediterranean environment of Chile. Soil Tillage Res. 2008, 99, 232–244. [Google Scholar] [CrossRef]
  57. Głąb, T.; Kulig, B. Effect of mulch and tillage on soil porosity under wheat (Triticum aestivum L.). Soil Till. Res. 2008, 99, 169–178. [Google Scholar] [CrossRef]
  58. Pagliai, M.; Vignozzi, N. The soil pore system as an indicator of soil quality. Adv. Geoecol. 2002, 35, 69–80. [Google Scholar]
  59. Paluszek, J. Criteria for assessing the physical quality of Poland’s arable soils. In Acta Agrophys; Institute of Agrophysics, Polish Academy of Sciences: Lublin, Poland, 2011; pp. 1–138. (In Polish) [Google Scholar]
  60. Sarkar, I.; Zulfikar Khan, M.Z.; Hanif, M. Soil organic fractions in cultivated and uncultivated soils of Costal area in Bangladesh. J. Agric. Chem. Environ 2019, 8, 129–144. [Google Scholar] [CrossRef] [Green Version]
  61. Souza, G.P.; Figueiredo, C.C.; Sousa, D.M.G. Relationships between labile soil organic carbon fractions under different soil management systems. Sci. Agric. 2016, 73, 535–542. [Google Scholar] [CrossRef] [Green Version]
  62. Alvaro-Fuentes, J.; López, M.V.; Cantero-Martínez, C.; Arrúe, J.L. Tillage effects on soil organic carbon fractions in Mediterranean dryland agroecosystems. Soil Sci. Soc Am. J. 2008, 72, 541–547. [Google Scholar] [CrossRef] [Green Version]
  63. Sequeira, C.H.; Alley, M.M.; Jones, B.P. Evaluation of potentially labile soil organic carbon and nitrogen fractionation procedures. Soil Biol. Biochem. 2011, 43, 438–444. [Google Scholar] [CrossRef]
  64. Sun, C.Y.; Liu, J.S.; Wang, Y.; Zheng, N.; Wu, Q.X.; Liu, Q. Effect of long-term cultivation on soil organic carbon fraction and metal distribution in humic and fulvic acid in black soil, Northeast China. Soil Res. 2012, 50, 562–569. [Google Scholar] [CrossRef]
  65. Seddaiu, G.; Porcu, G.; Ledda, L.; Roggero, P.; Agnelli, A.; Corti, G. Soil organic matter content and composition as influenced by soil management in a semi-arid Mediterranean agro-silvo-pastoral system. Agr. Ecosyst. Environ. 2013, 167, 1–11. [Google Scholar] [CrossRef]
  66. Liu, H. Relationship between organic matter humification and bioavailability of sludge- borne copper and calcium during long-term sludge amendment to soil. Sci. Total Environ. 2016, 566–567, 8–14. [Google Scholar] [CrossRef]
  67. You, M.; Burger, M.; Li, L.; Zou, W.; Li, N.; Qiao, Y.; Han, X. Changes in soil organic carbon and carbon fractions under different land use and management practices after development from parent material of Mollisols. Soil Sci. 2014, 179, 205–210. [Google Scholar] [CrossRef]
  68. Guimarães, D.V.; Gonzaga, M.I.S.; Silva, T.O.; Silva, T.L.; Dias, N.; Matias, M.I. Soil organic matter pools and carbon fractions in soil under different land uses. Soil Tillage Res. 2013, 126, 177–182. [Google Scholar]
  69. Moraes, G.M.; Xavier, F.A.; Mendonça, E.S.; Araujo Filho, J.A.; Oliveira, T.S. Chemical and structural characterization of soil humic substances under agroforestry and conventional systems. Brazilian J. of Soil Sci. 2011, 35, 1597–1608. [Google Scholar] [CrossRef] [Green Version]
  70. Tan, K.H. Humic Matter in Soil and the Environment. Principles and Controversies; CRC Press Taylor & Francis Group: Boca Raton, FL, USA, 2014; pp. 1–495. [Google Scholar]
  71. Liu, E.; Teclemariam, S.G.; Yan, C.; Yu, J.; Gu, R.; Liu, S.; He, W.; Liu, Q. Long-term effects of no-tillage management practice on soil organic carbon and its fractions in the northern China. Geoderma 2014, 213, 379–384. [Google Scholar] [CrossRef]
  72. Bongiorno, G.; Bünemann, E.K.; Oguejiofor, C.U.; Meier, J.; Gort, G.; Comans, R.; Mäder, P.; Brussaard, L.; de Goede, R. Sensitivity of labile carbon fractions to tillage and organic matter management and their potential as comprehensive soil quality indicators across pedoclimatic conditions in Europe. Ecol. Indic. 2019, 99, 38–50. [Google Scholar] [CrossRef]
  73. Zhang, S.; Li, H.; Yang, X.; Sun, B. Effects of soil management regimes on biochemical properties of a loess soil. J. Soil Sci. Plant Nutr. 2015, 15, 711–725. [Google Scholar] [CrossRef] [Green Version]
  74. Haynes, R.J. Soil organic matter quality and the size and activity of the microbial biomass: Their significance to the quality of agricultural soils. In Soil Mineral Microbe-organic Interactions; Huang, Q., Huang, P.M., Violante, A., Eds.; Springer: Heidelberg, Germany, 2008; pp. 201–231. [Google Scholar]
  75. Yang, X.; Ren, W.; Sun, B.; Shulan Zhang, S. Effects of contrasting soil management regimes on total and labile soil organic carbon fractions in a loess soil in China. Geoderma 2012, 177–178, 49–56. [Google Scholar] [CrossRef]
  76. Lopes, M.M.; Salviano, A.A.C.; Araujo, A.S.F.; Nunes, L.A.P.L.; Oliveira, M.E. Changes in soil microbial biomass and activity in different Brazilian pastures. Span. J. Agric. Res. 2010, 8, 1253–1259. [Google Scholar] [CrossRef] [Green Version]
  77. Dick, R.P. Soil enzyme activities as indicators of soil quality. In Defining Soil Quality for a Sustainable Environment; Doran, J.W., Coleman, D., Bezdicek, D.F., Stewart, B.A., Eds.; Soil Science Society of America: Madison, WI, USA, 1994; pp. 107–124. [Google Scholar]
  78. Stamenov, D.; Durić, S.; Hajnal Jafari, T.; Ćirić, V.; Manojlović, M. Microbiological activity in the soil of various agricultural crops in organic production. Contemp. Agricult. 2018, 67, 34–39. [Google Scholar] [CrossRef] [Green Version]
  79. Bergstrom, D.W.; Monreal, C.M.; Tomlin, A.D.; Miller, J.J. Interpretation of soil enzyme activities in a comparison of tillage practices along a topographic and textural gradient. Can. J. Soil Sci. 2000, 80, 71–79. [Google Scholar] [CrossRef] [Green Version]
  80. Masciandaro, G.; Ceccanti, B.; Gallardo-Lancho, J.F. Organic matter properties in cultivated versus set-aside arable soils. Agric. Ecosyst. Environ. 1998, 67, 267–274. [Google Scholar] [CrossRef]
  81. Caravaca, F.; Masciandaro, G.; Ceccanti, B. Land use in relation to soil chemical and biochemical properties in a semiarid Mediterranean environment. Soil Tillage Res. 2002, 68, 23–30. [Google Scholar] [CrossRef]
Figure 1. Soil total porosity (TP) in 2016–2018 (means for the three years are presented in each column, n = 24). Different letters represent significantly different values (Tukey, p ≤ 0.05). Definitions: ORG—organic crop production system; CON—conventional crop production system; PRG—permanent grass; n—number of samples. Vertical bars represent standard errors.
Agronomy 10 01130 g001
Figure 2. Soil organic matter (OM) content for 2016–2018 (means for the three years are presented in each column, n = 24). Different letters represent significantly different values (Tukey, p ≤ 0.05). Definitions: ORG—organic crop production system; CON—conventional crop production system; PRG—permanent grass; n—number of samples. Vertical bars represent standard errors.
Agronomy 10 01130 g002
Figure 3. Particulate organic matter (POM) content in soil in 2016–2018 (means for the three years are presented in each column, n = 24). Different letters represent significantly different values (Tukey, p ≤ 0.05). Definitions: ORG—organic crop production system; CON—conventional crop production system; PRG—permanent grass; n—number of samples. Vertical bars represent standard errors.
Agronomy 10 01130 g003
Figure 4. Particulate organic matter (POM) in soil expressed as a percent of total organic matter for 2016–2018 (means for the three years are presented in each column, n = 24). Different letters represent significantly different values (Tukey, p ≤ 0.05). Definitions: ORG—organic crop production system; CON—conventional crop production system; PRG—permanent grass; n—number of samples. Vertical bars represent standard errors.
Agronomy 10 01130 g004
Figure 5. Humic substance (FA, HA, HN) individual fraction content in soil under different crop production systems in 2016–2018 (means for the three years are presented in each column, n = 24). Different letters represent significantly different values (Tukey, p ≤ 0.05). Definitions: FA—fulvic acids, HA—humic acids, HN—humins; ORG—organic crop production system; CON—conventional crop production system; n—number of samples. Vertical bars represent standard errors.
Agronomy 10 01130 g005
Figure 6. Hot water extractable carbon (HWEC) and cold water extractable carbon (CWEC) fractions in soil in 2016–2018 (means for the three years are presented in each column, n = 24). Different letters represent significantly different values (Tukey, p ≤ 0.05). Definitions: ORG—organic crop production system; CON—conventional crop production system; PRG—permanent grass; d.w. —dry weight of soil; n—number of samples. Vertical bars represent standard errors.
Agronomy 10 01130 g006
Figure 7. Microbial biomass carbon (MBC) content in soil in 2016–2018 (means for the three years are presented in each column, n = 24). Different letters represent significantly different values (Tukey, p ≤ 0.05). Definitions: ORG—organic crop production system; CON—conventional crop production system; PRG—permanent grass; d.w.—dry weight of soil; n—number of samples. Vertical bars represent standard errors.
Agronomy 10 01130 g007
Figure 8. Dehydrogenase activity in soil in 2016–2018 (means for the three years are presented in each column, n = 24). Different letters represent significantly different values (Tukey, p ≤ 0.05). Definitions: ORG—organic crop production system; CON—conventional crop production system; PRG—permanent grass; d.w.—dry weight of soil; n—number of samples. Vertical bars represent standard errors.
Agronomy 10 01130 g008
Figure 9. Values of metabolic potential index in soil in 2016–2018 (means for the three years are presented in each column, n = 24). Different letters represent significantly different values (Tukey, p ≤ 0.05). Definitions: MPI—metabolic potential index; DH—dehydrogenase activity; WEC—water extractable carbon; ORG—organic crop production system; CON—conventional crop production system; PRG—permanent grass; d.w.—dry weight of soil; n—number of samples. Vertical bars represent standard errors.
Agronomy 10 01130 g009
Table 1. Soil characterization of the 0–10 cm layer experimental soil for years 2016–2018.
Crop Production System OMPEgnerKEgnerMgSchatschstshabelNmin.
pH KCl(g kg−1 of Soil)(mg kg−1 of Soil)(kg ha−1)
ORG5.8 a17.7 a67 a130 a80 a60.5 a
CON6.2 a14.1 b89 b191 b33 b48.7 b
PRG4.6 b18.3 a72 c133 a38 b59.2 a
HSD (0.05)0.70.54.135.15.210.5
HSD (0.05) For Years—Significant Differences
HSD (0.05) For Interaction (Organic System × Conventional System × Permanent Grass)—Significant Differences
HSD (0.05) For Interaction (Organic System × Conventional System × Permanent Grass × Years)—Mot Significant Differences
ORG—organic crop production system; CON—conventional crop production system; PRG—permanent grass. Mean values with different letters are significantly different (Tukey test, HSD (Honest Significant Difference), p ≤ 0.05, n = 24).
Table 2. Characteristics of crop management in winter wheat and permanent grass (2016–2018).
ManagementCrop Production SystemsPermanent Grass (PRG)
Organic (ORG)Conventional (CON)
Soil tillageMouldboard PloughingMouldboard Ploughing0
Crop RotationPotato
Spring wheat + Undersown Clover and Grass—1st year
Clover and Grass—2nd year
Winter Wheat + Catch Crop Mustard
Winter Rape
Winter Wheat
Spring Barley
Grass
Organic FertilizationUnder Potato Compost (30 t·ha−1) + Catch CropWinter Rape Straw
Winter Wheat Straw
0
Mineral Fertilization (kg·ha−1)Natural P and K Fertilizers:
N0140120
P2O5426050
K2O758060
Weed ControlWeeder Harrow 2–3 ×Herbicides 2–3 ×Herbicides 1 ×
Retardants02 ×0
Fungicides02–3 ×0
Table 3. The monthly mean air temperature (°C) during the period 2016–2018 and long-term mean (1984–2014) at Osiny Experimental Station (Poland).
Month1984–20142015/20162016/20172017/2018
IX13.515.315.614.1
X8.37.07.79.5
XI3.55.23.24.6
XII−0.44.00.82.5
I−1.7−3.4−4.60.4
II−0.53.7−1.2−3.4
III3.04.36.00.4
IV8.89.67.613.6
V14.115.513.617.2
VI17.219.818.118.8
VII19.420.018.620.7
VIII18.618.719.620.7
t8.7 a10.08.89.9
d-+1.3+0.1+1.2
t—mean air temperature (°C) from sowing to harvest winter wheat; d—deviation from long term annual temperature (°C); 8.7a—mean temperature for long-term (1984–2014).
Table 4. Total rainfall distribution (mm) during the period 2016–2018 and long-term mean (1984–2014) at Osiny Experimental Station (Poland).
Month1984–20142015/20162016/20172017/2018
IX5812621105
X4130100.095
XI394745.054
XII31256520
I273330.217
II276544.117
III335332.031
IV40386530
V59726259
VI62283138
VII8387105122
VIII68429628
r568 b646696616
d-+78+131+48
r—sum rainfall (mm) from sowing to harvest winter wheat; d—deviation from long-term annual sum rainfall (mm); 568 b—sum mean rainfall for long-term (1984–2014).
Table 5. Values of humification index (HI) and humification degree (DT) of soils under different crop production systems (means for three years 2016—2018).
Crop Production SystemsHumification Index [HI = HA/FA]
0–5 cm5–10 cm15–20 cm30–35 cm0–35 cm
ORG5.4 a5.1 a4.9 a4.1 a4.9 a
CON3.8 b4.9 a4.6 a3.9 a4.3 b
Transformation Degree of HS (DT = (HA + FA/HN))
0–5 cm5–10 cm15–20 cm30–35 cm0–35 cm
ORG3.1 a2.6 a3.6 a7.7 a4.2 a
CON3.0 a4.4 b4.1 b6.1 b4.4 a
Definitions: FA—fulvic acids, HA—humic acids, HN—humins; ORG—organic crop production system; CON—conventional crop production system. Mean values with the different letters are significantly different (Tukey test, p ≤ 0.05, n = 24); n—number of samples.
Table 6. Pearson’s correlation coefficients obtained between selected soil properties under crop production systems (ORG and CON) and permanent grass (PRG) in 2016–2018.
Related ParameterCorrelation Coefficient
Crop Production SystemsPermanent Grass (PRG)
Organic (ORG)Conventional (CON)
TP0.915 **0.889 *0.984 **
POM0.934 **0.910 **0.942 **
FA0.930 **0.984 **n/a
HA0.919 **0.7979 *n/a
HN0.981 **0.836 *n/a
HS0.983 **0.990 **n/a
HWEC0.962 **0.826 *0.969 **
CWEC0.819 *0.792 *0.878 *
MBC0.969 **0.943 **0.939 **
DH0.964 **0.793 *0.945 **
SOC—soil organic carbon; TP—soil total porosity; POM—particulate organic matter; FA—fulvic acids; HA—humic acids; HN—humins; HWEC—hot water extractable carbon; CWEC—cold water extractable carbon; MBC—microbial biomass carbon; DH—dehydrogenase activity; n/a—not available; * p ≤ 0.05; ** p ≤ 0.01.

