Article

Agronomic Evaluation and Chemical Characterization of Sicilian Salvia sclarea L. Accessions

1
Department of Agricultural, Food and Forest Sciences, Università degli Studi di Palermo, 90128 Palermo, Italy
2
Consorzio di Ricerca per lo Sviluppo di Sistemi Innovativi Agroambientali, 90143 Palermo, Italy
*
Authors to whom correspondence should be addressed.
Agronomy 2020, 10(8), 1114; https://doi.org/10.3390/agronomy10081114
Submission received: 9 June 2020 / Revised: 27 July 2020 / Accepted: 29 July 2020 / Published: 1 August 2020
(This article belongs to the Special Issue Herbaceous Field Crops Cultivation)

Abstract

:
Clary sage (Salvia sclarea L.), known for its aromatic and medicinal properties, belongs to the Lamiaceae family. Although the species grows wild throughout Sicily, knowledge of its production and qualitative properties is limited. The aim of this study was to evaluate the agronomic behavior of the species over two years of testing and to characterize the chemical properties of its wild counterparts in order to identify the most promising accessions for cropping or for use in breeding programs. Tests were carried out during 2008, 2009, and 2010. During the first year, the plot was established. Subsequently, the main parameters for bio-agronomic evaluation were taken in 2009 and 2010. Regarding qualitative characterization, essential oils (EO) were extracted from flowering samples of clary sage. The accessions in the study showed satisfactory adaptation capacity to cropping. The accessions examined belong to the “linalyl acetate” (range 36–43%) chemotype. Test results show good potential for Mediterranean cropping systems, helping to increase the range of medicinal and aromatic species in cultivation.

1. Introduction

Clary sage (Salvia sclarea L.) is a biennial or perennial, heliophilous, and xerophytic herbaceous plant belonging to the Lamiaceae [1] family. It is found in the north of the Mediterranean, central Asia, and some areas of North Africa. It grows throughout Italy, thriving both on dry hilly slopes and on scrubland [2]. In Sicily, it is mostly found growing in mountainous and hilly areas [3].
Clary sage has been highly valued for its aromatics and medicinal properties since ancient times and is one of the most important species for the production of essential oils, together with Salvia officinalis and Salvia lavandulifolia, with an estimated production of between 50 and 100 tons a year [4]. The whole plant is highly aromatic, the inflorescences in particular, and the essential oils possess a fresh, floral fragrance [5]. Sage essential oils are used as an aromatic agent in food products, as an ingredient in liqueurs and tobacco and as a scent component in perfumes and cosmetic formulas [6,7]. It is currently cultivated in Bulgaria, France, Russian and Morocco for essential oils used by the perfume industry [8]. It is also well known in traditional medicine for the treatment of several common ailments. In Turkey, for example, the leaves and flowers are used in infusions for the treatment of sore throats, coughs, gynecological disturbances, ulcers and intestinal cramps [9,10]. Several scientific studies have also demonstrated the antioxidant, neuroprotective, anti-depressive, anti-inflammatory, antifungal, antiviral and antimicrobial [11,12,13,14,15,16,17,18,19,20,21,22] activity of the essential oil of clary sage.
The essential oils of various species from the Lamiaceae family demonstrate a certain degree of chemical variability due to a range of factors [23,24,25,26,27,28]. Regarding the chemical composition of clary sage, various authors note that in most cases, the principal volatile compounds are terpenoids [29,30], among which linalyl acetate and linalool. These components are central to good quality oil for use as an aromatizing agent [6,12,14,31]. Another principal component of clary sageis sclareol. Sclareol is used as a base for the chemical synthesis of Ambrox, a central component in perfume production and an alternative to the more naturally obtained ambergris [32,33]. Linalool, linalyl acetate, and sclareol are the essential oil components predominant in the flowers, while germacrene D, bicyclogermacrene, beta-caryophyllene and spathulenol are most abundant in the leaves [34,35]. The species grows in the wild in Sicily (Italy); however, little is known of its production and qualitative properties.
The agronomic characteristics of clary sage found in scientific literature relate to locations with different environmental conditions compared to those of Italy. Studies have been carried out in Brazil, with Mossi [36] reporting data on biomass production, plant size and leaf size, on the color and characteristics of the inflorescences, and on essential oil production. Other studies, which highlight the variability found in biomass and essential oil production, were carried out in various sites throughout Spain over medium to long test periods, and in India [37,38]. In Italy, however, very little research data is available on the agronomic characteristics of germplasm of this species.
The aim of the study was to evaluate the agronomic behavior of clary sage over two years of tests and to characterize the chemical properties of its wild counterparts to determine the most promising accessions for cropping in the Mediterranean or to use in breeding programs.

2. Materials and Methods

2.1. Site of Experiments and Treatments

The 3-year study (2008, 2009 and 2010) was carried out at the Orleans Experimental Station, University of Palermo (Italy) (38°06′26.2″ N, 13°20′56.0″ E, 31 m a.s.l.). The plot was established during the first year following sowing and measurements of the main parameters for bio-agronomic evaluation were taken in 2009 and 2010. Soils in the test area were sandy clay loam (Aric Regosol, 54% sand, 23% clay, 21% silt) with a pH of 7.6, 14 g kg−1 organic matter, 3.70% active carbonates, 1.32% total nitrogen, 18.1 ppm available phosphorus and 320 ppm exchangeable potassium. The climate in the area is Mediterranean with mild, humid winters and hot, dry summers. Seeds from local accessions of clary sage from the island were sown in March 2008. The plants of these populations were characterized taxonomically using analytical keys and compared to exsiccatae stored at the Botanical Gardens of the University of Palermo. In total, 9 accessions of clary sage were used, gathered from 3 sites in Sicily located in the Province of Agrigento (AG), Palermo (PA) and Messina (ME) (Figure 1).
Three accessions per province were identified using an initial followed by a numerical code. The initials SS indicate accessions from Agrigento, PR from Palermo and AF from Messina (Table 1).
Seeds from each of the accessions were placed in 84-hole seed trays and set in a cold frame. Following emergence 10 days after sowing, the seedlings were transferred to 10 cm pots. During the second 10-days of May, the plantlings were planted in the open field. Each plot measured 30 m2 (5 m × 6 m). The test plot was created using a density of 20,000 plants per hectare and a randomized plot design with 3 replications (Figure 2). This plant density was chosen to evaluate better the growth of each plant, limiting the competition levels for the main environmental factors between the plants. Tests were carried out in dry conditions, this being a traditional practice used for cultivation of aromatic and medicinal plants in the Mediterranean region. Agronomic management included, however, 2 supplementary irrigation events applied during the summer months, immediately after planting, to foster establishment, and manual weed control. During the test, no additional chemical fertilization applications were given. Tests were carried out under organic farming conditions; the residual mineral soil fertility of the previous crop was, then, exploited to allow the plants to grow. The previous crop was Hedysarum coronarium L., a perennial legume. Finally, no pathologies or insects were observed.

2.2. Plant Measurements

Biometric and production observations were made in 2009 and 2010 on a sample plot of 10 plants, excluding the border rows. Harvesting of accessions was carried out during the second 10-day period of May for both years. The samples were gathered (through reaping of the whole area), when 70% of the plants were in full flowering stage. The following parameters were recorded during harvesting: plant height (cm), plant fresh weight (g), plant dry weight (g), number of branches (no.), number of stems (no.), floral spike length (cm), inflorescence dry weight (g), leaf dry weight (g) and stem dry weight (g). Inflorescence, leaf and stem ratios (as a percentage of the total dry weight of the plant) were also measured. Dry matter weight was calculated when constant sample weight was reached (dried in a shaded and well aerated environment at a temperature of approx. 30 °C). Inflorescence yields (d.m.) per hectare (Mg ha−1) were also estimated.

2.3. Essential Oil Extraction and Oil Yield Calculation

On a sample of 500 g of dried inflorescences, the total essential oil content was determined, expressed as a % v/w (oil volume/sample weight in g) and extracted using steam distillation. Oil yields were calculated by multiplying inflorescence yields by oil content and 0.90 (approximate specific gravity of oil) [8]. Clary sage inflorescences were then divided into inflorescences from the main stem (ISP) and inflorescences from the secondary stem (ISS) to evaluate both the content and composition of the essential oils. The length of the ISP spike and the ISS spike was also measured.

2.4. GC- and GC/MS Analyses of Essential Oils

Gas chromatographic (GC) analyses were run on a Shimadzu gas chromatograph, Model 17-A (Shimadzu Corporation, Duisburg, Germany) equipped with a flame ionization detector (FID) and operating software Class VP Chromatography Date System version 4.3 (Shimadzu). Analytical conditions: SPB-5 capillary column(15 m × 0.10 mm × 0.15 μm), helium as carrier gas (1 mL/min). Injection in split mode (1:200), injected volume 1 ll (4% essential oil/CH2Cl2 v/v), injector and detector temp. 250–280 °C, resp. Linear velocity in column 19 cm/s. The oven temperature was held at 60 °C for 1 min, then programmed from 60 to 280 °C at 10 °C min−1, then 280 °C for 1 min. Percentages of compounds were determined from their peak areas in the GC/FID profiles.
Gas-chromatography-mass spectrometry (GC/MS) was carried out in the fast mode on a Shimadzu GC/MS mod. GCMS-QP5050A, with the same column and the same operative conditions used for analytical GC/FID, operating software GC/MS solution version 1.02 (Shimadzu). Ionization voltage 70 eV, electron multiplier 900 V, ion source temp. 180 °C. Mass spectra data were acquired in the scan mode in m/z range 40–400. The same oil solutions (1 ll) were injected with the split mode (1:96).

2.5. Identification of Components of Essential Oils

The identity of components was based on GC retention index (relative to C9–C22 n-alkanes on the SPB-5 column), computer matching of spectral MS data with those from NIST MS libraries, [39] comparison of the fragmentation patterns with those reported in the literature [40] and, where possible, co-injections with authentic samples.

2.6. Statistical Analyses

Data of all biometric and production parameters were processed using analysis of variance. The difference between means was carried out using the Tukey test. In addition, a correlation matrix was determined for the main parameters recorded for each year, based on standardization of data. To carry out an overall analysis of the structure of agronomic variability and to determine the weight of each parameter on the total variance [41], principle component analysis (PCA) and cluster analysis (UPGMA) were carried out by grouping data from the two years. This latter analysis is shown graphically on the principal components plot (PC1 and PC2), where test accessions were projected according to test year using factor scores. The software “Past” V. 3.16 for Windows was used for data analysis [42].

3. Results

3.1. Analyses of Rainfall and Temperature Trends in the Test Site

Rainfall and temperature trends during 2008, 2009, and 2010 are shown in Figure 3. Rainfall levels during the three test years were quite unalike. In 2008, the year when the plot was established, there was a marked lack of rainfall (365 mm), although minimum and maximum temperatures were consistent with the test environment. In 2009, rainfall levels were high with over 1200 mm for the year. Rainfall events were concentrated above all between January and May and between September and December, with an absence of rainfall between June and August. In 2010, although with the same rainfall distribution was the same, rainfall levels were lower, at an annual level of 700 mm, typical of the test environment. Average minimum temperatures (2009: 14.10 °C–2010: 14.70 °C) and average maximum temperatures (2009: 23.40 °C–2010: 23.00 °C) were not found to be different from average temperatures for the area during the test period.

3.2. Analyses of Biometric and Production Parameters in the Study

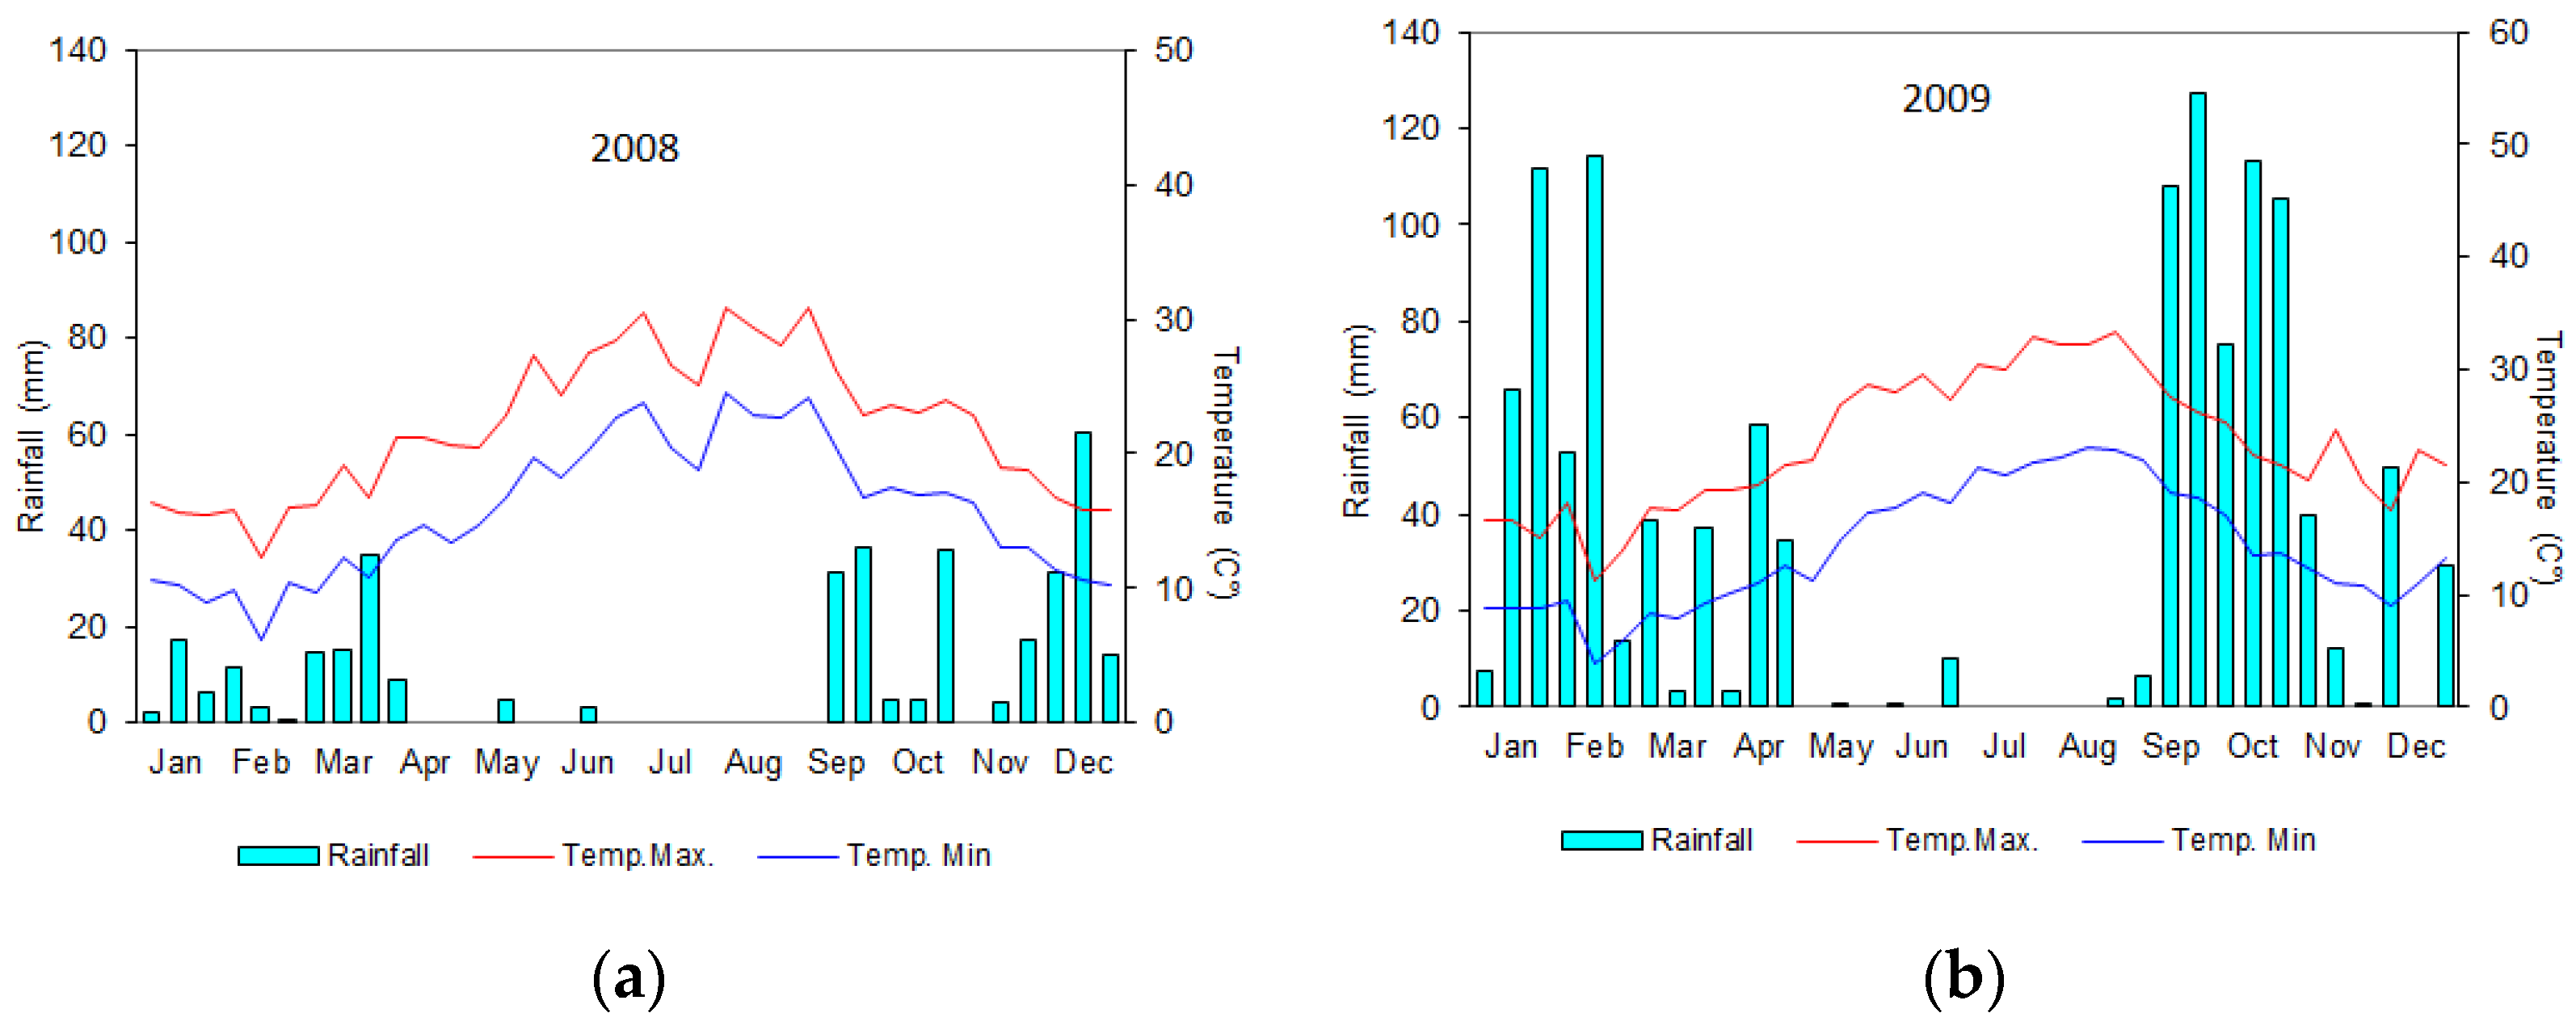
The factors “year” and “accession” and the year-by-accession interaction determined highly significant differences for all the parameters in the study. The differences found on the tested parameters over the years (Table 2) highlight the influence of the environmental factors on the biometric and productive characteristics.
It is also worth noting variations in the percentage ratio of inflorescences, leaves, and stems for the two years under consideration (Table 3). The table shows that in the drier year (2010), inflorescence incidence was 8 percentage points higher than the year with greater rainfall. In contrast, leaf incidence and stem incidence were 3 and 5 percentage points higher, respectively, in the rainier year than in 2010.
Average plant height (Table 2) was found to be below 150 cm in both years. Branch number, stem number per plant, and ISS floral spike length were higher in the less rainy year. Floral spike yields were higher in 2009 (2.84 Mg ha−1) than in 2010 (1.60 Mg ha−1) with a difference of 1.24 Mg ha−1. Essential oil content in percentage terms was slightly higher in 2010, while in terms of EO yield, it was found to be 9.10 kg ha−1 higher in 2009 (23.51 kg ha−1) (Table 4).
Relative to the 2 types of floral spike (ISP and ISS), average ISS spike lengths ranged between 46.41 cm in 2009 and 50.76 cm in 2010, while ISP spike lengths were found to be around 58 cm in both years Furthermore, they showed significant differences over the two years, highlighting a greater oil percentage content in 2010 (Table 5).
Between the accessions (Table 6), SS4 (3.21 Mg ha−1), SS7 (2.60 Mg ha−1), SS9 (2.52 Mg ha−1) and AF2 (2.53 Mg ha−1) were of high interest regarding to the floral spike yield. These accessions also recorded the higher values of the number of stems, number of branches, and ISS spike length. PR5 (1.52 Mg ha−1) and AF8 (1.63 Mg ha−1) were, instead, the less productive accessions. The highest oil percentage values were obtained by AF8 (1.36%), AF3 (1.28%) and AF2 (1.25%), while the lowest values of oil percentage were found in the SS accessions and, in particular, in SS7 (0.65%). The higher oil yield values were recorded by AF2 (28.05 Mg ha−1) and AF3 (25.10 Mg ha−1) with respect to other accessions. AF8 had the highest oil percentage value in the ISS (1.68%), while PR4 obtained the highest oil percentage value in the ISP (1.12%).
Considering the results of accessions in the study, during the years 2009 and 2010 (
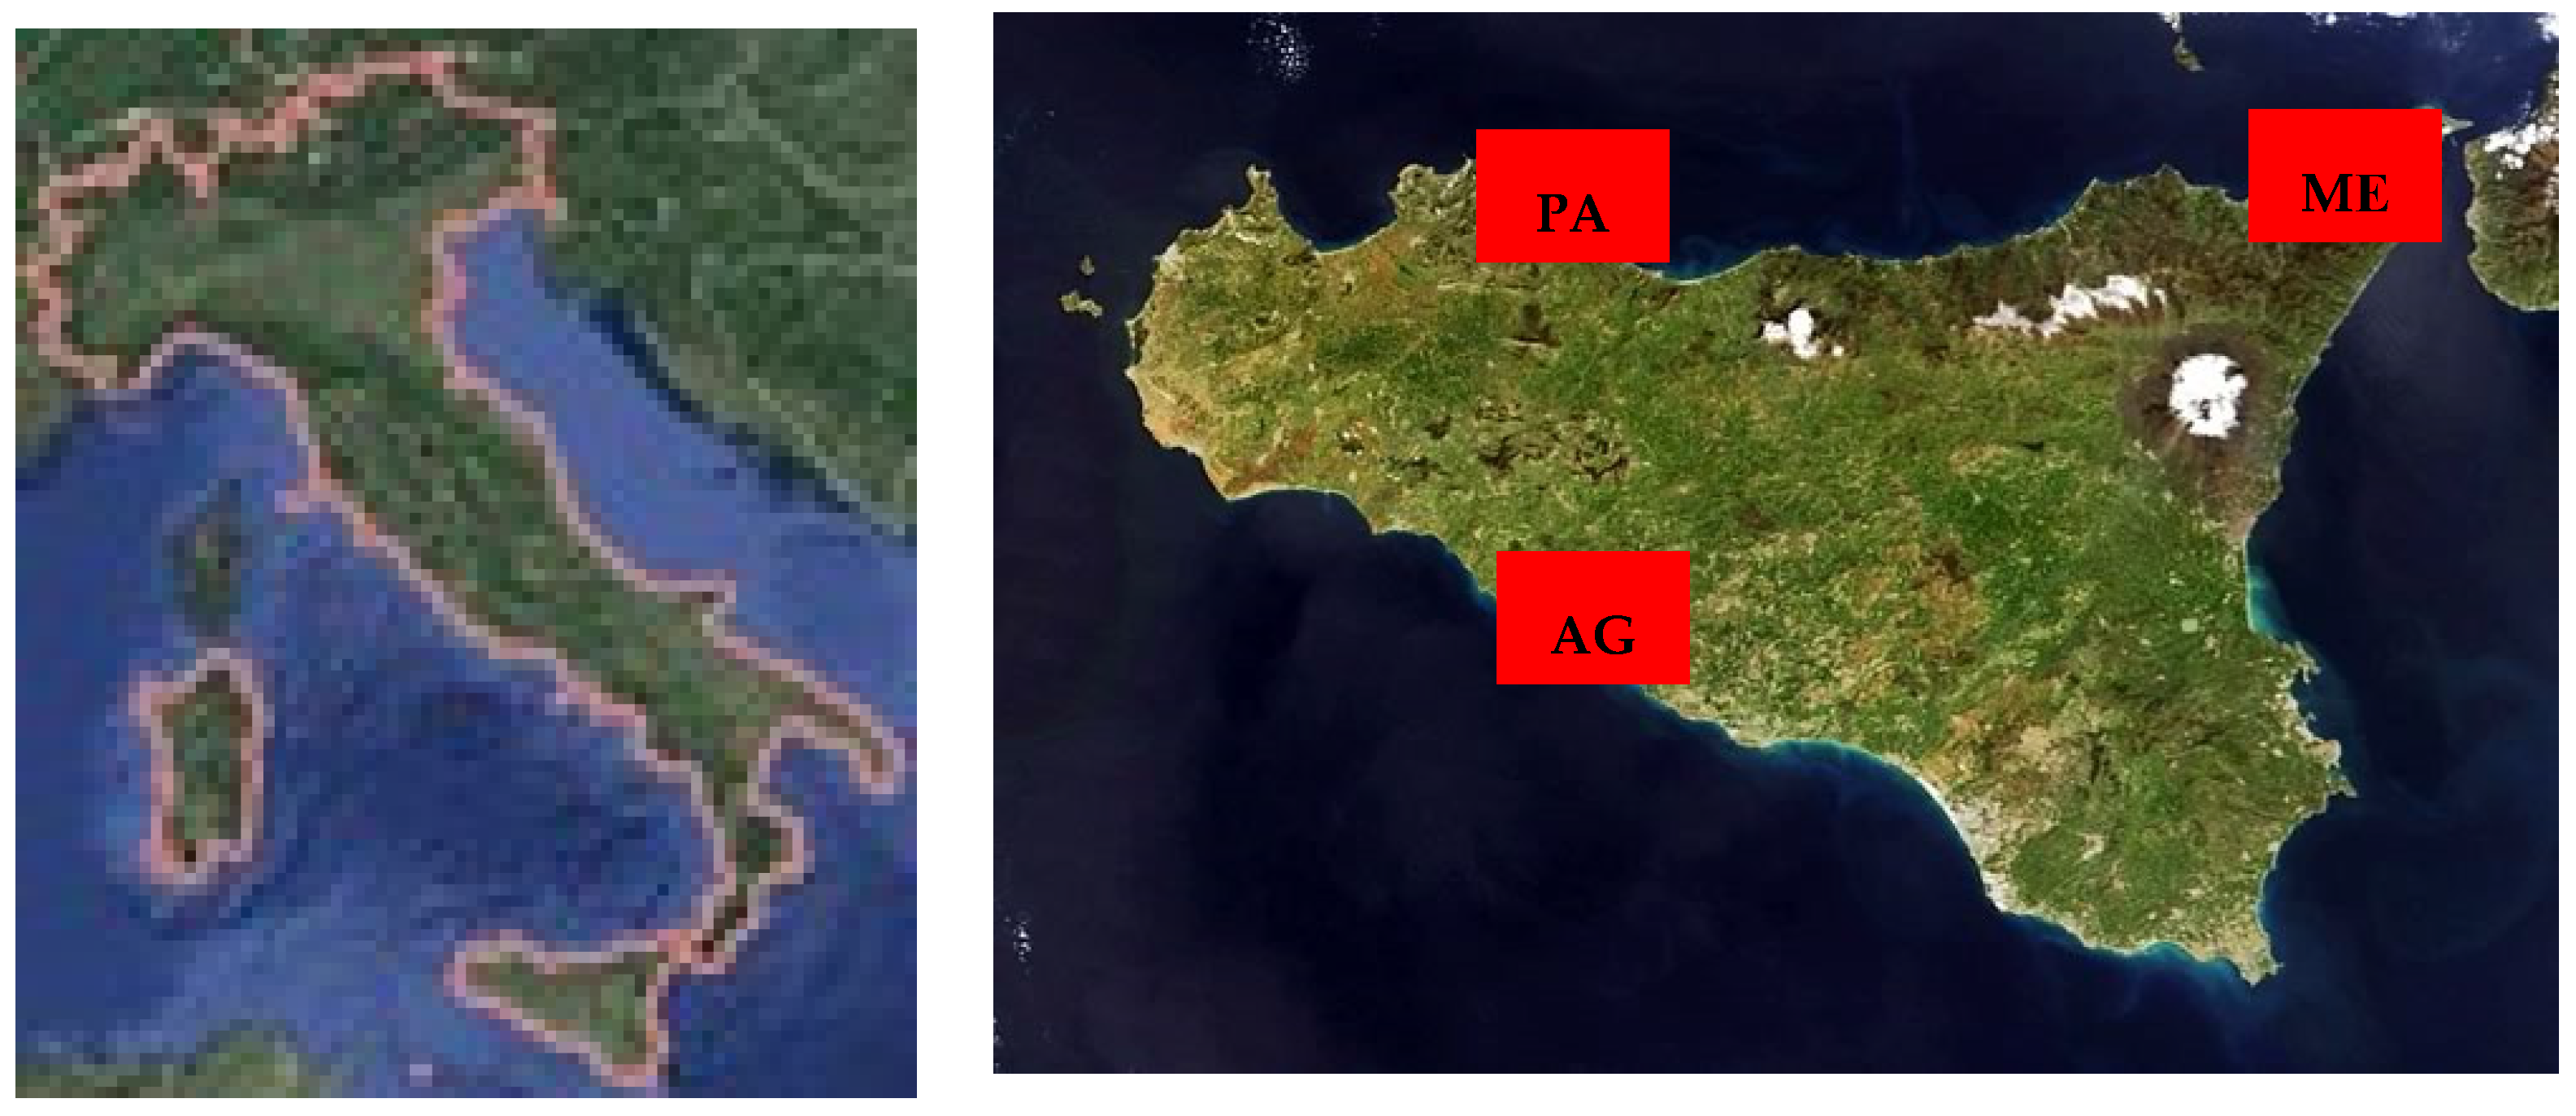
Table 7a,b), the best production results for 2009 were found in the Agrigento accessions (SS), followed by those of Messina (AF).
The best accessions, as regards inflorescence yields, were found to be SS4 and SS7 with 4.81 and 4.20 Mg ha−1, respectively. Worthy of note among the Messina accessions was AF2 which, compared to other accessions from the same area, produced higher yields of 3.41 Mg ha−1. This value was the minimum yield obtained by the Agrigento accession SS9 and above the average for the field (2.84 Mg ha−1). Regarding the Palermo (PR) accessions, with the exception of PR4 with a yield of 2.43 Mg ha−1, the remaining accessions produced inflorescence yields of approx. 1.50 Mg ha−1, thus appearing the least productive of the accessions.
The greatest plant height was obtained by SS4 (151.50 cm), higher than all the others in that year. This was followed by PR4 (142.00 cm) and SS9 (141.52 cm), while the shortest plant size was that of PR5 and AF3 at a height of below 130 cm. Relating to the fresh and dry weight of the plants, it is worth noting that all of the Palermo accessions (PR) were found to be well below the average for the field (2.84 Mg ha−1), together with AF8 from Messina, albeit to a far lesser extent. The number of branches, number of stems and secondary floral spike length were found to be higher in the SS and AF accessions, in particular in the more productive accessions. SS4 (12.01) and SS7 (12.51) were of interest regarding the number of branches, AF2 (4.52) regarding the number of stems and, concerning the secondary floral spike length (ISS), accession SS4 (60.06) was worthy of note. Average floral spike length together with that of the ISP was greater in the SS and PR accessions, with PR4 obtaining the greatest values.
The highest percentage content in oil was found in the AF accessions followed by those from Palermo and the lowest content was found in the SS accessions SS. In terms of oil yields, however, the most productive were the Messina accessions (AF2 38.41 kg ha−1), followed by the Agrigento accessions.
In the second year, there was a fall in production which altered the ranking of the accessions based on results in the study. More specifically, in 2010, similar to the first year, the Messina accessions were ranked as the most productive. The Palermo accessions, in contrast to the previous year, were also ranked at the top of the list. The above-mentioned areas of provenance were found to perform better than the Agrigento accessions not only in terms of average inflorescence yields but of all the other parameters examined. However, if we look at the Agrigento data more closely, regarding inflorescence yields, we can see that two of the three accessions, SS4 and SS9, produced values equal to the average for the field (1.60 Mg ha−1), only SS7 producing far lower yields (1.00 Mg ha−1). The AF accessions were ranked second. Of the three accessions, AF2 (1.61 Mg ha−1) and AF3 (1.83 Mg ha−1) produced inflorescence yields which were respectively equal or slightly higher than the average for the fields, while AF8 (1.41 Mg ha−1) was a little lower. Accession PR1 bolstered the results for the PR accessions with inflorescence yields of 2.81 Mg ha−1; 1.20 Mg ha−1 higher than the average for the field. In contrast, the other Palermo accession, PR4 and PR5 produced yields slightly below the average for the field.
Once again, PR1 obtained the highest plant fresh weight (1346.88 g) and dry weight (318.72 g), in addition to the highest inflorescence dry weight (139.64 g) and leaf dry weight (80.56 g). The greatest plant size was also obtained by PR1 (159.75 cm), statistically different from all the other plants. PR1 was followed by AF3 (152 cm) and AF2 (150.5 cm), while AF8 produced the smallest size plant (129.75 cm). In 2010, the greatest number of branches, number of stems, and floral spike lengths were obtained from the most productive accessions in the various areas. Regarding the number of branches, AF8 (19.75), AF3 (18.77) and SS9 (19.55) were worthy of note, as was AF2 (7.52) concerning the number of stems. The greatest main floral spike (ISP) and secondary spike (ISS) lengths were obtained from the Palermo accession PR1 at 72.75 cm and 57.40 cm, respectively. Concerning the percentage content of oil, in the second year, a general increase in production was evident in all of the accessions belonging to the Messina group and the Agrigento group, whereas a slight decrease was recorded in the remaining accessions; the ranking list remained unchanged, however, compared to the previous year.
In addition to the AF accessions, having a range between 1.23% (AF2) and 1.42% (AF8), other productive accessions were PR4 (1.10%), PR5 (0.99%) and SS4 (0.83%). In terms of oil yield, however, the most productive accessions were those belonging to the Messina group (17.70–21.10 kg ha−1) followed by PR1 (17.10 kg ha−1). The lowest values were, instead, achieved by SS7 (6.80 kg ha−1). Furthermore, values slightly higher than 10 kg ha−1 were found in other accessions.
Of interest here are average EO yields of the Agrigento accessions. EO yields in 2009 were 22.20 kg ha−1, decreasing to approx. 10.00 kg ha−1 the following year. This year witnessed a general fall in accession production. The Palermo accessions, however, maintained average EO yields of approx. 14.00 kg ha−1 during both years, due to the production performance of PR4 in 2009 and PR1 in 2010. The above-mentioned variations, as is generally known, can be attributed to several factors, including environmental and genetic differences.

3.3. Correlation Matrix

Correlation analysis (Table 8) for both years showed a positive and highly significant correlation between floral spike yields and parameters linked to vigor and plant development, such as height, fresh weight and dry weight of the plant and components (inflorescences, leaves, and stems). In addition to these clear relationships, however, several rather different relationships were observed over the two years which are worthy of note.
In 2009, spike yield was positively affected by ISS spike length (r = 0.80) and branch number (r = 0.84). Furthermore, branch number was positively correlated with most of the parameters in the study (some with statistical significance). In 2010, however, branch number was inversely correlated, although not markedly, with all biometric and production parameters (except for EO%). In the same year, a positive correlation was found between floral spike yield and ISP spike length (r = 0.85), floral spike length (r = 0.88) and ISS spike length (r = 0.52).

3.4. PCA Analysis

PCA analysis was carried out to provide an overall assessment of the accessions over the 2 years and showed that the 2 biggest principal components accounted for 71.00% of total variability, rising to over 86.00% with the 3rd component (Table 9). For analytical purposes, however, only the first two were considered of interest.
In 
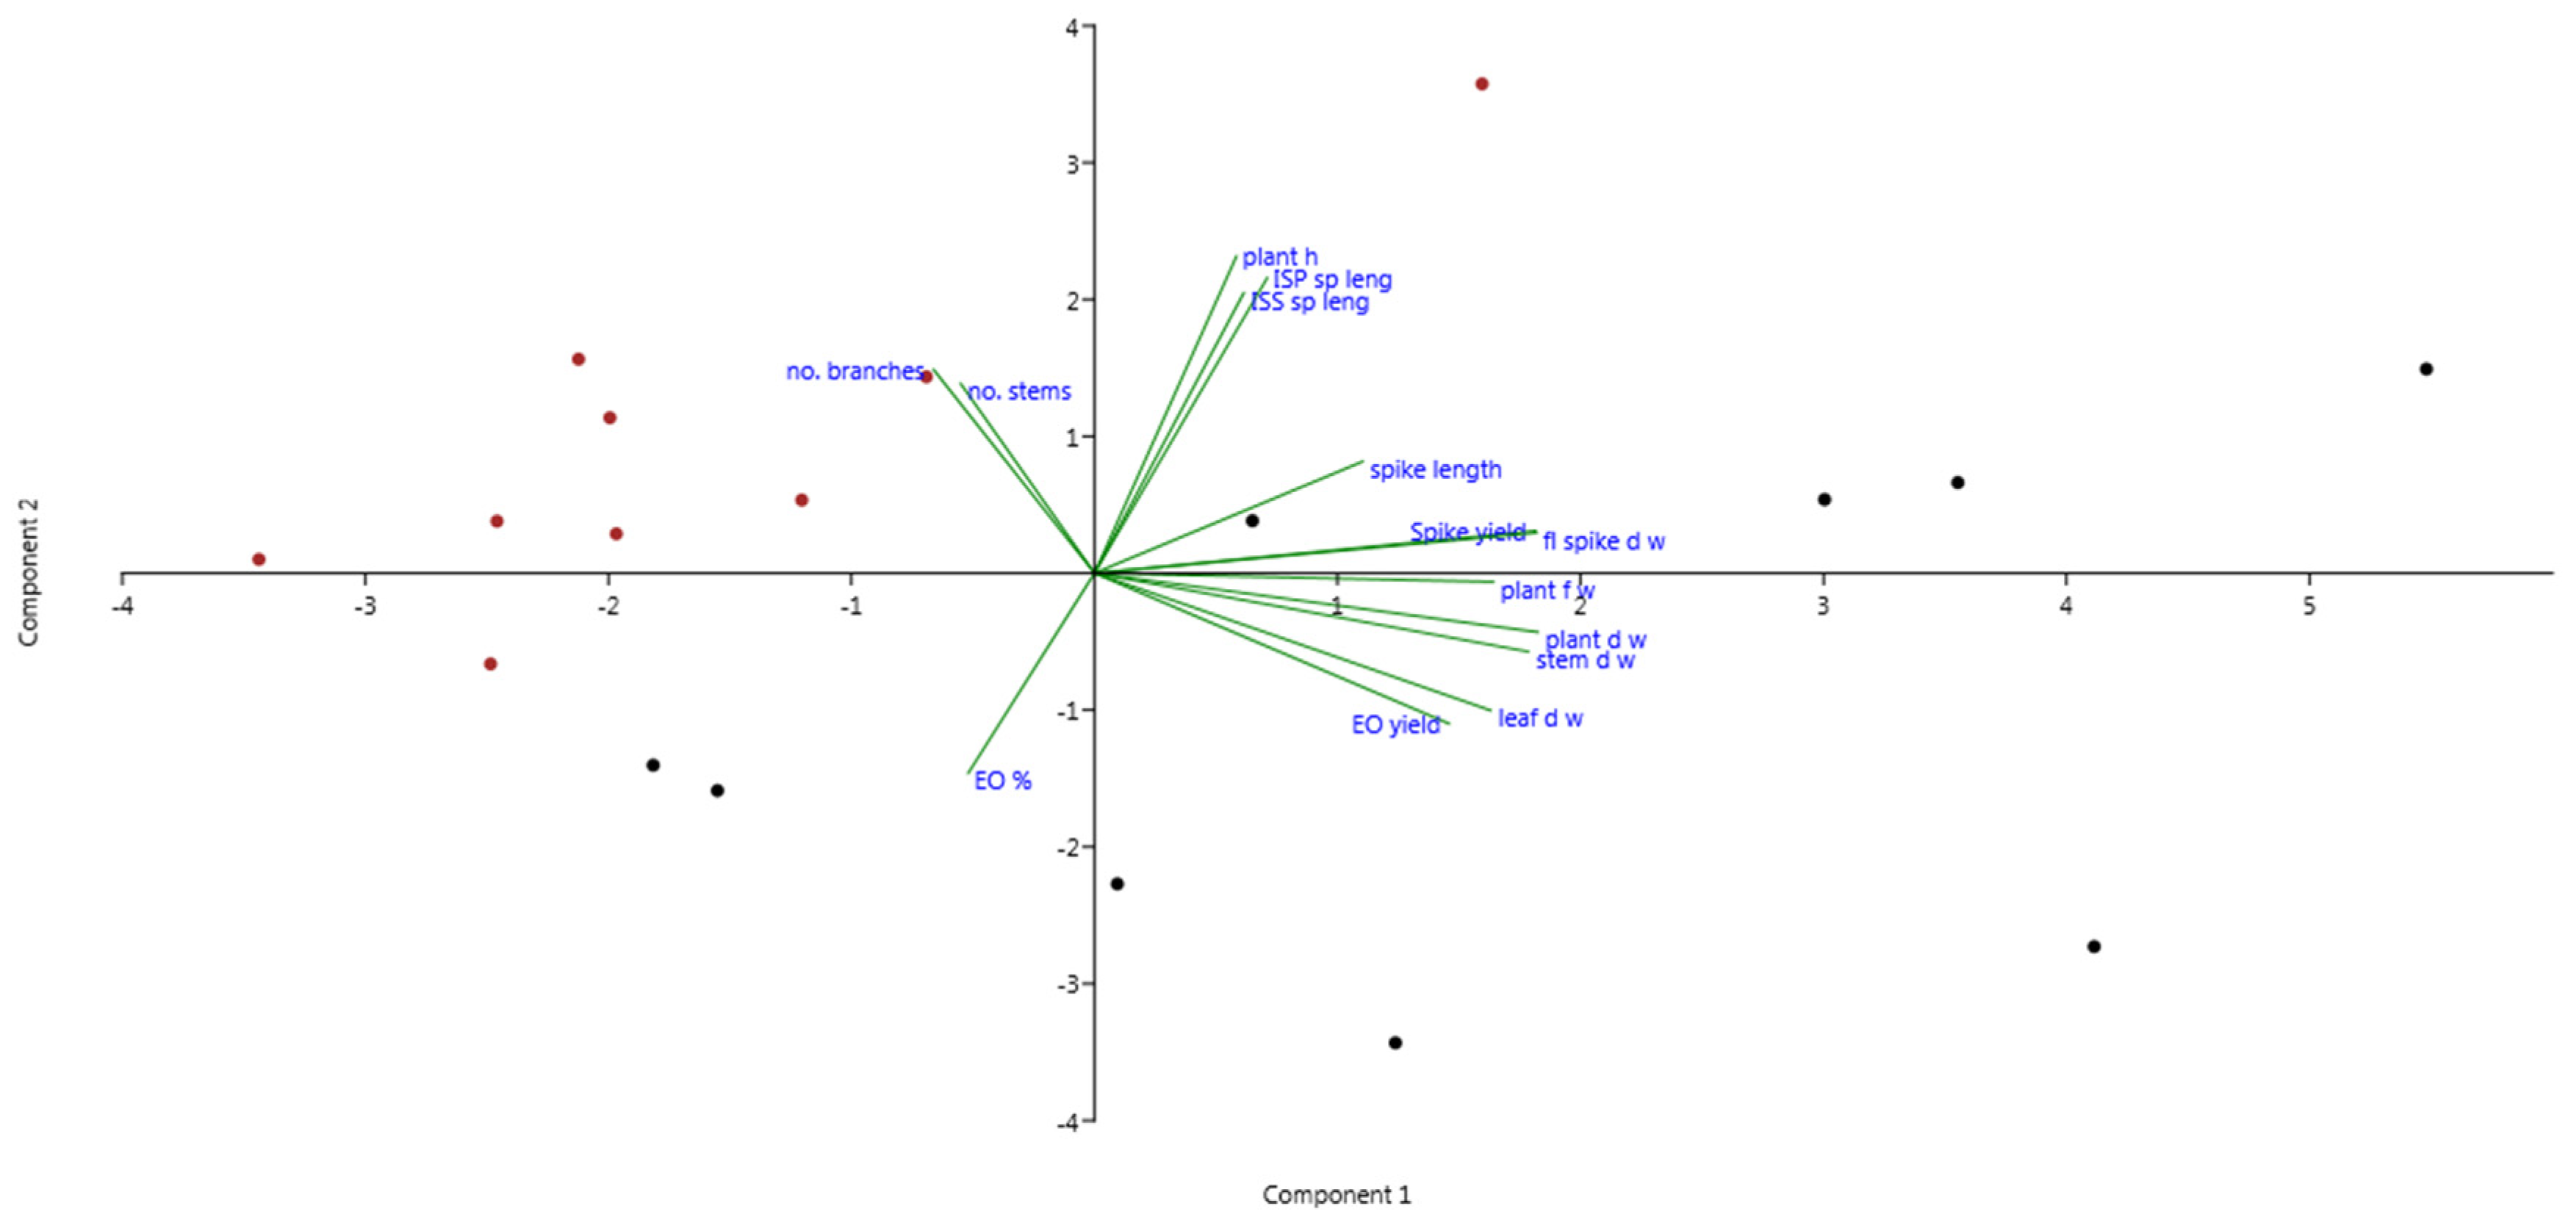
Table 10, it is clear that the biggest principal component (PC1), accounting for 49.20%, was strongly and directly correlated with as many as 7 characteristics out of the 14. In particular, it is associated with floral spike yield, essential oil yield, fresh and dry weight of the plant, and the dry weight of the inflorescences, leaves, and stems.
The second component, accounting for 22.00% of total variation, is strongly linked to the biometric characteristics, such as plant size, main floral spike length (ISP) and secondary floral spike length (ISS). Less marked, however, was the correlation found with two other biometric properties: branch no. and stem no., and inversely correlated, with the same intensity, with % content of EO. Figure 4 shows a loading plot of the factor weights pertaining to the main two principal components.
From 
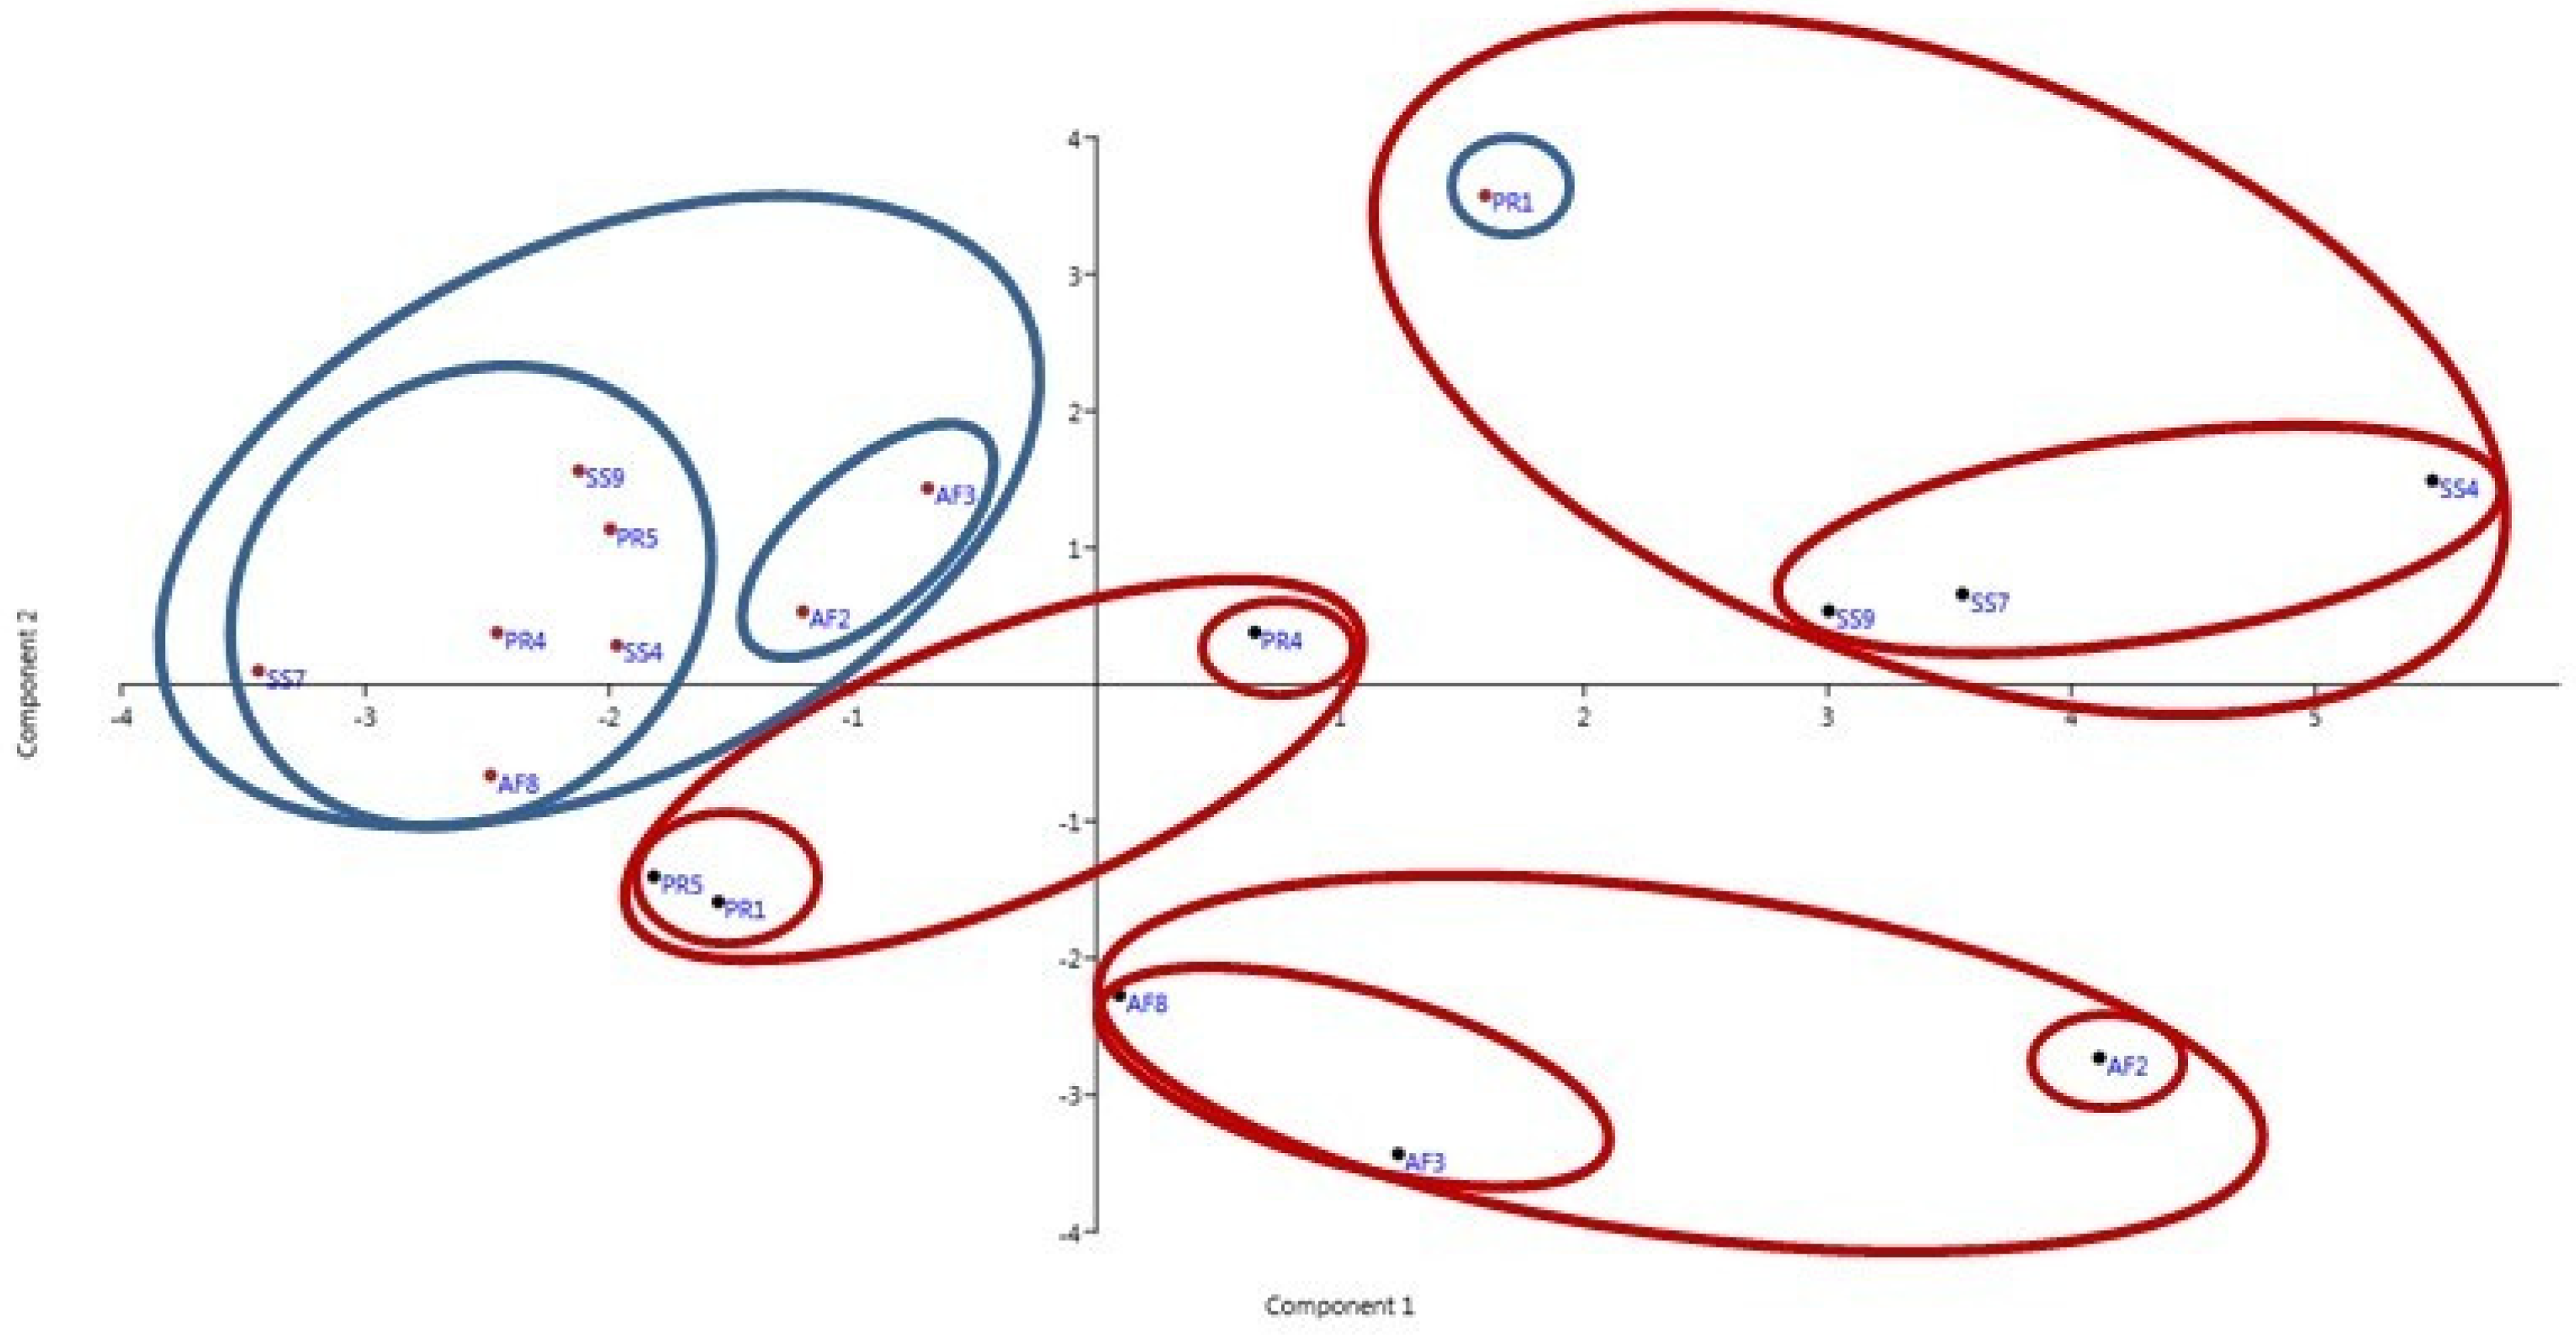
Figure 5, which projects the distribution and clustering of the accessions on the plot for the two principal components, statistical data can be extracted.
In general, allocation of the accessions led to the identification of 2 clusters which corresponded to the two years. To the right of the origin are the accessions grown during the first year and to the left those grown during the second year. Hence, variations along PC1 can represent environmental variability during the two test years. Characteristics linked to this variability are those which are most affected by the factor “year”. However, several heterogeneities emerge which can be attributed to the Palermo accessions. More specifically, PR1 from 2010, allocated in the upper right quadrant, and PR1 and PR5 from 2009, in the lower left quadrant, diverge from this trend. Cluster analysis carried out led to the creation of 4 main groups: 3 for the first year and 1 for the second year. Relative to the first year (2009), each of the 3 main groups was formed by accessions from the same area of provenance. The exception to this concerned the Agrigento accessions, which also included the Palermo accession PR1 from 2010. These Agrigento accessions, however, when associated with the various production parameters, formed a subgroup which is in the upper right quadrant. This is an area which corresponds to high values for the first principal component; accession SS4 being of particular note. PR4, belonging to the other main group from the first year, is located in the same quadrant, though slightly more to the left. PR4, in contrast to other accessions from the same area (PR1 and PR5) managed to ensure a positive production outcome, although in a somewhat more contained manner. PR1 and PR5 formed a subgroup in the lower left quadrant in an area with negative values from both PC2 and PC1. The remaining group from this year, the Messina accessions (AF), are all located in the lower right quadrant, thus possessing negative values from the second principal component. As this is strongly correlated with plant height, ISP lengths and ISS length directly, and moderately correlated with percentage content of EO inversely, these accessions are small in size with a short floral spike but have a high % content of EO. Accession AF3 and, in particular, AF8 (lying near the axis of the second principal component) are more defined by PC2 compared to AF2. This latter is separate from the first two, forming a separate subgroup. In 2010, cluster analysis highlighted one main group with 2 subgroups: 1 of which containing 70.00% of the accessions and the other subgroup containing only AF3 and AF2. These latter were located to the left of the origin, and, therefore, with negative PC1 values. In general, relating to 2010, a more uniform distribution is apparent from the new positions occupied by the accessions, except for PR1. The position of this latter, as previously mentioned, is peculiar, given its position in a cluster located in the upper right quadrant and, thus, far from the main distribution for that year. For most of the accessions, small variations in position concern those along the PC1 axis, except for SS7. This accession was most affected, in production terms, by the environment. However, greater variations were found along the PC2 axis; in particular, in the area with high values concerning morphological characteristics. Several accessions, although occupying similar positions along the PC1 axis, obtained different yields and were mainly defined by those parameters directly linked to PC2. This was also true of accession AF8. Although it located in the lower left quadrant (the only accession in the subgroup located below PC1), it was the one with a greater percentage content in EO, as this parameter was inversely correlated with PC2. Nearer to the origin but positioned in the upper left quadrant, are AF2 and AF3. In this subgroup, AF3, which lies above AF2 along the PC2 axis, obtained production values which were even higher than the average for the field.

3.5. Essential Oil Composition

GC-MS analysis of the essential oil from the clary sage accessions, grouped by area of provenance, led to the identification of 76 chemical compounds, representing 98.00% of the chemical profile (Table 11).
The most abundant class was that of oxygenated monoterpenes (67–79.00%), followed by sesquiterpenes at levels above 10.00%. Monoterpenes, hydrocarbons, and diterpenes remained below 10.00%. The compounds linalyl acetate and linalool, in a ratio of 2:1, accounted for approx. 60.00% of the total, with α-terpineol as the third most abundant component (Table 12). This pattern was found to be common to all the samples tested, including those on the SP and the SS floral spike, and was also reflected in the profile of the minor components. The chemical composition of the two types of inflorescence did not show intraspecific chemical differences, and the content of the principal components was highly uniform. The accessions in the study are of chemotype “linalyl acetate” (range 36.00–43.00%).

4. Discussion

For cropping systems wishing to increase levels of diversification while ensuring low input, wild species, including many medicinal and aromatic plants, are considered to be a strategic choice due to their rusticity, adaptability, and sustainability, often expression of the combination of environment and ecotype. However, compared to the great number of aromatic plants known to us, few are cultivated [43]. To domesticate and ensure diffusion of wild species, it is necessary to understand how they behave during cultivation, both in agronomic terms and in terms of quality [44]. As noted by Mossi et al. [36]; there is a lack of information on clary sage regarding biometric and agronomic aspects, in contrast to studies on other species of the genus Salvia, such as S. officinalis and Salvia triloba.
All the accessions grew in a regular although controlled manner, maintaining rosette stage. During new growth stage, plant stems developed and flowering stage was reached the following year, confirmation of their biennial habitus, as noted by other authors [6]. Averages obtained for the field during the two years of tests showed far higher values in 2009 than in 2010 for the biometric and production parameters being examined. Environmental factors undoubtedly played a key role in the different production results. More specifically, the heterogeneous rainfall levels throughout the test period were considered highly influential, with 2009 experiencing exceptionally high rainfall levels and 2010 much lower and consistent with the test environment.
Considering fresh biomass inflorescence yields, results obtained in this test (regarding both productive and less productive accessions) were consistent with those reported by Yessen et al. [8,37] in tests carried out in India in a subtropical environment. Dry biomass yields, however, appeared to be slightly lower than those reported in tests carried out in Brazil by Mossi et al. [36]. It is worth noting that estimates of this parameter were made using a greater plant density per hectare compared to this study, while production results per plant were similar. Considering the three classifications (low, medium and high) determined by Yessen et al., [37] based on plant height, we can classify all of the Sicilian accessions in the study as medium-sized (100–150 cm). This contrasts with other studies carried out in Brazil, Spain, and Sicily, where plants of almost 1 m can be classified as small [6,36,38,45]. As regards no. of branches (9.17), fresh plant biomass production (1098 g) and dry plant biomass production (361 g), results for 2009 were consistent with those found in Mossi et al. [36]. Results from 2010, albeit lower than the previous year, were, in some cases, far higher, than those obtained by other researchers in Mediterranean environments. In the Aragona region in Spain, for example, Alquezar [38] obtained a plant fresh weight in the first year of 201 g and 830 g in the second year. This latter was similar to the weight obtained by us in the drier year. Once again in Sicily, Carrubba et al. [6], in highly arid conditions, obtained very low values for plant dry weight (75.80 g), except for number of branches (23 branches). In agreement with this, it is worth noting that in our study, as regards number of branches, this parameter was higher in the year with lower rainfall, with nearly a two-fold increase compared to the previous year (16 branches).
In addition to the above-mentioned agro-morphological parameters, the biometric and production characteristics of the floral spike are of particular interest in the scientific literature [37] on medicinal and aromatic plants. These characteristics are considered to be a reliable factor when selecting species with a high EO content.
Furthermore, in this study, we considered it important to analyze the floral spike by distinguishing between the main stem floral spike (ISP) and the floral spike of the secondary stem (ISS), an aspect not discussed in the literature. Of interest is the fact that spike length was longer in the drier year and EO was slightly higher in ISS compared to ISP. This would suggest the importance of bearing this peculiar characteristic in mind in the selection of accessions for production purposes, above all in Mediterranean areas. In the two years of tests, average ISP spike length did not vary and was relatively high. The great variability found, above all in some of the accessions, in production and biometric parameters was revealed by analysis of the principal components, with production parameters accounting for approx. 49.00% and biometric parameters 22.00% of the total variation.
Oil percentage content in this study, over the two years, was reasonably high in all the accessions (0.58–1.8%). Values for this parameter found in the literature are mostly much lower. Research carried out in various regions in the north of Iran (0.31–0.65%) and in Leskovac, Serbia (0.78–0.83%) [31,46] reported similar results to some of the values in this study. In this study, the accessions from Messina obtained satisfactory results not only for the above-mentioned parameter, but also for EO yields per hectare, as these accessions were also among the most productive accessions. In fact, the 3 Messina accessions produced, on average, an EO yield of 19.00 kg ha−1 in 2010, consistent with Mossi et al. [36]. In 2009, however, despite a lower percentage content of EO, the same accessions produced 29.50 kg ha−1 of EO, as the yield was obviously connected to spike yield. The above-mentioned variations, as is generally known, can be attributed to several factors, among which the various environmental and genetic differences.
As regards the chemical composition, there are various chemotypes known for clary sage. In this study, it is clear from the chemical analyses of the essential oils extracted from the inflorescences that the accessions were chemotypes rich in linalyl acetate and linalool. This agrees with results from other authors [1,6,14,34,37]. The chemical composition of the two inflorescence types, ISP and ISS, from the three areas (an average of the 3 accessions from each area of provenance) did not show differences, presenting a highly uniform content of principal components. Nevertheless, further research is needed to increase knowledge of this, especially in relation to the geographic origin.
Furthermore, regarding the biometric characteristics, PCA also revealed distinctive features which enabled a series of clustering. This clustering highlighted, in general, the effects of the different years and the subdivision of the accessions, mainly based on ISP and ISS spike length. In 2009, abundant rainfall led to improved biometric results and yields, allowing us to identify accessions with a tendency towards medium high production levels. Furthermore, within the macro-groups, we were able to identify subgroups linked to the area of provenance. The lower rainfall levels in 2010, although consistent with the test environment, not only limited the biometric and production characteristics, but also annulled the link to provenance, which, however, was evident in the first year. In this year, accessions were found to be less evenly distributed along the PC axes compared to 2010 (mostly concentrated along the PC2 axis). The accessions which maintained or exceeded averages for the field were those accessions which modified their production parameters regarding the second principal component, clearly actuating an adaptation strategy triggered by adverse environmental conditions. Of the accessions, PR1 is worthy of note while SS7 showed poor results, despite being one of the best performers in the more favorable year.

5. Conclusions

Results obtained in this study represent a valid contribution to the acquisition of knowledge of the adaptability and production potential of a medicinal and aromatic species of interest to industry in the Mediterranean area. The production levels obtained are interesting and promising, even though variable over the two years. Most of the clary sage wild accessions showed a satisfactory production response, reaching higher or around averages for the field in the two years. In general, the rainy year led to more vigorous plants with a higher percentage incidence of stems and leaves, while in 2010, the plants were sparser and with a greater incidence of inflorescences compared to other plant components. On this note, regarding to the determination of spike yield, analysis of variance and multivariate analysis (PCA) highlighted the considerable importance of several biometric properties, among which number of stems, number of branches and ISP spike length and, in particular, ISS spike length. The accessions which maintained or exceeded the averages for the field, above all in the drier year, were the ones with a longer ISS and ISP spike, demonstrating this as a production adaptation strategy to adverse environmental conditions. From an agronomic point of view, PR1 was found to be worth of note. Accessions SS7 and PR4 obtained interesting results only in the first year, as they were found to be highly adversely affected by environmental conditions in the second year. The remaining accessions; however, were consistent with the average for the field. Relative to the essential oil content, all the accessions produced high EO content; the Messina and Palermo accessions being of particular note. The accessions with the best EO yield performance per hectare were the Messina accessions in both years; the Agrigento accessions and PR1 in 2009; and PR1 in 2010. All the accessions in the study were “linalyl acetate” chemotype (range 36.00–42.60%). The chemical composition did not vary between the two types of inflorescence, ISP and ISS. The different biometric and production properties of the accessions in the study could be of use for the selection of biotypes for future use. In conclusion, the results show, in addition to good adaptability to the environment, good potential for introduction into Mediterranean cropping systems, fostering the expansion of medicinal and aromatic crops.

Author Contributions

Conceptualization, T.T. and S.L.B.; methodology, T.T. and S.L.B.; software, T.T. and G.V.; validation, C.L., G.I. and M.L.; formal analysis, T.T., M.L., G.V. and G.I.; investigation, G.V., M.L., S.L.B. and C.L.; resources, T.T. and S.L.B.; data curation, G.I., M.L., G.V. and C.L.; writing—original draft preparation, G.I., M.L., G.V. and CL.; writing—review and editing, M.L. and G.V.; visualization, G.I., M.L. and C.L.; supervision, T.T. and S.L.B.; project administration, C.L.; funding acquisition, C.L. All authors have read and agreed to the published version of the manuscript.

Funding

This research was funded by the Sicilian Regional Ministry of Agriculture and Food Resources (Italy), project “Environmental and plant resources in the Mediterranean: study, valorisation and defence”, grant number 2309/2005.

Acknowledgments

The authors would like to thank Giuseppe Ruberto, from Istituto di Chimica Biomolecolare (CN) of Catania (Italy), for his contribution in the chemical analyses of the EOs. A special thanks goes to Lucie Branwen Hornsby for her linguistic assistance.

Conflicts of Interest

The authors declare no conflict of interest. The funders had no role in the design of the study; in the collection, analyses, or interpretation of data; in the writing of the manuscript, or in the decision to publish the results.

References

  1. Kumar, R.; Kaundal, M.; Sharma, S.; Thakur, M.; Kumar, N.; Kaur, T.; Vyas, D.; Kumar, S. Effect of elevated [CO2] and temperature on growth, physiology and essential oil composition of Salvia sclarea L. in the western Himalayas. J. Appl. Res. Med. Aroma. 2017, 6, 22–30. [Google Scholar] [CrossRef]
  2. Pignatti, S. Flora d’Italia; Edagricole: Bologna, Italy, 2003. [Google Scholar]
  3. Lojacono-Pojero, M. Flora Sicula o descrizione delle piante spontanee o indigenate in Sicilia. In Monocotyledones-Cryptogamae Vasculares—Scuola Tip; Boccone del Povero: Palermo, Sicily, Italy, 2013; Volume 3, pp. 483–495. [Google Scholar]
  4. Lubbea, A.; Verpoorte, R. Cultivation of medicinal and aromatic plants for speciality industrial materials. Ind. Crop. Prod. 2011, 34, 785–801. [Google Scholar] [CrossRef]
  5. Cai, J.; Lin, P.; Zhu, X.; Su, Q. Comparative analysis of clary sage (S. sclarea L.) oil volatiles by GC-FTIR and GC-MS. Food Chem. 2006, 99, 401–407. [Google Scholar] [CrossRef]
  6. Carrubba, A.; Torre, R.; Piccaglia, R.; Marotti, M. Characterization pf an Italian biotype of clary sage (Salvia sclarea L) grown in semi-arid Mediterranean environmenr. Flavour Fragr. J. 2002, 17, 191–194. [Google Scholar] [CrossRef]
  7. Lawrence, B.M. Progress in essential oils. Clary sage oil. Perfum. Flavorist 1986, 11, 111. [Google Scholar]
  8. Yaseen, M.; Singh, M.; Ram, D.; Singh, K. Production potential, nitrogen use efficiency and economics of clary sage (Salvia sclarea L.) varieties as influenced by nitrogen levels under different locations. Ind. Crop. Prod. 2014, 54, 86–91. [Google Scholar] [CrossRef]
  9. Fakir, H.; Korkmaz, M.; Güller, B. Medicinal plant diversity of western Mediterranean region in Turkey. J. Appl. Biol. Sci. 2009, 3, 30–40. [Google Scholar]
  10. Özdemir, E.; Alpınar, K. An ethnobotanical survey of medicinal plants in western part of central Taurus Mountains, Aladaglar (Nigde–Turkey). J. Ethnopharmacol. 2015, 166, 53–65. [Google Scholar] [CrossRef]
  11. Peana, A.T.; Moretti, M.D.; Juliano, C. Chemical composition and antimicrobial action of the essential oils of Salvia desoleana and S. Sclarea. Planta Med. 1999, 65, 752–754. [Google Scholar] [CrossRef]
  12. Pitarokili, D.; Couladis, M.; Petsikos-Panayotarou, N.; Tzakou, O. Composition and antifungal activity on soil-borne pathogens of the essential oil of Salvia sclarea from Greece. J. Agric. Food Chem. 2002, 50, 6688–6691. [Google Scholar] [CrossRef]
  13. Gülçin, I. Evaluation of the antioxidant and antimicrobial activities of clary sage (Salvia sclarea L.). Turk. J. Agric. For. 2004, 28, 25–33. [Google Scholar]
  14. Fraternale, D.; Giamperi, L.; Bucchini, A.; Ricci, D.; Epifano, F.; Genovese, S.; Curini, M. Composition and antifungal activity of essential oil of Salvia sclarea from Italy. Chem. Nat. Comp. 2005, 41, 604–606. [Google Scholar] [CrossRef]
  15. Georgiev, E.; Stoyanova, A. A Guide for the Specialist in Aromatic Industry; UFT Academic Publishing House: Plovdiv, Bulgaria, 2006. [Google Scholar]
  16. Jirovetz, L.; Buchbauer, G.; Denkova, Z.; Slavchev, A.; Stoyanova, A.; Schmidt, E. Chemical composition, antimicrobial activities and odor descriptions of various Salvia sp. and Thuja sp. essential oils. Nutrition 2006, 90, 152–159. [Google Scholar]
  17. Jirovetz, L.; Wlcek, K.; Buchbauer, G.; Gochev, V.; Girova, T.; Stoyanova, A.; Schmidt, E.; Geissler, M. Antifungal activities of essential oils of Salvia lavandulifolia, Salvia officinalis and Salvia sclarea against various pathogenic Candida species. J. Essent. Oil-Bear. Plants 2007, 10, 430–439. [Google Scholar] [CrossRef]
  18. Kuźma, L.; Kalemba, D.; Róźalski, M.; Róźalski, F.; Więckowaska-Szakiel, M.; Krajewska, U.; Wysokińska, H. Chemical composition and biological activities of essential oil from Salvia sclarea plants regenerated in vitro. Molecules 2009, 14, 1438–1447. [Google Scholar] [CrossRef] [Green Version]
  19. Geun, H.S.; Hyun, S.S.; Pill-Joo, K.; Hean, K.M.; Ki, H.L.; Insop, S.; Suk, S.M. Antidepressant-like effect of Salvia sclarea is explained by modulation of dopamine activities in rats. J. Ethnopharmacol. 2010, 130, 187–190. [Google Scholar] [CrossRef]
  20. Kostić, M.; Kitić, D.; Petrović, M.B.; Jevtović-Stoimenov, T.; Jović, M.; Petrović, A.; Živanović, S. Anti-inflammatory effect of the Salvia sclarea L. ethanolic extract on lipopolysaccharide-induced periodontitis in rats. J. Ethnopharmacol. 2017, 199, 2–59. [Google Scholar] [CrossRef]
  21. Hao, D.C.; Chen, S.L.; Osbourn, A.; Kontogianni, V.G.; Liu, L.W.; Jordán, M.J. Temporal transcriptome changes induced by methyl jasmonate in Salvia sclarea. Gene 2015, 558, 41–53. [Google Scholar] [CrossRef]
  22. Kuźma, Ł.; Różalski, M.; Walencka, E.; Różalska, B.; Wysokińska, H. Antimicrobial activity of diterpenoids from hairy roots of Salvia sclarea L.: Salvipisone as a potential anti-biofilm agent active against antibiotic resistant Staphylococci. Phytomedicine 2007, 14, 31–35. [Google Scholar] [CrossRef]
  23. Tuttolomondo, T.; Leto, C.; Leone, R.; Licata, M.; Virga, G.; Ruberto, G.; Napoli, E.M.; La Bella, S. Essential oil characteristics of wild Sicilian oregano populations in relation to environmental conditions. J. Essent. Oil Res. 2014, 26, 210–220. [Google Scholar] [CrossRef]
  24. Tuttolomondo, T.; Dugo, G.; Leto, C.; Cicero, N.; Tropea, A.; Virga, G.; Leone, R.; Licata, M.; La Bella, S. Agronomical and chemical characterisation of Thymbra capitata (L.) Cav. biotypes from Sicily, Italy. Nat. Prod. Res. 2015, 29, 1289–1299. [Google Scholar] [CrossRef] [PubMed]
  25. Militello, M.; Carrubba, A.; Blázquez, M.A. Artemisia arborescens L.: Essential oil composition and effects of plant growth stage in some genotypes from Sicily. J. Essent. Oil Res. 2012, 24, 229–235. [Google Scholar] [CrossRef]
  26. Napoli, E.M.; Siracusa, L.; Saija, A.; Speciale, A.; Trombetta, D.; Tuttolomondo, T.; La Bella, S.; Licata, M.; Virga, G.; Leone, R.; et al. Wild Sicilian rosemary: Phytochemical and morphological screening and antioxidant activity evaluation of extracts and essential oils. Chem. Biodivers. 2015, 12, 1075–1094. [Google Scholar] [CrossRef] [PubMed]
  27. Saija, A.; Speciale, A.; Trombetta, D.; Leto, C.; Tuttolomondo, T.; La Bella, S.; Licata, M.; Virga, G.; Bonsangue, G.; Gennaro, M.C.; et al. Phytochemical, ecological and antioxidant evaluation of wild Sicilian thyme: Thymbra capitata (L.) Cav. Chem. Biodivers. 2016, 13, 1641–1655. [Google Scholar] [CrossRef]
  28. Tuttolomondo, T.; Dugo, G.; Ruberto, G.; Leto, C.; Napoli, E.M.; Potortì, A.G.; Fede, M.R.; Virga, G.; Leone, R.; D’Anna, E.; et al. Agronomical evaluation of Sicilian biotypes of Lavandula stoechas L. spp. Stoechas and analysis of the essential oils. J. Essent. Oil Res. 2015, 27, 115–124. [Google Scholar] [CrossRef]
  29. Yuce, E.; Yildirim, N.; Yildirim, N.C.; Paksoy, M.Y.; Bagci, E. Essential oil composition, antioxidant and antifungal activities of Salvia sclarea L. from Munzur Valley in Tunceli, Turkey. Cell. Mol. Biol. 2014, 60, 1–5. [Google Scholar] [CrossRef] [PubMed]
  30. Saeidnia, S.; Gohari, A.R.; Haddadi, A.; Amin, G.; Nikan, M.; Hadjiakhoondi, A. Presence of monoterpene synthase in four Labiatae species and solid-phase microextraction–gas chromatography–mass spectroscopy analysis of their aroma profiles. Pharmacognosy Res. 2014, 6, 138–142. [Google Scholar] [CrossRef] [Green Version]
  31. Pesic, P.Z.; Bankovi, V.M. Investigation on the essential oil of cultivated Salvia sclarea L. Flavour Fragr. J. 2003, 18, 228–230. [Google Scholar] [CrossRef]
  32. Ohloff, G. Riechstoffe und Geruchssinn: Die molekulare Welt der Düfte; Springer: Berlin/Heidelberg, Germany; New York, NY, USA, 1990; pp. 208–214. [Google Scholar]
  33. Moulines, J.; Bats, J.P.; Lamidey, A.M.; Da Silva, N. About a practical synthesis of Ambrox from sclareol: A new preparation of a ketone key intermediate and a close look at its Baeyer-Villiger oxidation. Helv. Chim. Acta 2004, 87, 2695–2705. [Google Scholar] [CrossRef]
  34. Farkas, P.; Holla, M.; Jozef, T.; Mellen, S. Composition of the essential oils from the flowers and leaves of Salvia sclarea L. (Lamiaceae) cultivated in Slovak Republic. J. Essent. Oil Res. 2005, 17, 141–144. [Google Scholar] [CrossRef]
  35. Schmiderer, C.; Grassi, P.; Novak, J.; Weber, M.; Franz, C. Diversity of essential oil glands of clary sage (Salvia sclarea, L., Lamiaceae). Plant Biol. 2008, 10, 433–440. [Google Scholar] [CrossRef] [PubMed]
  36. Mossi, A.J.; Cansian, R.L.; Paroul, N.; Toniazzo, G.; Oliveira, J.V.; Pierozan, M.K.; Pauletti, G.; Rota, L.; Santos, A.C.A.; Serafini, L.A. Morphological characterization and agronomical parameters of different species of Salvia sp. (Lamiaceae). Braz. J. Biol. 2011, 71, 121–129. [Google Scholar] [CrossRef] [PubMed]
  37. Yaseen, M.; Kumar, B.; Ram, D.; Singh, M.; Anand, S.; Yadav, H.K.; Samad, A. Agro morphological, chemical and genetic variability studies for yield assessment in clary sage (Salvia sclarea L.). Ind. Crop. Prod. 2015, 77, 640–647. [Google Scholar] [CrossRef]
  38. Alquezar, J.B. Investigación y Experimentación de Plantas Aromàticas e Medicinalesen Aragón; Cultivo, Trasformación y Analìtica, Espanha: Governo de Aragón, Zaragoza, Spain, 2003; p. 262. [Google Scholar]
  39. Nist, ‘National Institute of Standard and Technology’; Mass Spectral Library: Gaithersburg, MD, USA, 1998.
  40. Adam, R.M. Identification of Essential Oil Components by Gas Chromatography/Mass Spectrometry, 4th ed.; Allured Publisghing Corporation: Carol Stream, IL, USA, 2007. [Google Scholar]
  41. Lee, J.; Kaltsikes, P.J. Multivariate statistical analysis of grain yield and agronomic characters in durum wheat. Theor. Appl. Genet. 1973, 43, 226–231. [Google Scholar] [CrossRef]
  42. Harper, H.H.; David, A.T.; Ryan, P.D. Past: Paleontological Statistics Software Package for Education and Data Analysis. Palaeontol. Electron. 2001, 4, 9. [Google Scholar]
  43. Catizone, P.; Marotti, M.; Toderi, G.; Tetenyi, P. Coltivazione Delle Piante Medicinali e Aromatiche; Patron: Bologna, Italy, 1986. [Google Scholar]
  44. Carrubba, A.; Militello, M. Nonchemical weeding of medicinal and aromatic plants. Agron. Sustain. Dev. 2013, 33, 551–561. [Google Scholar] [CrossRef]
  45. Quer, P.F. Plantas Medicinales: El Dioscórides Rinovado, 1st ed.; Penìnsula: Barcelona, Spain, 1999. [Google Scholar]
  46. Rajabi, Z.; Ebrahimi, M.; Farajpour, M.; Mirza, M.; Ramshini, H. Compositions and yield variation of essential oils among and within nine Salvia species from various areas of Iran. Ind. Crop. Prod. 2014, 61, 233–239. [Google Scholar] [CrossRef]
Figure 1. Sampling sites of clary sage in Sicily. Abbreviations of the provinces of origin: AG = Agrigento; ME = Messina; PA = Palermo.
Agronomy 10 01114 g001
Figure 2. Plants of clary sage at full flowering stage.
Agronomy 10 01114 g002
Figure 3. Orleans (Palermo, PA). Rainfall and temperature trends during the test period. Graph (a) refers to 2008, graph (b) refers to 2009 and graph (c) refers to 2010.
Agronomy 10 01114 g003aAgronomy 10 01114 g003b
Figure 4. Loading plot of the factor weights pertaining to the main two Principal Component. In the graph, black points refer to clary sage accessions cultivated in the first year while red points refer to accessions cultivated in the second year.
Agronomy 10 01114 g004
Figure 5. Clustering of the accessions on the score plot for the main two principal components. In the graph, black points refer to clary sage accessions cultivated in the first year while red points refer to accessions cultivated in the second year.
Agronomy 10 01114 g005
Table 1. List of accessions in the test.
AccessionsProvenance InitialsProvince
SS4
SS7SSAG
SS9
PR1
PR5PRPA
PR4
AF2
AF3AFME
AF8
Table 2. Orleans (Palermo, PA). Yearly averages for biometric and production parameters.
YearPlant Height (cm)Plant Fresh Weight (g)Plant Dry Weight (g)Floral Spike Dry Weight (g)Leaf Dry Weight (g)Stem Dry Weight (g)
2009183.86 **1190.41 **412.08 **142.92 **95.33 **173.83 **
2010142.97 **886.21 **193.08 **81.68 **39.56 **71.42 **
YearBranches
Plant−1 (no.)
Stems
Plant−1 (no.)
Spike Length
(cm)
ISP Spike Length (cm)ISS Spike Length (cm)
20098.83 **3.07 **49.34 **57.83 **46.41 **
201015.77 **5.44 **42.59 **58.36 **50.76 **
** = significant at p ≤ 0.01.
Table 3. Percentage distribution of biomass components (d.m.).
YearFloral Spike (%)Leaves (%)Stems (%)
200935 **23 **42 **
201043 **20 **37 **
** = significant at p ≤ 0.01.
Table 4. Year averages for floral spike and EO yields.
YearSpike Yield (Mg ha−1)Essential Oil Content (% v/w)Essential Oil Yield (kg ha−1)
20092.84 **0.92 **23.50 **
20101.60 **1.00 **14.40 **
** = significant at p ≤ 0.01.
Table 5. Average annual production parameters–floral spike principal stem (ISP) and secondary stem (ISS).
YearISP Spike Length (cm)Essential Oil Yield % ISPISS Spike Length (cm)EO % Yield ISS
200957.83 **0.81 **46.41 **0.98 **
201058.36 **0.88 **50.76 **1.12 **
** = significant at p ≤ 0.01.
Table 6. Mean values of biometric and production parameters of the accessions over the years.
AccessionSYEOPEOYPHPFWPDWFSDWLDWSDWNBNSSL
SS43.21 a0.71 f18.41 bc145.05 b1189.79 d423.92 b163.09 a80.28 b180.54 b4.38 bc13.52 b48.45 c
SS72.60 ab0.65 g14.71 c137.91 e953.09 g320.45 e127.65 b57.49 e135.31 c3.85 cd13.75 b43.58 f
SS92.52 abc0.69 fg14.85 c143.02 c1198.35 c323.82 c123.70 d71.86 c128.27 e4.63 b14.53 a46.27 d
PR12.13 bcd0.77 e13.95 c148.12 a976.27 e254.24 g105.82 f59.28 d89.14 g4.38 bc8.02 e53.77 a
PR51.52 d0.4 d12.55 c132.31 f579.31 i174.38 i78.38 i27.98 g65.52 i3.88 bcd9.64 d45.18 e
PR41.83 cd1.00 c15.65 c139.12 d750.98 h214.91 h90.87 g40.31 f83.74 h3.38 d11.77 c50.49 b
AF22.53 abc1.25 b28.05 a143.51 c1523.66 a429.85 a125.85 c119.10 a184.91 a6.00 a11.66 c40.94 g
AF32.24 bcd1.28 b25.1 ab139.60 d1217.88 b322.43 d111.93 e80.08 b130.42 d3.75 cd13.89 ab43.56 f
AF81.63 d1.36 a19.45 bc130.52 g955.51 f259.25 f83.45 h72.48 c103.32 f4.13 bcd14.11 ab41.54 g
AccessionISPLISPEOPISSLISSEOP
SS459.01 d0.53 f52.81 a0.87 d
SS755.75 f0.61 e52.54 a0.69 f
SS960.11 c0.61 e51.64 b0.77 e
PR165.13 a0.78 d43.12 g0.75 e
PR558.12 e1.05 b50.19 c0.83 d
5PR461.75 b1.12 a49.10 d0.88 d
AF253.88 g0.88 c45.8 f1.61 b
AF356.38 f1.02 b45.25 f1.53 c
AF853.21 h1.03 b46.84 e1.68 a
SY = spike yield; EOP = essential oil percentage; EOY = essential oil yield; PH = plant height; PFW = plant fresh weight; PDW = plant dry weight; FSDW = floral spike dry weight; LDW = leaf dry weight; SDW = stem dry weight; NB = no. branches; NS = no. stems; SL = spike length; ISPL = ISPL spike length; ISPEOP = ISP essential oil percentage content; ISSL = ISS spike length; ISSEOP = ISS essential oil percentage content. Means followed by the same letter are not significantly different for p ≤ 0.05 according to Test of Tukey.
Table 7. (a) Mean values of biometric and productive parameters of clary sage accessions during 2009 and 2010. (b) Mean values of biometric and productive parameters of clary sage accessions during 2009 and 2010.
(a)
2009
AccessionSYEOPEOYPHPFWPDWFSDWLDWSDWNBNSSL
SS44.81 a0.58 c24.81 bc151.50 a1604.85 c653.01 a244.51 a126.51 282.01a12.01 a3.51 bc54.48 b
SS74.20 ab0.61 c23.10 bc140.75 c1327.31 e526.25 c207.25 b91.01 f228.01 c12.51 a2.95 bcd51.13 d
SS93.42 b0.62 c18.81 bcd141.52 bc1623.20 b462.75 d167.25 d110.25 d185.25 d9.53 b3.25 bc52.94 c
PR11.40 c0.86 b10.81 d136.50 d605.67 h189.75 i72.01 i38.01 h79.75 h3.75 g2.02 d52.74 c
PR51.61 c0.89 b12.71 cs124.51 f555.56 i198.51 h82.25 h37.51 h78.75 h6.75 f3.52 bc45.95 e
PR42.43 bc0.91 b19.52 bc142.00 b828.08 g 285.25 g115.25 f50.25 g119.75 g9.75 bc2.02 d58.69 a
AF23.41 b1.26 a38.41 a136.51 d1734.32 a622.51 b173.75 c178.75 a270.01 b8.02 d4.52 a42.91 f
AF32.63 bc1.25 a29.11 ab127.25 f1386.63 d414.75 e128.75 e118.75 c167.25 e9.01 bcd2.75 cd42.62 f
AF81.82 c1.30 a21.10 bcd131.25 e1048.13 f356.01 f95.25 g107.01 e153.75 f8.25 d3.25 c42.67 f
2010
AccessionSYEOPEOYPHPFWPDWFSDWLDWSDWNBNSSL
SS41.62 ab0.84 d12.01 ab139.01 e774.75 e194.81 d81.67 c34.06 e79.07 d15.03 c5.25 cd42.42 c
SS71.02 bc0.69 e6.32 b135.01 g578.88 i114.64 i48.04 i23.98 g42.62 i15.01 cd4.75 d36.03 g
SS91.62 ab0.76 de10.91 ab144.51 d773.51 f184.89 e80.14 d33.47 e71.28 e19.55 a6.04 c39.60 df
PR12.81 a0.68 de17.11 ab159.75 a1346.88 a318.72 a139.64 a80.56 a98.52 b12.25 e6.75 ab54.80 a
PR51.40 b0.99 c12.40 ab140.02 e603.06 h150.25 g74.51 f18.46 h57.29 f12.53 e4.25 d44.41 b
5PR41.22 b1.09 b11.81 ab136.25 f673.88 g144.47 h66.48 h30.37 f47.72 h13.78 d4.75 d42.28 c
AF21.61 ab1.23 a17.72 ab150.51 c1313.02 b237.21 b77.94 e59.44 b99.82 a15.32 bc7.52 a38.95 d
AF31.83 ab1.31 a21.10 a152.01 b1049.13 c230.11 c95.11 b41.40 c93.59 c18.77 a4.75 d44.52 b
AF81.41 b1.41 a 17.82 ab129.75 h862.88 d162.51 f71.65 g37.96 d52.89 g19.75 a5.02 cd40.40 f
(b)
2009
AccessionISPLISPEOPISSLISSEOP
SS464.25 b0.51 b60.06 a0.65 c
SS760.25 c0.54 b58.17 b0.68 c
SS963.75 b0.53 b51.78 c0.71 c
PR157.52 d0.92 a28.83 h0.79 b
PR553.75 e0.94 a44.38 f0.83 b
PR466.25 a0.98 a45.33 ef0.83 b
AF252.75 e0.92 a45.92 e1.59 a
AF350.55 f0.96 a35.69 g1.53 a
AF851.57 f0.99 a47.54 d1.61 a
2010
AccessionISPLISPEOPISSLISSEOP
SS453.75 d0.56 e45.54 f1.09 g
SS751.25 e0.67 d46.92 e0.71 f
SS956.25 c0.68 d51.52 d0.84 e
PR172.75 a0.64 de57.42 a0.72 f
PR562.25 b1.15 b56.01 b0.83 e
PR457.25 c1.25 a52.86 c0.94 d
AF255.07 d0.83 c45.68 efg1.63 b
AF362.25 b1.08 b54.81 b1.53 c
AF854.54 d1.07 b46.13 efg1.76 a
SY = spike yield; EOP = essential oil percentage; EOY = essential oil yield; PH = plant height; PFW = plant fresh weight; PDW = plant dry weight; FSDW = floral spike. dry weight; LDW = leaf dry weight; SDW = stem dry weight; NB = no. branches; NS = no. stems; SL = spike length. Means followed by the same letter are not significantly different for p ≤ 0.05 according to Test of Tukey. ISPL = ISPL spike length; ISPEOP = ISP essential oil percentage content; ISSL = ISS spike length; ISSEOP = ISS essential oil percentage content. Means followed by the same letter are not significantly different for p ≤ 0.05 according to Test of Tukey.
Table 8. Correlation matrix of the main biometric and production parameters.
2009
CharactersSYEOPEOYPHPFWPDWFSDWLDWSDWNBNSSLISPLISSL
2010SY −0.5120.5350.735 *0.807 **0.910 **0.998 **0.600 *0.904 **0.843 **0.3980.2590.4640.800 **
EOP−0.234 0.424−0.654−0.057−0.152−0.4930.298−0.143−0.4070.192−0.759 *−0.801 **−0.523
EOY0.5450.673 * 0.1210.792 *0.787 *0.5450.912 **0.786 *0.4120.616−0.433−0.2670.253
PH0.838 **−0.2050.507 0.4530.5720.731 *0.2220.5830.556−0.0430.736 *0.830 **0.596
PFW0.788 *0.1740.749 *0.803 * 0.936 **0.812 **0.915 **0.912 **0.6040.596−0.1480.0920.536
PDW0.951 **−0.0780.6630.899 **0.918 ** 0.924 **0.871 **0.997 **0.702 *0.630−0.0730.1540.681 *
FSDW0.993 **−0.1870.5760.825 **0.745 *0.935 ** 0.6220.919 **0.827 **0.4320.2990.4360.802 **
LDW0.861 **−0.0540.5860.778 *0.946 **0.929 **0.823 ** 0.862 **0.3950.736 *−0.442−0.2990.364
SDW0.768 *0.0420.678 *0.883 **0.882 **0.909 **0.748 *0.799 * 0.695 *0.629−0.0700.1500.685 *
NB−0.2120.4520.273−0.266−0.028−0.146−0.220−0.168−0.012 0.1970.2520.4540.861 **
NS0.556−0.1240.3150.6340.815 **0.707 *0.4810.811 **0.713 *−0.054 −0.556−0.3440.433
SL0.884 **−0.2040.4480.6610.5180.57 *0.921 **0.6410.503−0.4520.197 0.956 **0.244
ISPL0.854 **−0.1740.4670.741 *0.5300.737 *0.889 **0.6150.507−0.4110.2070.954 ** 0.476
ISSL0.520−0.1850.2160.5310.1280.3660.5860.1930.185−0.351−0.1490.740 *0.859 **
SY = spike yield; EOP = essential oil percentage; EOY = essential oil yield; PH = plant height; PFW = plant fresh weight; PDW = plant dry weight; FSDW = floral spike dry weight; LDW = leaf dry weight; SDW = stem dry weight; NB = no. branches; NS = no. stems; SL = spike length; ISPL = ISP spike length; ISSL = ISS spike length. **: correlation is significant at the 0.01 level. *: correlation is significant at the 0.05 level.
Table 9. Variance in principal components and cumulative contribution to total variation.
PC1PC2PC3
Eigenvalues689130302171
% Variance49,21821,64215,505
% Cumulative variance49,21870,86086,365
Table 10. Factor weights of properties on the two PC.
PC1PC2
Spike yield0.9720.110
Essential oil percentage−0.278−0.519
Essential oil yield0.781−0.390
Plant height0.3130.822
Plant fresh weight0.879−0.023
Plant dry weight0.977−0.153
Floral spike dry weight0.9730.104
Leaf dry weight0.873−0.356
Stem dry weight0.955−0.203
No. branches−0.3540.527
No. stems−0.2950.491
Spike length0.5910.290
ISP spike length0.3800.766
ISS spike length0.3290.727
Table 11. Chemical compound main classes of clary sage essential oil.
ISPISS
SSPRAFSSPRAF
Class/Compoundmsdmsdmsdmsdmsdmsd
Monoterpene hydrocarbons5.140.575.160.124.421.065.200.116.060.695.300.24
Oxygenated monoterpenes77.875.3079.352.1367.3011.4579.223.8878.102.5878.543.33
Sesquiterpenes11.183.9011.271.5416.615.929.702.1210.771.8810.942.09
Diterpenes4.061.203.320.409.235.343.901.003.871.203.811.00
m = mean; sd = standard deviation.
Table 12. Chemical composition of clary sage essential oils.
ISPISS
Peak aRI Lit. bRI Exp. cClass/CompoundSSPRAFSSPRAF
msdmsdmsdmsdmsdmsd
Monoterpene Hydrocarbons
6991994ß-Mircene1.390.421.720.091.670.261.740.162.100.321.730.03
1010501041trans-Ocimene1.070.251.350.081.280.101.330.071.590.091.320.04
Oxygenates Monoterpenes
1410971094Linalool21.423.5023.790.3724.403.2423.431.2227.312.6323.591.92
2211891200a-terpineol4.832.126.400.236.381.496.690.747.901.206.580.20
2511301240Nerol1.070.361.270.041.230.231.320.101.520.211.280.01
2612571271Lynalin-acetate35.804.7842.462.6340.852.1141.711.3035.462.1842.422.79
3413621369Neryl acetate1.430.331.620.091.530.181.660.111.810.181.560.08
3613811389Geranyl acetate2.260.692.760.132.620.423.020.233.320.332.850.07
sesquiterpenes
4114191432b-caryophyllene3.281.732.030.142.391.042.030.641.970.532.070.28
4914851494Germacrene D5.081.094.550.913.951.413.760.494.420.903.270.92
5014961499Valencene3.171.201.930.431.880.631.940.311.600.261.720.51
Diterpenes
7622232168Sclareol7.764.482.710.343.290.953.250.963.151.073.140.87
m = mean; sd = standard deviation. a the numbering refers to elution order, and values (relative peak area percent) represent averages of 3 determinations and standard deviation; b Literature Retention Index; c Experimental Retention Index relative to standard mixture of n-alkanes on SPB-5 column.

